#data-science-and-ml
1 messages · Page 42 of 1
 wary breach
Why are there no datapoints after 2020?
 strong sedge
its way to "non linear"
I dont know the exact term for this
strong sedge
wary breach
Why are there no datapoints after 2020?
this is all I got from my trainer 🤷♂️
 cunning flame
um
wary breach
and what does he want you to predict?
cunning flame
mabye your teacher gave you that chaotic data to just see what you would do
strong sedge
this is only a fraction of the data btw
the full data is a csv of all transactions
the visual is only of the sales of a particular item
strong sedge
cunning flame
mabye your teacher gave you that chaotic data to just see what you would do
very likely 😅
wary breach
wary breach
and what does he want you to predict?
^
cunning flame
welp i would just do a linear regression and yolo with it
cunning flame
wary breach
^
prices?
wary breach
that's way too vague
For individual items? For everything? Over what period of time? etc
strong sedge
wary breach
and what does he want you to predict?
just sales forecasting
he talked about forecasting sales for potentially pre stocking on items
strong sedge
cunning flame
prices?
this are not prices
these are quantities of items sold
wary breach
What does another item look like?
strong sedge
    date    customer_id    item_id    quantity    price_per_unit    amount    Vrh_No
0    2019-01-04    customer1    Item_1    200.0    20.0    4000.0    1
2    2019-01-04    customer1    Item_3    12.0    60.0    720.0    1
3    2019-01-04    customer1    Item_3    15.0    35.0    525.0    1
4    2019-01-04    customer1    Item_3    25.0    25.0    625.0    1
23    2019-01-04    customer7    Item_7    240.0    22.0    5280.0    10
...    ...    ...    ...    ...    ...    ...    ...
1747    2021-12-01    customer133    Item_27    59.0    55.0    3245.0    686
1748    2021-12-01    customer133    Item_18    204.0    70.0    14280.0    686
1749    2021-12-01    customer133    Item_6    1200.0    16.5    19800.0    686
1741    2021-12-01    customer61    Item_3    654.0    23.0    15042.0    683
1750    2021-12-01    customer133    Item_2    1200.0    21.0    25200.0    686
sample of the data
this sample is the quantity of item_1 sold
cunning flame
the best regression for this kind of stuff that i know is random forests
wary breach
Do you know what the item is in item id's? You could try to group together items that sell in a similar amount during certain times of the year
strong sedge
strong sedge
this sample is the quantity of item_1 sold
date vs quantity
wary breach
and see what customers are likely to buy an item when
strong sedge
wary breach
Do you know what the item is in item id's? You could try to group together items...
umm I dont know what the items
but what you said makes sense
strong sedge
how would I do this
can you link me some article ?
wary breach
This is a similar problem. You could see what other people have coded perhaps?
strong sedge
wary breach
This is a similar problem. You could see what other people have coded perhaps?
yeah, thanks for your advice :)
ill take a look
wary breach
np 🙂
it might be tough to get an accurate forecast though since there isn't much data
more features probably would help
strong sedge
yeah 😅
wary breach
oh well maybe like @cunning flame said he's just seeing what you'll do xD
cunning flame
btw
lebrawn
{
"results": [
{
"objectId": "lSxg9sIUv9",
"Name": "Will",
"Gender": "male",
"createdAt": "2020-01-23T23:31:09.261Z",
"updatedAt": "2020-01-23T23:31:09.261Z"
},
{
"objectId": "Ypp4vpokki",
"Name": "James",
"Gender": "male",
"createdAt": "2020-01-23T23:31:09.241Z",
"updatedAt": "2020-01-23T23:31:09.241Z"
}
],
"count": 258000
}
i have this dict
do you know how i can acess different parts of it
cunning flame
wanna see the code?
cunning flame
ME TOO
BUT, I FOUND THIS HUGE AWESOME DATAFRAME BUT I CANT DOWNLOAD IT, I CAN ONLY IMPORT IT THIS WAY
caps cause angre
im using back4app
wary breach
that looks like a json format
cunning flame
it is but i cant download it
import json
import urllib
import requests
amount = 2
url = 'https://parseapi.back4app.com/classes/Complete_List_Names?count=1&limit=' + str(amount)
headers = {
    'X-Parse-Application-Id': 'zsSkPsDYTc2hmphLjjs9hz2Q3EXmnSxUyXnouj1I',
    'X-Parse-Master-Key': '4LuCXgPPXXO2sU5cXm6WwpwzaKyZpo3Wpj4G4xXK'
}
data = json.loads(requests.get(url, headers=headers).content.decode('utf-8'))
print(json.dumps(data, indent=2))
You can turn a json into a dataframe
cunning flame
H.. how?
cunning flame
...
wary breach
ya?
cunning flame
amount = 2
df = pd.read_json('https://parseapi.back4app.com/classes/Complete_List_Names?count=1&limit=' + str(amount))
print(df)
i did this right?
HTTPError: HTTP Error 401: Unauthorized
:d
wary breach
it's something with the way you're connecting to the website
basically saying you don't have permission to view
wary breach
it looks like for that website you need to create an account and generate an api key
who knows if it's free tho
wary breach
yea takes a while to find a good source
 spiral barn
Im trying to determine the sentiment of buisness articles and have attempted to use a variety of different modules but none of them seem to be very accurate in determining the sentiment of an article. Is there any that anyone can suggest that would be accurate.
 urban knoll
I just trained and saved my CNN model. I know I can use keras.load_model to import my model but I don`t know the method to actually use it on an image. is it, I've looked online but not really found a comprehensive resource that tells me how to use my trained model to figure out if my image has rain drops in it(as an example).
strong sedge
@cunning flame and @wary breach again thanks for your suggestion, I talked to my trainer, and she told me that I was right, the data is too chaotic, and we werent supposed to do regular sales forecasting, but rather demand forecasting
 molten hamlet
Looking for some dataset with outliers for training purposes
does not have to be big
uh, well found it 😂 https://www.kaggle.com/general/171508
Best 11 Datasets for Outlier Detection.
 dusty valve
urban knoll
I just trained and saved my CNN model. I know I can use `keras.load_model` to im...
dusty valve
urban knoll
I just trained and saved my CNN model. I know I can use `keras.load_model` to im...
Model.predict()
You need to put the encoded image array in a list before you pass it
For example
Model = keras.load_model("path")
Image = encode_image("path")
Prediction = Model.predict([Image])
What would be the best classification for names to gender
I used bayes classification but It wasn’t as accurate as needed(even though I have a database with 250 000 ) examples.
 odd meteor
cunning flame
I used bayes classification but It wasn’t as accurate as needed(even though I ha...
odd meteor
cunning flame
I used bayes classification but It wasn’t as accurate as needed(even though I ha...
You can try SVM and XGBoost, and then compare their performance with Naive Bayes
 crude galleon
Friends, can make such a moving thing in two-dimensional form in Python with matplotlib?

؟
Can make something like this? with matplotlib?
 hasty mountain
I'm kinda lost over Beam Search for Transformer.
The input has size (Batch, Sequence_length, d_model), right? While the output has size (Batch, Sequence_length, vocab_size), since the last layer is a feedforward followed by a softmax.
But then...what should I do when I want to extract a single word from the output? I know that I have to get the argmax from the softmax function, but then my output would be output = output.argmax(-1) and then its sizes would be (Batch, Sequence_length, 1). So, for each item in my sequence, I'd have a prediction, but I just want to predict the next word.
Should I just...get the last sequence item with its respective argmax?
 brave sand
Does anyone know how to train a detector on a custom image?
do I have to make a dataset?
 charred light
brave sand
Does anyone know how to train a detector on a custom image?
charred light
brave sand
Does anyone know how to train a detector on a custom image?
Yes. If you mean image recognition (e.g. CNN), you could use a pre-trained model (e.g. resnet) and then train the final layers on your own images.
brave sand
charred light
Yes. If you mean image recognition (e.g. CNN), you could use a pre-trained model...
I have to do image recognition on a live drone feed. I have 6 images which I need identify. How do I create a dataset for resnet and train the final layers?
charred light
brave sand
I have to do image recognition on a live drone feed. I have 6 images which I nee...
You mean 6 objects you need to identify? You would need a bare minimum of 100 images per object (See https://www.microfocus.com/documentation/idol/IDOL_12_0/MediaServer/Guides/html/English/Content/Training/ImageClass_ImageGuide.htm Although it's for MediaServer, it generally applies. Also see: https://datascience.stackexchange.com/questions/13181/how-many-images-per-class-are-sufficient-for-training-a-cnn), ideally in different angles. Keep in mind, the more images the better. You can also do augmentation to "create more" images.
Some resources to start: https://towardsdatascience.com/using-convolutional-neural-network-for-image-classification-5997bfd0ede4
https://towardsdatascience.com/transfer-learning-for-image-classification-using-tensorflow-71c359b56673
Side note: This is not a project that can really be completed in one afternoon.
brave sand
charred light
You mean 6 objects you need to identify? You would need a bare minimum of 100 im...
Thank you so much for all the links and advice. I am planning to do this over the course of many weeks, is that doable? I should first be collecting images and then worry about the code right? Also, should the image be from the drone's perspective or my perspective? As the drone is a couple hundred feet in the air. Could I take photos on my desk and use those? Also, should I do it in sunlight as the sunlight could affect the image quality? Sorry for the bombardment of questions.
charred light
brave sand
Thank you so much for all the links and advice. I am planning to do this over th...
Yes, collecting data (images) would be the first step. Few weeks is more than doable. (The reason I mention timeline is some users come on here expecting to do a week's work in a day because their assignment is due at midnight. )
- Depends on the use case, in your case I would assume it should be from the drone's perspective. I'm guessing you will be passing the drone's video feed as the input to detect the objects. In this case, it would be better to put a sample object on a open field or the environment the object will be in and record the drone video feed as it flies around the object (360 degree) at different heights. Then you could simply just split the video and have each frame or X num of frames as your dataset. Likewise, this would be very similar to object detection with a webcam (See this for a general idea of what I mean: https://youtu.be/yqkISICHH-U?t=2397)
- Photos on your desk wouldn't work as well if you are using drone's video footage. (See above.)
- Ideally, you would want images of the object in both direct sunlight, and on a cloudy day. (More applicable if the object in question reflects sunlight for a starburst effect.) Otherwise, image augmentation (gamma, see https://albumentations.ai/docs/introduction/image_augmentation/) would be sufficient.
hasty mountain
Can someone tell me how does the GPT-2 backpropagation works in the Unsupervised Learning phase? I can't find any definition on how it works, just generic explanations
Yes, I know the objective of the model is to predict the probability of certain output given certain input, but how to convert this to a loss function? CrossEntropyLoss(output, input)?
 novel python
guys, once trained, a RNN model should give different predictions based on the array passed to it, shouldn't it? I'm using model.predict after the model is trained but for every different array I pass the result is always the same as the one I had for the prediction of X_test.
charred light
novel python
guys, once trained, a RNN model should give different predictions based on the a...
Confirm your code is doing what you think it is. e.g. print out the array values of variables before it hits the model.predict. Also, if your model over fits or a specific feature is dominant, it could predict the same value (less likely).
brave sand
charred light
Yes, collecting data (images) would be the first step. Few weeks is more than do...
I’ll try to train a model with image augmentation first. Thanks!
urban knoll
dusty valve
You need to put the encoded image array in a list before you pass it
what library do I use to encode_image ?
 tranquil jasper
why do we do
from matplotlib import pyplot
?
what other thing matplotlib has?
 serene scaffold
tranquil jasper
why do we do
`from matplotlib import pyplot`
?
what other thing matplotlib has...
serene scaffold
tranquil jasper
why do we do
`from matplotlib import pyplot`
?
what other thing matplotlib has...
Pyplot often has everything one needs
Though maybe I misunderstood your question
tranquil jasper
serene scaffold
Though maybe I misunderstood your question
i mean what other stuff there is in matplotlib
 lapis sequoia
general question: everytime i want to start on a project for example, do i always want to create a new pip env? whats the consensus here?
serene scaffold
lapis sequoia
general question: everytime i want to start on a project for example, do i alway...
Do you mean a venv?
lapis sequoia
serene scaffold
Do you mean a venv?
yes sorry
 uncut orbit
I am working on the time series code from the "Hands on Machine Learning with Scikit-Learn Keras and Tensorflow." At this stage in the code, I'm trying to train an RNN to start predicting in larger steps.
np.random.seed(43)
series = generate_time_series(1, n_steps + 10)
X_new, Y_new = series[:, :n_steps], series[:, n_steps:]
X = X_new
for step_ahead in range(10):
    y_pred_one = model.predict(X[:, step_ahead:])[:, np.newaxis, :]
    X = np.concatenate((X, y_pred_one), axis=1)

Y_pred = X[:, n_steps:]
This is the code that I ran, but I ended up getting the error:
ValueError: all the input arrays must have same number of dimensions, but the array at index 0 has 3 dimension(s) and the array at index 1 has 2 dimension(s)
at the "X = np.concatenate((X, y_pred_one), axis=1)" line.
odd meteor
tranquil jasper
why do we do
`from matplotlib import pyplot`
?
what other thing matplotlib has...
Aside pyplot matplotlib has several other submodules. If you want to inspect this yourself, just locate the folder in your machine where the Matplotlib package is installed. You'll usually find it in the scripts or lib folder inside your Anaconda3 folder (if you're using anaconda).
Alternatively, for quick experimentation, check the official documentation (scroll down to the module segment)
lapis sequoia
import pandas as pd
from tensorflow.keras.layers import Dense,LSTM
from tensorflow.keras.models import Sequential
from sklearn.model_selection import train_test_split

df = pd.DataFrame(
{
"Xval":[1,2,3,4,5,6,7,8,9],
"Yval":[2,3,4,5,6,7,8,9,10]
}
)

Y=df[["Yval"]]

X=df.drop(columns=["Yval"])

model=Sequential()
model.add(Dense(input_shape=(1,),units=10, activation="relu"))
model.add(Dense(1, activation="relu"))

model.compile(optimizer="Adam",loss="mse", metrics="accuracy")

x_train,x_test,y_train,y_test= train_test_split(X,Y,test_size=0.25)

model.fit(x_train,y_train,epochs=20)

print(model.evaluate(x_test,y_test))
What the reason for bad prediction in this programme??
Only 1 features is there in this programme..
hasty mountain
Guys, if I were to make a Text2Speech model, I'd have to basically use an encoder for the text, and, for the Speech, I'd have to use a model that generates 2D arrays in order to generate a spectrogram, right?
So, my model can be a GAN, a Variational AutoEncoder or...maybe a Conditioned Diffusion model? As long as it's capable of receiving a sequence of word vectors and, based on that, generate a spectrogram, which, then, can be converted to waveform(.wav)?
hasty mountain
Oh, Waveglow is none of those models...it just receives a gaussian noise input, concatenates some of the target spectrograms and backpropagates based on log likelihood... 
 pulsar isle
Anyone who is experienced enough(and willing to) teach/help me to fine tune my tesseract?
dusty valve
urban knoll
what library do I use to `encode_image` ?
You said that you trained a model, which means you had to have encoded images. You could use that function or keras.util.load_image
 cyan sierra
Anyone familiar with NLP?
I have a bunch of job descriptions and would like to extract hard skills and education level from each of them. Any ideas? 🙂 Thank you very much.
serene scaffold
cyan sierra
Anyone familiar with NLP?
I have a bunch of job descriptions and would like to e...
the easiest way to extract education level would probably just be "if it has the word 'bachelors' or 'BS' or 'BA', then that's the education level". and likewise with higher (or lower) education levels. there's not very many of them.
For skills, you might look into NER.
cyan sierra
Thank you
 versed gulch
Hi,
Does anyone know how to fill holes in an image in Python similar to the fill holes method in skimage where if a black pixel is adjacent to 2 white pixels, then turn that black pixel value of 0 to white of 255?
lapis sequoia
is object oriented programming important to learn data science/machine learning?
lapis sequoia
cyan sierra
Anyone familiar with NLP?
I have a bunch of job descriptions and would like to e...
use chatgpt for this lol
cyan sierra
lapis sequoia
is object oriented programming important to learn data science/machine learning?
you too 🙂
 odd meteor
lapis sequoia
is object oriented programming important to learn data science/machine learning?
odd meteor
lapis sequoia
is object oriented programming important to learn data science/machine learning?
You can't go wrong by learning OOP. Aside using OOP to structure your code properly, when you get to Deep Learning; especially if you're using PyTorch as your DL framework, you'll still meet OOP there waiting for you in earnest.
 wooden sail
i would add that most big ML modules have a functional API as well, so it's not like you NEED it
many examples online will use it though, and it's always good to be familiar with a handful of programming paradigms
lapis sequoia
after pip installing a package, can i comment out the pip install or will python take care of it back-end, understanding that a certain package/module is already installed.
Note: you may need to restart the kernel to use updated packages.
novel python
Guys, I have a variety of linear predictions over the usage of mobile data of a variety of users. The final result is, of course, a number, but I also wanted to have as an output the probability of an user to be between a certain range of usage. For example, "What's the probability of this user use between 4GB and 5GB of data next month?" based on previous data. Not sure how to approach this. I thought about making different classes like "Between 0 and 1, Between 1 and 2, ..." and use softmax at the end, but not sure if that's the right or best approach. Thanks in advance!
urban knoll
dusty valve
You said that you trained a model, which means you had to have encoded images. Y...
I get an error when I do this: ```python
import tensorflow as tf
import cv2
import keras
from keras.models import load_model
size=224
model = tf.keras.models.load_model('/home/philip/QAME696/savedmodel/CNNModel')
image = cv2.imread("/home/philip/QAME696/rain.png")
resized=cv2.resize(image,(size,size))
prediction=model.predict([resized])
Check its architecture
prediction```
....... ValueError: Input 0 of layer sequential is incompatible with the layer: : expected min_ndim=4, found ndim=3. Full shape received: (32, 224, 3)```Is there anyone who can tell me about their experiences with machine learning?
I need to know before I start
serene scaffold
crude galleon
Is there anyone who can tell me about their experiences with machine learning?
what do you want to know about it?
crude galleon
All this is very important before starting and working with it
And what can be done with it
I researched a lot about it and got a little confused. I said maybe you can explain it clearly here
I only know to this extent that something similar to the learning mode can be simulated
Like a robot
or a program
Or an artificial intelligence
novel python
crude galleon
I only know to this extent that something similar to the learning mode can be si...
it's much easier to watch a youtube video/read articles online for that matter. Machine Learning can do a whole variety of things to be explained briefly in a discord paragraph. Machine Learning can go from predicting the value of a stock given past data to modifying images. If you are interested you are better off doing a short course and see what areas you are more likely to go for if that's the case.
crude galleon
novel python
it's much easier to watch a youtube video/read articles online for that matter. ...
I am more interested in combining it with robotics
And so intelligence
 twilit burrow
📣 Here are the Latest Blogs -
🚀 AI in Esports: Transforming Competitive Gaming
🚀 Revolutionize Your Agriculture with These Cutting-Edge AI Technologies
🚀 The Future of Food Waste Management is Here - Learn About AI-Driven Technologies
🚀 Unleashing the Power of ChatGPT: A Comprehensive Guide to the Working and Architecture
🚀 NLP for Non-Expert: How BERT, Transformers, and Auto Encoders are Changing the World
🕹Link - https://medium.com/@simranjeetsingh1497/introduction-7779068d279b
.
#LatestBlogs #Blogs #Medium #AnalyticsVidya #MachineLearning

Medium
Discover the future of Esports with AI! Learn how AI is revolutionizing competitive gaming and creating new revenue streams.
This article talks about how computer vision and AI in agriculture helps in increased crop yields and more sustainable farming practices.

By using AI, it's possible to optimize supply chain management, predict demand, and reduce food spoilage, resulting in food waste management.

Medium
Chatbots are computer programs designed to simulate conversation with human users, especially over the Internet. They can be integrated…

Medium
A brief overview of NLP and its importance along with Python Code examples of Text Analytics, Tensorflow models of Transformers and BERT.
crude galleon
twilit burrow
📣 Here are the Latest Blogs -
🚀 AI in Esports: Transforming Competitive Ga...
thanks man
realy thanks
twilit burrow
Follow and share
crude galleon
sure sure
crude galleon
twilit burrow
📣 Here are the Latest Blogs -
🚀 AI in Esports: Transforming Competitive Ga...
I am currently trying to learn about machine learning in w3school
But he said more about the charts (matplotlib)
I don't think it will be very useful for me who wants to combine robotics with machine learning
twilit burrow
crude galleon
I am currently trying to learn about machine learning in w3school
But he said mo...
Cool, so you have to learn python first
crude galleon
twilit burrow
Cool, so you have to learn python first
I know a lot
But I know it is not enough
Do you know where to learn machine learning completely?
Does not have a specific source to learn?
What w3scholl has to say about machine learning is very limited
 thin palm
hey guys, I have a data analyst interview with a focus on SQL experience, any tips and advice for the live technical interview? It'll be about an hour long.
 iron basalt
crude galleon
All this is very important before starting and working with it
And what can be d...
iron basalt
crude galleon
All this is very important before starting and working with it
And what can be d...
Where are you at in terms of mathematics education? Do you like mathematics? If you like mathematics and programming then ML may be for you. Robotics will require some physics too, but that also involves math, lots of math when taking into account both ML and robotics. But if you like math (and programming), it's great, you get to use a lot of it in creative ways. It also depends on how deep you want to get into ML and robotics. There is a lot of software already ready for use and using it is pretty straight forward with Python.
*Unless you are only doing simulation, robotics also requires a bunch of practical engineering / tinkering skills.
*You can focus on just the ML part of it and rely on simulation.
hasty mountain
Diffusion models show that even ML might include physics 
iron basalt
hasty mountain
Diffusion models show that even ML might include physics <:yert:8322775268091494...
Robotics is a whole different game. It often requires a bunch of biases and hard coded things built in, online learning, etc (if you want not just as robot that does a specific task but are trying to go towards this eventual goal of a general purpose robot). There are many other problems, such as energy efficiency being a big one. Currently most ML is using more and more energy. Robots have batteries, they are not just plugged in all the time. Sticking a big GPU or 2 on a robot uses way too much energy. Compare this to a human, which uses WAY less energy (like 1000x), and somehow manages to do more.
hasty mountain
hasty mountain
Diffusion models show that even ML might include physics <:yert:8322775268091494...
Also...does the "Diffusion" term have the same meaning as the diffusion of the particles or molecules in a medium?
hasty mountain
iron basalt
Robotics is a whole different game. It often requires a bunch of biases and hard...
Yeah, it seems better to train on simulations and when the model is properly optimized, use it on a proper hardware
iron basalt
hasty mountain
Yeah, it seems better to train on simulations and when the model is properly opt...
It's nice in theory, and can work to an extent, but it turns out that in practice reality is often too complicated (again if your goal is a general purpose robot). And coding all that into a really complicated simulation software is a ton of work, way more than any modern video game, and those already have like half billion dollar budgets with hundreds of people...
iron basalt
In short, some level of continual / online learning is required for it to adapt on the fly.
And to get started, it needs those hard coded things plus that offline learning.
Otherwise it will just destroy itself quickly. Robots easily break themselves.
In simulations now you will often find that the ML methods find strategies that involve a bunch of rapid twitching to get around.
hasty mountain
lol
iron basalt
That works in simulation, but in reality it breaks the robots. In other words, the robot needs some kind of idea of ""pain.""
hasty mountain
So that's why robots movements are usually slow
The engineers are just trying to prevent a disaster
iron basalt
Special purpose we can do, the more constrained the environment and possible actions the better.
It is for example clear from the vast difference in energy usage that the hardware is the wrong architecture (Von Neumann). There is work being done on this in several ways (e.g. neuromorphic processors), but it's still a while off probably. For now the best option is to somehow get stuff that runs on much smaller devices. Deep learning has its own sparsification approach to this, but it's not enough (hence why we don't use deep learning, nature says that's not it (but it still has value, so all because we don't do it does not mean you should not do it (we have our specific goals / problems (robotics)))). Also deep learning (specifically i.i.d. assumption) is not built for online learning (I explained why it's needed for problem domain).
Online learning is pretty weird, a lot of normal statistics and intuition does not work out.
hasty mountain
Damn... WaveGlow is so boring to reproduce. I guess I'll make my Text2Speech model using a GAN Diffusion Model...
I've never heard about Diffusion Models for audio, but probably because Stable Diffusion overshadowed any other use for diffusion models that isn't image generation using the Aesthetics image.
iron basalt
hasty mountain
Also...does the "Diffusion" term have the same meaning as the diffusion of the p...
It's inspired by https://en.wikipedia.org/wiki/Non-equilibrium_thermodynamics models.
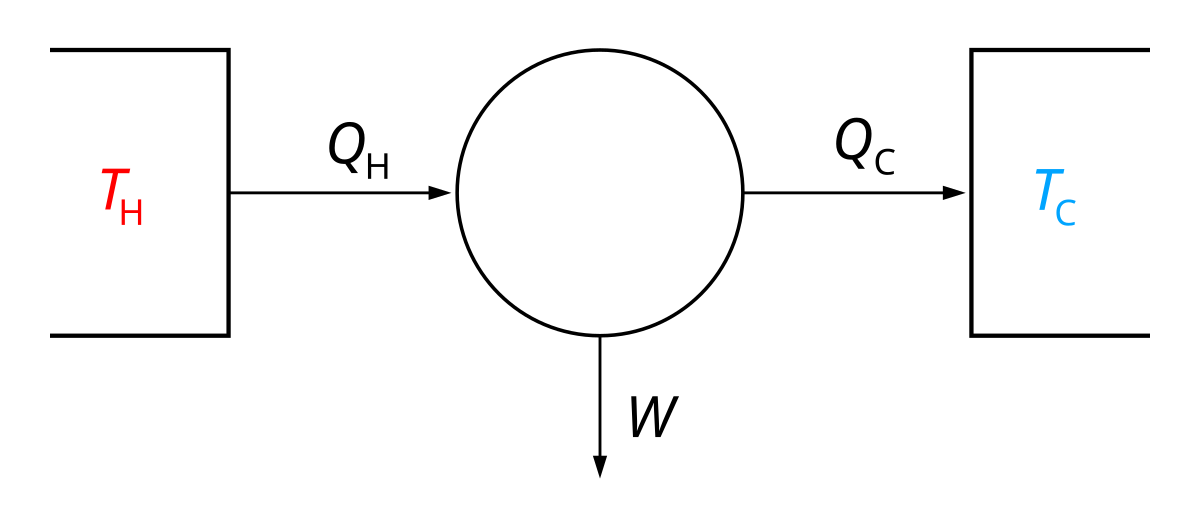
Non-equilibrium thermodynamics is a branch of thermodynamics that deals with physical systems that are not in thermodynamic equilibrium but can be described in terms of macroscopic quantities (non-equilibrium state variables) that represent an extrapolation of the variables used to specify the system in thermodynamic equilibrium. Non-equilibrium...
hasty mountain
Too bad they're so boring to train...but I guess that it's still less time than I'd spend at trying to make a GAN converge
iron basalt
hasty mountain
Too bad they're so boring to train...but I guess that it's still less time than ...
Easy to train and leverages the hardware is key.
hasty mountain
iron basalt
Easy to train and leverages the hardware is key.
Yeah, there's that. Maybe it's because of this that I can't find a proper diffusion model tutorial. No one trains one from scratch because making a decent model that each iteration takes around 30 diffusion steps is quite...meh
hasty mountain
iron basalt
It's inspired by https://en.wikipedia.org/wiki/Non-equilibrium_thermodynamics mo...
I'm dumb at maths. How is this first equation similar to the second one?

 iron basalt
hasty mountain
Yeah, there's that. Maybe it's because of this that I can't find a proper diffus...
iron basalt
hasty mountain
Yeah, there's that. Maybe it's because of this that I can't find a proper diffus...
The actual implementation of the idea itself is pretty straight forward. And there less computationally heavy versions of the idea.
hasty mountain
iron basalt
The actual implementation of the idea itself is pretty straight forward. And the...
Hm... Good point. Maybe I'm just being crazy...trying to make my very first Diffusion Model using a UNet architecture.
Maybe I should make a prototype with 3 or 4 layers without encoding/decoding and not many convolution channels.
At least while I can't get a GPU in SageMaker
iron basalt
hasty mountain
Hm... Good point. Maybe I'm just being crazy...trying to make my very first Diff...
Have you ever made a VAE?
hasty mountain
iron basalt
Have you ever made a VAE?
I did, why?
Can the architecture be the same?
iron basalt
hasty mountain
I did, why?
hasty mountain
Probabilistic... I was simply using a MSE(predicted_output, noised_image)
iron basalt
The reason many struggle with the diffusion math is because it's dealing in probabilities (takes a bit of getting used to), however if you have read the math of VAEs it will seem very familiar.
(And as can be shown, you can get from one to the other, and there is room for many variants in this space (unexplored))
hasty mountain
Uh... I have a problem that whenever I see "probability distribution" I immediately think about softmax and Negative Log Likelihood Loss function
iron basalt
A VAE can also have a very simple implementation. In the end, the actual idea is pretty straight forward. The math is there to explain it in more detail (and proofs).
hasty mountain
hasty mountain
Uh... I have a problem that whenever I see "probability distribution" I immediat...
But then...in this case, it's simply a KL-Divergence loss, right?
I think I usually see that the VAE Encoder loss is the "probability distribution of the encoder output relative to the probability distribution of the normal distribution", but the implementation is just a KL-Divergence Loss using normal distribution as label
iron basalt
It can be very helpful / a shortcut to look at someone else code and figure out how the math in the paper resolves to the given loss.
(although the papers often have pseudocode with the loss in it)
hasty mountain
Okay... I will really need much coffee to understand those crazy things
This isn't straightforward. The VAE loss is, but not the Diffusion one
iron basalt
hasty mountain
This isn't straightforward. The VAE loss is, but not the Diffusion one
The Diffusion one is more work, which is why I recommend reviewing VAE. Doing the more simple one first and using knowledge from that.
Both will take a while to get through.
It's not quick-glance math (unless you already know a bunch of these types of models).
It's also important to note that the author(s) kind of do what they wrote in reverse. They are messing around and coming up with a loss and such, then justifying it fully later.
Because math often happens in the order of playing around and after that proving.
But you read the end result in the other way around kind of.
(All the math and proving at the start, then the resulting pseudocode)
hasty mountain
I can't get where the "probability distribution" comes in if the model output is simply a noised image
iron basalt
The other method of building step by step from axioms and such comes later when the field has been fleshed out.
(The Babylonian method vs the Greek method)
hasty mountain
This one is easier to understand... but what is epsilon-theta?
 iron basalt
hasty mountain
This one is easier to understand... *but what is epsilon-theta?*
iron basalt
hasty mountain
This one is easier to understand... *but what is epsilon-theta?*
I think I have some more resources one sec.
hasty mountain
Enough math...
hasty mountain
Anything that has variables that aren't explictly defined in the previous or posteriour 5 lines is too much for me
There's that epsilon, but then a wild epsilon-theta appears...
I know that alpha is a hyperparameter, and something like a EMA so it's ok, but that epsilon-theta...
iron basalt
Maybe you prefer a video? https://www.youtube.com/watch?v=HoKDTa5jHvg

Diffusion Models are generative models just like GANs. In recent times many state-of-the-art works have been released that build on top of diffusion models such as #dalle or #imagen. In this video I give a detailed explanation of how they work. At first I explain the fundamental idea of these models and later we dive deep into the math part. I t...
hasty mountain
Nah, I prefer texts, actually
iron basalt
Which paper are you looking at?
It should have explained that epsilon is the noise, and epsilon_theta the noise predictor.
(When there is a theta it's the predictor probably, because it's parameterized)
hasty mountain
I'm taking a look at Lilian Weng's blog post.
I don't dare on looking at Ho's paper.
hasty mountain
iron basalt
It should have explained that epsilon is the noise, and epsilon_theta the noise ...
So, the simplified loss is
Loss = (epsilon - output*(sqrt(alpha)*input_image + sqrt(1-alpha)*epsilon)²?
It's just the MSE between a gaussian noise and an Exponential Moving Average, with output being the last term in this EMA and the input image being the penultimate term?
wooden sail
hasty mountain
I can't get where the "probability distribution" comes in if the model output is...
noise is a random process. whenever noise is involved, you need to talk about probability distributions to describe it
iron basalt
hasty mountain
So, the simplified loss is
`Loss = (epsilon - output*(sqrt(alpha)*input_image + ...
||epsilon - epsilon_theta(x_t, t)||^2, x_t = sqrt(alpha_bar) * x_0 + sqrt(1-alpha_bar) * epsilon
(Rewritten, the forward process has a nice closed form)
hasty mountain
wooden sail
noise is a random process. whenever noise is involved, you need to talk about pr...
Uh... So, if I have a KL Divergence Loss which is KL(normal(output_mean, output_std), normal(0, 1)), then I'm computing the KL Divergence loss over the probability distributions of a gaussian noise given by my output_mean and output_std relative to the normal gaussian noise?
wooden sail
hasty mountain
Uh... So, if I have a KL Divergence Loss which is `KL(normal(output_mean, output...
the kld is a measure of distance between probability distributions, sure
hasty mountain
iron basalt
`||epsilon - epsilon_theta(x_t, t)||^2`, `x_t = sqrt(alpha_bar) * x_0 + sqrt(1-a...
Uh... Now I got confused. I thought epsilon theta was my model output, or simply a gaussian distribution given a mean or standard deviation predicted by my model... what is epsilon_theta now?
hasty mountain
wooden sail
the kld is a measure of distance between probability distributions, sure
Now this changes my comprehension over some things
wooden sail
squiggle said the epsilon theta is a predictor. that'd be your network
hasty mountain
Oh... so model(x_t, t), where x_t is my noised image, and t is the time_step...
And the noise must be applied through x_t = sqrt(alpha_bar) * x_0 + sqrt(1-alpha_bar) * epsilon
wooden sail
although most literature doesn't distiguish them explicitly, there's a difference between a prediction and a predictor. the predictor can be thought of as a function or composition of functions that spit out a guess of something based on input data that is random. the predictor has parameters and is (in ML) often differentiable
hasty mountain
Yes, I kinda noticed that when studying Reinforcement Learning
In RL, the predictor is almost always noted as a function
iron basalt
So a key thing to perhaps help in understanding here is that you have these distributions which are parameterized, and you want to learn those parameters. But the math happens in terms of these distributions.
wooden sail
the way noise is described is through the parameters of the distribution it follows
hasty mountain
I see... And my image array is considered a distribution...because I'm dealing with noise.
wooden sail
each realization is random, but the expectation has some properties
hasty mountain
Because probability distribution is not always a vector with values that sum up to 1
iron basalt
If you imagine a normal distribution, but you have the variance become smaller and smaller, and it eventually turns into a spike, you can see how that is kind of like what you are normally used to. mu controlling which value.
But there is great advantages in dealing with probabilities / noise instead.
wooden sail
hasty mountain
Because probability distribution is not always a vector with values that sum up ...
we're talking continuous distributions here, usually. what you have is a vector each of whose entries have a noise realization added to them
hasty mountain
I'm not used on thinking of that Bell curve as probabilities from 0 to 100%...
wooden sail
and then one needs to consider the joint distribution of the noise added to each entry of the vector
so in reality it's more like one distribution per entry in the vector (more care is needed here, as the entries might be conditioned on each other)
hasty mountain
Ooooh, I see... So each pixel is a single probability, more or less?
wooden sail
even in the case of a gaussian, the kld is written in terms of multivariate gaussians
wooden sail
hasty mountain
Ooooh, I see... So each pixel is a single probability, more or less?
each pixel has a pdf
hasty mountain

iron basalt
hasty mountain
Ooooh, I see... So each pixel is a single probability, more or less?
Each pixel has some probability of taking on some value.
hasty mountain
Now I think I get it
iron basalt
In the case of pixels, they depend on what is generating them, independent of each other.
hasty mountain
iron basalt
Each pixel has some probability of taking on some value.
I'm not getting it anymore
So why not use a probability mask, instead of applying that directly to my image?
iron basalt
(Nice case of correlation does not imply causation)
wooden sail
i would say this is the most challenging part to get used to, cuz statistics is weird
wooden sail
hasty mountain
*I'm not getting it anymore*
So why not use a probability mask, instead of apply...
wdym by probability mask
hasty mountain
An array with the same channels, height and length as my image, where each pixel has value from 0 to 1 denoting the probability of a noise being applied to the respective pixel in my image
wooden sail
because each pixel has its own full pdf
writing one probability is not nearly enough information to describe it
hasty mountain
wooden sail
what's the parametric family? and wht are the parameters?
even for a simple uniform or gaussian distribution, you need at least two parameters to describe it
iron basalt
hasty mountain
<:pithink:652247559909277706>
I can ask what the probability of the pixel being red is or blue or green. Is one number enough?
(Or do each of those colors get a number?)
hasty mountain
If the number is in Red channel, there's the probability of being red. If in Blue, blue, and so on. The mask could have 3 channels.
iron basalt
And what if your color is (0, 1) (the range)?
wooden sail
already with those 3 rgb options you need at least 3 numbers: one probability for each color. but the pdfs here are continuous, because the pixel can take any real-valued (or complex-valued, why not?) number
so there are infinitely many possible outputs for each individual pixel
or at the very least, whatever your computer's precision allows, which is still millions
iron basalt
With an infinite number you have to instead start asking questions like "what is the probability it's in between x and y?"
hasty mountain
But then, wouldn't a probability distribution function try to calculate more or less the same thing?
wooden sail
it assigns probabilities to sets of values
hasty mountain
The area of the bell curve would be equivalent to 100%, wouldn't it?
wooden sail
sure
but that's a trivial property of all pdfs
what are the pdf's "statistical moments"? mean, variance, etc? which parameters are needed to fully describe it?
which values are more likely than others?
this is the question one is asking. what is the parametric family, and what are the specific parameters needed so that we can best describe the behavior of the noise. this is done at each pixel
hasty mountain
I think I'm getting it now.
Then the pdf calculates the probability of a single pixel having all possible values?
wooden sail
the pdf does not calculate anything. it tells you the statistical properties
hasty mountain
hasty mountain
I think I'm getting it now.
Then the pdf calculates the probability of a single ...
Not the probability of it actually having all possible values, but for each possible value, tells a probability
wooden sail
also no, pdfs of continuous variables are not probabilities of individual values
but for sets of values, sure
hasty mountain
wooden sail
studying that requires a little bit of real analysis, but if you look at how one computes probability from a pdf, you'll quickly see that the probability of a continuous random variable taking a specific value is always 0
(which is not the same as saying it never happens, btw)
hasty mountain
wooden sail
i think everyone can benefit from picking up a book on statistics. this is a good moment for you to do so 😛 all machine learning cost functions are written in this way, and you will NEED it if you ever hope on understanding what's going on
iron basalt
(prob = number of outcomes with event (1) / number of total possible outcomes (how numbers are there in between 0 and 1?)) (something to think about, mathematicians love this kind of stuff)
hasty mountain
wooden sail
i think everyone can benefit from picking up a book on statistics. this is a goo...
I think I'm relieved that I didn't go for engineering at the college
wooden sail
hasty mountain
*I think I'm relieved that I didn't go for engineering at the college*
most engineering programs don't cover this well in bsc either
in engineering, ML stuffs are usually masters+. if you'd studied mathematics then yeah, all of this stuff would be covered around the time of real analysis
hasty mountain
iron basalt
`||epsilon - epsilon_theta(x_t, t)||^2`, `x_t = sqrt(alpha_bar) * x_0 + sqrt(1-a...
So...MSE? MSE(normal_distribution, model_output), then?
The || || is supposed to be a modulo?
wooden sail
.latex the $\Vert \cdot \Vert$ usually denotes \emph{vector norm}, commonly the 2-norm. that'd be
[
\Vert \boldsymbol{x} \Vert = \sqrt{ \sum_n x_n^2 }
]
 strange elbowBOT
 hasty mountain
Oh, I see. So not MSE
wooden sail
well, the two are linked
you can show that the expectation of the squared error in the gaussian scenario (with scaled identity variance) boils down to that expression (something proportional to it, to be accurate)
hasty mountain
Uh... |||x||² ---> (sqrt(sum(x²)))²---> sum(x²) ?
wooden sail
i didn't put the square in what i wrote. that takes the square root away and you get a sum of squares
yeah
hasty mountain
Nice. Then I shall test this tomorrow.
And stop wasting time on my model prototype in Sagemaker. I was using a function that randomly replaces some pixels by random values.
I didn't know the input noising process should be done in a specific way.
iron basalt
It's really worth reading the actual paper at least for the notation and English paragraphs. And also getting used to working with distributions / a more probabilistic / nicer in terms of statistics, ML. Review probabilities, probability distributions, probability mass functions, probability density functions, etc.
Conditional vs joint vs marginal.
hasty mountain
I just don't get one thing...
If the loss is actually the sum of the squared difference between the gaussian noise(labels) and the predicted output... why didn't anyone write it this way?
wooden sail
hasty mountain
I just don't get one thing...
If the loss is actually the sum of the squared dif...
it only takes that form for gaussian distributions with flat variance
gaussian distributions are very nicely behaved, and both their log likelihood and kld takes the form of least squares
this is not true of other distributions. so one usually formulates the problem generally, and then studies the easy case in detail by waving their hands and evoking the central limit theorem
iron basalt
The diffusion paper has general math, then it plugs stuff in for a special case which collapses to a nice simple loss and such.
But it has the general stuff there, so if you want, you can do something else.
 opal sluice
Hi sorry to interrupt. quick question, as a beginner should i learn polars right away instead of pandas? or do pandas first before picking up polars. thanks
wooden sail
i'm under the impression pandas has more written about it out there, so it might be easier to pick up and look for answers on google
crude galleon
iron basalt
Where are you at in terms of mathematics education? Do you like mathematics? If ...
Honestly, I have no interest in mathematics at all
even 1%
But I am very interested in robotics and machine learning
Very very
 hollow citrus
Is there a way to instantiate a model and run a loop to compile it for multiple input sizes and then fit it and have it retain its knowledge?
model in question would be an LSTM NN
wooden sail
crude galleon
even 1%
But I am very interested in robotics and machine learning
that's gonna be challenging :x
crude galleon
i know
But if mathematics is necessary for robotics and machine learning, I will study and learn it
I just hate maths in school
xd
crude galleon
wooden sail
that's gonna be challenging :x
Math questions in exams are very ridiculous
I searched for X and Y for 18 years and finally I don't know if it is male or female
im joking
wooden sail
in fairness, math is boring in school
wooden sail
that won't be the case in uni
you'll either enjoy it thoroughly, or you'll be in too much pain and sorrow to find it boring
iron basalt
Math is way more fun when you get to pick and choose what you want to do, and also school kind of misses the whole point (unless you get lucky with a very good teacher and a flexible schedule).
crude galleon
I am not in the mood to sit on a chair with a wooden table and burn my back for 2 hours for someone to come and teach for 2 hours and then I don't understand what he said.
wooden sail
then you better study the content before the lecture
iron basalt
https://www.maa.org/sites/default/files/pdf/devlin/LockhartsLament.pdf (Essay on state of mathematics in school)
crude galleon
Last year we had a teacher who tore up a student's paper
He did not answer our greeting
Boring and dry
angry
At the end of the year, he gave renewed grades to all students
You know it is not motivated
Do you understand what I'm saying?
I never felt like going to him and wanting to learn by myself
Everything was forced and forced
crude galleon
wooden sail
then you better study the content before the lecture
I feel it is the only way
wooden sail
crude galleon
You know it is not motivated
Do you understand what I'm saying?
I never felt lik...
i will add that, although in school teachers are tasked with motivating you, that's not the case in uni. some will do it nevertheless, either because they actively try to or simply because they are passionate about the topic themselves. but staying motivated falls on you, and lecturers just give lectures.
crude galleon
wooden sail
i will add that, although in school teachers are tasked with motivating you, tha...
True
But I never understood how to cope with the only subject in which I have a problem
iron basalt
Can you, without external motivation, pick up a math textbook and start going through it? Not because it's part of some course or to get a job, but because you need it for your personal goals not involving obvious rewards like money.
Math is first and foremost an art form like any other, it is coincidentally useful in many fields. If i'm really into music then I make music without constantly thinking about how it will lead me to a job (but it may end up as a job). Nor do I need an external motivator.
crude galleon
iron basalt
Can you, without external motivation, pick up a math textbook and start going th...
yes
crude galleon
iron basalt
Can you, without external motivation, pick up a math textbook and start going th...
I read the encyclopedia
iron basalt
*However, external motivation is a powerful tool for many in the form of others interested in the same things as you. I recommend leveraging it when available.
*Also there is nothing wrong about being in it for the money.
crude galleon
iron basalt
*However, external motivation is a powerful tool for many in the form of others ...
Lets go
 vestal siren
from colormath.color_diff import delta_e_cie1976

# Reference color.
color1 = LabColor(lab_l=0.9, lab_a=16.3, lab_b=-2.22)
# Color to be compared to the reference.
color2 = LabColor(lab_l=0.7, lab_a=14.2, lab_b=-1.80)
# This is your delta E value as a float.
delta_e = delta_e_cie1976(color1, color2)```Hi, can anyone help me why I get this error? It is a simple code example but I can't run it. I instead get AttributeError: module 'numpy' has no attribute 'asscalar' I thought maybe because I don't have the correct version? But I have colormath 3.0.0 and numpy 1.24.1
 clever owl
I'm getting the warning
A value is trying to be set on a copy of a slice from a DataFrame.
Try using .loc[row_indexer,col_indexer] = value instead
Which I get means that the value isn't saved into the df. How can I fix it so the changes to the cells do get translated to the df?
row = df.loc[df['id'].astype(str).str.startswith("0374")]

row["col"] = 'abc
Ok, I think I managed to implement it... I guess...at least I'm not getting any more errors.
The noising function seems to work(though I'm a bit surprised it consists of basically adding random noise that increases with time to each pixel)
I'm just a bit concerned about the loss. sum(epsilon - epsilon_theta)² returns a quite big number. In my case, it's returning something around 196,000 per diffusion step.
But, since the loss is decreasing gradually and my first layer gradients average are around 0.0007, I suppose it's running fine
I hope my prototype with 4 layers + embedding layer manage to produce something, just to show me if it's working or not.
Also...I was doing things really wrong back there. My model completed an entire epoch(6000 iterations) within 6 minutes in my personal GPU, and I'm using 50 timesteps(before, I was using 27 and it was taking much more time)
hasty mountain
I just hope I don't have to make a monster with 50 layers and let it make 100,000 iterations until I can get some results
wooden sail
hasty mountain
Ok, I think I managed to implement it... I guess...at least I'm not getting any ...
the loss itself doesn't matter
unless you can assign it a nice interpretation. the minimizer itself is more important
odd meteor
clever owl
I'm getting the warning
```
A value is trying to be set on a copy of a slice fr...
This should fix it .
row = df.loc[df['id'].astype(str).str.startswith('0374')].copy()
row['col'] = 'abc'
 fading zealot
how to derive time complexity of pipeline ?
 odd parrot
Can somebody tell me how to group years by decade?

 agile cobalt
might as well just divide by 10 and round?
you can pass any series to df.groupby(...) as long as it has the same number of rows as that df
hasty mountain
wooden sail
unless you can assign it a nice interpretation. the minimizer itself is more imp...
Yeah, I thought about that. In the end, only the gradients it generates is what actually matters...
So, if I want to generate images, I should consider a xt = gaussian noise and then apply the formula for sampling to get xt-1 until I can get my x0?
 naive river
agile cobalt
might as well just divide by 10 and round?
naive river
agile cobalt
might as well just divide by 10 and round?
that will do weird things, no?
86 isn't in the 90s
just doing //10 is more likely what you want
charred light
I think they're looking for binning? [1950-1960)
Can probably just do a range by every 10 years, and then use panda's binning.
naive river
floor division by 10 gives you the values to group by
charred light
Good to know, not programming background
 ocean swallow
is there anyone knowledgeable on market prediction? I would like to ask many questions so like, don't want to mess this place up
serene scaffold
ocean swallow
is there anyone knowledgeable on market prediction? I would like to ask many que...
it's fine if there's a lot that you want to know, but you need to ask at least one question, to give an entry point for potential answerers. Don't wait for an expert to commit to helping.
 sonic osprey
can someone help me out on how to export to an excel file what my python console prints out??
serene scaffold
sonic osprey
can someone help me out on how to export to an excel file what my python console...
Sorry, but I don't understand the question. Can you show the code and the error?
!code
 arctic wedgeBOT
Here's how to format Python code on Discord:
```py
print('Hello world!')
```
These are backticks, not quotes. Check this out if you can't find the backtick key.
serene scaffold
@sonic osprey please do not send direct messages. just put your question in the public chat
sonic osprey
cat
 sweet crypt
I am having some problem with downloading coorrect jax wheel to work it with my machine, I have cuda 11.0 and cudnn 8.4.1, and python3.8. I dont see any wheels that match my cudnn. Here is ther list of wheels available https://storage.googleapis.com/jax-releases/jax_cuda_releases.html. I was wondering how would I choose the correct wheel so that it works on my machine. Also, I cannot change cuda or cudnn versions.
serene scaffold
sweet crypt
I am having some problem with downloading coorrect jax wheel to work it with my ...
Hey, what's your OS?
if you're on Windows, there are more wheels here: https://whls.blob.core.windows.net/unstable/index.html
I also wonder if pip install jax[cuda110] -f https://whls.blob.core.windows.net/unstable/index.html --use-deprecated legacy-resolver would work
sweet crypt
serene scaffold
Hey, what's your OS?
mac os
sweet crypt
serene scaffold
did you try https://storage.googleapis.com/jax-releases/cuda110/jaxlib-0.1.71+cu...
I have not. So just not specify cudnn version?
that wheel is for linux. but it doesn't appear that any of the wheels refer to cudnn.
sweet crypt
I tried this, but ofcourse there is no cudnn84 on wheels, i tried cudnn86, but it doesnt owrk
sweet crypt
serene scaffold
oh, looks like they do.
yup
I wonder why cudnn version 8.4 has no wheels
serene scaffold
in either case, it looks like all these wheels are for linux? not sure what none-manylinuxmeans.
sweet crypt
serene scaffold
in either case, it looks like all these wheels are for linux? not sure what `non...
oh sorry I am using linux machine, I am just accessing remote machine through my mac
sorry about the confusion
serene scaffold
no problem. remember that installation questions are always wrt the OS for where you're installing it
sweet crypt
yup sorry about the confusion haha
do you think there would be any workaround to solve the issue?
sweet crypt
serene scaffold
can you build jax locally?
oh dang this seems hard haha
serene scaffold
don't worry. it could be worse!
hasty mountain
hasty mountain
So, if I want to generate images, I should consider a xt = gaussian noise and th...
Ugh... After 1,000,000 iterations on 16x16 RGB images...no results.

sweet crypt
serene scaffold
don't worry. it could be worse!
I will try it out then
ocean swallow
serene scaffold
it's fine if there's a lot that you want to know, but you need to ask at least o...
I tried some NNs with regression, but I don't know if it is viable. Is there some architectures that are reliable?
I basically want to know the trends (as in what things are currently used in Market / Trading Predictions)
serene scaffold
@ocean swallow have you looked into time series forecasting?
ocean swallow
serene scaffold
<@250736327593689088> have you looked into time series forecasting?
I mean what exactly? Everything I checked is outdated. Using sorts of feature extractions etc.
SARIMA, Stationary tests Prophet
I did what I consider the basics but unable to advance,. What I did is convert time series to supervised data by shifting, used regression, some other models, Removed or added some more features. etc.
 heavy bay
I get a warning when I run tensorflow on my m1 macbook air ```
2023-01-21 08:07:11.814809: W tensorflow/tsl/platform/profile_utils/cpu_utils.cc:128] Failed to get CPU frequency: 0 Hz
 amber cairn
sonic osprey
can someone help me out on how to export to an excel file what my python console...
amber cairn
sonic osprey
can someone help me out on how to export to an excel file what my python console...
It sounds like you're willing to do an intermediate operation that is likely to be prone to tedious work and errors.
Why not directly write the results in an excel file?
Check out the good openpyxl or xlsxwriter libraries.
Small implementation differences, but the results are always great with both
 modern belfry
I am training my first CNN model on organic and non organic item images. After 10 epochs should I worry about anything?

as a noob it looks good till now..
agile cobalt
the test set is doing better than training set? kinda sus - how many rows do you have in total and did you shuffle the data before splitting?
modern belfry
agile cobalt
the test set is doing better than training set? kinda sus - how many rows do you...
so shuffle is random with vertical and horizontal flips (transformation with pytorch)
0.8 split for training set
modern belfry
agile cobalt
the test set is doing better than training set? kinda sus - how many rows do you...
I also put it in eval() & torch.inference_mode() so the model is not training while its performing operations on test set
modern belfry
agile cobalt
the test set is doing better than training set? kinda sus - how many rows do you...
total I have 20000 images approx
agile cobalt
eval?
 agile cobalt
uh, ok
if it is just binary classification, I'd also check the confusion matrix, but the test set results being better than the training set results sounds really weird
maybe the scale of the graph makes it look like a bigger deal than it actually is though
modern belfry
agile cobalt
maybe the scale of the graph makes it look like a bigger deal than it actually i...
hmm
modern belfry
agile cobalt
if it is just binary classification, I'd also check the confusion matrix, but th...
oh i see
btw i checked the results
and accuracy difference is like 80 and 81 percent
basically 1-2 percent max diff
modern belfry
modern belfry
I am training my first CNN model on organic and non organic item images. After 1...
the first epoch diff is huge tho
maybe cuz initial training batches had very less accuracy so it decreased full epoch accuracy for training set
agile cobalt
maybe double check your code and/or re-train the network on a different split to see if it was just luck giving you an 'easier' test set
(assuming that you picked an architecture that can be trained within minutes)
I do not have much actual practice training ML models though, just some theory
modern belfry
agile cobalt
maybe double check your code and/or re-train the network on a different split to...
hmm i see
btw I am using cross entropy loss (multi classification model for this)
because this model performed very poorly on 5 classes
so I tried it on a 2 class huge dataset to see if model is the problem
the accuracy became good i guess but yea the test set results dont make a lot of sense oof
agile cobalt
you might want to use some high level library like fast.ai instead of using pytorch directly
(or if it were tf, keras)
modern belfry
oh-
 mint palm
what configurations can be changed while finetuning model, and what should be changed?
where can i learn more on this?
 solemn atlas
What all maths needed to get started with ml ,if possible can I get some resource links or video
 rugged falcon
i only ever looked into ML once years ago. from back then i remember only relu,sigmoid,tanh as actuvation function
by now: is there a new way-to-go like something that replaced those activation something or is it still something that needs to be tried out and iterated?
additionally: are new NNs even made at this point from smaller groups of people / small company or is everyone just feeding on the big established NN that already were given out by the big companies ?
tranquil jasper
Is knowing excel and tableau necessary?
Or pandas/polars and matplotlib works?
 worn stratus
tranquil jasper
Is knowing excel and tableau necessary?
Or pandas/polars and matplotlib works?
worn stratus
tranquil jasper
Is knowing excel and tableau necessary?
Or pandas/polars and matplotlib works?
Necessary for what? You don't need any of those to be a good carpenter
tranquil jasper
Well i assumed comparing pandas to Excel will suffice
worn stratus
For what role?
tranquil jasper
Data engineering/analysis/visualization
 charred wedge
Has anyone work with AIS data from ships? Or movement data in general and can recommend some reading or libraries / projects that goes into trajectories, generalizing etc and stop detecting?
 silver lion
has anyone done any research using , AIBO robot dog as a platform
lapis sequoia
tranquil jasper
Data engineering/analysis/visualization
really kinda works on your organisations, in general, yes its fine. I use pandas and matplotlib on daily basis in my firm.
 keen forum
solemn atlas
What all maths needed to get started with ml ,if possible can I get some resourc...
keen forum
solemn atlas
What all maths needed to get started with ml ,if possible can I get some resourc...
Start with some linear algebra
serene scaffold
solemn atlas
What all maths needed to get started with ml ,if possible can I get some resourc...
!resources data science
arctic wedgeBOT
Resources
The Resources page on our website contains a list of hand-selected learning resources that we regularly recommend to both beginners and experts.
 floral cloak
Hi! Should I ask my plotly question here?
serene scaffold
floral cloak
Hi! Should I ask my plotly question here?
yes (though it won't necessarily be me who answers it)
 prime hearth
hello, how can I set up my data to consist of bagofwords or tfidf for a ctergorical feature and a numerical feature?
for example, I have the following:
tfidf=TfidfVectorizer()
X_tfidf= tfidf.fit_transform(x)
return X_tfidf
This returns a 2d array. I want to train my model with this data but also with another feature from my dataframe that has integers
floral cloak
I am creating a simple scatter plot with multiple traces. Everything is working as expected but I cannot (for the life of me) use a custom colorscale (Portland) in this case. This was my latest (feeble) attempt:
`from textwrap import wrap
import plotly.graph_objects as go
VizDF = pd.DataFrame()
VizDF["x"], VizDF["y"] = NewsFreshCTMT.getVizCoords()
VizDF['topics'] = NewsFreshCTMT.runHDBSCAN()
if self.docs != None:
wrappedText = ["<br>".join(wrap(txt[:400], width=60)) for txt in self.docs]
VizDF['wrappedText'] = ["Topic #: "+str(topic)+"<br><br>"+text for topic, text in zip(VizDF['topics'], wrappedText)]
else :
VizDF['wrappedText'] = ["Topic #: "+str(topic) for topic in NewsFreshCTMT.runHDBSCAN()]
for topiclabel in set(VizDF['topics']):
topicDF = VizDF.loc[VizDF['topics']==topiclabel]
fig.add_trace(
go.Scattergl(
x=topicDF["x"],
y=topicDF["y"],
mode='markers',
name=str(topiclabel)+" ("+str(topicDF.shape[0])+")",
text=topicDF['wrappedText'],
hovertemplate = "%{text}<extra></extra>",
))
fig.update_traces(marker=dict(size=5,
opacity=0.50,
coloraxis='coloraxis'))
fig.update_coloraxes(colorscale='Portland')
fig.update_layout(width=800, height=800)`
 misty flint
i guess this is technically a freemium model, i think 

this is chatgpt btw
they finally had to figure out a way to pay for their inference costs 
iron basalt
misty flint
they finally had to figure out a way to pay for their inference costs <:kekHands...
It costs them ~90 million per month and increasing, so right now they would need at least ~2 million subscribers, not including taxes...
The Microsoft deal may reduce the costs, but probably not enough.
(Turns out deep learning does not scale well in terms of energy efficiency / costs...)
 queen cradle
floral cloak
I am creating a simple scatter plot with multiple traces. Everything is working ...
queen cradle
floral cloak
I am creating a simple scatter plot with multiple traces. Everything is working ...
Can you post a working example? Your code does not run because fig is created in something you didn't post.
misty flint
iron basalt
It costs them ~90 million per month and increasing, so right now they would need...
enter "Enterprise Tier"
and you know they can charge much, much more than $42/mo for that
but tbh idk how theyll manage the costs. maybe theyll do some creative stuff with infrastructure
iron basalt
misty flint
and you know they can charge much, much more than $42/mo for that
Well, increased price -> less subscribers.
floral cloak
@queen cradle Oops. I edited it and left out fig = go.Fig() - but it won't run without the data which is 6K of vectors. The output is:
 misty flint
iron basalt
Well, increased price -> less subscribers.
misty flint
iron basalt
Well, increased price -> less subscribers.
yeah and you know theres gonna be other competitors now that the floodgates are open. so hopefully price will go down anyway
floral cloak
which is correct for me - just can't get the colorscale to work
iron basalt
If they maybe stop using GPUs, but something custom, then it may barely pay off. But the problem is that deep learning uses dense operations, which will always use a lot of energy.
floral cloak
prime hearth
for example, I have the following:
```python
tfidf=TfidfVectorizer()
X_tfidf= tf...
So basically TFIdfVectorizer creates an index of words/importance - once you have trained the model you can then feed it a word that has been indexed and receive back its ranking. So you need to train the model and then feed it back the all the words you are interested in and you will get their 'score' for that model. I suggest reading up on how it works - e.g. https://medium.com/@cmukesh8688/tf-idf-vectorizer-scikit-learn-dbc0244a911a
 hasty mountain
iron basalt
(Turns out deep learning does not scale well in terms of energy efficiency / cos...
hasty mountain
iron basalt
(Turns out deep learning does not scale well in terms of energy efficiency / cos...
Those recent state-of-the-art models seem to worry much more about results than about spendig the least amount of resources as possible
The hardware they use in their papers is always dozens of T4 or P100...
Except for the Transformer. Discarding the RNNs and using exclusively the attention is wonderful
queen cradle
floral cloak
<@710929945526009897> Oops. I edited it and left out fig = go.Fig() - but it won...
The problem is that you need to set the color attribute on the markers of each scatter plot. For example,
import plotly.graph_objects as go

import chromophile as cp

fig = go.Figure()

xs = [0, 1, 2, 3, 4]
ys0 = [0, 1, 2, 3, 4]
ys1 = [0, 4, 0, 4, 0]

fig.add_trace(
    go.Scattergl(
      x=xs, y=ys0,
      mode='markers',
      marker=dict(color=[0] * len(xs)),
    ),
)

fig.add_trace(
    go.Scattergl(
      x=xs, y=ys1,
      mode='markers',
      marker=dict(color=[1] * len(xs)),
    )
)

fig.update_traces(
    marker=dict(
        size=5,
        opacity=0.5,
        coloraxis='coloraxis',
    )
)

fig.update_coloraxes(colorscale=cp.palette.cp_isolum_cyc_wide)
fig.update_layout(width=800, height=800)

fig.show()
Generally, methods that can make more use of the hardware win. But there is also the other side, which is making the algorithm need less hardware (which also tends to make it scale up too). Deep learning's success comes from the first part, making use of the available hardware, which has gotten thousands of times faster in a short time span. http://incompleteideas.net/IncIdeas/BitterLesson.html (note that what is presented in this link stops applying without more parallelization and robotics where resources need to be very limited (and if neuromorphic processors become available, algorithms that fit it best will win)).
hasty mountain
I see, but it would be interesting to see methods that can do more with less hardware. So, if you can't use that much hardware, fine, but if you do, excellent.
Neuromorphic processors?
I never heard about those
iron basalt
hasty mountain
*Neuromorphic processors?*
I never heard about those
Their architecture mimics actual neural networks.
hasty mountain
I like what Google shows me...
In fact, my interest in Neural Networks appeared exactly because they try to mimic...well...neural networks...
iron basalt
Right now many are still trying deep learning on it, but that is wrong algorithm type for the hardware...
Also they are still small, and limited / expensive.
hasty mountain
Oh... and it seems more something that a materials engineer could have more fun
iron basalt
In theory it's like 1000x more energy efficient if done right.
The correct kind of algorithm for something like this is something like a liquid state machine (LSM).
Which even on current hardware beats RNNs in our tests.
(attention variants / mixes are very interesting)
hasty mountain
iron basalt
What also is really neat about LSMs is that they can implemented in absurd ways. Such as panels of randomly cracked glass. Where you use light as input and the power source as the same time.
Or waves in a puddle.
hasty mountain
The concept of neuromorphic systems can be extended to sensors (not just to computation). An example of this applied to detecting light is the retinomorphic sensor or, when employed in an array, the event camera. - Wikipedia
Hm... Using YUV channels?
iron basalt
With paddles.
hasty mountain
iron basalt
What also is really neat about LSMs is that they can implemented in absurd ways....
Something a bit like the Perceptron?
iron basalt
hasty mountain
`The concept of neuromorphic systems can be extended to sensors (not just to com...
Basically, the way cameras work now is also not great for efficiency and such.
iron basalt
hasty mountain
Something a bit like the Perceptron?
Yes, but also recurrent connections. It can handle sequences.
hasty mountain
Aw...
I hate RNNs
iron basalt
Not an RNN as in deep learning.
In actual neural networks there is a tangled mess of recurrent connections.
Often neurons have a recurrent connection to just themselves to amplify signals.
RNN is deep learning uses backprop, that is not the case here.
There are no vanishing gradients, and it can handle much longer time frames.
It also does online learning, so you don't need to train forever, it's one-shot.
hasty mountain
The idea is that neurons in the SNN do not transmit information at each propagation cycle (as it happens with typical multi-layer perceptron networks), but rather transmit information only when a membrane potential – an intrinsic quality of the neuron related to its membrane electrical charge – reaches a specific value, called the threshold.
Isn't this function more or less performed by ReLU activations in Deep Learning?
I mean...if the input is too low(<0), that neuron won't be activated(output 0)
iron basalt
Spiking neural networks don't need to update all at once with a central "clock."
There is no "foward pass."
Or passes in general.
Most of the neurons will be inactive at any given time (sparse) and so low energy usage.
hasty mountain
Interesting
iron basalt
It's also why it can do online learning, since most neurons are not being activated / modified (you can imagine most weights are not being touched / updated). It's stable.
hasty mountain
Can I make a stable GAN using SNNs?
iron basalt
hasty mountain
*Can I make a stable GAN using SNNs?*
You mean the general idea of adversarial networks? Yes.
But you will still have the same fundamental issue of adversarial networks, one becoming way better than the other.
iron basalt
hasty mountain
It seems I already have something to learn during my next college vacation, then...
There are sparse NN methods that have similar properties to SNNs but still work with the current hardware too.
If we get neuromorphic computing at scale and cheaper, then yeah SNNs all the way.
iron basalt
iron basalt
It's also why it can do online learning, since most neurons are not being activa...
This is key.
(note that in deep learning, you always touch everything, EXCEPT in stuff like pathways (aka routing methods), which is better, but does not leave things alone as much as actual NNs)
serene scaffold
neuromorphic computing? how many times are people going to propose new computing paradigms that allegedly resemble the human brain?
iron basalt
serene scaffold
neuromorphic computing? how many times are people going to propose new computing...
This is a really old one. There just was not any motivation to adopt it yet, because of the results given by deep learning. And software moves faster.
hasty mountain
But then...what's the difference between online learning and using something like a Google API to fine-tune the model in real time?
floral cloak
queen cradle
The problem is that you need to set the color attribute on the markers of each s...
Hmmm... Thanks. I will give it a go, much appreciated. But I really don't understand why the colors are cycling through the default colorscale and I can't just tell plotly to use a different colorscale. I find the interface and approach that plotly uses to be very confusing. But that's probably just me.
queen cradle
floral cloak
Hmmm... Thanks. I will give it a go, much appreciated. But I really don't unders...
I think what's going on here is that Plotly has a default set of categorical colors, and that's what you're seeing. To use the color scale, you need to tell it to color your data continuously, which is what color= does. But I'm not a Plotly expert either.
iron basalt
hasty mountain
But then...what's the difference between online learning and using something lik...
So this gets a bit into the weeds of it, but making use of some pretrained thing is not online learning. Online learning is specifically learning things in order as given and you can't resample it. Pretrained stuff will help (learning to learn), but it's not online learning on its own.
floral cloak
queen cradle
I think what's going on here is that Plotly has a default set of categorical col...
yah. I'll give it a go. The data is being colored continuously under the default conditions, so I am pretty confused - but if this works I'm moving on. Any idea where the plotly experts hang out?
iron basalt
Basically it has to be one-shot, and it can't forget things (deep learning simply can't do this because it slowly adjusts many weights and it forgets because it touches all the weights). The fix you will often see in deep learning is to have a replay buffer, a very large buffer used to give back some of that i.i.d. / resample. Problem is that that buffer does not scale, it needs to become massive for the tasks they are now trying to do.
queen cradle
floral cloak
yah. I'll give it a go. The data is being colored continuously under the default...
No, I don't know where you'd ask. (Besides Stack Overflow, I guess.) Good luck!
floral cloak
queen cradle
No, I don't know where you'd ask. (Besides Stack Overflow, I guess.) Good luck!
👍
iron basalt

Catastrophic interference, also known as catastrophic forgetting, is the tendency of an artificial neural network to abruptly and drastically forget previously learned information upon learning new information. Neural networks are an important part of the network approach and connectionist approach to cognitive science. With these networks, huma...
hasty mountain
iron basalt
The "stability-plasticity dilemma" of NNs, how to constantly acquire new knowledge without disrupting existing knowledge.
hasty mountain
Yeah, I've seen quite many Reinforcement Learning models using replay buffers...
iron basalt
hasty mountain
Yeah, I've seen quite many Reinforcement Learning models using replay buffers...
They don't work without them.
Someone has already solved the stability-plasticity dilemma in a way that has been shown to work very well... (https://en.wikipedia.org/wiki/Adaptive_resonance_theory )
Adaptive resonance theory (ART) is a theory developed by Stephen Grossberg and Gail Carpenter on aspects of how the brain processes information. It describes a number of neural network models which use supervised and unsupervised learning methods, and address problems such as pattern recognition and prediction.
The primary intuition behind the A...
(Also there is biological evidence for it)
hasty mountain
iron basalt
Someone has already solved the stability-plasticity dilemma in a way that has be...
Also...changing completely the subject and going back to Deep Learning.
I suppose that, in order to achieve some results with Diffusion models, I have to let it run through more than 500,000 iterations. Problem is...I'm trying now with 16x16 images, it has been more than 150,000 iterations and still nothing.
My UNet version also doesn't seem promising at all.
I'm using the following functions:
def noiser(input_image, time_step, alpha=0.99):

    alpha = torch.tensor([alpha**(time_step*10)])

    noised_image = (torch.sqrt(alpha) * input_image) + (torch.sqrt(1-alpha) * torch.randn_like(input_image))

    return noised_image

def sampler(noised_image, predicted_image, time_step, alpha=0.99):
    '''DDPM'''

    if time_step > 1:

        z = torch.randn_like(predicted_image, device=device)
        sigma = torch.var(z)

    else:
        sigma = 0

    alpha = torch.tensor([alpha**(time_step*10)], device=device)

    denoised_image = 1/torch.sqrt(alpha) * (noised_image - (((1-alpha)/torch.sqrt(1-alpha)) * predicted_image)) + sigma

    return denoised_image
Are they correct?
For sampling, I'm passing a random noise to the model and a time_step of 50(the last time step I'm using), then I use the sampler function to get the image from timestep 49, which is also passed to the model with timestep 49, and so on until I get to timestep 0.
iron basalt
serene scaffold
neuromorphic computing? how many times are people going to propose new computing...
If you are seeing a bunch of hype articles or whatever, I recommend ignoring how it "resembles the brain" and instead focus on what it actually gives in terms of energy efficiency and such (if it's not addressed, ignore it). Also if it does not use silicon you can probably ignore it. Too many economic issues with doing some other materials. There is a lot of just hype BS out there, but there is actual promising feasible stuff. I don't see it having mass adoption any time soon though, for now it's better to just make better use of what we have.
For reasons similar to why airplanes don't resemble birds, I expect that the algorithms that end up working better do not resemble the brain. They just need the same important properties that we really want, which in the case of the airplane is flight.
iron basalt
iron basalt
Basically it has to be one-shot, and it can't forget things (deep learning simpl...
A simple test that you can do for online learning is in-order MNIST. That is, rather than shuffle, you sort it, and then you go in order and only get to see each once, no epochs.
(No replay buffer because that is the same as having the shuffled set)
serene scaffold
iron basalt
For reasons similar to why airplanes don't resemble birds, I expect that the alg...
that's a great way of putting it. 
did you come up with that?
iron basalt
serene scaffold
did you come up with that?
Kind of, ChatGPT-style remixing there.
It's a general thing from engineering I heard before.
serene scaffold
iron basalt
Kind of, ChatGPT-style remixing there.
are you the human incarnation of ChatGPT?
iron basalt
serene scaffold
are you the human incarnation of ChatGPT?
(I am ChatGPT tuned with parenthesis)
serene scaffold
also I had my grad school orientation yesterday
iron basalt
When the LISP programmers do ML.
serene scaffold
one of the most senior members of my department (he stepped down as department head two years ago) used to mostly use lisp, but he's basically been forced into adopting python, so I refactor all his stuff.
iron basalt
The real issue with LISP is more subtle. And it applies to languages with meta-programming that is too good. They tend to custom meta-program everything they need rather than make libraries for later. Because of this there never ends up being an ecosystem like with Python. And no matter how good the language is, nothing beats having the work already done for you.
serene scaffold
I came to the realization recently that lisp is known much more for homoiconicity than being functional. (in my undergrad, we only learned lisp for the purposes of learning functional programming.)
iron basalt
Well, LISP is list processing, it just happens that you can do lambda calculus well with it.
*It's a list processing language, not functional. But that happens to be functional in practice when used.
There are also many not very functional LISPs.
For example, C but with LISP syntax and macros is a thing.
Not even garbage collected.
A lot of what makes a language great is the programming style / culture around it / the people it attracts.
And LISP attracts a certain kind of programmer...
And that can shift, as seen with Python and ML...
IMO, Wolfram Language is the better homoiconic language. It's LISP but with better ergonomics.
BUT, LISP has the strength of being easy to implement. A fast way to escape assembly (and even get meta-programming while you are at it (you could easily implement Wolfram Language with LISP)).
hasty mountain
Ugh... 200,000 iterations with my diffusion model using 16x16 images, but still nothing
I didn't want to begin with a model that is too heavy, though
 hexed yew
I have a Pandas question I am hoping here is the right place to ask...if not please redirect me...
I have a dataframe that contains some integer data for multiple customers that is gathered one a day, sometimes an external process breaks and I am missing one or more days of information. I would like to be able to fill in those days with some estimated data. Copying down from previous day would be acceptable, using an average of data from the days before and after the missing data would be preferred. the screenshot here is a mock sample, here you can see we have data gathered January 1-5 but missing Jan 2 and 3.
how would I tackle this with Pandas? I am hoping there is something "simple" in pandas for this?I can probably loop through the data and fill int in that way, but I feel like that is the wrong approach
 serene scaffold
hexed yew
I have a Pandas question I am hoping here is the right place to ask...if not ple...
serene scaffold
hexed yew
I have a Pandas question I am hoping here is the right place to ask...if not ple...
your index column is useless, so delete that one.
after that, confirm that the datetime column contains actual timestamp types (not strings) with print(df['datetime'].dtype). if they are not strings (you'll see object if they are strings--that is wrong), do df = df.set_index('datetime')
do you already know the first and last day of interest?
hexed yew
agree the index is useless, the datetime should be a timestamp was loaded in with pd.to_datetime to convert it from a string....
serene scaffold
hexed yew
agree the index is useless, the datetime should be a timestamp was loaded in wit...
good. strings that are formatted as timestamps, but which are still strings, are terrible.
hexed yew
first and last day of interest will be first and last day of the month
serene scaffold
what month? January 2023?
hexed yew
in this case yes
serene scaffold
del df['index']
df = df.set_index('timestamp').reindex(pd.date_range(start='2023-01-01', end='2023-01-31'))
print(df)
try that.
it should add blank rows for all the missing days.
hexed yew
ValueError: cannot reindex on an axis with duplicate labels
because each day exists multiple times as (once for each customer)
serene scaffold
then you need two levels of indexing. customer and timestamp.
or something like that
which is too complicated for me to help with in the abstract, so we can only continue if you give me a text-based, copy-and-pastable copy of the data that I can experiment with.
Please ping me if you decide to do that. Otherwise I'll be elsewhere.
hexed yew
here's the table in csv:
customer,basic,essential,foundation,standard,voicemail,datetime
cus_001,41,11,77,154,165,2023-01-01 06:00:00
cus_002,2,2,265,32,159,2023-01-01 06:00:00
cus_003,26,13,251,18,113,2023-01-01 06:00:00
cus_004,31,12,185,61,142,2023-01-01 06:00:00
cus_001,42,11,77,154,165,2023-01-04 04:00:00
cus_002,2,2,265,32,159,2023-01-04 04:00:00
cus_003,26,13,251,18,113,2023-01-04 04:00:00
cus_004,31,12,185,61,142,2023-01-04 04:00:00
cus_001,42,11,77,154,165,2023-01-05 04:00:00
cus_002,2,2,265,32,159,2023-01-05 04:00:00
cus_003,26,13,251,18,113,2023-01-05 04:00:00
cus_004,31,12,185,61,142,2023-01-05 04:00:00
@serene scaffold ^^
I guess in this case my first and end date are Jan 1-5 for purposes of example, that's easy enough to change and adapt though...real world deployment of this the start and end will be defined by the user at runtime
I have that working already to load the data in based on the date range just the filling in missing data that I am going in circles on a bit
one option I guess would be to split into a DF per customer then do the index stuff from above and re-combine it....that's not horrible
serene scaffold
hexed yew
here's the table in csv:
```
customer,basic,essential,foundation,standard,voicem...
why are some of the days 4:00:00 and some are 6:00:00
hexed yew
that was another challenge I was solving some days I will get multiple copies of file and I am only interested in the last copy so my sample data has data generate at 04:00 and 06:00 for Jan 1 I am dropping the 04:00 data and just keeping the 06:00 so I only have a single record for the day
realworld reasoning for that is the file is auto-generated by a cron job at some time early AM, but on occasion someone needs to regnerate the data manually if something failed in cron job, and may not delete the old incorrect data, so I always want to last run data from the day
serene scaffold
@hexed yew if you make a function that takes a dataframe, where that dataframe is the data for one customer, and returns a dataframe with the filled in values, you can apply that with df.groupby('customer').apply
In [59]: def fix(d):
    ...:     d = d.set_index('datetime').reindex(pd.date_range(start='2023-01-01', end='2023-01-31'))
    ...:     return d.fillna(d.rolling(5, center=True).mean())
    ...:

In [60]: df.groupby('customer').apply(fix)
<ipython-input-59-2c652b2e2fdb>:3: FutureWarning: Dropping of nuisance columns in rolling operations is deprecated; in a future version this will raise TypeError. Select only valid columns before calling the operation. Dropped columns were Index(['customer'], dtype='object')


  return d.fillna(d.rolling(5, center=True).mean())
Out[60]:
                    customer  basic  essential  foundation  standard  voicemail
customer
cus_001  2023-01-01  cus_001   41.0       11.0        77.0     154.0      165.0
         2023-01-02      NaN    NaN        NaN         NaN       NaN        NaN
         2023-01-03      NaN    NaN        NaN         NaN       NaN        NaN
         2023-01-04  cus_001   42.0       11.0        77.0     154.0      165.0
         2023-01-05  cus_001   42.0       11.0        77.0     154.0      165.0
...                      ...    ...        ...         ...       ...        ...
cus_004  2023-01-27      NaN    NaN        NaN         NaN       NaN        NaN
         2023-01-28      NaN    NaN        NaN         NaN       NaN        NaN
         2023-01-29      NaN    NaN        NaN         NaN       NaN        NaN
         2023-01-30      NaN    NaN        NaN         NaN       NaN        NaN
         2023-01-31      NaN    NaN        NaN         NaN       NaN        NaN
clearly I've made a mistake.
hexed yew
ok ok I think I can work with that
you've given me some good ideas to pursue thank you @serene scaffold
going to fold laundy and chew on this for a bit thank you
serene scaffold
hexed yew
going to fold laundy and chew on this for a bit thank you
do you fold laundry on your bed or what
I had a problem for a long time where I didn't have a good workspace that was at the right level
hexed yew
serene scaffold
do you fold laundry on your bed or what
I sure do
serene scaffold
hexed yew
I sure do
how high is your bed? mine comes up to about my knuckles. my previous bed was lower, and it got uncomfortable during longer folding sessions
hexed yew
About that I’d I stand beside bed arms at side it is first knuckle.
Pile of laundry though makes it chest height haha
hexed yew
So, small changes...after using the time to get latest data, I am changing the datetime to just date and stripping the time off as time no longer matters, then did a loop to build a temp DF per customer with the date as index and ffill and interpolate to fill in the data and then concat it back to a single dataframe this works...don't like creating multiple copies of the dataframe, but I am dealing with tiny data so maybe it doesn't matter....
cust_dfs =[]
for cust in df["customer"].unique():
    cust_df = df[df["customer"]==cust]
    cust_df = (cust_df.set_index("date")
            .reindex(
                pd.date_range(start=min(df['date']),
                end=max(df['date']))
                )
            )
    cust_df["customer"] = cust_df['customer'].ffill()
    cust_df = cust_df.interpolate()
    cust_df["date"] = cust_df.index
    cust_dfs.append(cust_df)
df = pd.concat(cust_dfs, ignore_index=True)
print(df)

I am going to poke around with what the last suggestion was though too, think that may be a bit cleaner, but this works for now atleast
serene scaffold
hexed yew
So, small changes...after using the time to get latest data, I am changing the d...
You can make it cleaner by iterating over a groupby
hexed yew
this is starting to look decent


 hexed yew
i appreciate your help!!!!
 fervent lantern
Do you guys know how to work with DataFrames? It is a pretty easy question but i cant figure it out. How can I add a single row out of a other Dataframe (With the same columns) to a new dataframe?
I want to select the row with a number. example: Row 1 in DataFrame1 should be addet to DataFram2
arctic wedgeBOT
Hey @dense lintel!
You either uploaded a .txt file or entered a message that was too long. Please use our paste bin instead.
mint palm
while decreasing BS we should decrease the LR too, right. So should we also increase epoch to maintain/reproduce results, Given reported BS cannot be trained on my GPU?
hexed yew
fervent lantern
Do you guys know how to work with DataFrames? It is a pretty easy question but i...
Not an expert but I think the concat function is what you are looking for perhaps. https://pandas.pydata.org/docs/reference/api/pandas.concat.html there used to be an append function but that was deprecated it appears in favour of concat. You can filter one of the data frames to specific rows based on some column value as well. So (writing from phone hopefully I get this correct) code would be something like:
df2 = pd.concat([df2, df1[df1[“MyCol”]==“someValue”]], ignore_index=True)
Whether ignore index should true or false will depend on your data.
If your index data is meaningful it should be false.
fervent lantern
@hexed yew Thank you!
@hexed yew I have another Problem and i can not get behind it
Error: Unknown label type: 'unknown'

How can this even happen? The x_train values are normed, and the y_train values are booleans. Everything is perfect but it wont work
hexed yew
that I will leave for someone else, that is functionality I have not used at all so I have no idea
fervent lantern
Still thank you!
serene scaffold
fervent lantern
Error: Unknown label type: 'unknown'
you need to scale each feature with the same StandardScaler. and you should only fit it once.
beginners tend to overuse fit_transform and end up making all their results meaningless.
fervent lantern
serene scaffold
you need to scale each feature with the same StandardScaler. and you should only...
Thank you for your answer but I really dont understand what I should do now. Could you give me a code sample? I used only this standartscaler you see on the screenshot
I am a beginner and i am going crazy
serene scaffold
fervent lantern
Thank you for your answer but I really dont understand what I should do now. Cou...
do you understand what StandardScaler does?
fervent lantern
Yeah it norms everything between -1 and 1
serene scaffold
fervent lantern
Yeah it norms everything between -1 and 1
right, and it needs to know the mean in order to do that. and the fit part of fit_transform is where it learns what the mean is for your data. if you fit two different StandardScalers on two different slices of the data, then they'll both be using different means.
which means that .5 from one StandardScaler has nothing to do with a .5 from another.
so the result is that your x_train and x_test arrays have no relationship to each other.
fervent lantern
Yes, I want to train on one and then test on the other. they should have no relations, right?
serene scaffold
fervent lantern
Yes, I want to train on one and then test on the other. they should have no rela...
all the features need to be encoded the same way.
fervent lantern
Okay, I know what you want to tell me but i dont know how to do it
I have x_train(normed values) and y_train (boolens)
serene scaffold
you should do any feature encoding on the whole data, before you partition it into train and test.
fervent lantern
and x_test(normed values) and y_test (boolens9
Is there any way you would give me 10minutes of your time for a call?
serene scaffold
I don't really do help calls; sorry
fervent lantern
Oh, thats sad. I am from germany and i have massive issues with this part. I codet one week on this project and can not get the mashine learning part done. i am trying it for over 12h now. I would just need a litte instruction.
 serene scaffold
you can ask questions in this channel. but I won't look at screenshots of text
!code
arctic wedgeBOT
Here's how to format Python code on Discord:
```py
print('Hello world!')
```
These are backticks, not quotes. Check this out if you can't find the backtick key.
fervent lantern
This is what i have done. y_train is just the column with the churn (boolean)
x_train is everythwing but the churn
I normed every value after that for x_train
serene scaffold
I don't know what you're referring to.
fervent lantern
The image above
serene scaffold
I do not look at screenshots of text.
fervent lantern
x_train         = x_train.drop("vertrag_abgewandert", axis = 1)

y_test          = x_test['vertrag_abgewandert']
x_test = x_test.drop("vertrag_abgewandert", axis = 1)```what dataframe did all of this come from, before you created x/y and train/test
fervent lantern
a dataframe out of a xls for telecom users
give me a sec

and a column named churn
serene scaffold
I have to go. Sorry
fervent lantern
okay thank you for your help
 long widget
Is opencv good to use for object tracking / motion detection when having a series of images?
 brazen basin
does this channel come under data analytics?
 gilded idol
Hi everyone, I have a probably very simple question: Usually, the input matrix for a neural network is in the form, that the y-Axis has the features of one input, and the x-Axis describes multiple batches, right? Sorry if that's a stupid question, just reading an example where it seems reversed, so I'm a little confused.
serene scaffold
brazen basin
does this channel come under data analytics?
if you're doing it with python, yes.
serene scaffold
gilded idol
Hi everyone, I have a probably very simple question: Usually, the input matrix f...
the leftmost dimension of the input is the batch size
unless the batch size is fixed
gilded idol
Oh ok, so for example in a 2d input array, the first row would be the features of the first sample? Not the first column, right?
serene scaffold
gilded idol
Oh ok, so for example in a 2d input array, the first row would be the features o...
that's usually how it is, yes
gilded idol
I was watching the 3blue1brown videos on neural networks, and it seems he did it the other way around. Or I understood it wrong. Thanks for clarifying! 🙂
serene scaffold
gilded idol
I was watching the 3blue1brown videos on neural networks, and it seems he did it...
I'm just talking about conventions. I can't guarantee that what you're looking at is the way I said.
gilded idol
Yeah, I was just confused because I was also looking at a textbook that had it the other way around. I'm trying to write a neural network from scratch, so I guess I rather follow the convention (which is also what's in the textbook)
hasty mountain
Guys, can someone give me some help in Diffusion Models?
I've been testing a model with an embedding layer + 10 conv layers using a dataset composed of RGB images with dimensions 16x16, however, after more than 500,000 iterations, I still can't get anything different from random noise.
These are the functions I'm using:
def noiser(input_image, time_step, alpha=0.99):

    alpha = torch.tensor([alpha**(time_step*10)])
    gaussian_noise = torch.randn_like(input_image)
    noised_image = (torch.sqrt(alpha) * input_image) + (torch.sqrt(1-alpha) * gaussian_noise)

    return noised_image, gaussian_noise

def sampler(noised_image, predicted_image, time_step, alpha=0.99):
    '''DDPM'''

    z = torch.randn_like(predicted_image, device=device)
    sigma = torch.var(z)

    alpha = torch.tensor([alpha**(time_step*10)], device=device)

    denoised_image = 1/torch.sqrt(alpha) * (noised_image - (((1-alpha)/torch.sqrt(1-alpha)) * predicted_image)) + (sigma * z)

    return denoised_image
math books will have it as you say, where each column is one observation of all the features. for whatever reason, software libraries prefer doing it backwards
probably to have the dimensions match the usual "left to right" drawing of neural network diagrams, whether the convention when applying transformations in maths is to compose from the left
gilded idol
wooden sail
math books will have it as you say, where each column is one observation of all ...
Ok, thanks for the clarification! I guess, in the end it doesn't really matter - it just seems to change the order in which you have to do the dot product and when you have to use the transpose of a matrix
wooden sail
yep
 vast lintel
Is there a direction someone can point me to learning to build a network along the lines of generating descriptive or analytical text, from 1 to a handful of images? I have heard the term image captioning and was thinking more along the lines of something heftier to train.
 fallen crown
Hi, I am running my AI for training on my computer, do you know if it's possible to train AI on an arduino to avoid using my computer CPU ?
 mild dirge
I've used arduino for running the model, but training is often a bit more intensive. Eventually it depends on the amount of ram you have and how big your model is. @fallen crown
fallen crown
that's my snake AI
fallen crown
mild dirge
I've used arduino for running the model, but training is often a bit more intens...
12 inputs, i am at 121 epoch and each epoch is 400 snakes
3 output
fallen crown
mild dirge
I've used arduino for running the model, but training is often a bit more intens...
so it's possible ?
but how good is the processor of an arduino to run the training
 cerulean glacier
With this model:
model = Sequential([
    layers.Rescaling(1/255, input_shape=(img_height, img_width, 3)), # RGB to BW
    layers.Conv2D(16, 3, padding='same', activation='relu'),
    layers.MaxPooling2D(),
    layers.Conv2D(32, 3, padding='same', activation='relu'),
    layers.MaxPooling2D(),
    layers.Conv2D(64, 3, padding='same', activation='relu'),
    layers.MaxPooling2D(),
    layers.Flatten(),
    layers.Dense(128, activation='relu'),
    layers.Dense(3)
])
When I attempt to train it, I get this error: ValueError: Shapes (None, 3) and (None, 1) are incompatible
Can someone help me find out what's wrong? Sorry if this is a basic question, I'm rather new to this.
wooden sail
fallen crown
but how good is the processor of an arduino to run the training
the processor is very slow, but the biggest problem you'll have is the limited memory
make sure the model itself fits in the first place
and the data will probably have to be generated on the fly
serene scaffold
cerulean glacier
With this model:
```py
model = Sequential([
layers.Rescaling(1/255, input_sh...
can you show the whole error message
cerulean glacier
Sure.
Pastebin
Pastebin.com is the number one paste tool since 2002. Pastebin is a website where you can store text online for a set period of time.
serene scaffold
cerulean glacier
Sure.
thanks. be sure to just always show the whole error message--it's easier to ignore the parts that aren't important than to wait for parts that are.
fallen crown
wooden sail
the processor is very slow, but the biggest problem you'll have is the limited m...
ok and is there a solution to train an ai, because at that moment i am using 50% power of my CPU, that makes my computer very slow for all others tasks like youtube
wooden sail
training is usually done on a compute cluster
a free solution for small models is google colab
serene scaffold
cerulean glacier
With this model:
```py
model = Sequential([
layers.Rescaling(1/255, input_sh...
is this with keras? it looks like a pair of two adjacent layers are incompatible, but I can't tell which two. it might be the last two.
cerulean glacier
It is with Keras. I modified this code from a tutorial on the documentation.
It works with their dataset, but when I swap mine in, this error occurs.
mild dirge
Could it be that the label is 1 feature, but the output is 3?
serene scaffold
^ that makes sense to me
mild dirge
Since it happens at training
cerulean glacier
mild dirge
Could it be that the label is 1 feature, but the output is 3?
I'm sorry, could you elaborate a bit more?
mild dirge
Could you print the shape of the labels that you use for training?
It might be that each label has only 1 feature, but the output of your model is 3 features per datapoint label
cerulean glacier
By labels you mean classes, right?
mild dirge
Yeah sorry, I'm wording it weirdly
But if you do classifcations, that would correspond to 1 class then
cerulean glacier
This is the output of train_dataset.class_names: ['hydrangea', 'musk_thistle', 'reed_canary_grass']
 weary vigil
Hello? Is anyone proficient at merging in Pandas?
serene scaffold
weary vigil
Hello? Is anyone proficient at **merging** in Pandas?
always ask your actual question. don't ask for an expert.
weary vigil
I have 2 dataframes:


The second is a lot smaller, and contains ~5000 unique Customer Keys
Each dataframe has a State Code column
I am trying to distribute those ~5000 Customer Keys to the big (top picture) dataframe using a pd.merge()
serene scaffold
so customer keys and state codes are the same thing?
weary vigil
HOWEVER not working because multiple customers have the same state code (obviously)
weary vigil
serene scaffold
so customer keys and state codes are the same thing?
Customer Keys = "Cust Key"
serene scaffold
okay, so customer keys are not state codes.
weary vigil
weary vigil
I am trying to distribute those ~5000 **Customer Keys** to the big (top picture)...
this is the problem ^
serene scaffold
which two columns are the same thing in the two dataframes?
serene scaffold
are there any other pairs of columns that are the same thing?
try
pd.merge(df, cust, left_on=['State Code', 'Store City'], right_on=['State Code', 'Cust City'])
Thank you. Tried - however there are more Cust City values than Store City values
(164 vs 177)
serene scaffold
if there aren't matches for every row in both dataframes, then that's that. you can either drop those rows in the new dataframe, or let them be filled with NaN values.
weary vigil
State Code values match
serene scaffold
I am trying to distribute those ~5000 Customer Keys to the big (top picture) dataframe using a pd.merge()
you might be talking about the cross product, but I don't know what you intend "distribute" to mean.
pd.merge(df, cust, left_on='State Code' right_on='State Code', how='cross')
if you do this, then every pair of rows with the same state code will be matched.
so if there are 5 rows in df with a state code of 7, and there are 8 rows in cust with a state code of 7, then you'll have 5 * 8 rows with a state code of 7 in the final df
because each pair in the cross product will be merged.
weary vigil
that's interesting
and i appreciate the explanation, but i want to keep the # of columns in df the way it is
serene scaffold
well, I still don't understand what you want to do, then.
weary vigil
Basically

Add a NEW COLUMN to this DataFrame, each row having a corresponding Cust Key to the State Code
Maybe I make a dictionary and do some probability stuff
serene scaffold
each row having a corresponding Cust Key to the State Code
how do you know what Cust Key maps to which State Code?
weary vigil

because of the second dataframe.
Cust Key goes from 1 to ~5000
all unique values - each corresponding to 1 of 37 state codes
Does that make sense
serene scaffold
It does not, sorry. All I can suggest is that you merge on the State Code column. If that isn't what you're trying to do, the two of us just don't have the shared vocabulary needed to have meaningful dialogue.
 cosmic lynx
How heavy would a simulation of a small village (around 10-20 agents) be if I was trying to see what kind of personalities would arise in response to events?
mild dirge
Seems like a really open ended experiment. There are so many different ways to simulate that
cosmic lynx
I assume most of them would require a decent amount of computing power then?
I’m a little worried this kind of project would be quickly be more then my available hardware (16 GB ram, 2.5 Ghz processor) could feasibly do...
mild dirge
You can easily simulate some version of that experiment with that hardware
But again, the experiment description is just really open. How are the people even represented? With full neural networks the size of real human brains, or maybe just a list of a few integers representing their personality traits?
cerulean glacier
Hello, I tried transfer learning my model on inception v3, but my results were worse than without transfer learning. Is there a reason why this occurs? (I've tried both freezing the model and leaving it unfrozen).
cosmic lynx
mild dirge
But again, the experiment description is just really open. How are the people ev...
When you put it that way, I think I might have been overthinking it, thanks.
charred light
I'm tasked to use one way analysis to determine the top 5 categories in a given feature. (I'm assume one-way analysis = one-way ANOVA, been a while since I used ANOVA for anything.)
So, am I essentially testing => H0: All groups have equal effect on the dependent var or μ1 = μ2 = μ3 and H1: At least one age group is significantly different.
Doesn't this only tell me that there is a difference? How would I continue to tell which specific categories are more predictive than others (i.e. Rank them)?
prime hearth
hello, i would like to please is it okay to use neural network for binary prediction with NLP categorical features? Because after performing bag of words or tfidf i get at least 4000 features, and the rest of the features are numerical from original dataset
mild dirge
4000 features is quite a bit. You should really keep the model as simple as possible to prevent overfitting. You could also cut down the amount of features by taking f.e. Bag of words of the 100 most common words.
But maybe less common words tell you more about the class than common words. You could check for each word if there is a difference of occurrence amount for both classes, and keep them if this difference is high enough f.e.
There are also some other ways of reducing dimensionality, you should look into that
@prime hearth
hasty mountain
Hey guys, I'm trying to make a Variational AutoEncoder, but I'm having a problem with optimization.
After some iterations, the Encoder Loss(which is a KL-Divergence, usually with values around 0.2~0.5) simply explodes to a big number(billions), while the Decoder Loss(MSE) stays normal around 0.5~1.
Does anyone have an idea on how to solve this?
prime hearth
@mild dirge thank you and im still a beginner doing a current NLP project for my resume. I am aware of techniques like principal component analysis but am tryying to avoid that. So you suggest i use limit bag of words or tfidf?
when I limit features to 100 , i get errors from sklearn.metrics import accuracy_score
mild dirge
I haven't heard of tfidf myself, but it seems to be some way of extracting the more useful words. I'm not sure about PCA, but you definitely want to eliminate some features here.
prime hearth
the error is values are too large or Nan to find accuracy score if i limit features to 100
oh okay thanks
 6   model = classifier.fit(x_train,y_train)
      7   predicted = model.predict(x_test)
----> 8   acc = accuracy_score(y_test, predicted)
      9   print("model: {} , score: {}".format(model_names[i],acc))
     10   i+=1

3 frames
/usr/local/lib/python3.8/dist-packages/sklearn/utils/validation.py in _assert_all_finite(X, allow_nan, msg_dtype)
    112         ):
    113             type_err = "infinity" if allow_nan else "NaN, infinity"
--> 114             raise ValueError(
    115                 msg_err.format(
    116                     type_err, msg_dtype if msg_dtype is not None else X.dtype

ValueError: Input contains NaN, infinity or a value too large for dtype('float64').
Well there might be nans or infs in your output
Maybe the model weights have exploded somehow
prime hearth
in my prediction it seems so , do you have any idea how I can fix this?
my options im thinking is maybe increase features by a bit or just analyse the data predicted from the model and figure out why it coming out so high
mild dirge
You should probably start with a very basic baseline model, like logistic regression if you only have 2 classes
See what kinda results you get with that
And then try more complicated models
prime hearth
this is what i have:
models= [KNeighborsClassifier(n_neighbors=63),KMeans(n_clusters=2),LogisticRegression(random_state=42,penalty="l2"),svm.SVC()]
# run model in loop and check score.
model_names = ["KNN","KMeans","Logistic Regression","SVM"]
from sklearn.metrics import accuracy_score
i=0
for classifier in models:
  model = classifier.fit(x_train,y_train)
  predicted = model.predict(x_test)
  acc = accuracy_score(y_test, predicted)
  print("model: {} , score: {}".format(model_names[i],acc))
  i+=1
How are you pre-processing/normalizing the bag of words inputs?
Are you even normalizing them"?
mild dirge
prime hearth
this is what i have:
```python
models= [KNeighborsClassifier(n_neighbors=63),KMe...
This is good, you are trying some more basic models
Which model gives the error?
prime hearth
so my data consist of three features,
rating score of business type integer, reviews of the business type string, and if business is recommended or not type integer binary 1 for recommend 0 for not.
I do stopwords removal, lemmatization, lowercase, remove non english charaters, then do tfidf.
Next step is i perform tfidf which returns like shape 4800,9800 which creates like 900 new features or columns. I merge this is my dataframe so it has the business rating score and if recommended or not.
if i pass in max features of 100 to tfidf then i get the error above in the code. Let me check which model
ohhhh, my y_test has some Nan
i wonder why, since my original data doesnt have nan
mild dirge
Well that would give problems yeah 😛
prime hearth
i dropped all nan rows
mild dirge
You just extract 1 column from your original data though right?
Did you drop them inplace or reassign the value to the variable?
mild dirge
df.drop(...) only works if you have df.drop(..., inplace=True) or df = df.drop(...)
Did you do that?
prime hearth
oh what i did is :
feature_column = dataframe['target'].tonumpy()
nan_indices_2d = np.argwhere(np.isnan(feature_column))
nan_indices = nan_indices_2d.flatten()
df =df.drop(nan_indices)
i will just run my code from the beginning maybe it cache my result since im using google collab
mild dirge
Yeah could be
Imma head off to bed though, but gl, seems like you are at least close to fixing the problem 👍🏽
prime hearth
thanks!
prime hearth
Hello, i got an accuarcy score of 0.8 for my Support Vector Machine and 0.71 for my KNN model. I want to improve the accuracy, but would like to get pointed to the right direction,
will changing the way i process text improve the accuracy- trying n-grams, tfidf, bag of words?
Should i use grid search? i tried using regulazation in my model.
Should i try cross validation?
Other than that not sure how else to improve my model besides data analysis but i not sure how to perform for text data?
serene scaffold
prime hearth
Hello, i got an accuarcy score of 0.8 for my Support Vector Machine and 0.71 for...
what does the model do?
prime hearth
so its a binary classification, it predicts if a business will be successful or not dependning on these features: reviews and the review rating score.
my model has 102 features, 101 of them is the words from performing tfidf ( similar to bag of words, and the other is the rating score from the review
i already normalized the rating score since rating goes from 0-5 and cleaned my text data
im not sure if it worth trying to improve, what do you think? This is a for like a data science project portfolio, but i think part of the data science process is optimizing the model to do better at least from what youtubers said who studied machine learning so im jsut trying this and giving it a shot
but in short, how do you guys improve the accuracy of your model?
The only way i know is just maybe :
1.performing grid search for hyperparamter optimization
2.feature engineering but in this case i only have 2 features review rating and the text review, and NLP basics such as text cleaning.
3. cross validation to get optimal trainning data
I appreciate the response in advance...
 ivory knoll
Any advice for getting the peaks of a multi-modal distribution of float values in a list?
 echo parrot
Is there any way to store all data from an ai model in a json to the point where other ai’s can just detect the file and use it
That would be quite interesting if possible
agile cobalt
prime hearth
but in short, **how do you guys improve the accuracy of your model**?
The only w...
- cross validation to get optimal trainning data
that is not what cross validation is for, by any means - if anything, it's the opposite.
cross validation is used to see how well your model performs with different training data, but that is not to try to get the best - it is to see how much the results change based on what you feed it.
ideally the loss should not change a lot if at all, but if the results vary significantly, that may be a problem
serene scaffold
echo parrot
Is there any way to store all data from an ai model in a json to the point where...
depends on what the model is, but all the major AI libraries have ways of saving your models for future use, yes. that doesn't mean that "other AIs" can determine which files are models, or what they are for.
serene scaffold
prime hearth
but in short, **how do you guys improve the accuracy of your model**?
The only w...
but in short, how do you guys improve the accuracy of your model?
you can't make the question this short (and to be fair, you did give a longer explanation). there no one-size-fits-all solutions for just improving any model. if there were, people would just apply that until all models are prefect without being overfit.
echo parrot
serene scaffold
depends on what the model is, but all the major AI libraries have ways of saving...
What ai library would you recommend for that?
serene scaffold
echo parrot
What ai library would you recommend for that?
this is the wrong question to ask. what does the model need to do?
echo parrot
I’m trying to make the ai model decently fluent in English
But I wanna be able to store that for later use
serene scaffold
"fluent in English" in what context? you want it to be able to compose text a la the GPT family of models?
echo parrot
serene scaffold
"fluent in English" in what context? you want it to be able to compose text a la...
Kind of like chat gpt for example, you put in a prompt and it talks/answers back, but not quite chat gpt, I want it to be open source so you can basically just plugin the file to your model in a way, I know it’s probably a dumb idea but I’m quite new to ai creation so I wanted to create something like this
serene scaffold
echo parrot
Kind of like chat gpt for example, you put in a prompt and it talks/answers back...
it's not a dumb idea! but I do think it's an over-ambitious first project.
echo parrot
I like to start off big, so then once you get to the small stuff it seems like a piece of cake
serene scaffold
echo parrot
I like to start off big, so then once you get to the small stuff it seems like a...
that might work for some things, but for something like AI, you're probably going to give up before you make any reasonable progress.
unless you start small.
echo parrot
What might be something good to start off with, that I could build up to, to achieve this
serene scaffold
echo parrot
What might be something good to start off with, that I could build up to, to ach...
start off by making a binary classifier of some kind.
 vagrant oracle
what is the best way to learn ai and machine learning as a hobbyist
lapis sequoia
Hey I'am a beginner for python and I have this error

 desert pulsar
anyone made a recommender system or just experienced with making models? I am looking for some guidance when making my first nn
mild dirge
Again @desert pulsar , just ask the question or what problem you are having specifically so we can help
desert pulsar
Want someone to look over my work and tell me its probs bad
so i can improve

GitHub
Contribute to lachholland/two-tower-recommender development by creating an account on GitHub.
here is repo
Im implementing this https://medium.com/mlearning-ai/building-a-multi-stage-recommendation-system-part-1-2-ce006f0825d1 in pytorch
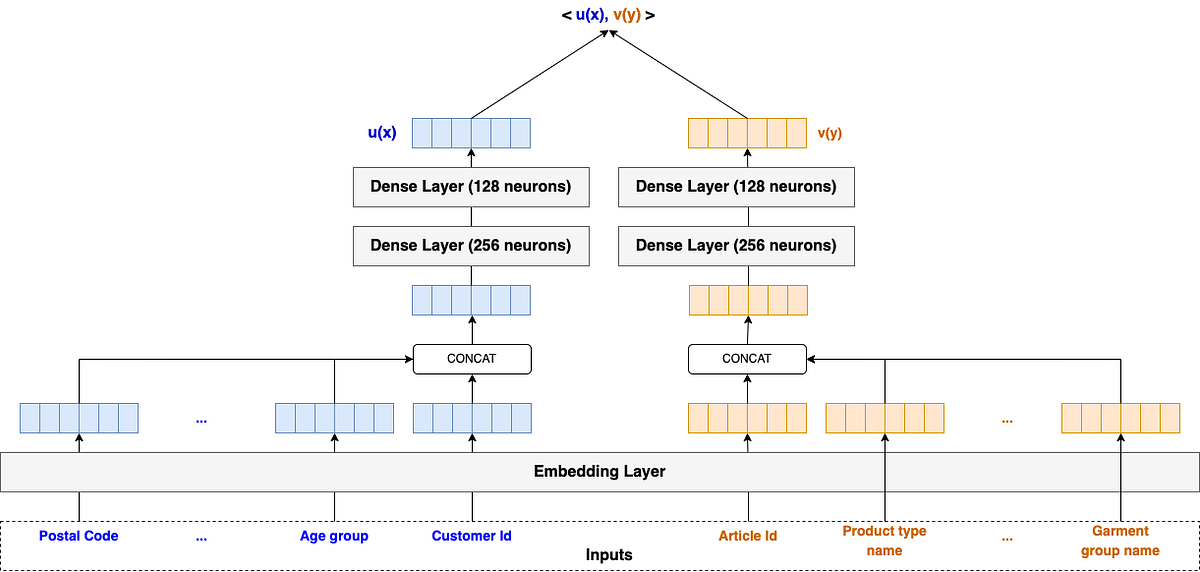
Medium
Implementation of the two-tower model and its application to H&M data
i have more up to date code can provide
Really just looking for someone who can be bit of a mentor
 bitter pilot
Hello Everyone, I am trying to build a Time Series Model using Facebook Prophet, I have a dataset which is the Energy Inflation in Belgium, on a monthly basies for the last years. I have read the documentation and I have played with hyperparameters, but the predicted values for the next months, are way too high
from prophet import Prophet
from prophet.plot import add_changepoints_to_plot
#dfBelgium = dfBelgium[['ds','y']]
m = Prophet(seasonality_mode='multiplicative',
mcmc_samples=300,
#yearly_seasonality=False,
daily_seasonality=False,
changepoint_prior_scale=0.5,
changepoint_range=0.8).fit(dfBelgium,
show_progress=False)
future = m.make_future_dataframe(periods=3, freq='MS')
future.tail()
Python
forecast = m.predict(future)
forecast[['ds', 'yhat', 'yhat_lower', 'yhat_upper']].tail()
Python
fig1 = m.plot(forecast)
a = add_changepoints_to_plot(fig1.gca(), m, forecast)

I am asking here, if someone has some experience with Time Series, and improve the model.
The reason I selected this dataset, its because I am personally affected by the energy crisis and I got very high invoices, but today, we received news from the newspapers that the Electricity has decreased its price per MHW from 300 euros, to 60 euros in the last 2 months, and I would like to be able to forecast this better.
mild dirge
bitter pilot
Hello Everyone, I am trying to build a Time Series Model using Facebook Prophet,...
Just my 2 cents since no-one has replied yet. I think it would be really hard to forecast this price, especially since the current energy crisis is probably not very similar to previous events. Time serie prediction works by learning from previous patterns, thus it might not be very accurate to predict the future if there are no similar patterns already in the data.
bitter pilot
mild dirge
Just my 2 cents since no-one has replied yet. I think it would be really hard to...
understood, thanks for the feedback.
 ruby depot
When i try to use predicted data to predict more data this happends, could anyone give advice about what can i do about it?

 young socket
        dist = Categorical(action_probs)

        action = dist.sample()
action_logprob = dist.log_prob(action)```This section takes up a lot of time in my simulation. Is there a way to write this so that it goes faster?
prime hearth
hello, i would like to please ask, is it okay to only do grid search for models that have higher accuracy vs doing grid search on all models?
mild dirge
I mean, the point of grid search is to see if a certain model with certain hyperparams has a good performance
So if you exclude them because you know their performance is bad, seems that you already included them
How do you know their accuracy if you did not include them in the grid search? 😛
prime hearth
ok thanks
 elfin oasis
@desert pulsar geeksforgeeks has some blog about this
 muted crypt
I have a serious question.
I have been proposed to do a thesis in machine learning about trajectory prediction of drone flights. The goal is to create an effective prediction of the real trajectory of the drone that is different from the planned one. They are providing me around 40 real flights with their info as well as the planned trajectories. The trajectories that the drones flew were similar, always with the same patterns (climb, turn, hover...). I really like the idea and I am thinking of doing it, but before that, I really want to make sure that it is doable. I'm not that experienced with machine learning but that's not the problem. What worries me is that I feel like the provided data is too low. Do you think it would be enough?
(i asked about this and they said that splitting the flights in different sets, like turns/climbs would make increase the data size as every flight does a few of these, however, this is a thesis and there is no guarantee that the asked goal is possible, it is research but I don't want to risk it)
mild dirge
That depends on how easily the future real flight data is predictable given the planned flight and previous real flight data.
And would also depend on how long the flights are and how much data is gathered* from each flight. is it just the positions?
muted crypt
mild dirge
And would also depend on how long the flights are and how much data is gathered*...
The flights are testing flights that last a few minutes. They are following a stablished path (as good as they can) which has random changes in trajectory, like increasing the altitude to a certain level, then turn, then stop for 5 seconds, then climb down... this sort of stuff to put it into test
mild dirge
And they said you can split the data to "increase the data size", that doesn't really make sense to me
It would add information as you may already seem to know the maneuver
But that is basically just it
muted crypt
mild dirge
And they said you can split the data to "increase the data size", that doesn't r...
I thought so too
mild dirge
How much have you dabbled in machine learning, and how long do you have?
muted crypt
mild dirge
How much have you dabbled in machine learning, and how long do you have?
Not for so long, I know the basics and I have like 4-5 months
mild dirge
basics as in how they actually work theoretically, or mostly just used tensorflow/pytorch etc?
I assume you have to explain some theory behind the model you use
muted crypt
mild dirge
basics as in how they actually work theoretically, or mostly just used tensorflo...
I have heard of these but I haven't worked with them. I'm just familiar with small projects, maily one that I did, which was similar, about also predicting airways taken by planes, I did all that with jupyter
muted crypt
mild dirge
I assume you have to explain some theory behind the model you use
yes, that's right
mild dirge
What model did you use, do you remember?
Was it a neural network, or linear regression or?
muted crypt
It's the bachelor thesis but I'm not a computer scientist or data scientist so I am not expected to be a master on that but it's part of the process and they mentioned something about clustering algorithms
muted crypt
mild dirge
Was it a neural network, or linear regression or?
linear regression
mild dirge
I'm not sure how useful clustering would be in this specific case
At least I didn't think of any way to use clustering, best case scenario you could even use rolling regression using previous values of actual/planned trajectory and future planned trajectory
And that might be able to predict the next actual trajectory position
Just the planned trajectory probably already tells a lot about the actual trajectory
If you want to explain how the models work you need to dig in a bit, especially if you plan on using neural networks. But I think this project would definitely be do-able, but it would be pretty specific to machine learning. So you'd need to learn a lot about that subject specifically.
 mental ivy
hello there, i recently installed demucs to try it out, but i stumbled upon two errors while trying to load a track.
PS D:\Trackseparation> py -m demucs "/Din låt defyer remix.wav"
C:\Users\user1\AppData\Local\Programs\Python\Python310\lib\site-packages\torchaudio\compliance\kaldi.py:22: UserWarning: Failed to initialize NumPy: module compiled against API version 0x10 but this version of numpy is 0xe (Triggered internally at ..\torch\csrc\utils\tensor_numpy.cpp:77.)
  EPSILON = torch.tensor(torch.finfo(torch.float).eps)
Important: the default model was recently changed to `htdemucs` the latest Hybrid Transformer Demucs model. In some cases, this model can actually perform worse than previous models. To get back the old default model use `-n mdx_extra_q`.
Selected model is a bag of 1 models. You will see that many progress bars per track.
Separated tracks will be stored in D:\Trackseparation\separated\htdemucs
Separating track \Din låt defyer remix.wav
Could not load file \Din låt defyer remix.wav. Maybe it is not a supported file format?
When trying to load using ffmpeg, got the following error: FFmpeg is not installed.
When trying to load using torchaudio, got the following error: Numpy is not available
This error was generated when i executed the command py -m demucs "/Din låt defyer remix.wav". Do anyone know what could cause this?
muted crypt
mild dirge
At least I didn't think of any way to use clustering, best case scenario you cou...
Seems like a solid idea, I'll look more into that topic
muted crypt
mild dirge
If you want to explain how the models work you need to dig in a bit, especially ...
Do you think neural networks would work better in this case?
mild dirge
muted crypt
Do you think neural networks would work better in this case?
neural networks is a very broad term. There are some specialized in time series data. Recurrent neural networks used to be really popular for it. Now there is some other stuff too, but you want to look into rnns.
muted crypt
mild dirge
neural networks is a very broad term. There are some specialized in time series ...
Recurrent neural networks, okay that's completely new to me but I'll believe you here and see if I can take this approach
So yes, if that sounds doable, I might as well take the chance
 violet gull
Mk so if a dense layer takes in a list of numbers and the convolution outputs a list of feature maps and each feature map is a list of numbers….. square no fit in circle hole ????
muted crypt
mild dirge
neural networks is a very broad term. There are some specialized in time series ...
That's an example of the data

Above the planned, below the real trajectory (top view and vertical profile)
So from the upper data, sort of predict the data from below
prime hearth
Hey guys is it okay if my model accuracy after cross validation is 0.7?
I not sure if this is consider good to put on resume for data science beginner looking for internship. The data i got is through webscrapping and api to predict if a business will be successful based on number of reviews and text reviews
agile cobalt
for an internship, I'd probably be less concerned about the results itself than whenever the applicant understands the process well
unless they go as far as reviewing your code, the results may as well mean nothing
definitely take my word with a lot grain of salt though
 jolly rivet
Hallo everyone, i wanna ask something. If somebody know, please teach me ho to do. So i have project to take picture on frame, using opencv.
But i want to take picture only on green frame(identification_card) not all of camera frame.
How must i do?
Here is link picture : https://ibb.co/5Lw6vQv
 queen cradle
muted crypt
So from the upper data, sort of predict the data from below
queen cradle
muted crypt
So from the upper data, sort of predict the data from below
If you have no input except the planned trajectory, I would not recommend this problem. It may be possible to make some headway if you have enough data. 40 real flights are likely not enough. Splitting the data is useless and will not help you. Also, judging from the example you provided, it looks like a classical smoothing question. I don't think machine learning would be effective for this.
 gleaming mortar
hey all, looking for help with Excel using openpyxl/pandas/xlsxwriter. my question is quite simple: I have code that within a workbook writes a formula to a range of cells. I need to then remove that formula and leave just the values remaining. I have not found any solutions to this as most online questions have stated to load the workbook with the "data_only=True" parameters in the openpyxl.load_workbook() line at the start. the issue is that the formula is being written within the code that is executed, and is not present beforehand
 cinder schooner
So I started a competition on kaggle for the first time, but im having an error only on submission time and I can't seem to find it. I tried changing the batch size but its not the problem. How do you go on debuging such a problem when you don't have error logs or something?
muted crypt
queen cradle
If you have no input except the planned trajectory, I would not recommend this p...
I have the planned and the real trajectory obtained from the real flights. I think I can maybe get a few more flights (planned + the real flown trajectory) but maybe just enough to double the 40 flights. And what they want is to be able to provide a flight plan and predict the real trajectory as good as possible, so from that the flight could be adjusted to fly more precisely to the flight plan
mild dirge
THere is a typo I think, liar->linear. I still don't fully understand why weight decay makes the activation function more linear.

I understand it restricts the norm of the weight, but how does this taylor expansion show that the activation function is more linear
 tidal bough
mild dirge
THere is a typo I think, liar->linear. I still don't fully understand why weight...
tidal bough
mild dirge
THere is a typo I think, liar->linear. I still don't fully understand why weight...
If x is small enough, you can disregard the higher-order terms because they have higher powers of x.
mild dirge
Aah, right, that makes total sense thanks
queen cradle
muted crypt
I have the planned and the real trajectory obtained from the real flights. I thi...
Oh, so what they want is quite different from the proposed project. What they're asking for is an https://en.wikipedia.org/wiki/Optimal_control question. You will probably get good results with standard techniques; a good first bet is a https://en.wikipedia.org/wiki/PID_controller. Ask them whether they have investigated this; if not, then I would say that would make a good project.
vast lintel
Is there someone with experience in training Resnet-50 for a different set of images? I was hoping to train it for a set of images of a different type and have its output represent the associated categories for that different set of images, but am a bit lost as to how I would change those 2 things. I am currently having a look at the following to get an idea : https://datagen.tech/guides/computer-vision/resnet-50/
ResNet-50 is a 50-layer convolutional neural network (48 convolutional layers, one MaxPool layer, and one average pool layer).
mild dirge
You should be looking at transfer learning
This is where you take a model trained on some distribution of data (for example animals images) and want to use it for a similar but different distribution (images of birds).
vast lintel
Problem I was hoping to train it something like graphs
mild dirge
The idea is that you could use the earlier layers of the model, f.e. jsut the convolutional/pooling layers to extract features, but you change the later layers of the models.
graphs?
mild dirge
and what would it output?
vast lintel
Whether say, the categories (in a boxplot) matched or not, etc
mild dirge
Still seems kinda vague, is it a binary classification?
Or do you want different output for different graphs?
vast lintel
I was hoping to do something along the lines of different outputs for different graphs.
And then I was going to try chaining that with an RNN to create captions
mild dirge
So maybe a model that separates the types of graphs, and then a model per graph type to get the output that you desire?
vast lintel
Yes
mild dirge
Not sure about that rnn part, what would it base the title on?
vast lintel
Title?
mild dirge
yeah caption
vast lintel
The caption would describe whether the categories matched or not - for a start?
mild dirge
Normally the caption for these kinda graph explain some stuff about the set-up and background stuff, not just, this average is higher than the other.
vast lintel
Yerp, so that contextual information
mild dirge
mild dirge
So maybe a model that separates the types of graphs, and then a model per graph ...
But you could just set a generic title for each output you get from the second model here
I wouldn't immediately jump to an rnn generation of a caption
vast lintel
I was hoping to be done by combining user input
with the captions
to generate text
mild dirge
hmm, right
If I were you I would first do the graph classification model and then the models per graph. and then see if you still want to do such an rnn.
vast lintel
But one thing at time yknow? Been thinking about trying to build something like this for awhile. I understand if at all possible, it would be a process
Yeap
So it would be 2 CNNs is what you are suggesting?
Is it not possible to just create a list of categories and there being say, 2 for each type in the final vector?
mild dirge
More than 2
vast lintel
for each type I mean
mild dirge
1 for the separating of graph types. And then a model to get the "result" of the graph per type
So depends on how many different types of graphs you have
vast lintel
Indeed
muted crypt
queen cradle
Oh, so what they want is quite different from the proposed project. What they're...
Well yes, that wouldn't be on me though. They would do the control part with the controllers, but to do it, they need the predicted trajectory, which I have to obtain
vast lintel
So again, I could do this with Resnet 50 and retrain it perhaps? Or is that the wrong idea?
mild dirge
Resnet likely does not have the exact architecture that you want
vast lintel
Ah
mild dirge
But you could modify the images to match the input dimensions of the model. And you could "chop" of some later layers, add new fresh layers and only retrain those newly added layers.
vast lintel
Only going off of the link I am reading
So when I import Resnet 50, it is already fully trained? But removing the final few layers and trying to retrain based off of that would be the idea?
mild dirge
resnet50* does have 20 mil ish params from what I see
Should be alright if your have a decent-ish pc, but prob can't run on a arduino or potatoe
vast lintel
iirc you can just adjust the number of "categories" in the final vector to accomodate the number of types I want yeah?
queen cradle
muted crypt
Well yes, that wouldn't be on me though. They would do the control part with the...
Then I'm back to thinking this is not a good project. The actual flight trajectories will depend on the mechanical characteristics of the drone. You will probably have an easier time predicting those from knowledge about the drone than any data about the flight path.
mild dirge
vast lintel
iirc you can just adjust the number of "categories" in the final vector to accom...
Some modules do allow that for their implementation yeah
Could also do it manually if you want to have more control over the process
vast lintel
pretrained_model_for_demo= tf.keras.applications.ResNet50(include_top=False,

                   input_shape=(180,180,3),

                   pooling='avg',classes=5,

                   weights='imagenet')```

Oh lmao ``classes``Seems editable right here I reckon?
mild dirge
Yeah seems so
vast lintel
But this seems to be pretrained from imagenet database I guess