#data-science-and-ml
1 messages · Page 39 of 1
 rancid sorrel
 steady basalt
Let’s say you generate a bunch of data every second
You need to code how to make it go thru ur model?
rancid sorrel
i just need to deal with how a AAN handles the inputs/outputs and parses them to classes
steady basalt
And then where to send results
rancid sorrel
yeah thats baiscaly it
steady basalt
Literally just scripting on the basic level
rancid sorrel
some general guide for handling the input/output
rancid sorrel
no ill have to train one, but thats not so much my issue at this point
steady basalt
Ok and then use pickle file right?
 mint palm
can i please get explanation for this "1.5", i dont understand how they can get "0.5"
 steady basalt
mint palm
can i please get explanation for this "1.5", i dont understand how they can get ...
steady basalt
mint palm
can i please get explanation for this "1.5", i dont understand how they can get ...
Maybe they just mean it as a rare thing
rancid sorrel
mint palm
can i please get explanation for this "1.5", i dont understand how they can get ...
wait one ill get my notes
steady basalt
Rate
rancid sorrel
its to do with the mathmatics of the CNN shinra
steady basalt
Maybe they didn’t want to say 3 every 2 seconds 😂
rancid sorrel
 mint palm
my understanding if following:
- resnext101 takes multiple frames(8 usually), probably thats why they say 3d. and frequency of persecond could mean they sample 8 frames in 1 second.
- resnet152 in 2d because i think it takes 1 image at a time.
rancid sorrel
its this formula basicaly
mint palm
but 1.5 still doesnt make sense to me
rancid sorrel
your dealing with the conveultion layer of a nurel network
so you need to read up on how that works mathmaticaly

Discrete convolutions, from probability, to image processing and FFTs.
Help fund future projects: https://www.patreon.com/3blue1brown
Special thanks to these supporters: https://3b1b.co/lessons/convolutions#thanks
An equally valuable form of support is to simply share the videos.
Other videos I referenced
Live lecture on im...
or this one <https://www.youtube.com/watch?v=O2CBKXr_Tuc
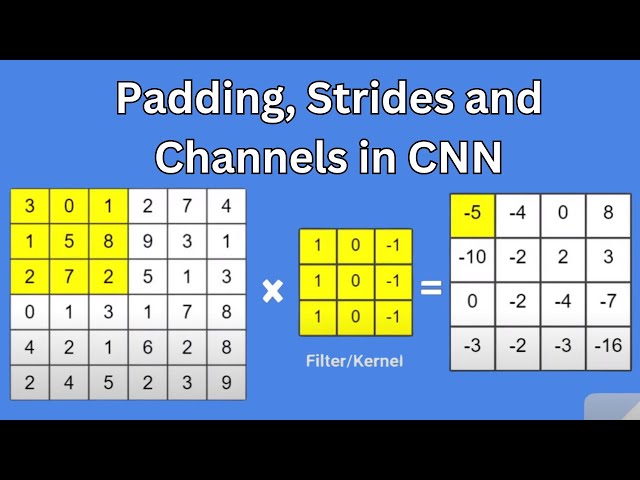
"Second video in the Convolutional Neural Network Series
Video discusses about Filters, Strides , Padding and Channels in depth as they form the basis of CNN. Video will help students build an idea about terms in CNN and will strengthen their concepts."
Blog - https://studygyaan.com/
Video by
Nanda Kishor M Pai
nandakishormpai@gmail.com
mint palm
i know these concept
steady basalt
It isn’t intuitive going off of cnn basics still …
Dudes asking why they’re generating half a feature
mint palm
steady basalt
Maybe they didn’t want to say 3 every 2 seconds 😂
they meant this lmao, 3 feature from frames of 2 second
dammmmmmm that was deep authors
steady basalt
Yeah what else could it be tbh
 dense crane

i ve used the interpolation method to replace the empty data (red circle)
is that fine?
or should i find something else?
and this data depneds from the date
 mild dirge
It looks like you have just used linear interpolation
Which does not look a lot like the patterns found in your data
Can you not just leave it out entirely?
@dense crane
dense crane
mild dirge
Can you not just leave it out entirely?
i mean it is a part of the task
mild dirge
Alright, well I doubt this would be a good approximation of the data in that range, do you have a lot of data like this?
Maybe you could apply a rolling window regression to approximate those values
But if you think it is not too important and don't want to invest over an hour on this, just use linear interpolation*
dense crane
mild dirge
Alright, well I doubt this would be a good approximation of the data in that ran...
i have 2 cities and for each 3 variables but only in this case is that huge lack in data
dense crane
mild dirge
But if you think it is not too important and don't want to invest over an hour o...
ok thanks
 whole cloud
Hi all, has anyone ever had experience with the pandas.DataFrame.sample 'random_state' parameter before? https://pandas.pydata.org/pandas-docs/stable/reference/api/pandas.DataFrame.sample.html It's a parameter that let's you set a seed value in order to make my results reproducible, issue I am having is that even after doing 'random_state=123', I still get random results. Thanks.
mild dirge
Random as in?
whole cloud
Random as in randomly selecting rows from a dataframe
mild dirge
Right, but it is selecting different rows when you run the exact same code even when setting that seed at the start of your code?
 whole cloud
 mild dirge
Oh right
you are showing the result of df.sample(5)
Not the one with the seed
do print(df_5) instead of the df.sample(5)
mild dirge
bruh
whole cloud
You're a life saver!!!!! I've been looking a this for an hour haha. it is 11pm here
mild dirge
haha nws
 slate hollow
https://www.cc.gatech.edu/classes/AY2021/cs4650_spring/slides/lec5-nn.pdf
so i'm looking at these slides

this is slide #39, the part i'm weirded out by is the part underlined in green
why's y'_e 0.2055
because 0.17 * (1-.17) is far from that
 velvet dirge
Im trying to train yolov7 object detection algorithim on my custom dataset on google colab bubt i get this error no matter what i do. Any ideas?
  File "train.py", line 616, in <module>
    train(hyp, opt, device, tb_writer)
  File "train.py", line 363, in train
    loss, loss_items = compute_loss_ota(pred, targets.to(device), imgs)  # loss scaled by batch_size
  File "/content/yolov7/utils/loss.py", line 585, in __call__
    bs, as_, gjs, gis, targets, anchors = self.build_targets(p, targets, imgs)
  File "/content/yolov7/utils/loss.py", line 757, in build_targets
    matched_gt_inds = matching_matrix[:, fg_mask_inboxes].argmax(0)
RuntimeError: indices should be either on cpu or on the same device as the indexed tensor (cpu)
 steel burrow
Hi everyone, I have a question what’s the best roadmap in how can I learn python I want to be a data science and Analysis
 dusk tide
Hello, I have been trying to train model on TPU using the Kaggle guide. But I have been encountering with an error during training. I have created TF Records then I used TPU code from here https://www.kaggle.com/code/philculliton/a-simple-tf-2-1-notebook/notebook . Also the TF Records created are correct because I have verified them https://www.kaggle.com/code/cdeotte/how-to-create-tfrecords. Please have a look in my notebook here https://www.kaggle.com/code/nishchay331/skincancertpu2

Explore and run machine learning code with Kaggle Notebooks | Using data from Flower Classification with TPUs
Explore and run machine learning code with Kaggle Notebooks | Using data from Skin Cancer MNIST: HAM10000
 fickle hinge
Hey, im working on a flight delay prediction project
I needed some help, can someone pls help me out
I am not really getting a good f1 score, so i want to know if there is an error in the dataset
 bold timber
Hello guys, now I'm studying text data with tensorflow. But I have a question that makes me confused: Whether [UNK] or OOV value will also train in the model?
or the model will ignore that value?
 fresh tiger
Hey! I know its been quite some time since I asked this, but I just wanted to confirm: After retraining the model with the new data, would I evaluate again on the data used for evaluating the model before rettraining?
For example:
- I have model A currently in use.
- I evaluate model A with the last 50 entries in my database
- I trigger a retraining with my entire dataset-last 50 entries
- Evaluate new model B with the last 50 data entries
- Compare last 50 entries evaluation results from model B with model A to determine if it should be deployed
In the last step, would I compare the eval results from the last 50 data points, or should I use the entire model accuracy that I receive from retraining the model?
 wooden sail
that sounds reasonable
fresh tiger
Alright perfect, thanks!
mild dirge
fresh tiger
Hey! I know its been quite some time since I asked this, but I just wanted to co...
Would you not evaluate on the same set you trained on then? @fresh tiger
wooden sail
i think they mean the last 50 samples are used only for evaluation of A and B, not for training
fresh tiger
Yes ^ What Edd said
mild dirge
Ah, coolio
 teal flame
@young granite using that command will redownload that python version,right? I dont want to redownload it, just change it to the version already installed(have some libraries on the 3.10 version installed )
rancid sorrel
how do you export a Dtree to a file?
from sklearn.tree import DecisionTreeClassifier
from sklearn import tree
tree.plot_tree(model[1])```will draw the tree but how do i export it to png/pdf?
 tidal bough
rancid sorrel
will draw the tree but how do i export it to png/pdf?
tidal bough
rancid sorrel
will draw the tree but how do i export it to png/pdf?
plot_tree uses matplotlib, so just use matplotlib.pyplot.savefig
rancid sorrel
ic.
weird i get not defined
from matplotlib import pyplot as plt matplotlib.plt.savefig('dtree.png')
dusk tide
If anyone has ever worked with TPU . I need help.
tidal bough
rancid sorrel
``from matplotlib import pyplot as plt
matplotlib.plt.savefig('dtree.png')``
well, you aren't importing matplolib, but plt directly, so use plt.savefig
rancid sorrel
um how?
tidal bough
uh, just plt.savefig instead of matplotlib.plt.savefig?
 queen cradle
fresh tiger
Hey! I know its been quite some time since I asked this, but I just wanted to co...
queen cradle
fresh tiger
Hey! I know its been quite some time since I asked this, but I just wanted to co...
This is probably not a good idea. By evaluating the model on the last 50 database entries, you are implicitly assuming that those entries are representative of all future inputs. Since the last 50 entries are probably close together in time, this is the same as an implicit stationarity assumption on your data.
My feeling is that automatically remodeling is likely to be a bad idea; if your model is valuable, then a human being should probably look at it before you deploy it. But if you really want to do this, then I suggest that you withhold a random 10% of your data as testing data instead of your last 50 entries. In order to have fair comparisons, you will have to track the entries withheld from model A so that you can also withhold them from model B.
rancid sorrel
Last 300 inputs sure
30-50 is like the minimum sample size for any stay evaluation however your in really crap accuracy territory
 patent lynx
I mean couldn't you just bootstrap the data?
queen cradle
You could. But the original question was about evaluating on recent inputs, and that's a much worse procedure than bootstrapping.
 ashen gazelle
||when you find out https://github.com/Nawor3565/Spaghentai-Bot||

⚠️ repo has link to an nsfw website
 fallen crown
Hi, I have been working on neural network and maths equation since 3 weeks, I succesfully implemented my first neural_network from sratch
I am looking for which module and which function are used to visualize dynamically like that

is plotly ? Does anybody already did that ? thank you
my network is 2 hidden layers (26*26)
When I used to do basic logistic regression (with only one percetron) on datas that could be separated linearly, i had 2 entries x1 and x2 with weights w1 and w2, my equation for decision boundaries was x1*w1 + x2*w2 + b = 0
but for here I have 26*26, I don't find the equation for decision boundaries....
 magic karma
Hi, currently I'm working as golang developer , But I have around 2 hours free time per day , I like to learn ml and deep learning I already have some familiarity with keras and pytorch If someone need a intern for ml he can massage me I will work for free
mild dirge
fallen crown
but for here I have 26*26, I don't find the equation for decision boundaries....
I'm not sure how this is normally done, but you could just check the result for every 2d input in a certain range. This gives you a 2d matrix with booleans, which you could use something like opencv for blob detection and getting the boundary
 runic lodge
How to get started?
 serene scaffold
runic lodge
How to get started?
serene scaffold
runic lodge
How to get started?
Remember that you can start, but depending on where you want to get, it might take years, if you get there at all
Anyway, I would start with a book
!resources data science
 arctic wedgeBOT
Resources
The Resources page on our website contains a list of hand-selected learning resources that we regularly recommend to both beginners and experts.
runic lodge
serene scaffold
Remember that you can start, but depending on where you want to get, it might ta...
I just wanna make a simple ai
To make a least distance travelled sequence from inputted places
Like where to go first and where to next, to shorten walk time
Idk if that would really be simple
Thx
queen cradle
runic lodge
I just wanna make a simple ai
To make a least distance travelled sequence from i...
 merry reef
To anyone who installed Pytorch-nightly (v2.0) between Dec 25th and 30th, see https://pytorch.org/blog/compromised-nightly-dependency/ and run python3 -c "import pathlib;import importlib.util;s=importlib.util.find_spec('triton'); affected=any(x.name == 'triton' for x in (pathlib.Path(s.submodule_search_locations[0] if s is not None else '/' ) / 'runtime').glob('*'));print('You are {}affected'.format('' if affected else 'not '))" to see if your machine was infected or not!
Pytorch-nightly had a supply chain attack via a pip dependency confusion vulnerability (the torchtriton package, https://pypi.org/project/torchtriton/ (no longer on pip)). The malware steals credentials++.
Calling history | grep pytorch.org/whl/nightly shows if it was installed at some point but not when. Calling python3 pip-date.py | grep torchtriton (https://github.com/E3V3A/pip-date) should tell the date of installment afaik but doesn't work on venvs sadly. This fork attempts to do that https://github.com/Poil/pip-date but it lags behind upstream so I don't know how bugged it is. 🤞
A mod or admin might want to @ people tbh.
 serene scaffold
merry reef
To anyone who installed Pytorch-nightly (v2.0) between Dec 25th and 30th, see <h...
serene scaffold
merry reef
To anyone who installed Pytorch-nightly (v2.0) between Dec 25th and 30th, see <h...
We don't really have a way to get targeted messages out. But thanks for the tip 👍
 opaque bay
Hello, is there anyone with a Twitter developer account here?
Signify so that I can message you 🥺🥺
patent lynx
You can apply it yourself for free irc
It can take several days for approval of each 10kish API request per day
dusk tide
Anyone had ever put your data on GCS buckets in python ??
I need to do this in order to use TPU
rancid sorrel
merry reef
To anyone who installed Pytorch-nightly (v2.0) between Dec 25th and 30th, see <h...
honestly ive been waiting for a python datascience vunrablity forever
datascience relies far too much controlled dependences
 unique ridge
Hey, Ive created a Linear regression model and now i want to show how it has done in a plot. When trying to print it i get an error. This the code is currently have:
lg_model = LinearRegression()

lg_model.fit(greenhouse_X_tr, greenhouse_y_tr)

lg_predict = lg_model.predict(greenhouse_X_v)
lg_score = lg_model.score(greenhouse_X_v, greenhouse_y_v)

lg_rmse = np.sqrt(mean_squared_error(greenhouse_y_v, lg_predict))

plt.scatter(greenhouse_X_tr, greenhouse_y_tr, color='g')
plt.plot(greenhouse_X_v, lg_predict,color='k')
plt.show()
The problem currently lies at plt.scatter(greenhouse_X_tr, greenhouse_y_tr, color='g') saying:
ValueError: x and y must be the same size. To fix this. i tried doing:
plt.scatter(greenhouse_X_tr[:, 0], greenhouse_y_tr, color='g') but this did not work. Does maybe anyone have a solution for this?
unique ridge
I am confused. If i do ILOC on any column it works, but this shouldnt be the result it should be.

 compact parrot
Keras Image Classification
WARNING:tensorflow:Model was constructed with shape (None, 128, 128, 1) for input KerasTensor(type_spec=TensorSpec(shape=(None, 128, 128, 1), dtype=tf.float32, name='rescaling_2_input'), name='rescaling_2_input', description="created by layer 'rescaling_2_input'"), but it was called on an input with incompatible shape (32, 128, 1, 1).```

What I am doing wrong and why it's happening?

Code for prediction:
```py
for file in glob.glob("test/test/*.jpg"):
    img = tf.keras.preprocessing.image.load_img(file, color_mode='grayscale', target_size=(128, 128))
    img = tf.keras.preprocessing.image.img_to_array(img)
    img = img / 255

    prediction = model.predict(img)
    result_str += f'{file[:file.rfind("test") + 1]},{prediction[0]}\n'
    break```

Code for train dataset:
```py
image_size = (128, 128)
batch_size = 32

idg_train = tf.keras.preprocessing.image.ImageDataGenerator(validation_split=0.2).flow_from_dataframe(
    dataframe=df_train,
    directory='train/train',
    x_col='filename',
    y_col='blur',
    class_mode='raw',
    target_size=image_size,
    color_mode='grayscale',
    batch_size=batch_size,
    subset='training')

igd_val = tf.keras.preprocessing.image.ImageDataGenerator(validation_split=0.2).flow_from_dataframe(
    dataframe=df_train,
    directory='train/train',
    x_col='filename',
    y_col='blur',
    class_mode='raw',
    target_size=image_size,
    color_mode='grayscale',
    batch_size=batch_size,
subset='validation')```Anyone ever used Google cloud platform ???
Is there anyway a student can get access for free because it's asking for card details (visa,mastercard) while sign up which I don't have .
Anyone can help??
unique ridge
dusk tide
Anyone ever used Google cloud platform ???
Is there anyway a student can get acc...
maybe school licensing? Otherwise you might have to look for alternatives.
 modest onyx
Forgive me if this is not a place to promote my stuff, but here’s a blog post I wrote about visualizing neural networks 👁️ https://igreat.github.io/blog/manifold_hypothesis/
Neural networks are long assumed to be a black box, and though that might still be true to an extent, it can be very helpful to try to understand what’s going on inside it. In this blog post, I’ll try to crack open this black box and present some very intuitive ways to interpret neural nets.
Knowing very surface-level linear algebra and neural n...
 dapper tulip
Hi guys, I am having trouble with openai right now.
It's with the prompt thingie.
I'm having trouble with the openai API adding stuff to my input.
Like I use a chat derivation of the thingie, then if I ask as something simple like "Hi." it adds like "How are you?"
And that just messes up the output..
Any possible fixes for this pls?
 teal wadi
Hi guys I need help with tensorflow I just started work with it and i need to make a prediction to a dataframe I would like to help from someone how to do it when my df value is float and need to predict the last row + 1
serene scaffold
teal wadi
Hi guys I need help with tensorflow I just started work with it and i need to ma...
what do you mean by "you need to predict the last row + 1"?
 hasty mountain
Predict the next row? 
hasty mountain
So...it's gonna predict an ID that will serve to make another prediction?
teal wadi
yes
hasty mountain
You could make your model predict both the ID and then use that prediction to predict your output
But the ID prediction would require an input...even if it's just a random number
teal wadi
the prediction of the new id is not the issue what i got the issue with is how to make a new prediction from that new ID to get the value of the float column
hasty mountain
Shouldn't you just pass the new ID as input to your model?
teal wadi
the issue is I am just new with tensorflow and didnt really figure it out how to do this stuff i tried to study from a lot of places but its really hard for me to get know to it im good with pandas and df but I always gets and issue with how to write the code as ML prediction
 sinful relic
what should I do now..to gain some fun doing data science
do any one have any doubt
regarding ML or data science
hasty mountain
sinful relic
what should I do now..to gain some fun doing data science
Make a generative model...preferably using GANs
whole cloud
Hi guys, I am doing some sentiment analysis using the VADER model (from nltk.sentiment import SentimentIntensityAnalyzer).
I've got to the end and I am in the process of graphing my results

What be best way to calculate the means of all compounds of each of the 30 restaurants processed?
and place them in a new dataframe?
I am currently in the process of doing it manually, and it's making me cringe, I know there is a better way using a loop, I just can't figure it out
 slate hollow
how do i specify
retain_graph=True?
out.backward(retain_graph=True)
print(x.grad)
```this doesn't seem to work...nvm you had to specify it the first time you call it
 craggy patio
Trying to understand what a RandomForestClassification algo is. I kinda understand it but im having a hard time understanding the difference between it and decision tree's
 karmic lion
https://colab.research.google.com/drive/1hvHkDusyqEsdZg5ZRVhhriZrDagpFdU6?usp=sharing Its not letting me copy the whole code and ill add a picture, but on [18] im getting a "graph execution error" could someone look at it and help me out?
 hasty mountain
craggy patio
Trying to understand what a RandomForestClassification algo is. I kinda understa...
hasty mountain
craggy patio
Trying to understand what a RandomForestClassification algo is. I kinda understa...
From what I remember, RandomForest is a bunch of Decision Trees working all at once, and your result will be provided by the best tree.
That's why it's an ensembling model...it ensembles a bunch of decision trees to get the best result for the given task
queen cradle
Generally the results of trees are averaged for prediction, or the majority vote is taken for classification.
 twin parrot
Is there any way to make the entire Sunburst chart bigger? The Sunburst chart seems kinda small. At least my eyes are having trouble reading even the largest blocks. I know you can hover to see things, but I'd still like to make it bigger. I only found this: https://stackoverflow.com/questions/65029323/is-there-a-way-to-vary-the-thickness-of-a-layer-in-sunburst-diagram-in-plotlywhich which suggests building the sunburst from the individual components, but I would think there is some way to adjust the size like: plt.figure(figsize=(15,15), dpi=200) except that doesn't do anything.
If there is a better place to ask this please let me know.


Stack Overflow
I want to change the thickness of a layer in a sunburst diagram. I have looked through all the examples on https://plotly.com/python/sunburst-charts/ but can't find any good solution.
Take the exam...
queen cradle
Honestly, my advice would be to never use a sunburst chart if you can help it.
twin parrot
queen cradle
Honestly, my advice would be to never use a sunburst chart if you can help it.
OK, it's part of the course I'm working on and I'm just curiously exploring this rabbit hole. Is there a better tool you'd recommend that has similar functionality? Or is this like the stem and leaf graphs we all learned in grade school which is seldom or never used again thereafter?
queen cradle
So my objection to sunburst charts is that they're basically a kind of pie chart, and pie charts are deceptive.
Usually I think grouped bar charts are more effective.
twin parrot
queen cradle
Usually I think grouped bar charts are more effective.
Thank you Kyle! I do like grouped bar charts, they are easier to visually compare the heights vs the slice of a pie chart.
queen cradle
Unlike stem and leaf plots, you actually do see sunburst charts "in the wild", so to speak. In effect, they're several layers of pie charts; Edward Tufte famously said, "the only thing worse than a pie chart is several of them."
queen cradle
twin parrot
Thank you Kyle! I do like grouped bar charts, they are easier to visually compa...
It's precisely the issue of comparing height versus area which makes bar charts so much better than pie charts. Heights are easy to compare; at worst, you just hold up your fingers to the screen. Areas are nearly impossible to compare. It's something humans just aren't good at.
And of course, there's this gem:


 digital hazel
in tensorflow, why do they add the softmax layer after fitting the model, or does it not matter as long as its added somepoint before predicting?
in the basic ml model tutorial
 proper salmon
 dusty valve
Where did you get that api
dusty valve
Where did you get that api
OpenAI
dusty valve
digital hazel
in tensorflow, why do they add the softmax layer after fitting the model, or doe...
Softmax is usually used for percentages, or probabilities
So for sentiment analysis you might use softmax(2) for an output vector with shape (2,) representing probability of sentiments
digital hazel
gotcha
dusty valve
Softmax essentially just squishes something between 0 and 1
digital hazel
I understand that
so it doesn't matter about the placement of the layer before or after fitting?
because all it does is just convert values
or the results of the models I mean
dusty valve
Nope it does
Layer ordering is quite literally the model
Softmax at the end is usually probability of classes
digital hazel
on the tf website, they add the layer after fitting the model
dusty valve
Link?
dusty valve
model = tf.keras.Sequential([
    tf.keras.layers.Flatten(input_shape=(28, 28)),
    tf.keras.layers.Dense(128, activation='relu'),
    tf.keras.layers.Dense(10)
])
``` the layers are all defined here before fitting, no more are added laterAh lol, thats takes the trained model and applies softmax to its outputs
Where is that
digital hazel
same page, on the predictions tab
"make predictions"
this is what i mean by does it matter if the layer is attached before or after the trained model
dusty valve
Doesn't make too much of the difference if you are only using sofrmax model
digital hazel
gotcha
thank you
i also want to ask if there is a different with putting "activation" on the final layer versus adding a whole softmax layer
so this model.add(layers.Dense(2, activation="softmax"))
vs a final softmax layer itself
model.add(layers.Softmax())
karmic lion

I Keep getting a "graph execution error"
I really cant figure this one out
Im hearing that fit Is outdated and i dont know what to replace it with
idk like im just so confused by trying this for hours and im a noob
dusty valve
Fit is not outdated
Tf docs where?
Your kaggle key is therw
Dunno if that's important
karmic lion
dusty valve
Tf docs where?
?
 half badger
Hey guys, I’m trying to figure out where I can go to find AI or a company I can partner with to help me create a voice recognition AI that will help staff at a grocery store with common mistakes they make and help them live during work installed in their till system offline.
serene scaffold
half badger
Hey guys, I’m trying to figure out where I can go to find AI or a company I can ...
hmm, can you elaborate on what this voice recognition AI is supposed to do?
half badger
for example if a staff member wants to find out how to change the price of a product or how to properly manage parcels in what procedure, I want an ai that can handle any sort of conversation and find the best solution for them
@serene scaffold
by training the ai in some sort of way
 median arrow
Hey guys, could anyone recommend a really good book for learning data science with python? Or just learning about dates science in general?
serene scaffold
half badger
for example if a staff member wants to find out how to change the price of a pro...
sounds like the problem you're trying to solve doesn't have to do with the voice recognition part.
serene scaffold
median arrow
Hey guys, could anyone recommend a really good book for learning data science wi...
"data science from scratch", second edition.
median arrow
serene scaffold
"data science from scratch", second edition.
Thanks!
half badger
serene scaffold
sounds like the problem you're trying to solve doesn't have to do with the voice...
yeah so when a staff member needs help with something, they can go to the ai tab and they can talk directly to the till and ask them questions and the ai will guide them to the correct guides that have been created
serene scaffold
half badger
yeah so when a staff member needs help with something, they can go to the ai tab...
you might want to look into automated QA.
half badger
serene scaffold
you might want to look into automated QA.
oo thanks for the direction
half badger
serene scaffold
you might want to look into automated QA.
I think it's a little different
it's more so for people that know 0 code, regular employees working at a grocery store asking questions to an ai via voice recognition
for the common mistakes that they do
serene scaffold
half badger
it's more so for people that know 0 code, regular employees working at a grocery...
remember that while voice recognition is part of AI, voice recognition is only about transcribing audio to text. if you want to then do something with that text, that part has absolutely nothing to do with the voice recognition part. so if you refer to what you're trying to do as a "voice recognition AI", you're going to confuse people.
so, you want an AI that answers questions. yes?
half badger
serene scaffold
remember that while voice recognition is part of AI, voice recognition is *only*...
ahh I get your point
hasty mountain
serene scaffold
so, you want an AI that answers questions. yes?
AI does Voice Recognition ----> Translates audio to text ----> Sends text to Q&A bot

half badger
yeah it's not the voice recognition part that I need help with specifically so I should leave that out of the question
half badger
serene scaffold
so, you want an AI that answers questions. yes?
yup exactly
hasty mountain
Is CIFAR100 considered a "robust" dataset(one that requires a robust model as it's hard to learn and acquire good accuracy)?

 stone glacier
hey, all.
for regression-type models, what's the most accepted model accuracy measure?
serene scaffold
hasty mountain
AI does Voice Recognition ----> Translates audio to text ----> Sends text to Q&A...
AI does Voice Recognition ----> Translates audio to text these two steps are the same thing
serene scaffold
half badger
yup exactly
so, what is automated QA according to your understanding, and how is what you want to do different from that?
 north barn
serene scaffold
`AI does Voice Recognition ----> Translates audio to text` these two steps are t...
north barn
serene scaffold
`AI does Voice Recognition ----> Translates audio to text` these two steps are t...
i think he means recognizing that there's voice audio versus audio transcription
you'd use different models for those tasks, traditionally
ie one is a classification task
the other is a translation of sorts
north barn
stone glacier
hey, all.
for regression-type models, what's the most accepted model accuracy me...
mean squared error
north barn
hasty mountain
Is CIFAR100 considered a "robust" dataset(one that requires a robust model as it...
this question misses the point that datasets =/= tasks
ie cifar100 might be robust for testing some tasks and not others
hasty mountain
north barn
this question misses the point that datasets =/= tasks
Ok.
Can I use CIFAR100 with a model that has 4 layers for a Conditional GAN/Classification task just like I did with Fashion MNIST or will I need to use more layers?
north barn
i think it depends on the resolution mostly
stone glacier
north barn
mean squared error
is there some way to get a accuracy measurement?
like something in the lines of "Model Accuracy is: X%"?
I tried 1 - MAE value but I dont think that's a reliable source
I also saw some using R2-score for accuracy measurement
north barn
there's an equation for mean squared error
stone glacier
I have been using this:
from sklearn.metrics import mean_squared_error
there's mean percentage error if you want %
but i think for training you'd prefer mean squared error
if you have two curves you how would you characterize % error between them
you could say it's the area between them
but the area could be arbitrarily large as they could be arbitrarily far apart
so it wouldn't be a %
mean percentage error works by looking at the area and then normalizing by one of the curves
but this is subjective
stone glacier
I am currently working on a sales forecasting project so was looking for comparative values between the 9 models I did
so, far maybe using a combination r2_score, mse, rmse, mpe, can work, and possibly doing some predicted vs true curve for the target month.
I initially planned on including a accuracy % value to summarise each model's results but googling doesn't really help since I get a multitude of formula and hard to figure out which is the best to go with
queen cradle
stone glacier
I initially planned on including a accuracy % value to summarise each model's re...
The problem that you have is that there is more than one way of measuring accuracy. In statistics, this is captured using a loss function. The loss function is supposed to measure how bad different types of errors are. For example, minimizing the squared error loss function is the same as minimizing mean squared error.
If you've chosen a loss function, then (at least in theory) everything else is just details. So how do you know which loss function to use? Ah, well, the loss function is supposed to measure what's important to you. In some applications, you might want very small errors most of the time, but it might be okay if, very rarely, you get a big error. In other applications, that's unacceptable; you're willing to tolerate larger errors on average as long as none of them are too big. What's right depends on what you're doing. There's no perfect choice of loss function.
patent lynx
Speaking of accuracy, when should we avoid overfitting our data?
wooden sail
always
compact parrot
Keras
How can I improve accuracy for classification for two classes?
model
model = Sequential()

model.add(Conv2D(32, (3, 3), activation='relu', kernel_regularizer=regularizers.l2(0.001), input_shape=(IMAGE_WIDTH, IMAGE_HEIGHT, IMAGE_CHANNELS)))
model.add(BatchNormalization())
model.add(MaxPooling2D(pool_size=(2, 2)))
model.add(Dropout(0.25))

model.add(Conv2D(64, (3, 3),kernel_regularizer=regularizers.l2(0.001), activation='relu'))
model.add(BatchNormalization())
model.add(MaxPooling2D(pool_size=(2, 2)))
model.add(Dropout(0.25))

model.add(Conv2D(128, (3, 3),kernel_regularizer=regularizers.l2(0.001), activation='relu'))
model.add(BatchNormalization())
model.add(MaxPooling2D(pool_size=(2, 2)))
model.add(Dropout(0.25))

model.add(Flatten())
model.add(Dense(512, activation='relu'))
model.add(BatchNormalization())
model.add(Dropout(0.5))
model.add(Dense(2, activation='softmax'))

model.compile(loss='categorical_crossentropy', optimizer='rmsprop', metrics=['accuracy'])```
Total params: 398,818,754
Trainable params: 398,817,282
Non-trainable params: 1,472```
IMAGE_WIDTH = 640
IMAGE_HEIGHT = 640
IMAGE_CHANNELS = 3
Dataset containing 2100 images for training and 500 images for validation
loss: 0.1632 - accuracy: 0.9509 - val_loss: 0.2118 - val_accuracy: 0.9352 - lr: 6.2500e-05``` tacit basin
compact parrot
Keras
How can I improve accuracy for classification for two classes?
model
```py...
tacit basin
compact parrot
Keras
How can I improve accuracy for classification for two classes?
model
```py...
You can try data augmentation or/and test time augmentation
 thick seal
whats a resnet?
I needed to categorise over 9k images, but that would be too time consuming to manually categorise
 austere swift
thick seal
whats a resnet?
austere swift
thick seal
whats a resnet?
its an architecture that involves using convolutional layers along with residual connections for classification models (residual connections basically mean you're just adding the outputs from a previous layer to the outputs of another layer)
thick seal
So will that be accurate?
 knotty swallow
Idea: Approximate pi by using
-20 + e^(3.14)
 valid estuary
Hello there, I'm willing to learn about data science, machine learning and AI. I love to learn new stuff 🍻 Is there any course on the udemy that You would recommend? Hopefully that it's up to date, thanks.
 ripe sapphire
What does Dropout really do? Do I really need to use it
wooden sail
ripe sapphire
What does Dropout really do? Do I really need to use it
you can think about it as a form of regularization
it makes it so that the parameters in the next layer change more smoothly
or seen another way, it avoids having a handful of parameters that become very large, while the others stay close to zero with little effect
you don't always need it, but if you don't use it and many of your parameters end up close to zero and/or having little impact, you just wasted training time on them. you could've used a smaller model
dense crane
hey here are my tasks and i have 2 questions

and here is my data:

and it depends from the date (messurments are from 01.01.2007 to 31.12.2014)
- should i replace this empties by using some methods (like linear interpolation for example)?
or left this as it is
- if yes should i use a interpolation or better be when i use something else?
 hoary silo
Anyone want help in any Python project related to machine learning, analytics work, college project/assignements
just message me
serene scaffold
hoary silo
Anyone want help in any Python project related to machine learning, analytics wo...
you should put all relevant details in the chat
patent lynx
Any data visualisation packages like those 2 + seaborn are good eitherway. Matplotlib are harder to use but are highly customisable.
fallen crown
because everybody say matplotlyb sucks and it is bullshit
serene scaffold
fallen crown
is plotly good for ML ?
matplotlib and plotly are for data visualization, not ML
 ocean swallow
how would you make the architecture of this AI?
 serene scaffold
ocean swallow
how would you make the architecture of this AI?
serene scaffold
ocean swallow
how would you make the architecture of this AI?
how is this AI?
are you referring to how the image changes depending on your selection?
ocean swallow
serene scaffold
how is this AI?
you can introduce categories and it decides what category it is
you can put color: and it outputs yellow
given an image
the demo is here I guess I don't know if links are allowed
 lapis sequoia
by a classifier?
ocean swallow
Try our demo and experience the power of visual AI. Learn how visual search works. Discover Pixyle's AI-powered automatic tagging solution. See how to improve your catalogs with similar products.
ocean swallow
lapis sequoia
by a classifier?
so like just outputs a vector? 0th index for color 1st idnex for say material etc.
or would you approach it differently
lapis sequoia
Yeah can be done like that.
ocean swallow
I am inclined to try that but like I am worried about the outputs lol
lapis sequoia
See a simple classifier would be for just predicting color
even in that a simplest dataset would be a categorical dataset.
But all this depends on how is your dataset.
ocean swallow
that's a pretty straightforward appraoch but using an SSD to detect object then classify color would have probably much better results
lapis sequoia
ssd?
ocean swallow
lapis sequoia
ssd?
wasn't it for object detection
that was an example. it is short for single shot multibox detector
serene scaffold
ocean swallow
see I want to make a production ready architecture
the architecture is just the arrangement of the parameters and layers and stuff. it won't be "production ready" until you train it.
lapis sequoia
ocean swallow
that was an example. it is short for single shot multibox detector
yeah okay.
ocean swallow
serene scaffold
the architecture is just the arrangement of the parameters and layers and stuff....
yes but I can't train it unless I get some sense of what the architecture could be
lapis sequoia
Yeah I mean if you don't have data you're really not going anywhere, unless to show it intuitionally. I think your architechture design would heavily depend on your data.
ocean swallow
I can have the data or get it created
I am willing to pay some money to label it
it is no problem
so I want to design the architecture that might work good and get data accordingly
 nimble sandal
Hi everyone, I am trying to create a data table which will contain a bar chart in a separate column. It should be like a table with mini plot for each row like the image here. I know it can be done with excel but I need to figure out a way to do it with python and implement it with stremlit for a web app. Is there any code snippets you can suggest?
 digital hazel
I have a model predict one of two classes right after it trains. Is it normal that it goes from 100% certain for one class to 100% for another for one prediction when I change the model training seed?
As in, does the model train so differently every program run that it can change its certainty so drastically?
queen cradle
digital hazel
I have a model predict one of two classes right after it trains. Is it normal th...
Your model is overtrained. Try adding some regularization.
Good job, by the way! Most people would not have caught that.
queen cradle
dense crane
1. should i replace this empties by using some methods (like linear interpolatio...
Well, it depends on what you want to do, but I'd say: Don't replace missing data if you can avoid it. Trying to replace missing data is often hard. For example, your data is obviously both non-linear and quite noisy. Linear interpolation is almost certain to yield garbage. That garbage will corrupt any further analysis you do.
This subject is generally called "imputation." See https://stefvanbuuren.name/fimd/, for example.
dense crane
ok i will look at this
but when for example when there are missing only 1-2 values can i also left this or in this case i should change this?
queen cradle
It depends.
dense crane
so i will only replace the outliners (because it is part of task) and will leave all empty data
is that good?
queen cradle
If you have values from a sensor, and the reason they're missing is because the values were too big and the sensor malfunctioned, then you have a hard problem. But if the problem was that a random power outage meant you didn't collect data for that day, and linear plausibly fills in the values, then that's probably fine.
Because you're talking about a "task", I assume this is a school assignment? In that case I recommend doing whatever your teacher says. Hopefully they will have taught you techniques that work on the data set they've provided.
queen cradle
dense crane
so i will only replace the outliners (because it is part of task) and will leave...
Also, everyone knows intuitively what an outlier ought to be, but actually pinning down a precise definition is impossible. Every author has their own definition, and those definitions are not consistent. In real-world applications, you have to evaluate the data set by hand to determine what should be considered an outlier.
dense crane
yea i mean with this case i know how to deal with but i just wasnt so sure what to do with empties i dont remember if he actually said anything about so i wanted to ask the professionals haha
so thanks for your advice
queen cradle
If you want more opinions, there's a statistics Discord.
dense crane
i might be there actually but if no can you send me the invite?
queen cradle
I'll DM you.
digital hazel
@queen cradle is it bad if I save the model that is correct/accurate? For example, I used a seed that is very accurate in correctly predicting the class
Or do I have to restart and make the model less overfitting?
My model does image classification, and I've been taking pictures of the two different classes from online and it does very well predicting them
 lavish kraken
digital hazel
I have a model predict one of two classes right after it trains. Is it normal th...
lavish kraken
digital hazel
I have a model predict one of two classes right after it trains. Is it normal th...
Seems like your have over trained your model?
digital hazel
I know, but do I still have to edit my model even though it does well with external data/predictions?
I lied it guess completely wrong for a prediction
my model is overfitted
 ancient fog
Hi I'm doing a course on Udemy and I'm going through polynomial regression with sklearn and I wanted to try out the different cost functions and how they can affect the outcomes of the polynomial regression. So I tried the default LinearRegression() for my dataset and it gave a reasonable final value, but when I did SGDRegressor(), it gave something really large and strange, and I'm not sure why
could anyone help me out with the reasoning behind why gradient descent doesnt work
north barn
ancient fog
could anyone help me out with the reasoning behind why gradient descent doesnt w...
could you elaborate on your data, what kind of curve you're fitting to, how many data etc.
ancient fog
north barn
could you elaborate on your data, what kind of curve you're fitting to, how many...
sure is it fine if I send the notebook
ancient fog
sure or we can vc?
arctic wedgeBOT
Hey @ancient fog!
It looks like you tried to attach a Python file - please use a code-pasting service such as https://paste.pythondiscord.com
ancient fog
@north barn i exported it to google colab if thats fine
thats the linear regression one
ancient fog
ancient fog
thats the linear regression one
with ordinary least squraes
this is the gradient descent one^
wooden sail
ancient fog
Hi I'm doing a course on Udemy and I'm going through polynomial regression with ...
i haven't checked your code, but the common issue is that the step size might be too large
north barn
^
wooden sail
are you familiar with what "hessian" and "singular values" mean?
it turns out that for gradient descent, especially with a fixed step size, you can exactly derive which step sizes work
(it's a little different in the stochastic case, but you can use the expected hessian)
north barn
i was thinking if linear regression works by solving a system of equations and sgd regression with a linear model works by gd jumps obviously option 2 has more options when it comes to messing up.. man im rusty.. @wooden sail could you remind me where the s is in sgd
wooden sail
as an extra tip, the matrix used in polynomial regression is a so-called "vandermonde matrix". these are full rank under very mild conditions, but their "condition number" is horrible and you often need to use tiny step sizes
wooden sail
north barn
i was thinking if linear regression works by solving a system of equations and s...
the s in sgd is "stochastic", meaning at every iteration of gd, different chunks of the data are used to approximate the derivative
wooden sail
right
digital hazel
how do I know if I should make my nn bigger or smaller to prevent overfitting? I only have 100 pairs of training data, but each image is 200 x 200
model.add(layers.Conv2D(32, (3, 3), activation='relu', input_shape=(200, 200, 3)))
model.add(layers.MaxPooling2D((2, 2)))
model.add(layers.Conv2D(64, (3, 3), activation='relu'))
model.add(layers.MaxPooling2D((2, 2)))
model.add(layers.Conv2D(64, (3, 3), activation='relu'))
model.add(layers.Flatten())
model.add(layers.Dense(64, activation='relu'))
model.add(layers.Dense(2, activation="softmax"))```This is current model
north barn
@digital hazel easiest option is to take a glance at the architectures in papers trained on similar data
so uhh for you
100 pairs isn't much
digital hazel
ik its very small
but im trying to figure out how to apply a small dataset to makes the model accurate regardless
at the same time, I do increase the dataset by adding flipped images
north barn
https://arxiv.org/abs/2101.11461 suggest data augmentation and attention as the 2 tools to use when working with limited data
north barn
you could also shift the images, add noise, crop, etc.
digital hazel
I gotcha. But how do I augment the network itself, even after adding more data through the editing of images?
I dont know if my model is too big/complex or too simple and small
ancient fog
wooden sail
i haven't checked your code, but the common issue is that the step size might be...
Where can i change that
ancient fog
wooden sail
as an extra tip, the matrix used in polynomial regression is a so-called "vander...
I thoufht it happens so that the step size decreases every step
slate hollow
yknow
people always use the "what if we just predicted all negatives" as an argument for precision/recall and an argument against using raw accuracy
but if we predicted all positives
you'd get 100% recall, and a nonzero precision
so what's it gonna be
 timber spoke
say I have a MLP, with a RELU activation for the hidden layers and a softmax activation for the output. from my understanding, the predicted class is essentially the output with the highest value, thus there is really no need for the softmax function if you have a trained network. so my question is regarding the ranges of the outputs. the outputs can be positive or negative since i'm removing the softmax activation function in this case, so my question is is it safe to assume that there will never be a case where the outputs are all negative?
wooden sail
if you just remove the softmax, you can't guarantee that
you'd have to place another nonlinearity that also gets rid of negatives
hasty mountain
Hey guys, about Reinforcement Learning...
If I want to make a Reinforcement Learning algorithm in a chaotic environment(not some OpenAI's Gym environment), I would have to make a model that can properly extract features from the given state and, based on that features extracted, predict both the "best actions" and the expected reward, right?
And the optimization would be done by backpropagation according to the difference between expected reward and actual reward?
 fading frost
how can I make a model to detect the location of a mouse (rodent) in an image
is there one that already exists?
serene scaffold
@fading frost look into object detection
hasty mountain
There's VGG, MaskCNN, ResNet, YOLO...
fading frost
idk what any of that is oops
hasty mountain
Those are the models that can detect different objects in an image
hasty mountain
I think VGG don't, but I know that MaskCNN can create some boxes where the object has been detected
hasty mountain
ResNet and YOLO might do that, too
queen cradle
I can't even tell whether you're talking about cursors or rodents.
fading frost
rodents oops
hasty mountain
You can download them pretrained, so...it might take 1 or 2 hours
fading frost
I am on a time crunch lol
fading frost
hasty mountain
You can download them pretrained, so...it might take 1 or 2 hours
I checked hugging face and there did not seem to be one
is there other websites that will have a pretrained one?
fading frost
aren't those the languages
fading frost
where do i find models using keras? is there like a website?
hasty mountain
Yes, there's the tensorflow website
There's also the keras website, but keras is mostly within tensorflow now
Tensorflow also has some tutorials...which actually just teaches you how to download a pretrained model and use it
||Seriously, how I hate tensorflow tutorials...||
fading frost
oh ok
digital hazel
my cnn model gets a 90% accuracy and 80% evaluation accuracy, but goes from highly guessing one class on one program run and highly guessing the other on another program run. Does this constitute overfitting or am I doing something wrong with my model?
I feel like the high evaluation accuracy shows at least some lessened overfitting
tacit basin
digital hazel
my cnn model gets a 90% accuracy and 80% evaluation accuracy, but goes from high...
90% train and 80% eval? Suggest that train and eval ate a bit different possibly
tacit basin
digital hazel
my cnn model gets a 90% accuracy and 80% evaluation accuracy, but goes from high...
Wdym by highly guessing classes on different runs?
digital hazel
as in one run it would predict close to 100% of on class, and other run it would predict 100% of the other class
does this constitute overfitting?
tacit basin
What is one run?
digital hazel
running the program one time
model trains and evaluates itself in one run
every run everything is reset
tacit basin
Is split to train and val different for each run?
digital hazel
no'
my val is through model.evaluate
not a validation_set
forgot to make that clear srry
so therefore no its the same set eac hrun
each run*
tacit basin
How do you split to train val?
digital hazel
the dataset i was given already splits it
it seems like 50 50 but im not sure
am wrong 70 30
tacit basin
If your val set is fixed then there is something else that's random. You set same number of epochs between runs?
Did you charge anything between those runs?
north barn
uhh
aren't you supposed to get different results
because your neural network parameter initializations are going to be different
tacit basin
north barn
aren't you supposed to get different results
You could seed random number generators for reproducibility
digital hazel
am i supposed to seed it?
north barn
if you would like reproducibility
 scenic inlet
Hi
 rain token
Hi i am elouardy i am still a beginner in python i would like to work on some smalk projects and i will be more suitable if some likes ro join me
If you are interested send me a req thus we can talk about laat ai,... News and plan our project timetable.
Nest regards
Elouardy
 young granite
@wooden sail @zenith nova
 wooden sail
show the spectrum
also, i have to go eat in like 10 minutes so i will disappear for like an hr
young granite
wooden sail
show the spectrum
i cant share 😦
wooden sail
hmm that'll be challenging
can you say what % of the frequency bins you are keeping when you do the ifft?
young granite
depending on the window 5%-10%
wooden sail
then this looks reasonable
if you increase it to 20% it'll probably be a lot closer
windowing in the freq domain makes you loose energy in the time domain
young granite
FFT with abs.values

@wooden sail i try to minimize the kept freq. due to less features for ML
wooden sail
ok. btw are you windowing both the positive and the negative frequencies? or only the positive ones?
young granite
wooden sail
ok. btw are you windowing both the positive and the negative frequencies? or onl...
only positive ones
young granite
the method does that directly i guess
wooden sail
in that case there isn't much to be done
throwing away samples results in loss of information
you can only undo this by enforcing priors and solving an optimization problem
you'll have to choose a tradeoff between number of samples and error in the amplitudes
wooden sail
i can't really comment much more without seeing the data, sadly, but i understand secrecy and NDAs
 flat birch
Hi.im working in computer vision. And i am working with image masking. so i have marked an area on an image and i want to use this area as a mask. I used grey scale and erosion. So now it's a black Circle drawn on a white background. I need help with how do I fill this area with black color.
 late flint
Hi anybody can suggest me best python coding channel for help desk
 tall fox
flat birch
Hi.im working in computer vision. And i am working with image masking. so i have...
tall fox
flat birch
Hi.im working in computer vision. And i am working with image masking. so i have...
so from what i understand you have your contours but aren't able to fill them? If you're using opencv for your image masking you can use thickness=cv2.FILLED in your drawContours. Something like this:
cv2.drawContours(img, contours, -1, color=(255, 255, 255), thickness=cv2.FILLED)
Note: The same goes for drawCircle, just put cv2.FILLED where you would place the thickness of the outer line
whole cloud
Hi, guys I currently have a dataset with countries and their exports. it has two columns and the country in one and the item in the other, both columns have duplicate values.

What would be the best way for me to convert the data in this format and get it do a boolean check if a country has an item?
 young granite
@whole cloud combine all items for a country and then u can check with "in"
!e
l = ["apple","bread"]
if "apple" in l:
    print("yes")```
i wouldnt bother doing a boolean beforethis is neat cause u can check for multiple items at same time
young granite
 inland mantle
If the information is in a table
inland mantle
If the information is in a table
probably the shape of the table?
so pandas dtype for example
or things u get by using .info()
whole cloud
young granite
<@194499663196323841> combine all items for a country and then u can check with ...
What would be the best way for me to concatenate the items into separate lists for countries using this approach?
young granite
whole cloud
What would be the best way for me to concatenate the items into separate lists f...
did u work with code already, if so show it
whole cloud
young granite
did u work with code already, if so show it
Just had an attempt at it now and I'm super stuck on how I would go about creating a new column with concatenated / merged columns
 young granite
.groupby(["Area"])
 odd meteor
whole cloud
odd meteor
whole cloud
Try using panda's groupby(), pivot() method, or df.iterrows() (requires writing longer code)
whole cloud
 young granite
whole cloud
young granite
whole cloud
check the doc of .groupby ur syntax is wrong
serene scaffold
whole cloud
think of groupby as making a bag of dataframe slices. it wouldn't make any sense to assign a bag of dataframes as a column.
also, whatever you do to a groupby, it will probably have fewer rows than the parent dataframe had. and those rows probably won't have a 1:1 relationship to rows in the parent dataframe.
 fluid oracle
whole cloud
fluid oracle
whole cloud
This will work for you-
items = df["Items"].unique().tolist()
df["is_item_present"] = df.Item.apply(lambda x:("Y" if x in items else "N")
df.pivot(
   index = "Area",
   columns = "Items"
)
Cooolss!! Thankyou, that seems to have worked perfectly! Just studying it now!
 strong notch
Interesting:
Stack Overflow
As duration of a task, suppose that we have a column with cells formatted as MM:SS that would like to convert to seconds. Mathematically speaking, the solution is simple. We just need to compute MM...
lapis sequoia
Heya guys, can anyone guide me a little how I should start and approach datascience/machine learning
hasty mountain
Take a look at the pins
lapis sequoia
Aight thanks man
whole cloud
fluid oracle
This will work for you-
```py
items = df["Items"].unique().tolist()
df["is_item...
I'm trying to figure out why the else clause of the lambda function is failing, are you able to give me a hint?


 proper swift
General question, when fine tuning a machine learning model, what's a good naming convention to adopt without making it too long.
At the moment, I'm using the frowned upon nomenclature of: model 1, model 2 etc. 🙃
 smoky epoch
for deliverable 4, could someone please explain why we divide by survival total? i still dont understand
 serene scaffold
smoky epoch
for deliverable 4, could someone please explain why we divide by survival total?...
serene scaffold
smoky epoch
for deliverable 4, could someone please explain why we divide by survival total?...
can you give all this text as text? screenshots are annoying to read.
smoky epoch
Deliverable 3: Create a contingency table showing the joint distribution of character survival and gender. Add in the table margins to show the marginal distribution of each variable as well.
We create the contingency table to display the relationship between character gender and survival by including both variables in the crosstab function separated by a comma. The first variable entered is displayed as the row variable and the second variable is displayed as the column variable. To add margins (margin totals) to the table, we include the keyword 'margins' set to 'True' in the crosstab function as below:
gender_survival_crosstab = pd.crosstab( index=slasher_df["Survival"],
columns=slasher_df["Gender"],
margins=True) # Include row and column totals
gender_survival_crosstab
Gender 0 1 All
Survival
0 228 172 400
1 35 50 85
All 263 222 485```
# Let us rename the columns and index (rows) of the crosstab (contingency table) to make it more reader-friendly.
gender_survival_crosstab.columns = ['Male', 'Female', 'Gender Total']
gender_survival_crosstab.index = ['Died', 'Survived', 'Survival Total']
gender_survival_crosstab
```Male Female Gender Total
Died 228 172 400
Survived 35 50 85
Survival Total 263 222 485```
Out of the 222 female characters in slasher films, 172 died, and out of the 263 male characters in slasher films, 228 died. Calculating the conditional distribution of survival by character gender will give us an even clearer picture of the relationship between the two variables.Deliverable 4: Modify the contingency table in Deliverable 3 to show the conditional distribution of survival by gender.
We want to calculate the conditional distribution by gender. This means we want the proportion based on the gender total. Therefore, the gender total column must sum to 100% as must the Male and Female columns. This means we want the column-wise proportion. Therefore, we will divide the cross table by the column total, i.e., Survival Total to get the column-wise proportion as shown below:
## 285 / 263 = 86.6% etc
Male Female Gender Total
Died 86.692015 77.477477 82.474227
Survived 13.307985 22.522523 17.525773
Survival Total 100.000000 100.000000 100.000000```
Only 13% of male compared to 22.5% of female characters survived to the end of the movie.so i dont understand why we divide by survival total and not gender total in deliverable 4
@serene scaffold
 jolly garden
Hello ! New to the channel was wondering if anyone is familiar with VisIt
 fringe anvil
hello. im trying to finish my workshops.. they are making use use statsmodels.api on roger federer's tennis career. they want us to Use a linear regression and statsmodels to find which surface type predicts the most points for Federer in the tennis.csv dataset. im not sure which part of the dataset to use as "points" and it gave me some results.. but my understanding is that they are not that great

here's a snippet of code
df = pd.get_dummies(df, columns=['surface'], drop_first=True)
X = df[["surface_Indoor: Hard","surface_Outdoor: Clay","surface_Outdoor: Grass","surface_Outdoor: Hard"]]
X = sm.add_constant(X)
y = df["player1 total points total"]

model = sm.OLS(y, X).fit()
print(model.summary())
im using the player1 total points total column. does that make any sense? im looking for some general guidance. at least to know that im going on the right path
 verbal venture
is the reason for preprocessing data to make the prediction more accurate, since it would be done on a tighter dataset rather than a broad one (tighter as in less data but higher quality)
so the algo for your desired output would be more accurate yeah?
 steep sluice
does anyone have and understanding on neural networks with python like training data that could help me?
north barn
@steep sluice what was it that you were curious about in particular?
steep sluice
north barn
<@985756671177551942> what was it that you were curious about in particular?
training data for a stock prediction bot i’m just confused on everything with the training
dusty valve
!paste
arctic wedgeBOT
Pasting large amounts of code
If your code is too long to fit in a codeblock in Discord, you can paste your code here:
https://paste.pythondiscord.com/
After pasting your code, save it by clicking the floppy disk icon in the top right, or by typing ctrl + S. After doing that, the URL should change. Copy the URL and post it here so others can see it.
dusty valve
steep sluice
training data for a stock prediction bot i’m just confused on everything with th...
I made something to do that, check the predictor class on the model layers and how it loads data https://github.com/HRLO77/predictor
https://paste.pythondiscord.com/mikucoyoxe classification neural network written using only numpy
Input was an array with 5 indices being integers 0-3 (inclusive) and was classified by the most common integer
Not really a practical example but I had no other ideas
arctic wedgeBOT
:incoming_envelope: :ok_hand: applied mute to @glass violet until <t:1672799970:f> (10 minutes) (reason: attachments rule: sent 10 attachments in 10s).
The <@&831776746206265384> have been alerted for review.
serene scaffold
I guess they were here to spam.
 delicate apex
sometimes they make it easy
dusty valve
serene scaffold
I guess they were here to spam.
I thought they would've contributed meaningful information to conversations and eventually become helper
Smh
serene scaffold
dusty valve
I thought they would've contributed meaningful information to conversations and ...
cuz if you don't become a helper, your whole participation here is invalid
dusty valve
serene scaffold
cuz if you don't become a helper, your whole participation here is invalid
Yes
Exactly
Mods understand it
My periodic temp ban should start again in a few minutes
serene scaffold
why
dusty valve
Because I'm not helper
Its like a motivation technique
To participate more when unbanned
fluid oracle
whole cloud
this isn't problem with else, you need to replace NaN with N, if you condition is ("Y" if x in items else "N")
when you check df after this operation df["is_item_present"] = df.Item.apply(lambda x:("Y" if x in items else "N") you will see reflection of your else condition.
NaN is due to pivot function as cook Islands won't have Apples, so it won't find this row in data produced this as NaN
 weary vigil
Anyone here proficient in Pandas? I've made 5 posts about a merge question in the last week. Still hasn't been answered. Would love some help ❤️
fluid oracle
weary vigil
Anyone here proficient in **Pandas**? I've made 5 posts about a **merge** questi...
point here, i might help.
weary vigil
fluid oracle
point here, i might help.
Hey fella
fluid oracle
weary vigil
Hey fella
Hey, can you paste your posts link here?
weary vigil
fluid oracle
Hey, can you paste your posts link here?
I @ you in the post, but sure
fluid oracle
just checked, got
 pseudo basin
I tried to solve this MDP by value iteration

But I can't figure out how to do it, tbh
I can know the v1, 2, the cold state is by
- 100% x 1 = 1
- 50% (2) + 50% (2) = 2
Choose the maximum one, 2
so it's 2 for the v1 cold state
 tranquil jasper
what fundamentals i need to learn for data science?
steady basalt
interestingly, chatgpt has been heavily nerfed/censored compared to the old davinci playground
it canot talk about politics or any sort of events
or any thing controversial/illegal
I have some examples but this would not have happened back in the old gpt model

another example, asking it 'what was great about trump' was unable to generate anything
 patent lynx
Preventing another tay a.i
steady basalt
if you used playground davinci model, it would have provided some pretty good responses to stuff like this
they put restrictions
 blazing wedge
GUYS help
steady basalt
here it did not even try to evaluate, it simply flaked

 regal mountain
Heyo!
I have a very simple task at hand. Simply put.. I just need to run Google search on a local directory of images.
Let's say I have images of all celebrities.. if I look up "Taylor Swift". It should show me tay's pics
Is this doable with python and an image recognition/search model?
I'm not sure what to lookup on Google. I got hits for reverse image search engine, etc. I even tried asking chatGPT lol
If someone could point me to the right resources that would be great.
 heady spoke
Hello! I want to create a dag to monitorise if a database is populated using airflow composer, how can I do this? Thank you!
 worldly mauve
I'm interested in specialising in geospatial data science (and working with earth observation/remote sensing data). I'm new on this journey (currently doing a MOOC course on geospatial) and would love to join a community that discusses specifically these sort of geospatial topics. I've looked online, but can't find any such communities. Are there discords, or online communities with active discussion for these sort of topics?
I know that this is pretty much a shot in the dark posting in this channel, but I thought I would ask anyway on the off-chance. Any advice is greatly appreciated!
 elder escarp
need python script to scrape company websites from company names
serene scaffold
elder escarp
need python script to scrape company websites from company names
web scraping often involves violating a website's terms-of-service
 nocturne kelp
To train a GAN to generate new Pokemon, do we also need non-Pokemon image data? If yes, what would be a good image set?
austere swift
nocturne kelp
To train a GAN to generate new Pokemon, do we also need non-Pokemon image data? ...
you don't need non-pokemon image data, the way GANs are trained the label values come from the discriminator's ability to identify the network's image from a dataset's image, so you don't need any positive/negative labeled data, only the images you want to train it on
elder escarp
I need to decrypt an ex4 file
nocturne kelp
austere swift
you don't need non-pokemon image data, the way GANs are trained the label values...
Ok, thanks
Btw do you have any resource for learning about the articetcure of GANs?
hasty mountain
austere swift
pytorch has a pretty decent tutorial on the DCGAN
Speaking of that... Does conditional GANs require Embedding layers?
I've seen some tutorials that use Embedding, but they also rely exclusively on Feedforward layers, while the conditional DCGANs tutorials I see that they don't really use Embeddings
But then... I guess the conditional part comes just from the concatenation of noise and labels...at least I remember reading something like that in WaveGlow's paper.
Oh...now that I think about it...Embedding layer is just 1~2 linear layers with a fancy name, isn't it?
Then I guess I could replace it by a linear layer...or by a transconv...if I use one-hot encoding instead of index-encoding.
wooden sail
right, embedding is effectively a dense layer with fewer outputs than inputs
(though the implementation is usually a lot more efficient)
austere swift
yeah usually they're implemented as sparse layers since the inputs tend to be mostly 0
hasty mountain
Then...should I initialize this dense layer with weights 0 and let the backpropagation do its magic?
wooden sail
you can try. there are better heuristics for this sort of stuff, but i must admit all i know is that they exist 😛
something something number and range of parameters
hasty mountain
Oh...
torch.nn.init.sparse_(tensor, sparsity, std=0.01)[SOURCE]
Fills the 2D input Tensor as a sparse matrix, where the non-zero elements will be drawn from the normal distribution \mathcal{N}(0, 0.01)N(0,0.01), as described in Deep learning via Hessian-free optimization - Martens, J. (2010).
aha, some bernoulli-gaussian distribution, then
wooden sail
😌
patent lynx
wooden sail
aha, some bernoulli-gaussian distribution, then
I am going insane with many different statistical tests out there
 safe vortex
How can I get started with artificial intelligence🧐
hasty mountain
hasty mountain
Problem is... *I don't know the fraction of elements that won't be zero*
I just initialized the entire layer to 0 using torch.init.zero_.
It seems to be going fine so far 
If my GAN doesn't collapses after epoch 50, I think it's an absolute win.
Didn't Collapse
Just have to get rid of batchnormalization in the generator...they cause quite a mess in the fake images
 tardy epoch
https://github.com/Shayan-Raza/Up-to-Date-Nasdaq-Data
A simple script for daily up to date nasdaq data

GitHub
Contribute to Shayan-Raza/Up-to-Date-Nasdaq-Data development by creating an account on GitHub.
 cyan tiger
Hi guys, im having lots of trouble scraping this website for the list of alberta insurance brokers next to the map
I’m using beautifulsoup and selenium, but it seems like they might’ve blocked from auto scrapers? Is there any other way to get the data?
 digital folio
r = 0
s = []
for i in df2.SKills:
  try:
    for j in i:
      if j == 'Data':
        r = r+1
        print(i)


  except:
    print("skip")
    pass

For every 'Data' in column Skills, I would like to print that Row.
Could you share the code?
 coarse plume
Is it possible to sort large chunks of data using an RNN? For instance:
The input is: APPLEPIMATH1213
The output is 1123AAEHILMPPPT
All letters should be grouped together. The output should also be reversible (output as input = original input).
My approach would look like this: The dataset consists of two columns. The first column contains sorted text, and the second column contains the unsorted text. At the end of the training process, I would like to input the sorted text and the LSTM should output the unsorted text. Is it possible to train an LSTM in this way?
digital folio
Anyone?
serene scaffold
digital folio
```py
r = 0
s = []
for i in df2.SKills:
try:
for j in i:
if j == 'Da...
do print(df2['SKills'].explode().unique())
also I suspect you've done something wrong. why is every element a list?
digital folio
Yes, the Skill column in df2 is a list type
@serene scaffold I want to select those Row of df2 that contain ''Data' as an element of list in column Skills
serene scaffold
digital folio
<@253696366952316929> I want to select those Row of df2 that contain ''Data' as ...
then you would do this
df2.loc[df2['SKills'].explode().eq("Data").index.tolist()]
For this I do not need the loop
serene scaffold
digital folio
For this I do not need the loop
if your solution to a pandas problem involves a loop, it's probably wrong.
digital folio
serene scaffold
then you would do this
```py
df2.loc[df2['SKills'].explode().eq("Data").index.to...
Hi it is not working as expected
df2.loc[df2['Organisation'].explode().eq("Wolt").index.tolist()]

As you can see here I'm selecting all those Row of df2 where Column Organisation contains "Wolt". However, it is displaying other Organisations too
serene scaffold
digital folio
```py
df2.loc[df2['Organisation'].explode().eq("Wolt").index.tolist()]
```
try just df2.loc[df2['Organisation'].explode().eq("Wolt")]
digital folio
serene scaffold
try just `df2.loc[df2['Organisation'].explode().eq("Wolt")]`

Something is not correct @serene scaffold
@serene scaffold with.index
also it is not showing the correct solution

 fallow frost
Hey guys, how do I go about displaying the result of df.plot(...) in a Python script (.py file)
In jupyter notebook it displays an image and also in the Ipython console, but I cant see anything in my Python script
anybody know?
serene scaffold
digital folio
well gosh darn it. try df2.loc[df2['Organisation'].explode().eq("Wolt").replace(False, pd.NA).dropna().index.tolist()]
serene scaffold
fallow frost
In jupyter notebook it displays an image and also in the Ipython console, but I ...
you can't display things from a script. it just runs in the background. you can save the plots to file, though
fallow frost
serene scaffold
you can't display things from a script. it just runs in the background. you can ...
oh, is there something that opens a GUI and displays the image? (thats what happens in the IPython console)
like maybe importing another library
serene scaffold
I appreciate that you don't want to interrupt ongoing conversation. But it's easier for everyone if you just put your whole question in the chat, or go to #1035199133436354600
serene scaffold
fallow frost
oh, is there something that opens a GUI and displays the image? (thats what happ...
try putting matplotlib.interactive(True) in your script somewhere near the top.
@fallow frost did it work
digital folio
@serene scaffold it worked! Best place to learn these commands?
serene scaffold
digital folio
<@253696366952316929> it worked! Best place to learn these commands?
there's a pandas tutorial on kaggle
!resources data science
arctic wedgeBOT
Resources
The Resources page on our website contains a list of hand-selected learning resources that we regularly recommend to both beginners and experts.
fallow frost
serene scaffold
<@923915277010370600> did it work
I didnt end up using it
digital folio
serene scaffold
there's a pandas tutorial on kaggle
.explode() I never heard about it
fallow frost
for two reasons, one I didnt want to add an extra dependency and two I'm afraid interactive mode will slow down the benchmark by a bit
dusty valve
serene scaffold
try putting `matplotlib.interactive(True)` in your script somewhere near the top...
!d matplotlib.pyplot.ion
arctic wedgeBOT
matplotlib.pyplot.ion()```
Turn the interactive mode on.it's not another dependency. it's just another import for matplotlib.
pandas already has to import matplotlib to render the plots.
serene scaffold
fallow frost
and what about the performance?
it would make no meaningful difference.
serene scaffold
what risk?
fallow frost
I'm gonna restart my PC so I can clear my memory and rerun the benchmarks
I want them to be very accurate as I get some spikes in my lineplots every now and then (thats defintly because of too much stuff open)
check this out:)
 serene scaffold
you should be running each one a few times and plotting the average, anyway
that should smooth out the spikes
fallow frost
that sounds like a good idea
and then plot the average and also the plot that has the highest high and lows
so you can have an idea of the worst case scenario as well
serene scaffold
that wouldn't really tell you what the worst case scenario is. have you taken a course on operating systems?
fallow frost
serene scaffold
that wouldn't really tell you what the worst case scenario is. have you taken a ...
no
hows that not the worst case scenario (for their respective parameters)?
ofc that is assuming others will be using the package on a modern computer with similar hardware...
some of the spikes were from a high CPU and RAM usage, others were from certain things happening within the script
serene scaffold
fallow frost
hows that not the worst case scenario (for their respective parameters)?
theoretically speaking, there could be so many processes competing for CPU time that the program you're measuring would never finish.
fallow frost

 remote vortex
Hi everyone, I'm trying to relearn AI so that I can thoroughly understand and use the algorithms that can be used
I wanted to ask what steps you took to learn this. Did you start directly with the algorithms? The math? Is there a good guide that I can use to plan my own journey?
 ruby depot
In stable baseline3 you have
VecFrameStack,DummyVecEnv
DummyVecEnvs run X fakes games for example:
Then VecFrameStack saves each one of this images of the game so it can learn?
if vecframestack is passed 4 now i have the memory of four diff games or i have the same game with 4 frames stacked?
 eager falcon
HELP:
I need to classify the query object into the tree and obtain the result as leaf of the tree [ 0 or 1 ]. The mapping is given by the df object.
Can someone write classify function for me which will be able to do that?
import pandas as pd
from pprint import pprint
from sklearn.feature_selection import mutual_info_classif
from collections import Counter

def id3(df, target_attribute, attribute_names, default_class=None):
    cnt=Counter(x for x in df[target_attribute])
    if len(cnt)==1:
        return next(iter(cnt))

    elif df.empty or (not attribute_names):
         return default_class

    else:
        gainz = mutual_info_classif(df[attribute_names],df[target_attribute],discrete_features=True)
        index_of_max=gainz.tolist().index(max(gainz))
        best_attr=attribute_names[index_of_max]
        tree={best_attr:{}}
        remaining_attribute_names=[i for i in attribute_names if i!=best_attr]

        for attr_val, data_subset in df.groupby(best_attr):
            subtree=id3(data_subset, target_attribute, remaining_attribute_names,default_class)
            tree[best_attr][attr_val]=subtree
        return tree

df=pd.read_csv("playtennis.csv")
print('Dataset: \n {}'.format(df))

attribute_names=df.columns.tolist()
print("\nList of attribut name")

attribute_names.remove("PlayTennis")

attr = {}
for i in df:
    count =0
    done = []
    add = {}
    for k in df[i]:
        if k not in done:
            new = {k:count}
            count += 1
            done.append(k)
            add.update(new)
    attr.update({i : add})

pprint(attr)

for colname in df:
    df[colname], _ = df[colname].factorize()

print('\n{}\n'.format(df))

tree= id3(df,"PlayTennis", attribute_names)
print("The tree structure")
pprint(tree)

query = {'Outlook': 'Sunny','Temperature': 'Cool','Humidity': 'Normal','Windy': 'True'}

 prime oak
is this considered overfitting? I'm training two models with 448 images each on yolov5

 hearty yarrow
Hello everyone 🙂 I have a list with 444 elements. I want to put the first 12 elements in an array and then the next 12 in another element and so on, to get a 37x12 matrix. Does anyone know a solution for this kind of problem?
wooden sail
if your data is a list, the easiest way is to put this into a numpy array and reshape
hearty yarrow
wooden sail
if your data is a list, the easiest way is to put this into a numpy array and re...
Thank you 🙂 this was quit easy. Sometimes I think too complicated.
 vestal shuttle
A more of a conceptual question than a coding one. Imagine you have a table of a hotel's guests over the year, including their check-in and check-out dates. Now you know that the hotel has less stays during winter months, and you establish that that happens due to both less guests visiting and shorter average time of stay. But can it be established which of these two is a more significant factor?
Should I just calculate correlation between the number of guests and these two (# of guests and avg stay)?
 sharp sorrel
Excel merged cell questions.
I have a task where I have to read in 40ish Excel files all with hideous amounts of merged cells. I was hoping for a better solution than ffill() the NaN cells in Pandas.
I ffill the cells with NAN to show the non-nan entry up to the next non-nan entry. I can then use unique to get values from my columns in pandas. Here is the function and the ffill part is at the end.
Any useful comments would be appreciated. BTW I'm no python developer, just some guy hacking his way around
# Handle excel merged cells
def merged_cells(inframe):
    cols = ['process_title',
            'process_description',
            'risk_id',
            'risk_owner',
            'risk_title',
            'risk_description',
            'risk_types',
            'risk',
            'level3',
            'associated_kris',
            'control_id',
            'control_owner',
            'control_title',
            'control_description',
            'control_activity',
            'control_type',
            'control_frequency',
            'de_oe',
            'de_oe_commentary',
            'net_risk_assesment_commentary',
            'risk_decision',
            'issue_description',
            'action_description',
            'action_owner',
            'action_due_date',
           ]

    # For each of the columns in cols, copy the contents of the merged cell
    # into the cells below until you get to the next cell with a valid value.
    # Continue to do this until all columns in our cols list have been processed

    inframe.loc[:,cols] = inframe.loc[:,cols].ffill()

    return inframe
I started with the algorithms, then I got interested in the math and learned a bit about it.
hasty mountain
Can anyone recommend a tutorial about Diffusion Models and Stable Diffusion?
(I don't consider "download pretrained model and run it" as tutorial...so no tensorflow)
 fading zealot
any data scientist over here?
 weary folio
How do I append for example [1,2] and then [3,4] to empty numpy array so I get [[1,2], [3,4]]? I have tried np.append and i'm getting [1,2,3,4]
wooden sail
i would strongly suggest you don't append to numpy arrays at all, as this is very slow
it's better to preallocate an array of the final size and then assign elements to it via slicing
or append to a python list and then convert the final list to a numpy array
serene scaffold
wooden sail
it's better to preallocate an array of the final size and then assign elements t...
preallocation is some C shit
wooden sail
that's exactly the problem 😛
north barn
if anyone here plays Magic: The Gathering i built a quick and dirty website which recommends cards for your deck https://nullonesix.github.io/
coarse plume
Is it possible to sort large chunks of data using an RNN? For instance:
The input is: APPLEPIMATH1213
The output is 1123AAEHILMPPPT
All letters should be grouped together. The output should also be reversible (output as input = original input).
My approach would look like this: The dataset consists of two columns. The first column contains sorted text, and the second column contains the unsorted text. At the end of the training process, I would like to input the sorted text and the LSTM should output the unsorted text. Is it possible to train an LSTM in this way?
serene scaffold
coarse plume
Is it possible to sort large chunks of data using an RNN? For instance:
The inpu...
why would you want an RNN to do something that's deterministic?
north barn
iirc rnns can sort but there are better neural architectures for this (eg ntms)
north barn
serene scaffold
why would you want an RNN to do something that's deterministic?
for science
@coarse plume yes it's possible
coarse plume
serene scaffold
why would you want an RNN to do something that's deterministic?
Because it should be reversible. This is the input: 1123AAEHILMPPPT -> APPLEPIMATH1213
coarse plume
north barn
iirc rnns can sort but there are better neural architectures for this (eg ntms)
do you have an example of an NTM?
north barn
coarse plume
do you have an example of an NTM?
read the research article on neural turing machines
they talk about sorting in it
hasty mountain
wooden sail
it's better to preallocate an array of the final size and then assign elements t...
Oh...good to know...
Does this consume less RAM?
wooden sail
hasty mountain
Does this consume less RAM?
no, it's just faster
jolly garden
Hello, I have an “approach” questions, I have a big dataset ( that I need to strip down of the extra info tough it will be big), I want to access this data set with a determined set of filters that I put in place and then plot a 3 scatter plot, with labels and other stuff, since the data set is big I was wondering what approach you’ll take in this case, even with the filters in place I might get millions of hits, thank you !
I’m a total newbie both in programming and In data science
serene scaffold
jolly garden
Hello, I have an “approach” questions, I have a big dataset ( that I need to str...
saying that a dataset is "big" isn't all that informative. whether or not it's too large for basic data exploration techniques depends on a lot of things.
what is the data, anyway? a CSV with millions of lines? or a directory with a bunch of JSONs, or what?
jolly garden
The original file is a json, I’m using visit to plot stuff which doesn’t like json much, so I wrote a little converter but I need to clean it up, for now I’m accessing a csv test file with 250k lines in it, not recalling the exact number but it’s like 250 keys
serene scaffold
jolly garden
The original file is a json, I’m using visit to plot stuff which doesn’t like js...
are you using pandas?
jolly garden
Multiline
serene scaffold
idk what that is
jolly garden
It’s a basically the json library that supports multiline json files
 molten hamlet
good book or not ?
 serene scaffold
molten hamlet
good book or not ?
serene scaffold
molten hamlet
good book or not ?
what do you currently know about ML?
molten hamlet
a bit
did wrote perceptrons, used deep ml models, on classifcation, cvnn, did some RL on open ai gym
would like book for some RL that would have some theory on timeseries models or something like rl agents playing on stocks
serene scaffold
@molten hamlet I skimmed through the book, and nothing sticks out to me as immediately terrible.
hasty mountain
If it says it's possible to make GANs with an unsupervised discriminator, tell me 
I've tested it and it didn't work, but I don't discard the possibility that the problem might be between the monitor and the chair
north barn
molten hamlet
would like book for some RL that would have some theory on timeseries models or ...
sutton n barto
ie the inventors of rl
molten hamlet
north barn
sutton n barto
this?
 north barn
molten hamlet
this?
north barn
molten hamlet
this?
ye theres a free online v
 iron basalt
I think there is a second edition with more up to date ANN stuff.
nocturne kelp
How many images are good for training a GAN?
hasty mountain
nocturne kelp
How many images are good for training a GAN?
In my personal experience, the more, the better
I was using around 6,000 images and it was a bit meh, but with Fashion MNIST(60,000), I achieved some results
But RGB images tend to be more difficult to make...at least from what I'm seeing now with CIFAR
Try testing a GAN with CelebA(which is the standar dataset people use in any tutorial) until you achieve good results, then use your dataset and update it little by little
north barn
nocturne kelp
How many images are good for training a GAN?
depends which gan, there are data minimal gans that require around 100 images
@nocturne kelp here: https://github.com/mit-han-lab/data-efficient-gans
fallen crown
Hi, is there anybody who is familiar with NEAT algorithm ? I don't understand very how innovation number is chosen for a connection ? I mean by that I looked at the structure of several neural network with their genome but I couldn't figure out how the innovation number is chosen for a connection, why sometimes there is a gap like this : 1, 2, 3, 11, 12, ...
if somebody can answer this, please don't forget to tag me, if not i will not see that you've gave me a answer, thank you
 worldly dawn
fallen crown
Hi, is there anybody who is familiar with NEAT algorithm ? I don't understand ve...
worldly dawn
fallen crown
Hi, is there anybody who is familiar with NEAT algorithm ? I don't understand ve...
Because the individual hasn't made use of the innovations 4,5,6,etc.
The innovation can just be a simple increment for new innovations
cyan tiger
hey guys, would there be any smart way to scrape the list of brokers on this website?
nocturne kelp
north barn
depends which gan, there are data minimal gans that require around 100 images
I am building a celeb face generator
vestal shuttle
vestal shuttle
A more of a conceptual question than a coding one. Imagine you have a table of a...
Just checking if anyone has ideas about this
 lost stream
Hey need some help. I'm working on a machine learning project using PyTorch on my Macbook with an M1 chip, which doesn't support GPU acceleration. I have access to virtual GPU clusters that i can access with x2Go but I'm not sure how to use them with my M1 Macbook to start my project. Any advice on how to set this up as efficiently as possible so I can get started on my project as soon as possible?
hasty mountain
nocturne kelp
How many images are good for training a GAN?
Protip: You might want to use Google Colaboratory/Amazon Sagemaker/Paperspace's Gradients
I was testing a conditional one here and it seems it requires quite many feature maps(100~1000) when you're using the DCGAN architecture.
The models couldn't converge in any way when I was using 3~100 feature maps(unlike the model I used for Fashion MNIST)
north barn
lost stream
Hey need some help. I'm working on a machine learning project using PyTorch on m...
have you ssh'd into the gpu clusters?
hasty mountain
However, DCGAN architecture has the problem that it can't allow skip connections and residual blocks. Maybe using an architecture similar to SRGAN/ESRGAN might mitigate this, but I'll test this later.
Though I suspect my model might've converged...only to collapse right after
nocturne kelp
hasty mountain
Protip: You might want to use Google Colaboratory/Amazon Sagemaker/Paperspace's ...
I am using Kaggle for now, and yeah it's DCGAN
 fading wigeon
I'm trying to do PCA on some, admittedly messy, biological data. But I'm coming across something I've never seen before and don't know what to do next nor how to interpret it.
The top three factors are only explaining around 55% of the total variance, I'm more used to that number being between 70 and 80. Also, it's almost entirely loaded on the first factor of around 40% while the other factors are less than 10%. Also have never seen that before. Any insight/suggestions?
wooden sail
fading wigeon
I'm trying to do PCA on some, admittedly messy, biological data. But I'm coming...
can you show a plot of the singular values?
fading wigeon
Well, right now I'm working off of data I zscored, so the plots would all be gaussian curves, lol. Considering doing it without, but I have to make sure they have a mean of 0 first, right?
I should also mention that I have near 1000 variables
But maybe I suck at age normed Zscoring or I made a mistake while transforming them all to gaussianity, I have no idea.
wooden sail
well, z scoring would be just subtracting the mean and rescaling, you're making a covariance matrix as usual
i'm just trying to check how correlated the columns are with each other/approximately how linearly independent the columns are/what rank your covariance matrix is
can you show a plot of the principal components?
fading wigeon
Well, our statistician performed the work, I'm trying to recreate it/do a sanity check. There are definitely variables that are highly correlated.
I admit that I have only a theoretical understanding of PCA and the process, lol
and that this isn't my expertise
wooden sail
at base level, it's a glorified eigenvalue decomposition
fading wigeon
wooden sail
well, z scoring would be just subtracting the mean and rescaling, you're making ...
I also wrote some code to try several different transforms to try to make weird distributions into guassians
wooden sail
ok, this last one can have weird results
fading wigeon
Yeah.
I basically transformed practically every variable into a gaussian curve by choosing a specific parameterized transform, lol
But maybe that was a bad idea, idk
wooden sail
it can be ok. but let's start by looking at the singular values
what you described earlier of having one very large value and the rest decaying quickly simply means the variables are correlated and you can safely ignore many of them
whereas in the present scenario, seems like the variables are more or less independent and you can't reduce your dimension much
fading wigeon
Should I try to perform variable reduction first?
Or is this iterative, where maybe I get all the variables in the first component and then perform PCA on just those?
wooden sail
no, you decide if you can do reduction AFTER checking the first of the pca first
fading wigeon
Okay.
wooden sail
also i think you're mixing up observations and variables there
fading wigeon
I probably am mixing up all kinds of things. There's a lot of pressure to move this project along and everyone is panicking, myself included
breathes
wooden sail
👀
fading wigeon
Do you know anything about clustering? If I understand it correctly, PCA is usually done before clustering, but is it valid to just skip this step?
wooden sail
clustering is a lot more expensive in higher dimensions, it's a good idea to PCA and reduce dimensions (if possible) first
fading wigeon
Gotcha
What do you mean by expensive in this context?
And yeah, we wound up with like 7 clusters, lol
wooden sail
expensive as in "the math is nasty and the computer takes a long time to do it"
doesn't matter much if you don't have much data
fading wigeon
Ah gotcha
Eh
We have clusters and computing hours
And taking weeks to sort out this PCA is also expensive in terms of the senior developer (me) going crazy trying to figure out if something is wrong with any of our upstream processes
wooden sail
sadly just looking at a PCA is not enough to say whether it's correct
you'd probably wanna run reconstruction tests after dimensionality reduction
project onto the chosen subspace and check how large the difference is wrt the original data
it's not difficult, the words just sound fancy
fading wigeon
Haha, okay.
Well, I'll just take this step by step. First step, installing sklearn 😛
Well, let's say the PCA is correct
What could explain 50% of the variance accounted for in the first 3 components and less than 10% in all the followup components?
wooden sail
your data being in an approximately 3 dimensional vector space
being explained largely by 3 variables
but i can't really say without actually looking at the singular values and then testing reconstruction errors
sometimes it's pretty difficult to decide on a good threshold at which to start throwing the components away
hasty mountain
hasty mountain
*Though I suspect my model might've converged...only to collapse right after*
Twas good everlasting 3 epochs...before it collapsed miserably.
Interestingly enough, I'm also testing a model in a smaller version of my dataset...and it's going fine past those epochs
||I thought math was supposed to be exact||
Oh...I just remembered that I'm also testing this smaller version in a model that isn't conditioned...meh
wooden sail
you're doing statistics, guarantees are usually provided in terms of expectation, not unique trials
 hallow crystal
Hello peeps!
I am currently preparing to pass Databricks Data Engineer associate certification as it is required by my employer, and looking for feedback.
Did anyone pass the exam? If yes, was the material available through the academy help you with it? Did you any additional resource besides documentation to prepare for the exam question? (edited)
austere swift
hasty mountain
Twas good everlasting 3 epochs...before it collapsed miserably.
Interestingly en...
GANs are pretty unstable models
hasty mountain
wooden sail
you're doing statistics, guarantees are usually provided in terms of expectation...
GANs are statistics?
wooden sail
all of ML is
hallow crystal
wooden sail
all of ML is
elements of statistical learning lol 👀
hasty mountain
austere swift
GANs are pretty unstable models
Yeah, I have to stop being so lazy and finally learn diffusion models...but the math...it'll require 500% of my brain 
And the tutorials I find out there are quite meh
austere swift
hasty mountain
And the tutorials I find out there are quite meh
https://jalammar.github.io/illustrated-stable-diffusion/ this one is pretty good
Translations: Vietnamese.
(V2 Nov 2022: Updated images for more precise description of forward diffusion. A few more images in this version)
AI image generation is the most recent AI capability blowing people’s minds (mine included). The ability to create striking visuals from text descriptions has a magical quality to it and points clearly t...
thats how I learned about them
hasty mountain
austere swift
https://jalammar.github.io/illustrated-stable-diffusion/ this one is pretty good
Nice! Thanks! I'll take a look
And there seems to be no scary math
jolly garden
Anyone willing to give a look to a Python ? .. it kinda does “almost” what I want tough something is not 100% right …
whole cloud
When constructing a pairplot visualisation in seaborn (sns) how do I completely remove a useless value, such as ID of both the x and the y axis? It's something I've been struggling for a while and I just can't understand where I am going wrong.
My df looks like this:
 hasty mountain
Oh...I just remembered that I'm also testing this smaller version in a model tha...
hasty mountain
hasty mountain
Oh...I just remembered that I'm also testing this smaller version in a model tha...
Just remembered that I'm using a single feedforward layer as vectorizer in the conditional GAN...a layer that I initialized with all weights = 0, so I can't expect it to not disturb and confuse the generator and the discriminator during the first epochs, I suppose...
fading wigeon
wooden sail
but i can't really say without actually looking at the singular values and then ...
Okay, I managed to get a PCA going and I'm getting similar results to our statistician. Here are the singular values, is this what you were mentioning?
[680.26163097 516.3377651 337.80906055 331.13262361 312.66126115]
Variance accoutned for
[0.2175713 0.12534801 0.05365278 0.05155296 0.04596188] was even worse than his
Granted, this was on the raw values where I didn't transform to gaussianity, I just used sklearn's standard scaler to to mean subtraction std_dev division
Doing it on zscored data is far better, but it only bumps up the first component to 30
hasty mountain
austere swift
https://jalammar.github.io/illustrated-stable-diffusion/ this one is pretty good
Wait...so it's a model trained to apply noise to an image based on a label(noised image)...then, in the image generation, I just have to pass a noise input to the model to make it predict some noise and subtract the prediction from the input?
This look like some self-learning... I like it.
fading wigeon
I ran it after I zscored, and it's far better
[443.02223623 252.09524669 201.39505049 196.73389078 176.51995865]
[0.32117281 0.10399609 0.06637206 0.06333534 0.05098887]
Still kind of garbage, but...
hasty mountain
And my non-conditional GAN is working so well now...I just had to use more feature maps...
I had this problem for...like...2 years...and the solution was simply using 10x more channels instead of adding more layers

 serene scaffold
whole cloud
I am getting this error in keras
serene scaffold
whole cloud
I am getting this error in keras
please always show error messages as text so that they're easier to read and refer to.
Do you know what the error message is telling you?
whole cloud
@serene scaffold, sorry my mistake, it's telling me my input shape is missing one dimension I think?
model.add(tf.keras.layers.Dense(8,activation='relu',input_shape=(8,11,)))
model.add(tf.keras.layers.Dense(3, activation='softmax'))
Is the code where I declare the shape
serene scaffold
whole cloud
<@253696366952316929>, sorry my mistake, it's telling me my input shape is missi...
yes. the leftmost dimension is usually used for batches. so if the input were a batch of three samples, the shape would be (3, 8, 11). looks like the 8 and 11 part always need to be the same
whole cloud
So I have tried adjusting my model.add(tf.keras.layers.Dense(8,activation='relu',input_shape=(3,8,11))) and now it says
ValueError: Input 0 of layer "sequential_1" is incompatible with the layer: expected shape=(None, 3, 8, 11), found shape=(8, 11)
serene scaffold
3 was an example
whole cloud
I don't think I'm getting what's going on and why it keeps wanting an empty dimension that I can't seem to provide it.
serene scaffold
try input_shape=(None, 8, 11) and see what happens.
I'm actually not a keras user.
whole cloud
Epoch 1/50
WARNING:tensorflow:Model was constructed with shape (None, None, 8, 11) for input KerasTensor(type_spec=TensorSpec(shape=(None, None, 8, 11), dtype=tf.float32, name='dense_input'), name='dense_input', description="created by layer 'dense_input'"), but it was called on an input with incompatible shape (8, 11).
ValueError: Unknown loss function: 'sparse_categorial_crossentropy'. Please ensure you are using a keras.utils.custom_object_scope and that this object is included in the scope. See https://www.tensorflow.org/guide/keras/save_and_serialize#registering_the_custom_object for details.

TensorFlow
serene scaffold
guess that wasn't the solution
@whole cloud can you do print(X_train.shape, y_train.shape)?
 honest verge
has anyone taken this course http://www.data8.org/ from UC Berkeley? Im interested in getting into the field of data science and was wondering if this would be a good course to start with.
data-8.github.io
 thorn bobcat
yo!
odd meteor
whole cloud
ValueError: Unknown loss function: 'sparse_categorial_crossentropy'. Please ensu...
The input shape is really just the number of columns your X-variables have. If you have a tabular dataset with 6 columns; 5 features and 1 label, then your input shape is 5.
So, for example...
model = Sequential()
model.add(Dense(8, input_shape = (5, )))
Alternatively, you can as well do it this way
model = Sequential()
model.add(Dense(8, input_dim = 5))
If the dataset is a text data or NLP related, then your input_shape in your RNN should be the number of unique words in whole dataset.
thorn bobcat
has anyone here heard of spiking neural networks or neuromorphic neural networks?
 zealous badger
are there any simple datasets i can use to practice Decision Trees on?
tacit basin
thorn bobcat
has anyone here heard of spiking neural networks or neuromorphic neural networks...
I think I've read about spiking nn once but forgot everything :). What's interesting in them?
thorn bobcat
tacit basin
I think I've read about spiking nn once but forgot everything :). What's interes...
I'm actually trying to do my graduation thesis on a way to think smarter about how we compute neural networks
mainly how we can optimise our computation approach and perhaps get more from our network while minimising the cost addition to computational complexity and intensity
I took interest in research about spiking nn's, after learning about neuromorphic neural networks from Intel and upon researching multi-modal approaches to stable diffusion.
tacit basin
Interesting. Is hinton's forward-forward also in the same category?
 velvet patio
data science on micheal saylor website? has anyone done it?
wooden sail
fading wigeon
Okay, I managed to get a PCA going and I'm getting similar results to our statis...
ah it's only 5 variables. well, looking at the pca i would say you probably can't ignore any of the variables/can't reduce the dimension at all. you can still try though. you'll have to see weather you find the error acceptable
thorn bobcat
tacit basin
Interesting. Is hinton's forward-forward also in the same category?
I haven't looked at it..
but in a way this should better describe the problem
is there a way to represent a relationship between 2 vectors, with no relationship, given you can set know their initial values?
wooden sail
what kind of relationship between vectors are you looking for
thorn bobcat
wooden sail
what kind of relationship between vectors are you looking for
hm.. please bare with me it's a long explanation but what i'm trying to do basically is.
I want to do the multiple computations in the same step to perform multiple ML processess simultaneously.
For example maybe run multiple variations of stable diffusion in parrellel
so I can get the output from 12 different variations of the model from huggingface.
or maybe do speach recognition, text prediction, sentiment analysis, multiple processing via the same forward pass on the same network.
Can a sort of relationship or equation exist that can map my outputs from model A1 --- An? Seems plausable in theory but would it optimise the computational intensity of running Multiple ML models, is it practically duable, I'm looking for insight, feedback, criticism and input in general on the validity of this proposal.
wooden sail
map them to what?
thorn bobcat
to each other.
wooden sail
in which way? the word map is very vague 😛
wooden sail
nope
but nevertheless "map" is just "a function" in mathematics, so you haven't given enough info of what kind of comparison you want to do
thorn bobcat
wooden sail
but nevertheless "map" is just "a function" in mathematics, so you haven't given...
hm... okay so assume we applied 3 different weight initialisations of a neural network a, b, c:
assume i had an input x, is there a better approach than going at them independantly, this is from a computational and mathematical standpoint.
thorn bobcat
Assuming i had to do some mathematical operations, labelled a, b, c respectively. The question is rather than finding a(x), b(x), c(x) independantly, is there some sort of u(x) that exists in the sense that u(x) can represent a(x), b(x), c(x)?
thorn bobcat
wooden sail
faster? more efficient (in some sense)?
an approach where my forward propogation steps are simultaneously or in parallel rather than in batches or sequentially..
wooden sail
the forward propagation is sadly iterative, meaning that with a fixed set of initial parameters and data, you need to do the steps sequentially
on the matter of separate sets of data and/or initial parameters, in standard processors you can do this concurrently through parallelization but running the same thing several times on different parts of the hardware
thorn bobcat
wooden sail
on the matter of separate sets of data and/or initial parameters, in standard pr...
how about a function for latent embedding?
or maybe some sort of function that can be applied, dealing with the points as a graph and trying to find an equation that describes both the graphs?
wooden sail
as embedding is essentially a dense layer with fewer outputs than inputs, it's the type of linear algebra operation that is heavily optimized in current processors. this is done in parallel automatically by all ML modules
thorn bobcat
wooden sail
as embedding is essentially a dense layer with fewer outputs than inputs, it's t...
so it's like downsampling?
wooden sail
not necessarily, since the outputs can be linear combinations of the inputs
i'd think of it more like a change of basis, since ideally you'd keep the dimension of the data intact. dimension is an invariant, so it stays the same regardless of the dimension of the vector space the data is embedded in (as long as this embedding dimension is >= the one of the data)
thorn bobcat
wooden sail
not necessarily, since the outputs can be linear combinations of the inputs
that's what I'm looking for!
linear combinations!
wooden sail
that's what all matrix products do
these already happen in parallel in your cpu and gpu
thorn bobcat
so i can represent 4 matrices than can still retain the values of the previous 4?

it's more like compression
[a] [b] [c] [d] ==> [x], where [x] is a function that retains the spacial data of each of the matrices a, b, c, d?
it's just compression somehow right?
thorn bobcat
wooden sail
sure
I'm trying to do this, any idea what this topic is called
currently this fits in nicely with neuromorphic neural networks, spiking neural networks.
I'm preparing my references.
wooden sail
matrix inversion, at the base level
more generally, these are "inverse problems"
and a special kind of them where this is commonly done is called "compressed sensing", one kind of "regularized inversion"
related to this is "dictionary learning"
neural networks do all of this at the same time in a black box fashion
thorn bobcat
also the steps are applied as functions, so assuming I want build not sequentual backpropogation for some sort of targetted backprop, I could do the inverse right?
or actually
lemme take it step by step :p
I'm running an AMD Radeon Pro Vega 56.
I really appreciate the help tho! this is going straight in my proposal!
and medium.
wooden sail
proposal for what?
thorn bobcat
wooden sail
proposal for what?
Graduation thesis.
I'm a 4th year computer science student, hoping to do a technical graduation thesis form my bachelors of computer science with some math..
.-. I want to either win the nobel prize or graduate trying
wooden sail
well, hopefully you graduate 😛
thorn bobcat
wooden sail
well, hopefully you graduate 😛
yeaaa that's what I am stressing about
but finishing uni at 26 after an year bachelors journey, pressure
my goals, are meh..


idk
wooden sail
i would say not to worry about the age part
thorn bobcat
wooden sail
i would say not to worry about the age part
Totally freakin Agree
but a chics gotta learn how to fly eventually.
The way of the world is that of natural selection, law of the jungle, survival of the fittest & competition, and then there's dreams.
lapis sequoia
average predictions in ohio
 young granite
does one know how to create a plot of a pandas df from a dict in which keys are the dfs-names and values are the df by:
pd.concat({key: dict[key] for key in dict})
the resulting df has a multiindex of dfs-names and the row numbers of the df.
i dont want to use a for loop
.groubpy on the level didnt worked out
the tracename would be df.index[x][0] while data would be df.col1[x], df.col2[x]
 cursive lance
Can someone teach me pandas pls 😭 I'm 17 year old high schooler i need to learn pandas
young granite
cursive lance
Can someone teach me pandas pls 😭 I'm 17 year old high schooler i need to learn...
!resources
arctic wedgeBOT
Resources
The Resources page on our website contains a list of hand-selected learning resources that we regularly recommend to both beginners and experts.
young granite
try something easy in the beginning maybe just switch from excel to python
cursive lance
Ehh how should I learn from this
young granite
click on beginner
cursive lance
young granite
try something easy in the beginning maybe just switch from excel to python
Wut I'm using python
Pycharm to be specific
cursive lance
Ok where do I get pandas tutorial
young granite
type in pandas 🗿
cursive lance
I did bruh i song dumb 😭😭
ain't*
WAIT PANDAS CAN BE USED TO MAKE GAMES
Didn't know that
@young granite which is the best server to learn pandas
young granite
@cursive lance there is no best sever to learn pandas as mentioned if u want to learn something u gotta invest time.
That said u can learn by book or YT-Videos
cursive lance
Yeah but yt videoes are not extensive
cursive lance
young granite
<@956913750856851486> there is no best sever to learn pandas as mentioned if u w...
Ok theb
Then*
whole cloud
odd meteor
The input shape is really just the number of columns your X-variables have. If y...
I'm still struggling with this, it should be 11 (id is not used in the training) and class is the output
 lapis sequoia
Is this about hacking?
 vivid cove
thorn bobcat
I'm a 4th year computer science student, hoping to do a technical graduation the...
vivid cove
thorn bobcat
I'm a 4th year computer science student, hoping to do a technical graduation the...
good for u man
 serene plume
Is this np.sum(a, keepdims=True).squeeze() always equivalent to this np.sum(a)? I have the former in my code and I'm wondering if I can safely replace it with the latter
wooden sail
yeah it's the same
serene plume
Thank you
stone glacier
hey all, it's me again
do any of you have a good link for a list of social media analytics projects?
mostly a topic +dataset (if possible)
 jagged plaza
Hey all! New to Python and trying to expand a bit. Work in BI and data science. Was able to get a MySQL to Python connection established and returning accurate data, which was exciting.
Curious, anyone have any good resources to complete an ETL process leveraging Python? I have some connection and ETL files established, just very raw and having trouble finding direction for all the variables I need. Rather take a stab at this with a solid resource instead of dumping all the messed up code in here haha.
I really appreciate the time and looking forward to working with you all!
stone glacier
I dont want a done project. Just some pointers to find a good one to start working on
unique ridge
Hey there, i am working with greenhouse data. In this dataset i have attributes that describe the temperature, humidity and radiation. These 3 attributes all have a different scale value like degree Celcius, % and Watt per square meter. In the data preperation step of mine, I did not made the data stationary, because the attributes do impact the inside temperature. Now I want to normalize my data a bit to check if my regression model gives back better scores. My question is now; Is normalizing the data also not making it stationary or am i just messing up 2 concepts?
unique ridge
stone glacier
do any of you have a good link for a list of social media analytics projects?
mo...
maybe you can check github repos or Kaggle?
stone glacier
unique ridge
maybe you can check github repos or Kaggle?
that's a start. Interestingly, there's a tag in Github with "social media analytics"