#data-science-and-ml
1 messages · Page 36 of 1
 lapis sequoia
you can learn it all on the go
its only if you are doing advanced research i.e. a PhD in academia or a Research Scientist in industry that you would need maths beyond an elementary level or level that you can learn easily on the go
 dusty valve
Did you get testing and training mixed up on the plot?
And what kind of model is that
lapis sequoia
anyone got a good tutorial for ai chat bot i'm a beginner in a.i
 fallen crown
Hi, I have a dataset of 500 samples and one feature, generated with the method 'make_regression' from sklearn
I code a linear regression programm and here are the results

my parameters do not converge at all towards their optimal value and i don't know why
 shell sequoia
I have created a ai world with python
Also a encyclopaedia with python

Oli is the next generation c⍟⍟lest encyclopedia and trends teller
lapis sequoia
lapis sequoia
anyone got a good tutorial for ai chat bot i'm a beginner in a.i
This python chat bot tutorial will show you how to create a deep learning chat bot using python tensorflow and nltk. After following this tutorial you will be able to use and deploy your chatbot to do things like answer questions about your business.
lapis sequoia
shell sequoia
https://play.google.com/store/apps/details?id=oli.max.oli&hl=en_US&gl=US&pli=1
What is the process to put an app on google play and does it cost to have it on there?
 cedar night
fallen crown
my parameters do not converge at all towards their optimal value and i don't kno...
cedar night
fallen crown
my parameters do not converge at all towards their optimal value and i don't kno...
ur doing it from scratch?
fallen crown
cedar night
ur doing it from scratch?
yes from scratch
fallen crown
cedar night
nicee
what nice ?
cedar night
fallen crown
what nice ?
umm...
fallen crown
with a learning rate of 0.001 instead of 0.01 it works well
 cedar night
r u using sgd?
fallen crown
no batch descent gradient here
and i compared to the resulst obtained with normal equations
 sacred halo
Hi everyone, I had Anaconda in my laptop and uninstall it (Anaconda creates its own virtual environmet). Now, I am facing issue in running python modules. I activated virtual environment in VScode and run a simple file there like import numpy as np. While numpy has been installed in VScode, after running the simple code (in the screenshot) again it does not recognize numpy. Any solution have in mind? I ask it here because used Anaconda to run my data science packages and now faced this issue. Hope I can run my codes without having Anaconda. Thank you
 cedar night
fallen crown
and i compared to the resulst obtained with normal equations
cedar night
fallen crown
and i compared to the resulst obtained with normal equations
I have AI/Ml exam tommorow
cedar night
cedar night
I have AI/Ml exam tommorow
and like im forgetting everything at this point
fallen crown
cedar night
I have AI/Ml exam tommorow
Hoo that could be problem for your exam 😅
cedar night
I would have suggested using sgd but the data set is too samll
cedar night
fallen crown
Hoo that could be problem for your exam 😅
Umm not to code but the mats yeah
fallen crown
yes, to small here but with a loop on sgd why not
lapis sequoia
sacred halo
Hi everyone, I had Anaconda in my laptop and uninstall it (Anaconda creates its ...
install numpy from cmd?
dusty valve
Anaconda sucks
lapis sequoia
yeah its unnecessary
dusty valve
Use venv or pyenv instead
cedar night
fallen crown
yes, to small here but with a loop on sgd why not
sgd is the one where u devide it into minibatches and apply gradiendt descent individually right?
fallen crown
but in this case with only 500 samples and 1 feature, normal equations is the fastest and best way to do it, but i prefer bgd becase it more complexe
right
no sorry
cedar night
fallen crown
but in this case with only 500 samples and 1 feature, normal equations is the fa...
bruh
ur scaring me
fallen crown
stochastique descent gradient, parameters are updates for each sample prediction
cedar night
lemme checck
sacred halo
lapis sequoia
install numpy from cmd?
I did. I created a virtual environment and install numpy there. You meant do not install numpy in virtual environment and install it without activating virtual environment? Thank you
fallen crown
with mini batch it is called "mini-batch gradient descent"
 celest geyser
lapis sequoia
its only if you are doing advanced research i.e. a PhD in academia or a Research...
celest geyser
lapis sequoia
its only if you are doing advanced research i.e. a PhD in academia or a Research...
i just need fir job
cedar night
fallen crown
with mini batch it is called "mini-batch gradient descent"
yeah that
sgd is the one where u just pick a subset of random values from the data
 echo vigil
When you create a sqlcontext sc in pyspark, what flavor of SQL do the queries need to be written in when you call sc.sql(...)?
 patent lynx
df.loc[index_posistion] = [Value_1, Value_2, Value_3, ....] assign value based on the index number
fallen crown
cedar night
sgd is the one where u just pick a subset of random values from the data
u pick a random sample
mini batch descent gradient, u pick a random mini_batch
 supple scroll
How would you set up a model that can take in any amount of input?
Like, for example, if you wanted to feed it a single image or a bunch of images, it would be able to accept either without issue.
 hasty mountain
Maybe ChatGPT's API is a bit overloaded?
 austere swift
try setting stream to False in the create function
it should be false by default, but that's the parameter that determines whether to return partial responses
 tawdry sequoia
when there is more no. of epochs your model starts to memorize
 low island
 versed gulch
does anyone know how to make the maximum number bold in each column of the dataframe in pandas?

 mild dirge
tawdry sequoia
when there is more no. of epochs your model starts to memorize
mild dirge
tawdry sequoia
when there is more no. of epochs your model starts to memorize
This would mean the test loss would increase though
 teal olive
hey friends
can i ask an excel related question here?
tawdry sequoia
mild dirge
This would mean the test loss would increase though
Exactly
lapis sequoia
any opinions on this https://www.learnpytorch.io/ ?
 tribal bloom
versed gulch
does anyone know how to make the maximum number bold in each column of the dataf...
tribal bloom
versed gulch
does anyone know how to make the maximum number bold in each column of the dataf...
Yes, you can use the DataFrame.apply() method to apply a function to each column in the DataFrame. The function should check for the maximum value in the column and use the DataFrame.style.applymap() method to set the text format of the cell containing the maximum value to 'bold'.
 young granite
versed gulch
does anyone know how to make the maximum number bold in each column of the dataf...
young granite
versed gulch
does anyone know how to make the maximum number bold in each column of the dataf...
apply.style
 plush jungle
How do you get a folder of images from google drive into collab? I'm trying like this
import gdown
gdown.download(apple_train_link, "apple_train.zip", quiet=False)
!unzip apple_train.zip -d apple_train.zip
apple_train = "content/apple_train"
apples = os.listdir(apple_path)```but it downloads the zip folder as a file and when I try to unzip it it doesn't do anything and listdir can't find it
I know you can link your drive to the collab, but that only works if you share your whole drive
 soft badge
guys the logical of Open IA is dificult to do? or require a loot data for train?
austere swift
soft badge
guys the logical of Open IA is dificult to do? or require a loot data for train?
if you're talking about gpt-3, then yes
it was trained on 45tb of data
tribal bloom
u just press unzip
austere swift
and the model itself is 800gb (which you'd need to store in gpu memory, and keep in mind that normal consumer gpus usually have around 8gb)
austere swift
 mint palm
how do you extract a tar.gz file?
mint palm
how do you extract a tar.gz file?
if you're in windows try using 7-zip
the tar command works well with .tar and .zip but not .tar.gz
 wide pumice
Medium
OpenAI is changing the world, but how good is ChatGPT at programming?
 hollow sentinel
second time i've seen that article here
dusty valve
Seen it way too many times
 delicate apex
also, nice authorship disclosure
 misty flint
lmao biased
literally
great article by the rockstar mikiko https://mikiko.hashnode.dev/what-an-mlops-engineer-does

Building ML Products & MLOps Practices
📆 And What The Week Can Look Like
pretty thorough too. she shares an example schedule too
 burnt tusk
does anyone know what this message means

i keep getting this when ever i try to run TensorFlow library on replit
 rugged comet
Even after running
train_ds = train_ds.map(lambda x, y: (tf.cast(x, tf.float32), tf.cast(y, tf.float32)))
I still get this error
TypeError: Value passed to parameter 'input' has DataType uint8 not in list of allowed values: float16, bfloat16, float32, float64, int32
when calling model.fit.
What's going on?
young granite
anyone knows good method to smoothen a curve using scipy?
I did tried the obvious savgol and interpolate, they do work fine
but sometimes there is a gap in the original datapoints which leads to sharp peaks.
Is there a method to use for example nearest first and after that cubic?
Cause i want all values to be represented close to the original value.
soft badge
austere swift
it was trained on 45tb of data
Omg
soft badge
austere swift
and the model itself is 800gb (which you'd need to store in gpu memory, and keep...
This is insane
 potent cradle
Hello All,
Could you please help me at fix this error;

 urban prism
I have multiple CSV files and they have information about the same people. One of them have same data on different occasions so there are multiple rows about the same person (picture). I'm trying to merge this with another CSV since I want to use the data on that one as well. Which makes it end up have even more rows. The thing is that the final output CSV must be a fixed number of rows. If I just merge the CSVs for train, I naturally should use the same pipeline for test CSV as well and it gives me a output CSV with more rows than what is wanted. How can I use the data without causing more rows to be added?
 lapis sequoia
I am supposed to find which tree species should be planted in specific areas of the US (based on their diameter and health status)
is this considered a geospatial analysis ?
lapis sequoia
sacred halo
I did. I created a virtual environment and install numpy there. You meant do not...
Wdym virtual environment?
sacred halo
lapis sequoia
Wdym virtual environment?
I installed venv and then entered into the virtual environment. This create a isolate environment for coding in Python to share your work with others later or do projects with peers.
 cerulean ginkgo
Hi guys I got a problem with my the evaluation of my VGG-16 feature extraction model, I always got the same result at evaluation 100% predictions to 1 class.
It might be overfitted but I use early stopping and regularization to avoid that, also seeing the training-evaluation acurracy curve everything looks normal
I'm using tensorflow with Keras to implement the model
the datasets are balanced for each class, what could be wrong?
 odd meteor
potent cradle
Hello All,
Could you please help me at fix this error;
odd meteor
potent cradle
Hello All,
Could you please help me at fix this error;
This is not legible enough for me.
odd meteor
soft badge
guys the logical of Open IA is dificult to do? or require a loot data for train?
Aside the compute problem you'd have to contend with, I'll like to mention that OpenAI isn't really open 😀
Yeah, we now have ChatGPT but do we really know for sure what lies therein? Nobody knows, except of course you work at OpenAI.
The summary of what they released on ChatGPT being a LLM and at same time sort of a RL in production is only but a tip of the iceberg!
We still don't know 100% what's really inside ChatGPT. So OpenAI isn't really open after all!
odd meteor
cerulean ginkgo
It might be overfitted but I use early stopping and regularization to avoid that...
What did you observe from the error analysis? Did you try changing hyperparameters or train w/o regularisation... Is the problem still persistent after that?
soft badge
odd meteor
Aside the compute problem you'd have to contend with, I'll like to mention that ...
Understand
soft badge
odd meteor
Aside the compute problem you'd have to contend with, I'll like to mention that ...
Really is very insane this IA
 spare briar
missing some details but the core of chatgpt is in this paper https://arxiv.org/abs/2203.02155

arXiv.org
Making language models bigger does not inherently make them better at
following a user's intent. For example, large language models can generate
outputs that are untruthful, toxic, or simply not...
plush jungle
how do you get a dataset into google collab?
since if you upload the folder manually, it deletes it whenever there's a new runtime, right?
 winged yew
is there any way to convert multiple column value to binary 1-0 ? (pandas)
like sex(m,f) , job(yes,no) --- > 1,0
plush jungle
misty flint
you can also mount your drive
I just mounted my drive, will other people who run the ipynb file be able to use it even though they're not logged into my google account?
hasty mountain
odd meteor
Aside the compute problem you'd have to contend with, I'll like to mention that ...
I kinda noticed that when I perceived that PPO only works with gym...
And since then I'm trying to make a RL algorithm without gym and PPO
Too bad I'm having some problems with the optimization process. I don't know exactly how my model would know how to calculate its gradients after it has made a move, so I'm just testing some TD-Learning and making it try to predict its cumulative reward.
But maybe now that I'm studying a bit of self-learning I might get some ideas anyday...
misty flint
plush jungle
I just mounted my drive, will other people who run the ipynb file be able to use...
no they will not.
is that what you want to do? you can store your dataset on github and use commands like wget to fetch the dataset
plush jungle
misty flint
no they will not.
is that what you want to do? you can store your dataset on g...
github says it won't upload more than 100 files at a time. should I zip it and then unzip it in collab?
cause like, I tried downloading the zip folder from drive and unzipping it and it couldn't be unzipped
hasty mountain
plush jungle
github says it won't upload more than 100 files at a time. should I zip it and ...
I think you can avoid this 100 files limit using Git
plush jungle
hasty mountain
I think you can avoid this 100 files limit using Git
ok that worked, thanks. Then you can just download it from the github link with requests or what?
hasty mountain
plush jungle
ok that worked, thanks. Then you can just download it from the github link with...
You can use a git clone to clone that repository into your machine (or into google drive) or you can download the .zip file directly from github
plush jungle
hasty mountain
You can use a git clone to clone that repository into your machine (or into goog...
how can you download directly from github?
with a linux command or a module?
oh wait, rex said with wget
hasty mountain
plush jungle
how can you download directly from github?
 plush jungle
no i mean in collab
hasty mountain
Linux command I don't know, but probably wget and git clone...
Something like that...
shell sequoia
set-size-of-scatterplot-as-count-in-seaborn-python

Stack Overflow
I have a basic scatter plot and code for the same is
import seaborn as sns
tips = sns.load_dataset("tips")
sns.scatterplot(data=tips, x="total_bill", y="tip")
Now, I ...
misty flint
plush jungle
ok that worked, thanks. Then you can just download it from the github link with...
are you familiar with the git clone command
try it
actually before trying it, read this documentation https://docs.github.com/en/get-started/getting-started-with-git/about-remote-repositories
plush jungle
misty flint
are you familiar with the git clone command
I just didn't see it cause collab doesn't refresh the file structure until you click on another directory
it worked great, thanks
misty flint

 normal fern
Why are horizontal bar plots in pyplot in reverse order? If I have a pd.Series object in descending order, it gets plotted in ascending order. I have to call df.sort_values(ascending=True).tail() to get a descending order hbar plot.
I couldn't find a quick and easy way to force descending order in matplotlib either. This answer seems syntatically clunky:
https://stackoverflow.com/a/53983126
 tiny trellis
use seaborn :p
misty flint
plotly 
tiny trellis
misty flint
~~plotly~~ <a:Running:955778347214962688>
ggplot2
rugged comet
I am looking on some feedback for this notebook that I wrote. Anything and everything you say about it could be helpful to me.
https://www.kaggle.com/code/urkchar/diagnose-pneumonia-95-test-acc
Explore and run machine learning code with Kaggle Notebooks | Using data from Chest X-Ray Images (Pneumonia)
plush jungle
!e
import numpy as np
test_input = np.random.rand(2,)
weights = np.random.rand(3,2)
print(np.dot(weights, test_input))``` arctic wedgeBOT
@plush jungle :white_check_mark: Your 3.11 eval job has completed with return code 0.
[0.66243589 0.31286105 0.4232545 ]
!e
import numpy as np

test_input = np.random.rand(10000,)
weights = np.random.rand(3,2)

print(np.dot(weights, test_input))```@plush jungle :x: Your 3.11 eval job has completed with return code 1.
001 | Traceback (most recent call last):
002 |   File "<string>", line 6, in <module>
003 |   File "<__array_function__ internals>", line 180, in dot
004 | ValueError: shapes (3,2) and (10000,) not aligned: 2 (dim 1) != 10000 (dim 0)
!!!???
exactly what is happening here
oh wait
I'm thinking of matmul aren't I
this is dot
dot product needs them to share a dimension length
 wooden sail
plush jungle
I'm thinking of matmul aren't I
wooden sail
plush jungle
I'm thinking of matmul aren't I
those two are the same. matrix mult is done by taking several dot products
plush jungle
wooden sail
those two are the same. matrix mult is done by taking several dot products
oh so matmul would also fail here
wooden sail
yes
plush jungle
there's simply no way to multiply differently shaped matricies because the problem is undefined?
wooden sail
exactly
plush jungle
got it
wooden sail
at least 1 dimension needs to be shared. numpy hides this from you by attempting to automatically broadcast, so it sometimes lets you do stuff that should really be wrong
that can make code difficult to debug
 bold timber
Hello guys, annyone can enlighten me about hidden state in RNN? I'm so confused about this.
 cunning solar
bold timber
Hello guys, annyone can enlighten me about hidden state in RNN? I'm so confused ...
cunning solar
bold timber
Hello guys, annyone can enlighten me about hidden state in RNN? I'm so confused ...
In a recurrent neural network (RNN), the hidden state is a set of values that represent the internal memory of the network. These values are typically used to predict the next output in a sequence, based on the current input and the previous hidden state.
In other words, the hidden state of an RNN allows the network to maintain a sort of "memory" of the inputs it has seen so far, and to use that information to make better predictions about what will come next in the sequence. This is what makes RNNs powerful for tasks such as language modeling and machine translation, where the current output is heavily dependent on the previous inputs.
The hidden state is typically not directly visible to the user, and it is updated at each time step of the RNN based on the current input and the previous hidden state. The values in the hidden state can be thought of as a summary or representation of the inputs that the RNN has seen so far, and they can be used to make predictions about future inputs in the sequence.
bold timber
cunning solar
In a recurrent neural network (RNN), the hidden state is a set of values that re...
when we have 64 neurons like this, whether it means we have 64 hidden states in the RNN model?

 inland oar
Hi guys!
I am interested in building a word co-occurrence matrix amongst 10 words calculated using a corpus of all the tokenized words. If you want, I can elaborate this more but would appreciate any help.
 tall blaze
inland oar
Hi guys!
I am interested in building a word co-occurrence matrix amongst 10 word...
tall blaze
inland oar
Hi guys!
I am interested in building a word co-occurrence matrix amongst 10 word...
Share some code! Cosine similarity of the vectorized corpus might be a good place to start
 ornate wharf
how much statistics do i need to study for entry level data analyst job? which topics in particular? any good books for stats?
tall blaze
You don’t really need stats for a data analyst job. I would focus on data manipulation and visualization.
Your bread and butter would be:
Python - Pandas, matplotlib, seaborn
SQL - This is the biggest one. Study database entity relationships so you can join data effectively
Visualization tools like Tableau, powerBI, looker, etc.
tall blaze
If you can write complex sql code I would say just learn tableau
PowerBI is Microsoft alternative, not as widely used
tall blaze
That’s more engineer stuff
Wouldn’t hurt but etl is usually handled by engineering teams
Business intelligence, which is heavy tableau, is also like data analyst. Also a lot of orgs use SAS so it would hurt to familiarize
ornate wharf
never heard of it
tall blaze
It’s an old language that is not open source for handling data, kind of like R but instead of academia corporations used it
 hearty linden
I am trying to take the partial derivative of E at a point. Sympy has given me the functions mPrime and bPrime, but I do not know how to call them or otherwise get the derivative at a point in code. Does anyone here know how i could do this?

 versed gulch
tribal bloom
Yes, you can use the DataFrame.apply() method to apply a function to each column...
versed gulch
tribal bloom
Yes, you can use the DataFrame.apply() method to apply a function to each column...
thanks
tall blaze
hearty linden
I am trying to take the partial derivative of E at a point. Sympy has given me t...
Try using the .subs function
So like in
bPrimeAtPoint = bPrime.subs({M: x, B: y})
hearty linden
Okay that worked, thank you
tall blaze
Yep! Jogged my memory on that one!
patent lynx
is overfitting and data leakage essentially the same thing?
tall blaze
patent lynx
is overfitting and data leakage essentially the same thing?
No an example of data leakage would be to allow statically significantly information about two instances of what you are trying to make a prediction on “leak” between the rest and train sets
So if you are building a user prediction model and you had different data points from the same user in both the test and the train you have leaked data
patent lynx
So a test data "ends up" in a train set is called leaked data?
patent lynx
This is the problem I'm figuring out since some kagglers have problem with it: https://www.kaggle.com/c/store-sales-time-series-forecasting/discussion/277067

Use machine learning to predict grocery sales
tall blaze
Overfitting is when you overtrain the dataset to pick up noise in the sample that may not represent the population
Ooohhh in the context of time series you need to split the data between two date ranges to avoid leakage
So if you have dates from Jan 2020 - dec 2020 you would need like Jan - oct in train and nov-dec in test
I’d you mix dates from different sets of time you will create leakage
tall blaze
patent lynx
thx
Yep, and best of luck! Setting up and deciding interval lengths for time series datasets can be quite a headache.
ornate wharf
can someone tell me a good source to learn about how the stock market works and all the related terminologies???
 dusk tide
Hi
Can anyone tell how to use TPU on your custom dataset.
I am having difficulty understanding TPU implementation code .
Can anyone help??
ornate wharf
im trying to make EDA on impact of covid pandemic on stock markets of 5 countries
thats why i need some knowledge on stock markets
tall blaze
ornate wharf
im trying to make EDA on impact of covid pandemic on stock markets of 5 countrie...
I would say to get prices from the largest index for each of the 5 countries. Make sure to account for the underlying securities in the indexes. Like if you use the sp 500 for the us make sure the other countries index has all equity with a similar mix. I wouldn’t go further than that or you will create nightmares for yourself with the dimensionality level of the data
tall blaze
dusk tide
Hi
Can anyone tell how to use TPU on your custom dataset.
I am having difficult...
What package are you trying to use?
 cloud sand
dusk tide
Hi
Can anyone tell how to use TPU on your custom dataset.
I am having difficult...
cloud sand
dusk tide
Hi
Can anyone tell how to use TPU on your custom dataset.
I am having difficult...
TPU on a custom dataset?
 worn stratus
ornate wharf
can someone tell me a good source to learn about how the stock market works and ...
worn stratus
ornate wharf
can someone tell me a good source to learn about how the stock market works and ...
Investopedia
hasty mountain
dusk tide
Hi
Can anyone tell how to use TPU on your custom dataset.
I am having difficult...
This might suit you:
https://github.com/pytorch/xla
Example:
https://github.com/pytorch/xla/blob/master/contrib/colab/DC-GAN.ipynb
hasty mountain
Guys, when I apply a function to a numpy array, how does it happen in the backstage?
Example: I have a Sigmoid function sig = 1/(1+np.exp(-input)), where input can be a vector, a 2D array, 3D, etc.
Is this np.exp(-input) being applied through an iteration between each element in the array? Or does it simply flattens the array, iterates through the now single row of elements, and then recomposes the array dimensions?
wooden sail
there's very little difference between those two, they both just iterate through the array
it's applied in C though, which leads me to believe it does not reshape, just iterate. anyway most reshaping operations are just modifications of the stride, since it's expensive to reallocate the memory
 serene scaffold
hasty mountain
Guys, when I apply a function to a numpy array, how does it happen in the backst...
serene scaffold
hasty mountain
Guys, when I apply a function to a numpy array, how does it happen in the backst...
keep in mind that in the contiguous-block array that underlies the numpy array, there aren't rows or columns. it's just one sequence of all the values. and then it uses arithmetic to get values that are associated with a given row/column/etc
hasty mountain
serene scaffold
keep in mind that in the contiguous-block array that underlies the numpy array, ...
Oh, I see...
Well, the thing is that I was exactly trying to make a neural network from scratch in C++ using Eigen, but I don't know exactly how I would apply the activation functions(and probably the loss functions)
So, Numpy kinda uses a single vector in his C backend instead of a proper array?
serene scaffold
hasty mountain
So, Numpy kinda uses a single vector in his C backend instead of a proper array?
not sure what you mean by "proper array". but there are two different kinds of arrays at play here: numpy/mathematical arrays, and memory arrays
hasty mountain
serene scaffold
not sure what you mean by "proper array". but there are two different kinds of a...
it's just one sequence of all the values. and then it uses arithmetic to get values that are associated with a given row/column/etc
This case would be the memory array?
When I create an array in C++, it's a memory array, then? While when I use Eigen, it's a mathematical array?
(I've started learning C++ recently)
serene scaffold
idk what Eigen is.
 desert dew
Hi guys, I have a basic Q in Pandas.
I have a data frame with one column named datetime.datetime(2022,9,1,0,0) which shows as 2022-09-01 00:00:00.
Question: how can I get rid of the time stamp in the column name ?
serene scaffold
if you're using a memory array to represent a math array, and the math array has a shape of (4, 5), then every 5th element would belong to the rightmost column.
hasty mountain
serene scaffold
idk what Eigen is.
It's a C++ library to work with linear algebra. Seems kinda like numpy to me
I'm using it because it allows me to make matrices, so then I can make a neural network from scratch, without using tensorflow API
hasty mountain
serene scaffold
if you're using a memory array to represent a math array, and the math array has...
But if I use an array, my operation would be between arrays, and a neural network works with operations between matrices, isn't it?
I mean...when dealing with 2 dimensions...like in linear layers or Conv2Ds
wooden sail
that doesn't really matter. you can apply the linear transformations regardless of the representation you choose for the vectors, and the nonlinearities are applied elementwise
hasty mountain
wooden sail
that doesn't really matter. you can apply the linear transformations regardless ...
But the operations give different results if I use an array or a matrix.
wooden sail
they shouldn't
not if you did the linear transformation correctly
different representations of the same vector space are isomorphic
hasty mountain
But matrix operations and array operations are different, aren't they?
If my input is a matrix [2 3] and my weight is a matrix [[1.5 2], [5 5.5]], the result of input * weight is [2*1.5+3*5 2*2+3*5.5] = [18 20.5]
While if I use arrays, the result is something like [18 14.5]
(Damn, my math just sucked)
wooden sail
hasty mountain
But matrix operations and array operations are different, aren't they?
If my in...
they shouldn't be different if you mean for them to represent the same thing
you used two different operations if you got two different results, and one of them is wrong
show exactly what you did
hasty mountain
wooden sail
you used two different operations if you got two different results, and one of t...
I've just tested it
>>> import numpy as np
>>> input = np.array([2, 2])
>>> weight = np.array([[1.5, 2],[5, 5.5]])
>>> result_array = input * weight
>>> result_matrix = np.matmul(input, weight)
>>> print(result_array)
[[ 3.  4.]
 [10. 11.]]
>>> print(result_matrix)
[13. 15.]
What would be the correct one for a neural network?
wooden sail
right, the correct one is matrix multiplication, which is matmul or dot in numpy
- is elementwise or hadamard multiplication
that has different properties, and not the ones you want
those are two completely different operations
hasty mountain
I want the one that are used by neural networks
wooden sail
yes, matrix multiplication
that's the canonical way of representing linear and affine transformations
serene scaffold
gotta do input @ weight to get our money's worth
hasty mountain
Isn't the operation like [a11*b11+a11*b21]?
wooden sail
...right, so matrix multiplication, or dot
hasty mountain
So, if I want to implement a neural network from scratch in C++, I'll have to use matrices and iterate through each element, right?
I wonder then how Numpy converts arrays to matrices...
wooden sail
hasty mountain
So, if I want to implement a neural network from scratch in C++, I'll have to us...
you will do yourself a favor by reviewing the math behind matrix multiplication
all you need is clever indexing, the representation of the vectors does not matter
hasty mountain
Ok...I think I may have to review how I did my multiplication in the C++ code.
It returned the result for an array multiplication, despite I the fact that I tried making a matrix multiplication(I didn't even know that there was a difference between matrix and array operations)
I was also just checking this
https://www.mathworks.com/help/matlab/matlab_prog/array-vs-matrix-operations.html
Matrix operations follow the rules of linear algebra, and array operations execute element by element operations and support multidimensional arrays.

Ok, now I think I get it.
Array multiplications = element wise, a11 * b11.
Matrix multiplications = a11*b11+a11*b12
wooden sail
i would really suggest to focus on the math instead of how it's explained there. this is the first time in my life i hear of "array operations"
hasty mountain

wooden sail
sounds like an arbitrary name to explain elementwise operations
hasty mountain
At least now I know what it means when it says "element-wise operation"
soft badge
How I can verify if a column are empty or have value NaN?
tall blaze
soft badge
How I can verify if a column are empty or have value NaN?
For pandas passing a series through .isnull()
It will return a Boolean series
odd meteor
ornate wharf
how much statistics do i need to study for entry level data analyst job? which t...
You don't need to know much tbh. You basically need
- Measures Of Central Tendency
- Probability Distribution
- Hypothesis Testing
- A/B Testing
Since you are familiar with MySQL already, you need to check these now:
- Excel
- Tableau / PowerBI
- SQL

- Statistics
odd meteor
soft badge
How I can verify if a column are empty or have value NaN?
If it's in Pandas, you can use the famous isna() or isnull() method.
something like this: df.isna().sum() will return the sum of all missing values in each column.
Alternatively, you can use subsetting: df[df['column_of_interest'].isna() == True]
odd meteor
desert dew
Hi guys, I have a basic Q in Pandas.
I have a data frame with one column named ...
- You can use the famous
strftimeto format a time or a datetime object. - You can use regular expression on that column
- Call the
apply()method which has a lambda function + regex code on that column to get rid of the timestamp. - You can call
stron that column, to have access to a string method like (strip, split, replace etc) which will enable you get rid of the timestamp.
If you wanna use the 1st approach, this might help
https://www.programiz.com/python-programming/datetime/strftime
In this article, you will learn to convert datetime object to its equivalent string in Python with the help of examples. For that, we can use strftime() method. Any object of date, time and datetime can call strftime() to get string from these objects.
shell sequoia
I guys i have a question
I want to keep size of my seaborn scatterplot basend on counts that more the count lager the size
plush jungle
I made a neural net with just numpy, and it keeps converging to a single value for every input. The only time it doesn't do that is when I train it one the xor problem with 3 hidden layer neurons and one output neuron. What could be causing it to only give one output no matter the input?
odd meteor
shell sequoia
I want to keep size of my seaborn scatterplot basend on counts that more the cou...
Isn't this achievable using the size parameter in seaborn?
https://seaborn.pydata.org/generated/seaborn.scatterplot.html
https://mldoodles.com/seaborn-lineplot-size-parameter/#:~:text=Size parameter is used to,each one with different sizes.

Machine Learning - Simplified | MLDoodles
Plot multiple lines of different sizes. Learn how to set line size using a list, tuple and dict. Using a dict sets specific size for specific category
shell sequoia
Nope i mean based on count / frequency
odd meteor
shell sequoia
Nope i mean based on count / frequency
I think this is achievable using the size parameter although you might have to further customize it to give category with highest frequency a larger marker size and vice versa.
shell sequoia
It needs to done with pandas group by
tiny trellis
perhaps assign the count to a variable and call the variable in the size parameters
odd meteor
shell sequoia
It needs to done with pandas group by
This is how to use the size parameter to solve this kind of problem

Inspect the column of interest, get the value count of each category and then assign an appropriate size to it using sizes
shell sequoia
No i am not talking about variable
shell sequoia
odd meteor
Inspect the column of interest, get the value count of each category and then as...
Yes like that
But i need exact code for that
To get count i mean
young granite
@shell sequoia u once again dont give a full question 🗿
odd meteor
shell sequoia
To get count i mean
df['column_of_interest'].value_counts() will do it
shell sequoia
odd meteor
`df['column_of_interest'].value_counts()` will do it
Okay thanks
shell sequoia
young granite
<@807551900417130537> u once again dont give a full question 🗿
Yes i am like that
young granite
at least u honest 😄
plush jungle
my homebrew neural network does this when trained on xor with 3 hidden layer neurons:
nn.forward(np.array([0,0]))
nn.forward(np.array([1,0]))
nn.forward(np.array([0,1]))
nn.forward(np.array([1,1]))```
[0.00618396]
[0.99399432]
[0.9961862]
[0.00269753]```
so I know it actually trains properly
but when I try to train in on 100x100 images, no matter what I do, it just spits out one number for every test or train image
I've tried increasing the amount of hidden layer neurons, increasing the learning rate, and decreasing the learning rate
the only thing I haven't tried is adding more layers
 iron basalt
plush jungle
I made a neural net with just numpy, and it keeps converging to a single value f...
iron basalt
plush jungle
I made a neural net with just numpy, and it keeps converging to a single value f...
Weight initialization.
Have some negative weights.
(e.g. -1 to 1)
lr should be < 1
plush jungle
oh wow, np.random.rand only gives 0-1 values
iron basalt
Sigmoid at very positive x and very negative x has an almost 0 slope tangent line. So the weights don't change.
(0 with floating point cutoff)
(It's why sigmoid was replaced, with tanh and others)
plush jungle
wait but how do I generate random matrices between a range with numpy?
the internet says np.random.uniform
but that won't make matricies
just floats
iron basalt
2.0 * np.random.rand(...) - 1.0 (-1 to 1 (uniform))
iron basalt
plush jungle
the internet says np.random.uniform
You can always reshape.
Also uniform has a size parameter.
plush jungle
iron basalt
Sigmoid at very positive x and very negative x has an almost 0 slope tangent lin...
that was totally the problem. initializing with negative weights and biases as well caused it to start working
knowing theory really is a game changer
iron basalt
plush jungle
knowing theory really is a game changer
If you want deeper networks you will need a better weight initialization scheme than this one.
(And also switch away from sigmoid)
plush jungle
iron basalt
(And also switch away from sigmoid)
if I changed to relu, all of my sigmoid derivatives would have to become relu derivatives, right?
iron basalt
plush jungle
if I changed to relu, all of my sigmoid derivatives would have to become relu de...
If you use ReLU then there is no sigmoid.
 river sapphire
iron basalt
(It's why sigmoid was replaced, with tanh and others)
river sapphire
iron basalt
(It's why sigmoid was replaced, with tanh and others)
doesn't tanh also have this issue?
the issue where if you input very large positive or negative numbers into the tanh function it will give you the same output (-1 or 1)
iron basalt
river sapphire
doesn't tanh also have this issue?
Yes it's also a sigmoid function. But it has a better time getting unstuck (when near 0 slope) and getting hard-stuck requires larger values.
river sapphire
oh I see
iron basalt
There is sort of two ways of getting stuck. When you have exactly 0 you are stuck forever. But there is also getting stuck near zero. It's still changing, but VERY slowly, so it requires a ton of iterations (and also if your learning rate is low, even more iterations).
river sapphire
yeah then u get vanishing gradients lol
iron basalt
Tanh' has larger values, so it gets unstuck faster (and you have to go further to get to 0 cutoff).
river sapphire
interesting I never thought about that
so I did a quick google search and it says it has a larger range
because it's centered at 0
iron basalt
It's not a full solution like ReLU would be, but it can help a lot.
iron basalt

Desmos
soft badge
guys its possible i use regex on columns of dataframe?
serene scaffold
soft badge
guys its possible i use regex on columns of dataframe?
yes
 soft harness
What steps would I need to take to learn how to use machine learning to train a model to scrape websites?
 true scaffold
hey guys, web scraping problem here,
I'm trying to scrape CitedBy patents from this link using the following code but it is not working, getting empty []:
https://patents.google.com/patent/EP2019689B1/en
html = requests.get('https://patents.google.com/patent/EP2019689B1/en').content
soup = BeautifulSoup(html)
citedby = soup.find_all("div", class_='tbody style-scope patent-result')
citedby
output: []
As there are around 46 Cited by elements when I inspect it on website with this class name, but getting [] in output, can someone help?
mint palm
IN TRANSFORMERS, i see that the reason for multi head attention is to learn different aspects of input i.e different correlations that are there
but all these head take SAME input with DIFFERENT positions embedding
so i have 2 doubt:
- are they positional embedding used, firslty initialised with random numbers?
- is they are different, then, does it mean: the sheer cause of learning different aspects of inputs in due to different initialisation of embedding, which cause learning differently.
patent lynx
serene scaffold
yes
Is this a concern then? I got this future warning when using regex in python
The default value of regex will change from True to False in a future version. In addition, single character regular expressions will *not* be treated as literal strings when regex=True.
soft badge
guys have how i convert a columns in rows of each row of dataframe?
for example:
id column_1 column_2
1 item 1 item
i want this output:
id 1
column_1 item 1
column_2 item 2
cloud sand
mint palm
IN TRANSFORMERS, i see that the reason for multi head attention is to learn diff...
what do you mean by different positional embedding?
each of the heads take the same exact input, which includes the positional embedding
once you pass the first block there is no way to separate the positions anyways
cloud sand
soft harness
What steps would I need to take to learn how to use machine learning to train a ...
you don't need machine learning for that
mint palm
cloud sand
each of the heads take the same exact input, which includes the positional embed...
if each head has same input whats the point of multi head? It says multi head learns different aspects of same input.
how will it learn different things if input and later step is same
cloud sand
mint palm
if each head has same input whats the point of multi head? It says multi head le...
oh I see where you got confused
heads do get the same exact input, but they have different parameters
you could think of that like two different persons describing the same picture
the picture is the same, but the two people will highlight different aspects of it, and so you will get a more complete output
patent lynx
soft badge
guys have how i convert a columns in rows of each row of dataframe?
Pd.dataframe.transpose()
 candid dune
hey guys I am following a tutorial to building a neural network, and something weird with matrices is occurring

this is the example code I was following
all the matrices shown here have the same size
but when I attempted the same thing in my own program


based off what I know ab matrices the above should be impossible right?
wooden sail
which part do you mean by "above"
candid dune
candid dune
this
the program runs without any error even though there is multiplication of arrays of shape (10,41000)*(10,41000)
wooden sail
the * in numpy is elementwise product, not matrix multiplication
.dot() and matmul and @ all do matrix mult, but not *
go away bot
candid dune
ah
wooden sail
!e
import numpy as np
x = np.array([1,2,3])
y = np.array([1,2,3])
print(x*y)
@wooden sail :white_check_mark: Your 3.11 eval job has completed with return code 0.
[1 4 9]
for example.
candid dune
also
I am trying to find the mean of a large matrix and it results in an error
"/opt/conda/lib/python3.7/site-packages/ipykernel_launcher.py:2: RuntimeWarning: invalid value encountered in double_scalars"
 proper swift
Hi, is this a good place to ask about NLP related questions?
young granite
does one know which part of scipy peak_widths are the indices?
https://docs.scipy.org/doc/scipy/reference/generated/scipy.signal.peak_widths.html
so [0] is the width in samples:
results_full[0]  # widths
array([181.9396084 ,  72.99284945,  61.28657872, 373.84622694,
    61.78404617,  72.48822812, 253.09161876,  79.36860878])
my question is there [x] to directly get the index or do i need to build my own index_calculator?
desert dew
Hi guys.
I have come across a situation where I can’t find a solution so hopefully you’ll have some ideas to propose.
Im reading an excel spreadsheet in Pandas to do some data cleaning / formatting. All seems to work well, HOWEVER, there are some cells in the original spreadsheet that are coloured. When I read the spreadsheet as a data frame and then export it, those cells loose their color
I was just wondering whether there’s a way of “preserving the cells that are colored in the data frame” in way that when I export it back to excel, these stay coloured
wooden sail
not with vanilla pandas, according to google. i see mentions of openpyxl and xlrd
soft harness
cloud sand
you don't need machine learning for that
i know i dont need it to just scrape, but i want to make something that's a bit more of a 'universal' scraper
odd meteor
true scaffold
hey guys, web scraping problem here,
I'm trying to scrape `CitedBy` patents from...
I tried using Beautiful Soup now to see why you're unable to grab the table, and I got same result as yours. I could be wrong but I think why this is happening is because the table using JavaScript to load. Sometimes when a specific segment of a website; especially a table is being loaded with JavaScript, it usually would not return the complete table. However, in this case we're unable to even grab the table....
So proposed solution... This is probably what I'll do if I were in your shoe.
- Confirm if the website allows web scrapping in the first place. Check robot.txt file of the website as well
- Use Selenium / Playwright to do the web scrapping instead of Beautiful Soup ( Selenium always work when dealing with a table that loads with JavaScript )
proper swift
I want to group some interview questions together to discover group themes/topics using NLP. What would be the best way of doing this?
odd meteor
proper swift
I want to group some interview questions together to discover group themes/topic...
Sentence Embedding + Topic Modelling
true scaffold
odd meteor
I tried using Beautiful Soup now to see why you're unable to grab the table, and...
actually I already solved it couple of hours ago
thanks though
odd meteor
true scaffold
actually I already solved it couple of hours ago
Interesting. How did you solve the problem? Did you use Selenium / BeautifulSoup
true scaffold
I used BeautifulSoup
I had to print out the whole html mess and manually see the tags/itemprops and then write code accordingly
one time effort...
odd meteor
true scaffold
I had to print out the whole html mess and manually see the tags/itemprops and t...
Okay that's cool. It's kinda strange that your initial code grabbed not even a single thing from the website. Lol I had to quickly check it myself, and alas I got same result with yours
true scaffold
odd meteor
Okay that's cool. It's kinda strange that your initial code grabbed not even a s...
yup, that was really strange, then I printed the html that I got from beautiful Soup, and they were so different
this is the code I used, if you wanna take a look:
html = requests.get(url).content
soup = BeautifulSoup(html)
output = soup.find("h2", string=re.compile(r"Patent [cC]itations+\s\(\d+\)"))
next_elements = output.find_next_siblings()

patent_citations = []
for element in next_elements:
   citedElements = element.find_all('span', itemprop='publicationNumber')
   for citedElement in citedElements:
      patent_citations.append(citedElement.text)
Had to create a regex
proper swift
odd meteor
Sentence Embedding + Topic Modelling
Thanks. If it helps the data I'm working with looks kind of like this. https://media.discordapp.net/attachments/1052730788698931250/1052731029506510908/image.png
The ideal tokens represents an idealized version of the topics or tokens after processing. Which I could then group by or cluster
 odd meteor
proper swift
Thanks. If it helps the data I'm working with looks kind of like this. https://...
odd meteor
proper swift
Thanks. If it helps the data I'm working with looks kind of like this. https://...
Depending on the type of data you have and how advanced the semantics of the questions really are. You could use sentence embedding models that uses Transformer architecture like SentenceBERT or USE (Universal Sentence Encoder) etc. If you want a simpler model try Doc2Vec.
Alternatively, you can as well use the famous LDA for Topic Modelling if the label is unknown (unsupervised).
However, if your dataset has label use a simple Text Classification.
You might wanna start from Topic Modelling first to see what the result yields (I'm presuming the ideal token column is unknown at this point.)
mint palm
cloud sand
the picture is the same, but the two people will highlight different aspects of ...
and by different parameters you probably mean different embedding layer parameters that produce different embedded feature to be fed to encoder, right?
cloud sand
soft harness
i know i dont need it to just scrape, but i want to make something that's a bit ...
what do you mean by that? if you tell me more maybe I could suggest you specific techniques/architectures that would help you creating that
cloud sand
mint palm
and by different parameters you probably mean different embedding layer paramete...
not quite
the embedding layers are just at the very start of the model
and there is just 1 embedding layer
what changes are the parameters of the parameters mixing the embeddings in different ways
mint palm
cloud sand
what changes are the parameters of the parameters mixing the embeddings in diffe...
could you please give an example? or source where i can read about it
cloud sand
sure
give me a sec
@mint palm you can read section 3.2.2 of the attention is all you need paper
mint palm
ok, thank you, i think i didnt read it in detail first time
cloud sand
no worries 😄 if you have specific concerns about that feel free to write them here!
proper swift
odd meteor
Depending on the type of data you have and how advanced the semantics of the que...
Thanks for the detailed response! Should have mentioned that this will unsupervised NLP as the labels are not known. I have over 1000 questions from around 40 interviews. The only known labels are what Questions (Q) and the Responses (R) are. Not the actual topics/themes themselves.
The ideal_tokens column was just to illustrate the ideal output after running some kind of NLP. For which I could then use KMeans on.
soft harness
Sure thing! For example, ideally, I’m not having to write a script for each real-estate website I’m looking to scrape. Instead I train a model to sort of handle that for me. Replace real-estate with other e-commerce sites for example, or even government sites. What sort of things would be involved in this endeavor?
 hybrid void
Anyone have a suggestion for the best way to split long audio files (~10-20 minutes each) into shorter clips ( under 10 seconds each) and those clips be split based on silence, aka not in the middle of a word?
I'm trying to create a dataset of voice clips to use for training. It requires audio clips to be under 10 seconds each. Splitting based on silence is easy enough, but I want to ensure that each clip is in a certain range of duration, like 7-10 seconds. I don't really want a bunch of 1-second clips, and also would prefer it didn't split in the middle of words.
Don't need an exact solution but if anyone has an idea for a starting point would be appreciated
Actually nevermind, found a solution that should work unless someone has a better idea: https://github.com/jiaaro/pydub/issues/143#issuecomment-225385882
wooden sail
off the top of my head, i'd do some thresholding of the envelope of the signal. the envelope is always non negative, so what you can do after that is multiply it by -1 and use a simple peakfinder like the one probably included in scipy. then use peaks as splitting points if they're far away enough
you'd want those peaks to be "close enough" to 0, too, to make sure they correspond to silence
hasty mountain
Hey guys, in GANs is it a viable option to add dropout to my Discriminator in order to avoid that it gets way too better than the Generator?
This seems to make sense in the beginning of the training, but I don't see this option in the articles I read out there.
river sapphire
I got confused on the definition for value functions and Q(s,a) in a stochastic environment with a stochastic policy. So what exactly is the definition? Is the state-value function for a stochastic environment following a stochastic policy the cumulative discounted expected reward? What's the difference between expected return and expected reward? What's the equation for Q(s,a)?
misty flint
andrew ng just released this https://info.deeplearning.ai/how-to-build-a-career-in-ai-book

Get The How to Build Your Career in AI eBook By Andrew NG | Free download | an introductory book about starting and building a successful career in AI
looks promising

 torn hull
Hey guys anyone worked with yolov5s?
I was training my model in my local machine but it stops like after 2-3 hours(as it requires high end models)
So anyone have idea the configuration we need to train our yolov5s model on nearly 2000 image data
cloud sand
soft harness
Sure thing! For example, ideally, I’m not having to write a script for each real...
that's a bit vague
what should be the model input and output?
soft harness
cloud sand
what should be the model input and output?
Sorry for the vagueness. I’m not knowledgeable about this. Ideally, I suppose, the model should take ‘things to scrape’ and ‘websites to scrape’ then output the scraped things
I’m guessing that doesn’t clear much up
 thorn zephyr
river sapphire
I got confused on the definition for value functions and Q(s,a) in a stochastic ...
thorn zephyr
river sapphire
I got confused on the definition for value functions and Q(s,a) in a stochastic ...
In general, rewards are short term, while return or values are long term. What we care are the expected return (i.e., value). You can express Q(s, a) as a recursive function, or as an expression of V(s). Check out Rich Sutton's text book. Let me know if you have further questions.
Also, both env and policy are stochastic in general.
An intuitive definition of Q(s, a) is that if I am at state s, and take action a, what is my expected return onwards? That expected return is defined as Q(s, a).
Hope that helps.
 craggy shadow
what are functional and non functional requirements for a chatbot?
patent lynx
Is a levene test somewhat a similar test to the I^2 test for heterogeneity?
Or there is a power difference between them because I^2 leans more to meta-analysis?
 wooden sail
 white jacinth
how can I solve this?
white jacinth
how can I solve this?
don't forget to normalize r
patent lynx
white jacinth
I use formula but it doesn't work
Did you confuse with the scalar projection?
r.r = |r|²
white jacinth
Can you send me the answer with the solution?
patent lynx
Nah i cant but i will yell you this
Direction is correct but magnitude is wrong
For your selected answer
white jacinth
patent lynx
Direction is correct but magnitude is wrong
r*s = 10
|r| = 5
|r|^2 = 25
patent lynx
Yes then
patent lynx
Yes
white jacinth
so why I can't get right answer
white jacinth
[30,-40,0]
patent lynx
Divide each of them by 25
white jacinth
[1.5,-1.6,0]
patent lynx
white jacinth
[1.5,-1.6,0]
There you go
white jacinth
It is not among the options
 atomic pewter
hi guys
A newbie on programming here
I am trying to learn some basic ML scripting by myself recently. I ve tried to write a knn script but I have a few issues
there are no available channels to help me out
and I was wondering ( because probably it is something really easy/ basic)

all prediction values are zero and I have this wrning message
thank you in advance
cloud sand
soft harness
Sorry for the vagueness. I’m not knowledgeable about this. Ideally, I suppose, t...
hhmm that does not look like a job for ml
it would cost you a lot of money and time to do it with ai
but you could easily do it in a day with normal programming
soft harness
cloud sand
but you could easily do it in a day with normal programming
I see now. I just didn’t want to spend a day doing it for every new thing
Thanks anyhow
cloud sand
nw
 steel forge
I'm doing some web scraping, i used requests and BeautifulSoup(page.content, 'html.parser') on twitch, and let's say i want to take the name of the streamers, how can i deduce them, i dont find them at all

this would be the result from BeautifulSoup

 nova pollen
@fluid spindle
a higher AUC (closer to 1) corresponds to scores which are easily distinguishable. if I feed the model samples from class A, it gives scores which are distinguishable from class B
at AUC = 0.5, the scores from class A have the same distribution as the scores from class B. the score (and the model) is useless for classification.
at AUC < 0.5, your model outputs scores which are distinguishable, but the predictions are "flipped". if the score was meant to be high, it's instead low
anyway regarding the original question, does converting to booleans make the function work?
 fluid spindle
I have a ready precision_recall_vs_threshold function, I will use that to pick a threshold, although I'll be writing that myself for the first time so it will take me a while
one more question, does using CV have any effect on AUC if it use an array of each instance's scores?
nova pollen
not too sure what you mean
fluid spindle
would it differ if I had predicted entire train set at once instead of cross validation to create y_scores array and calculate the AUC with it?
nova pollen
in general the cross validation values would be lower than if you had used the whole train set
but that's just a result of having fewer samples
river sapphire
thorn zephyr
In general, rewards are short term, while return or values are long term. What w...
Hi, thanks for responding. I have some questions regarding expected return. If it's expected return aren't probabilities factored into the equation? What are these probabilities? If both the policy and environment are stochastic, we need to factor in the transition function and the probability of selecting action a in state s, correct? Full equations would help best.
fluid spindle
nova pollen
in general the cross validation values would be lower than if you had used the w...
Unexpectedly it gave an AUC score of 1.0 when I used predict w/o cross validation, I'll look into it further
Thanks for the help and explanation
 hazy lotus
hey whats the best way to show a matplotlib plot asynchronously?
right now I'm turning interactive mode on, doing some work, and interactive mode off, and show again to block
that feels kinda hacky.
serene scaffold
@hazy lotus

 strange igloo
is there a way to sort these values numerically even though they are text?
                      'H: 140-159',
                      'I: 160-179', 'J: 180-199',
'K: 200-219', 'L: 220-239', 'M: 240-259', 'N: 260-279']```I added the letters for this reason, but I'd like to remove them
serene scaffold
strange igloo
is there a way to sort these values numerically even though they are text?
```d...
So the actual values are "0-19", "20-39", etc? If you converted them to tuples of two ints, you could sort them without any issue
strange igloo
Yes, they are text. I use them as bar chart labels. So the tuples option might be tricky.
serene scaffold
strange igloo
Yes, they are text. I use them as bar chart labels. So the tuples option might b...
If you have data that doesn't have to be a string, you should keep it in its non string form until the last possible moment
By the way, pandas has an interval type. https://pandas.pydata.org/docs/reference/api/pandas.Interval.html
strange igloo
Thank you!
iron basalt
river sapphire
Hi, thanks for responding. I have some questions regarding expected return. If i...
.latex \begin{align}G_t \space&\dot{=}\space \sum_{k=t+1}^T{\gamma^{k-t-1}R_k}\v_\pi(s) \space&\dot{=}\space \mathbb{E}\pi[G_t|S_t=s]\&= \mathbb{E}\pi[R_t+\gamma G_{t+1}|S_t=s]\&= \sum_a{\pi(a|s)}\sum_{s'}\sum_r{p(s',r|s,a)\left[r+\gamma\mathbb{E}[G_{t+1}|S_{t+1}=s']\right]}\&= \sum_a{\pi(a|s)}\sum_{s',r}{p(s',r|s,a)\left[r+\gamma\mathbb{E}[G_{t+1}|S_{t+1}=s']\right]}\end{align}
 strange elbowBOT
 iron basalt
G_t is (discounted) return. v_pi(s) is the expected return starting at s and following policy pi (the value function v). (The program I used for the latex is a bit wonky / does not align with normal latex stuff)
(pi(a|s) is the probability of a given s)
(a is action, s is state, s' is new/next state, r is reward, gamma is the discount factor)
(pi is not the ratio of the circumference of a circle to its diameter in these equations)
.latex $$= \sum_a{\pi(a|s)}\sum_{s',r}{p(s',r|s,a)\left[r+\gamma v_\pi(s')\right]}$$
strange elbowBOT
 lapis sequoia
Is anyone here familiar with NEAT ai
I am working on a project with a simple python pong game and an ai that can play the game
 floral orchid
How can i make the chart plotted side by side (not stacked) like in the other image?


 dusky finch
floral orchid
How can i make the chart plotted side by side (not stacked) like in the other im...
dusky finch
floral orchid
How can i make the chart plotted side by side (not stacked) like in the other im...
Use plt.subplot
river sapphire
iron basalt
G_t is (discounted) return. v_pi(s) is the expected return starting at s and fol...
ty so this is a recursive function and p(s', r | s,a) is the probability of transitioning to s' and getting reward r given that I am in state s and take action a correct? does this factor in both the probability of getting the reward and the probability of transitioning to s'?
 long widget
is this underfitting or overfitting, or neither?

 tidal bough
This looks very weird to me - why does your training score start at a high value and then decreases?
long widget
I don't know tbh
 grand veldt
long widget
is this underfitting or overfitting, or neither?
grand veldt
long widget
is this underfitting or overfitting, or neither?
Neither. This graphic isn't about your model's error, is about how much of training score you got with a specific amount of data examples. Basically, this graphic shows how harder it gets to improve the performance of your model as your are getting more data.
it's a sign that collecting more data will not help your model improve. You will have to try different hyperparameters, features or more complex models if you want to improve your score
long widget
Okay, thanks!
grand veldt
you're welcome
long widget
should I give the learning curve x_train and y_train as arguments?
 wary dune
what's a good dataset to train a gan on?
i need 64x64 or 128x128 pictures
of anything
 little jungle
Hi guys. I'm trying to determine if I should learn django to build a webapp using the openai library. I don't believe I need a database, just some front end interaction and calling on different apis from python libraries. What is the best way to do this?
I went through the django tutorial and it's all backend database stuff
and if I end up using a database of some kind, I would probably host it in the cloud
Does openai have any best practices w/ python?
serene scaffold
little jungle
Hi guys. I'm trying to determine if I should learn django to build a webapp usi...
django does a lot of work for you, but that's only helpful if you want the things that it's trying to do for you. and database IO is first among those things.
you should probably use flask.
serene scaffold
little jungle
Does openai have any best practices w/ python?
you're wanting to use an OpenAI API in your web app/site? in general, no one prescribes what web framework you should use when you use their API. these are separate concerns.
 fallow frost
Hey guys im not very familiar with NLP, but is it possible to extract all the keywords from a given article without any ML/AI, using just a regular for loop or smth like that?
strange igloo
Hannibal, yes, that is something a loop could accomplish.
You might try something like
create a list of keywords
break the text into a list of items for each word
use list comprehension to create a new list of words from text that match keywords
then you have keyword matches
or you can try something like a dictionary with list for each keyword, then you can catalog the frequency
serene scaffold
fallow frost
Hey guys im not very familiar with NLP, but is it possible to extract all the ke...
depends on what you consider to be AI. but term frequency/document frequency is a popular heuristic for keyword extraction.
strange igloo
Hello wizards of Discord, I have another pandas question. This is more of a "how does this work question"
In the code below, I'm confused about how returning a one dimensional series then gets converted to a summary table where each index is a column
def agg_fx(x):
    d = {}
    d['total_games'] = x['game_count'].sum()
    d['anticipated_wins'] = x[x['winner'] == x['higher_ranked_team']]['game_count'].sum()
    d['upset_wins'] = x[x['winner'] != x['higher_ranked_team']]['game_count'].sum()
    d['talent_win_rate'] = x[x['winner'] == x['higher_ranked_team']]['game_count'].sum() / x['game_count'].sum()
    d['talent_win_average'] = x[x['winner'] == x['higher_ranked_team']]['point_difference'].mean()
    d['upset_win_average'] = x[x['winner'] != x['higher_ranked_team']]['point_difference'].mean()
    d['upsets_at_home'] = x[(x['winner'] != x['higher_ranked_team']) & (x['winner'] == x['home_team'])][
        'game_count'].sum()
    d['upsets_on_road'] = x[(x['winner'] != x['higher_ranked_team']) & (x['winner'] == x['away_team'])][
        'game_count'].sum()

    return pd.Series(d, index=['total_games', 'anticipated_wins', 'upset_wins', 'talent_win_rate', 'talent_win_average',
                               'upset_win_average', 'upsets_at_home', 'upsets_on_road'])


games_and_rankings.groupby('talent_bucket').apply(agg_fx)```It's mentioned in the docs for apply, I think, that if the function being applied returns a Series, then the output of apply will be a dataframe.
(I remember searching for a long time how to do that before finding that little tidbit in apply docs, lol)
strange igloo
Thank you for the response, and saving me from going down the rabbit hole!
"Returning a Series inside the function is similar to passing result_type='expand'. The resulting column names will be the Series index."
Incredible memory!
misty flint
having better search capabilities for documentation would be great
iron basalt
river sapphire
ty so this is a recursive function and p(s', r | s,a) is the probability of tran...
The probably of s' and r. Since each time one goes to some state s' there is some probability for getting r. If I go from state A to state B, I might get +1 reward the first time, +0.5 the second, and -1 the third time.
(weighted average (expectation))
To figure out the value of a state we need to go over each possible action from that state, and then having taken that action, take into account each next state and possible reward for that transition.
(for each, for each, for each (triple sum))
river sapphire
iron basalt
To figure out the value of a state we need to go over each possible action from ...
alright, thanks I will let you know if I have any further questions
 dire falcon
How would you use a scatterplot if you have a massive dataset?
like its way too condensed

or would you just not use scatter plots
 prime hearth
Hello, i want to do the following specific machibe learning project, but not sure what algo or where to start:
To tell what makes a good restaurant, and to tell the trendibg product/ category based on reviews
Can please tag me ,I appreciate the help
I was thinking of using topic modeling LDA for the product one but i have to manually guess the topics after perfoming LDA not sure if there another method to tell the catergory or product, still researching about the first one
serene scaffold
why does pytorch not have a tensor stacking function that automatically pads 
misty flint
i feel that
hasty mountain
serene scaffold
why does pytorch not have a tensor stacking function that automatically pads <:A...
Why does pytorch stack function works differently from numpy's
 native umbra
guys how to start Machine learning?
serene scaffold
native umbra
guys how to start Machine learning?
what do you currently know about ml?
native umbra
i almost finish HCIA-v3 course, have some knowledge about methods of (Ml, DL, Neural network)
 meager mural
I have features of house size, number of bed rooms and y label of house price. Do I scale all three?
dusk tide
meager mural
I have features of house size, number of bed rooms and y label of house price. D...
Yes
 flint gazelle
Just a small question here. If i custom train a yolov7 model on additional custom objects will the standart object detection remain ?
young granite
dire falcon
like its way too condensed
cluster it beforehand?
young granite
native umbra
i almost finish HCIA-v3 course, have some knowledge about methods of (Ml, DL, Ne...
start with small kaggle project?
dire falcon
young granite
cluster it beforehand?
Data science is a very new topic to me, can you give me like a few word rundown? Just so i know what to look up, I'd appreciate it.
dusky finch
dire falcon
like its way too condensed
Would it be ok to reduce the sample in this instance?
It doesn't seem to provide much insight because there is too much clutter
dire falcon
Im not sure how that impact the accuracy :/
if i drop the age and just use a box plot its more readable

Im not sure how to convey the info of tt4 levels vs age by class though :/
any handier plots that i could use?
 hasty hawk
can someone explain the code to me this line by line

what idont understand is that how is there array of indexes inside of array
 south moat
strange igloo
Hello wizards of Discord, I have another pandas question. This is more of a "how...
south moat
strange igloo
Hello wizards of Discord, I have another pandas question. This is more of a "how...
dude can you tell me what's the command to text code so readable in all the chats??
 cloud dirge
south moat
dude can you tell me what's the command to text code so readable in all the chat...
cloud dirge
south moat
dude can you tell me what's the command to text code so readable in all the chat...
!code
arctic wedgeBOT
Here's how to format Python code on Discord:
```py
print('Hello world!')
```
These are backticks, not quotes. Check this out if you can't find the backtick key.
dire falcon
Curious about what might have caused this, I'm a java guy, python is shattering my brain somehow. Is this an indexing error?


 misty flint
dire falcon
like its way too condensed
misty flint
dire falcon
like its way too condensed
instead of trying to somehow plot multiple variables at once, i would just select one at a time and compare them against tt4 levels. if however, you want to keep age, i would use a binning technique.
prime hearth
Hello, i want to do the following specific machibe learning project, but not sure what algo or where to start:
To tell what makes a good restaurant, and to tell the trendibg product/ category based on reviews
I was thinking of using topic modeling LDA for the product one but i have to manually guess the topics after perfoming LDA not sure if there another method to tell the catergory or product, still researching about the first one
young granite
dire falcon
Data science is a very new topic to me, can you give me like a few word rundown?...
for binning or clustering check this:
https://en.wikipedia.org/wiki/DBSCAN
but im not sure if for ur survey results thats a suitable approach.
Maybe u could try a 3D_Scatter plot aswell?
but to give better suggestions we would need more background.

Density-based spatial clustering of applications with noise (DBSCAN) is a data clustering algorithm proposed by Martin Ester, Hans-Peter Kriegel, Jörg Sander and Xiaowei Xu in 1996.
It is a density-based clustering non-parametric algorithm: given a set of points in some space, it groups together points that are closely packed together (points wi...
young granite
young granite
for binning or clustering check this:
https://en.wikipedia.org/wiki/DBSCAN
but i...
clustering would maybe be a good approach to find age_groups for both male and female
 upbeat lake
I have a question about Collaborative Filtering:
when using euclidean distance to find similarities of two users that rated the same item i, what if they rate the same item the same say 5 on item_1 the distance is Zero. but when I go and use this when predicting the rating of an item, the denominator is zero. How should I approac this problem? Formula I'm using as reference is this

say I have this data below
 true scaffold
hi guys, I have 2 sentence transformer models, and i want to combine both of them, like suppose i have an input sentence, i need to get embds from both models and combine them using mean/max pooling layer? in order to get rich features of both models? how can i do the same?
long widget
does the order of a decision tree matter? or will the model order it in the way it thinks it's best?
upbeat lake
Hi 🙂 regarding my question, should I use a different similarity formula instead of euclidean?
 royal cedar
!code
 severe wasp
Anyone know a safe alternative to this (https://github.com/terry3041/pyChatGPT) an api for chatgpt
GitHub
An unofficial Python wrapper for OpenAI's ChatGPT API - GitHub - terry3041/pyChatGPT: An unofficial Python wrapper for OpenAI's ChatGPT API
 pine parrot
severe wasp
Anyone know a safe alternative to this (https://github.com/terry3041/pyChatGPT) ...
pine parrot
severe wasp
Anyone know a safe alternative to this (https://github.com/terry3041/pyChatGPT) ...
no but I usually just design my own prompt using openai's api and make something close to chatgpt
river sapphire
So, I'm reading an article on Dueling DQNs and they defined the value function like this:

Why is the value function a function of state and action?
Shouldn't it be a function of only state?
Here is the article btw: https://towardsdatascience.com/dueling-deep-q-networks-81ffab672751
 upbeat lake
I have a question about Collaborative Filtering:
when using euclidean distance t...
upbeat lake
upbeat lake
I have a question about Collaborative Filtering:
when using euclidean distance t...
hey guys. any help on this would be very much appreciated 🙂 thanks!
iron basalt
river sapphire
So, I'm reading an article on Dueling DQNs and they defined the value function l...
I highly recommend Reinforcement Learning: An Introduction by Sutton and Barto, as at this point I would end up explaining the book bit by bit (but to answer this one, there is the action-value function q_pi(s,a)).
river sapphire
iron basalt
I highly recommend Reinforcement Learning: An Introduction by Sutton and Barto, ...
I know, I plan to read it sooner or later because I lack the foundation
I was asking about the value function though, why did they say that value is a function of state and action?
Is this a typo? They proceed to use V^pi(s) for the rest of the article.
river sapphire
Oh.
iron basalt
The foundations are actually covered pretty fast in the book, just the first few chapters and most of your questions would have been answered.
river sapphire
Alright, I'll read it after I finish this project.
iron basalt
Nor is it a very dense read.
river sapphire
Should I start with the David Silver YT series or the book?
iron basalt
(In terms of math, regular amount of text explaining each part though, just not a math book)
Start with the book, it's really good.
river sapphire
Ok.
 feral heron
Hello, is anyone available to answer some general questions about predicting values based on string values?
strange igloo
This shows the average 'point_difference' for each bar - this is unexpected for a bar chart. I would expect these bars to be sums of 'point_difference'
point_chart = sns.barplot(x='talent_bucket', y='point_difference', hue='did_ranked_team_win', ci=None,
                          hue_order=[True, False],
                          data=sorted_games)
I see in the docs that the bar chart is meant to:
Show point estimates and errors as rectangular bars.
"A bar plot represents an estimate of central tendency for a numeric variable with the height of each rectangle"
I take this to be a fancy way of saying "average/mean"
But what if I want the median
Ah, you can do estimator=median and import median from numpy
 verbal venture
can someone tell me why datasets get split into 80/20 typically. What the benefit of splitting them is, and why that % exactly
 tranquil oak
can anyone recommend me a good tutorial for face recognition and how things work behind it? I tried googling deep learning computer vision python face recognition with opencv but all I get is how to do a face recognition, a basic one, not anything more complex and with great explanations
patent lynx
verbal venture
can someone tell me why datasets get split into 80/20 typically. What the benefi...
It's the use of pareto rule
Extracted from wiki:
In computer science the Pareto principle can be applied to optimization efforts.[13] For example, Microsoft noted that by fixing the top 20% of the most-reported bugs, 80% of the related errors and crashes in a given system would be eliminated.[14] Lowell Arthur expressed that "20% of the code has 80% of the errors. Find them, fix them!"[15] It was also discovered that, in general, 80% of a piece of software can be written in 20% of the total allocated time. Conversely, the hardest 20% of the code takes 80% of the time. This factor is usually a part of COCOMO estimating for software coding.
So it is an intuition that the vital few factors causes 80% of the consequences.
Caution in individual datasets/circumstances they don't need to necessarily add up to 100. Variations may include 90/10 or 70/30, etc.
 final gust
Hi everyone 😄 I started stream on developing a Magic: The Gathering strategy discovery tool using natural language processing, check it out https://www.twitch.tv/videos/1682521103?t=0h4m32s
I'll be adding at least 30 minutes at least every 2 days
 high cypress
Hello everyone. Who knows how to display like this?
 upbeat lake
does anyone know an user-based collaborative filtering from scratch resources here?
odd meteor
high cypress
Hello everyone. Who knows how to display like this?
You can use the Object-Oriented Approach of Matplotlib to recreate this. You just need to create a fig and axis object when creating your subplot, then set the shape of the figure object to 2 x 2. Afterwards, use the axis object to plot the same visualization as shown in this picture and place them in their respective segment.
 novel locust
Hello all, I need help with my linear programming algorithm in Python with PuLP: https://pastebin.com/7wB8Z06N
Pastebin
Pastebin.com is the number one paste tool since 2002. Pastebin is a website where you can store text online for a set period of time.
I hope that I am in the good channel :S
I have a variable named total_fuel_available that contain the total quantity of fuel available.
I have a list of zone object that contain 2 attributes :
- the first is local_fuel_limit that indicate the maximum fuel that the zone can provide
- the second is a list of n station object.
All station object has a min_fuel_acceptable and max_fuel_acceptable attribute that indicate the quantity of fuel that the station can accept and a last attribute (initialized to None) that contain the fuel quantity affected
I am looking for an algorithme that share as equally as possible, the total_fuel_available quantity into station without overload the zone limit.
 young socket
Does anyone have experience with RL for pytorch?
high cypress
odd meteor
You can use the Object-Oriented Approach of Matplotlib to recreate this. You jus...
I don't understand the question. I need help
 odd meteor
high cypress
I don't understand the question. I need help
odd meteor
high cypress
I don't understand the question. I need help
Is this still related the first question I responded to? I think not. I haven't built a dependency graph before myself so I might not be the best person to help you with this question at this time.
high cypress
odd meteor
Is this still related the first question I responded to? I think not. I haven't ...
Could you please help with 'subsampling'? I didn't fully understand
 odd meteor
high cypress
Could you please help with 'subsampling'? I didn't fully understand
odd meteor
high cypress
Could you please help with 'subsampling'? I didn't fully understand
I'm gonna assume you have a little background in stats or at least familiar with sampling in general. Should my null hypothesis be rejected, then it's my hope that with this brief explanation + the attached visual aid, you'll get a quick sense of what sampling is and how it's slightly different from subsampling.
Sampling is the selection of a subset (a statistical sample) of individuals from a statistical population. (Picture above). Sampling is cheaper and faster than measuring the entire population ( A case scenario you might be familiar with is this, when working with a data set with millions of rows in pandas, you could experience some slowness in execution of your codes due to the large amount of data you're working with. So to temporarily fix this problem, you could decide to randomly sample, say, 15% of the the entire dataset to quickly get some insight in the dataset)
We use this sample to estimate the characteristics of the whole population.
** Some Types Of Sampling**
- Simple Random Sampling (SRS): In SRS each member of the population has an equal chance of being chosen for the sample. This sample will be a simple random sample.
We can do sampling with replacement or without replacement. In the first case, individuals are put back in the population after each draw for possible future reselection. In the second case, observations, once selected, are unavailable for future draws.
- Stratified Sampling: A stratified sample includes subjects from every subgroup, ensuring that it reflects the diversity of the entire population. Stratified sampling is used to highlight differences among groups in a population, as opposed to simple random sampling, which treats all members of a population as equal, with an equal likelihood of being sampled. Remember the
stratifyparameter when using Train_Test_Split yeah? That's what happens behind the scene.
So in essence, a sample = portion of the population & subsample = sampling a portion of the sample.
 odd meteor
high cypress
Could you please help with 'subsampling'? I didn't fully understand
odd meteor
high cypress
Could you please help with 'subsampling'? I didn't fully understand
So you're expected to plot/visualize the relationship between the two variables by subsample data of longitude and latitude.
You can use SRS to get the first sample; let's call this Jomart_sample. Then sample again from Jomart_sample to get your subsample. Then use the subsample df to perform your visualization.
import seaborn as sns
import pandas as pd
import matplotlib.pyplot as plt

use_sample = False
sample_fraction = 0.1

if use_sample:
    df_sampled = df.sample(frac=sample_fraction, replace=False)
    df_subsampled = df_sampled.sample(sample_fraction * 6, replace = False)

    sns.scatterplot(data = df_subsampled, x = 'longitude column', y = 'latitude column')
    plt.xlabel('Longitude')
    plt.ylabel('Latitude')

    plt.show()
Change use_sample = True if you want to sample your data
Change replace = True if you want to sample with replacement
high cypress
thank you!
cloud sand
upbeat lake
hey guys. any help on this would be very much appreciated 🙂 thanks!
I don't know if anyone has replied to you yet, so please forgive me if so. Anyways, is adding a very small value to the similarity score an option?
upbeat lake
Oh yeah. I had to change compute the score as 0 to 1.
If distance was 0 it will show 1 but as distance increases the value approach 0 . Or 0 if no similarities.
Question now is. When getting neighboring similarity, do i just have to sort the scores descending order ? What if the item I am predicting the rating to is not rated by it's N neighbors? I checked my dataset and some items i'm predicting is were rated by another user but it's in the furthest neighbor to the user I'm trying to prediction rating to.
Not sure if I've gathered my thoughts here clearly. Sorry
 twilit oracle
My neural network has 0.5 lost on the test data but less then 0% accuracy, whats going on with that

just figured out im using the wrong metrics because its regression
but which one would i use
grand veldt
mean squared error, I think would fit your problem
grand veldt
twilit oracle
but which one would i use
scikit-learn
Examples using sklearn.metrics.mean_squared_error: Gradient Boosting regression Gradient Boosting regression Prediction Intervals for Gradient Boosting Regression Prediction Intervals for Gradient ...
twilit oracle
grand veldt
mean squared error, I think would fit your problem
i went with mean absolute error
just trying to figure out how I can see how accurate it is
grand veldt
Ok
prime hearth
hello, i would like to please ask, what is the best way to iterate over dataframe to do fetch request for each item id?
for example, my dataset is like this:
business_id
buF9druCkbuXLX526sGELQ
i want to iterate over my datset dataframe so that i can do a get request for each business id and add the business category as a new value to the dataset for the same business Id (the same row)
grand veldt
I usually use:
for index, row in df.iterrows():
# here you can access any column from each row using row[column you want]
prime hearth
oh okay thank you, i did see this on stack overflow but. lots of devs say this is an anti pattern
and dtypes are not preserved with iterrows(), my data doesnt have doubles it just string so it okay in this case
grand veldt
I saw that this is the fastest way, so I usually use it. However you can also use df.apply(function), and create a specific function that will do what you want to do in each row
prime hearth
oh okay thanks, hmm the second way seems less readable in my situtation since i have to do fetch request for business id then add the data to dataframe as new value in a new column
il just go with the first way, thank you.
grand veldt
prime hearth
oh okay thanks, hmm the second way seems less readable in my situtation since i ...
yeah, this is another thing I like about this way.
grand veldt
twilit oracle
is getting 0.5 loss a good value?
0.5 of loss, you mean 0.5 of mean absolute error?
twilit oracle
yeah
40/40 [==============================] - 0s 1ms/step - loss: 0.4381 - val_loss: 0.5115
i mean it says that ^
grand veldt
well, it depends on your problem, basically, when you are working with MAE. If you are working with big numbers to predict, for example predicting house prices, 0.5 is really low, so it's good. But if you're dealing with a context that you have to predict small values, maybe 0.5 is not that good.
twilit oracle
im predicting numbers between 0-10
im using a wine data set where 1600 samples of wine are rated between 0-10
so i guess 0.5 of loss would be bad for that
i dont know what im doing wrong
grand veldt
Actually, I think 0.5 is fine
twilit oracle
really? I get the 0.5 is representing the loss but exactly does it mean. Is it saying that is usually 0.5 off the true label?
grand veldt
twilit oracle
i dont know what im doing wrong
check the cases your model is missing by a lot and try to understand why
prime hearth
thank you and also, whats the best way to store multiple value for each id?
For example each businesss id can have multiple categories:
'categories': [{'alias': 'deptstores', 'title': 'Department Stores'}, {'alias': 'furniture', 'title': 'Furniture Stores'}, {'alias': 'electronics', 'title': 'Electronics'}] # for business with id xyasdasdu
I want to store these categories in my dataframe for its business id. Like below:
dataframe:
business_id   categories
xyasdasdu.      furniture,electronics
It means that your model is missing by 0.5 in mean.
twilit oracle
oh ok
prime hearth
or is there a better way? I know in SQL this isnt valid for good reasons
twilit oracle
grand veldt
check the cases your model is missing by a lot and try to understand why
i mean im checking and noticing that it is mostly off my 1-2 but i dont know why
i dont understand why training it is not going so well
im noticing its always predicting around 5
grand veldt
prime hearth
thank you and also, whats the best way to store multiple value for each id?
For ...
Well, I don't think there is a good way to do it with pandas dataframe haha I usually use a list, but it creates a lot of problems when you try to iterate over your dataframe.
prime hearth
hyperparamter tuning and possibly feature engineering ; depends on data scaling data can improve otherwise the model is not converging i think- its fluctuating @twilit oracle
grand veldt
prime hearth
thank you and also, whats the best way to store multiple value for each id?
For ...
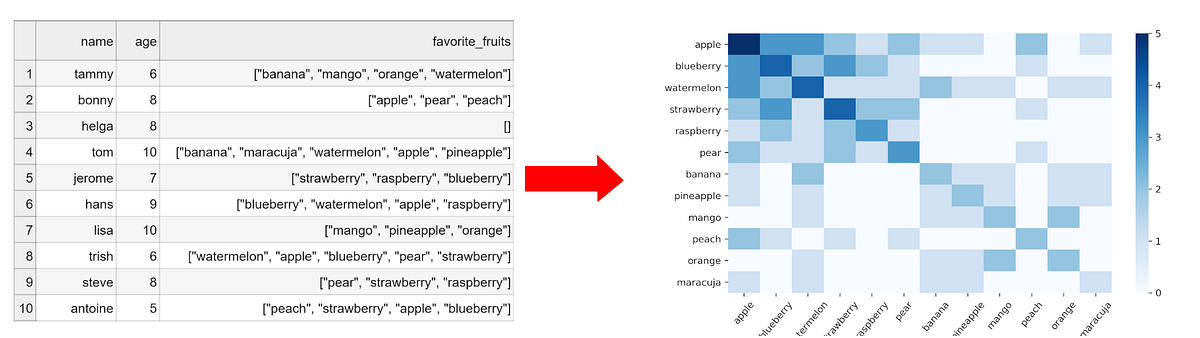
Medium
Here are some tricks to avoid too much looping and get great results
prime hearth
thank you
twilit oracle
ok ill keep trying different things, ill try to shoot for at least 0.2 loss
grand veldt
twilit oracle
ok ill keep trying different things, ill try to shoot for at least 0.2 loss
I think the time you would spend on that you could go for a harder problem. A problem that you have to clean and process data, do some feature engineering and etc.
it'll probably teach you more about DS
twilit oracle
grand veldt
I think the time you would spend on that you could go for a harder problem. A pr...
im not sure what feature engineering is, kinda new to deep learning
grand veldt
which model are you using for this wine regression?
twilit oracle
model = Sequential()
model.add(Dense(128, input_shape=(11,),activation="relu"))
model.add(Dropout(0.2))

model.add(Dense(128, activation="relu"))
model.add(Dropout(0.2))

model.add(Dense(64, activation="relu"))
model.add(Dropout(0.2))

model.add(Dense(1))

model.compile(loss="mae", optimizer="adam")
just made one myself
prime hearth
krish naik youtuber gives good tutorial on feature engineering, might need to also try different models (regression, clsuters...)
grand veldt
have you learned about shallow learning already?
twilit oracle
no not yet
grand veldt
I think you should take a few steps backs. You are trying to jump to DL, but there are a lot of steps before that.
twilit oracle
i mean im getting close
the model is a little accurate
and i know im going a little far
but i think this data is pretty simple
grand veldt
Yeah, the data is pretty simple, that's why you don't need a neural network to predict the results.

The Hundred-Page Machine Learning Book
 grand veldt
https://www.amazon.com/Hundred-Page-Machine-Learning-Book/dp/199957950X/ref=sr_1...
grand veldt
grand veldt
https://www.amazon.com/Hundred-Page-Machine-Learning-Book/dp/199957950X/ref=sr_1...
this is a good book to start learning ML
it will teach you all the fundamentals you need to finally get to deep learning
young granite
so i got a df which i transform to bool by df == 0, now i want to find rows where the set cols are True,
If there are more True values in other cols (not set one) i want to exclude those rows as-well.
Any suggestions?
for i in wanted_rows:
col = df.iloc[[i]].columns[df.iloc[[i]].eq(True).any()]
true_false = df2 == 0
true_false[col] = ~true_false[col]
result = df2[ture_false.all(axis="columns")].index``` crisp comet
Anyone has any info about conjoint analysis?
sacred halo
Hi everyone, I had Anaconda in my laptop (Windows), I uninstall it and I am not sure it has been removed completely from pc or not. After that I installed Spyder separately while I had Python V10 in my laptop. I have an issue with importing module such as xgboost in Spyder (ModuleNotFoundError: No module named 'xgboost') while it is installed globally and working in Python 10. I tried to change the python interpreter in spyder preference to where the python 10 is installed as the screenshot. By the way, in the place where Anacoda were installed I have .anaconda .conda as well. Do I need to delete those folders as well? There is no execution file in the folder where spyder is installed (.spyder-p3). Do I need to install Spyder again to add a pass for execution in preference?
 prime hearth
hello, i would like to please ask, how much of NLP or just machine learning must i learn to apply for internships with ML role?
Where I live, its common for begineer ML entry with no masters, most employers just looking for someone to intern, master degrees are not required to apply
 novel python
as long as you can build a simple but complete project and deploy it you might already be able to find some stuff
prime hearth
oh okay thanks, and i never learned how to deploy an ML model, usually i just have it in backend framework like flask, should i learn how to deploy and if so- how much to learn about deployming ml models- i heard of kubernetes but i feel theres so much to it, is just knowing how to deploy like on amazon azure cloud good enough?
i guess like bare minumum what i should learn about deploying ml models or should i just google and find out?
verbal venture
can someone tell me which dataset is better? I'm trying to deduce the forecasted price of properties in x city. 1) 40,000 property listings in x area, or 2) 500,000 property listings of y country, and then trying to find the predicted price of that area within that dataset
I'm trying to create something for real estate. So is it better to have one giant dataset that covers the whole country, or a much smaller dataset for each individual city and work off of that?
 gilded bobcat
Hey all, Pytorch vs Tensorflow? I have some experience in TF (none in PT). I've heard that Pytorch is the way to go these days?
gilded bobcat
verbal venture
I'm trying to create something for real estate. So is it better to have one gian...
What is your end goal? What is the question you want to answer?
I think I would take the small area datasets and append them together. Using national data (without good exploratory variables) will make it hard to isolate the unique differences of area X and area Y. Whereas using local data you can hopefully believe that home 1 and home 2 are equally affected by local confounders/traits (like the weather, crime, views, jobs, etc...)
odd meteor
sacred halo
Hi everyone, I had Anaconda in my laptop (Windows), I uninstall it and I am not ...
I haven't used Spyder since Jupyter Lab & Jupyter Notebook does it for me. But I'm curious, is there a reason you got rid of Anaconda?
I thought Spyder is also an IDE bundled inside Anaconda as well, or has Anaconda removed Spyder from the list IDEs it supports?
odd meteor
prime hearth
Where I live, its common for begineer ML entry with no masters, most employers j...
Then you're really lucky to live in such place. Lol here, they almost always ask for Masters degree or at least 3 - 5 years of experience in NLP & ML Engineering generally. So it's kinda not so easy to even get internship roles.
Since you're looking for entry level role, just know enough about
-
Difference Between OHE & Word Embedding and how each is used by ML to infer similarity of words.
-
The Usually Text Cleaning approach. Removing stopwords, Lemmatization, Stemming, Bag-of-Words, tokenization, n-gram etc
-
Sentiment Analysis & Text Classification on tabular data
-
Topic Modelling
-
Named Entity Recognition (NER)
-
Knowledge of SpaCy and/or Prodigy library for performing tasks like NER, Semantic Similarity etc.
I think this is good enough for a start so long as you also have a couple projects on Github that demonstrates your level of skill and knowledge on the aforementioned NLP techniques and algorithms.
For Advance NLP, like Neural Machine Translation, Information Retrieval, Automatic Speech Recognition, Transformers, and basically a lot of other stuff using Neural Networks I believe you can easily learn that on the job without much struggling.
So once you're confident in #1 to #6 and you've worked onna couple of projects on them, please start applying for entry level roles.
odd meteor
verbal venture
I'm trying to create something for real estate. So is it better to have one gian...
I think it'll be more fun for me to work with the one that deals with cities in a specific country.
odd meteor
gilded bobcat
Hey all, Pytorch vs Tensorflow? I have some experience in TF (none in PT). I've ...
Not actually true. 😂 All Deep Learning frameworks are useful and one cannot simply claim that one framework is better than the other w/o giving any reason to support such claim.
TensorFlow = Is currently the most popular framework. If you have interest in Engineering, you most likely would work with this all the time (depending on your country of residence tho)
PyTorch = Interested in Academia / Research. This is usually used in such environment.
JAX = Interested in full-time ML Research or interested in joining DeepMind, GoogleBrain, etc. Then having this in your arsenal will make you desirable.
In all, just know at least 2 DL frameworks so that wherever or whatever company you eventually find yourself in future, you'll always be more valuable (and not easily displaced) 😂.
Think of the importance or advantage of being framework / language agnostic. It's just like knowing
NoSQL (GraphQL + Redis) and RDMS (PostgreSQL + MySQL) 🔥
Or knowing React and Vue.js 🔥
Or knowing FastAPI, Flask, and Django 🔥
 tiny skiff
How can I load a big dataset in arff.load('dataset') in python? The kernel crashes, I know this is due to memory capacity. But is there a routine to load this in chunks with arff files and run experiments on
young socket
Does anyone know what this means in pyinstrument

 hoary wigeon
Anyone knows how to transpose the dataframe keeping Attribute Val, dateRange inplace ?

 shrewd stone
!resources deep learning
arctic wedgeBOT
Resources
The Resources page on our website contains a list of hand-selected learning resources that we regularly recommend to both beginners and experts.
shrewd stone
!resources deep learning
arctic wedgeBOT
Resources
The Resources page on our website contains a list of hand-selected learning resources that we regularly recommend to both beginners and experts.
hoary wigeon
I'm trying to get output below format
 sacred halo
odd meteor
I haven't used Spyder since Jupyter Lab & Jupyter Notebook does it for me. But I...
sacred halo
odd meteor
I haven't used Spyder since Jupyter Lab & Jupyter Notebook does it for me. But I...
Hi, I wanted to upgrade Python and I could not do it via Anaconda. I tried various times and I thought due to having an old version of Anaconda. I followed an instruction on the net that you need to remove Anaconda install a new virtual environment for VScode. I need Spyder now and I wanted to keep VScode, too. I am now following the following instruction to make connection between Python 10 installed and Spyder. https://puneetpanwar.com/use-existing-packages-spyder5/ I cannot get rid of the last error in that post, any idea?
 exotic pine
?
 fallow frost
post the whole error
grand veldt
prime hearth
oh okay thanks, and i never learned how to deploy an ML model, usually i just ha...
for deploying, I would start learning about how to create an API using FastAPI, put it into a docker image, run the image locally and try to make requests to it. After that, you can try to deploy it on a cloud service. GCP and AWS have free level services that you can use to deploy APIs using docker.
 quick totem
guys wanna ask, so tensorflow is compatible with cuda 11.2, and pytorch only with cuda 11.6 or 11.7. does this mean that i will need to install 2 cuda driver?
 visual oriole
guys i have these file downloaded in my laptop but here it is written that so such file please help
 dusk tide
Hi, has anyone worked with TPU before ?? I am having an error and not able to resolve it
fallow frost
visual oriole
guys i have these file downloaded in my laptop but here it is written that so su...
it means its not in the same folder as the jupyter notebook
try typing the full path
odd meteor
sacred halo
Hi, I wanted to upgrade Python and I could not do it via Anaconda. I tried vario...
I don't use Spyder but if you're interested in acheiving same thing in anaconda, then try any of these methods
Method 1
If you wanted to upgrade the python in your anaconda just open your anaconda prompt in administrator mode ( just search for 'Anaconda' on your PC, click on the Anaconda PowerShell Prompt then right click and select run as administrator)
Once you're in your anaconda prompt; use this code below to update your python.
conda update python
To update your anaconda itself to latest version: conda update conda
If you want to upgrade between major python version like 3.9 to 3.11, you'll have to do: conda install python=$remove_the dollar_signs_and_enter_python_version_here$
**Method 2 - Create a new environment **
conda create --name {enter_your_env_name_here} {python==3.11}
Example
conda create --name behroozML_env python==3.11
https://conda.io/projects/conda/en/latest/user-guide/tasks/manage-environments.html
This should work!
 sinful surge
**hello friends Machine learning anyone ??
I need such person who had some experience of research paper using ML please help me in a small task
**
**please help me friends **
sacred halo
odd meteor
I don't use Spyder but if you're interested in acheiving same thing in anaconda,...
Thank you. I will try them. 🙏
sacred halo
sinful surge
**please help me friends **
Please share your issue and there will be a person to help you.
hasty mountain
Hey guys, I've just started studying Attention Layers and I was thinking...if an Attention Layer is used in NLP to assign weights to the most relevant input vectors...can I, then, replace a VGG19 architecture by a MultiHead attention in order to extract the most relevant features in an input image?
sinful surge
sacred halo
Please share your issue and there will be a person to help you.
i need some person brother who can help me in a vc i need to screen share please help me
visual oriole
fallow frost
try typing the full path
got it r was missing and also full path thanks 😇
sinful surge
**i need this help that in this given data of a particular bank i need some past 2-3 year data of this bank and have to find these things and have to work on GOOGLE COLAB and i am totally new in thing so i need some guidence **

please anyone
sacred halo
sinful surge
**i need this help that in this given data of a particular bank i need some past...
use the following link, it can help youhttps://colab.research.google.com/ you need Google colab to be active in Google account
 sinful surge
sacred halo
use the following link, it can help youhttps://colab.research.google.com/ you ne...
sinful surge
sacred halo
use the following link, it can help youhttps://colab.research.google.com/ you ne...
its link of simple google colab brother
sacred halo
sinful surge
its link of simple google colab brother
I thought you just started to use Google colab. I found another one and the see how would help you and share with us. https://colab.research.google.com/github/Tanu-N-Prabhu/Python/blob/master/Exploratory_data_Analysis.ipynb
sinful surge
sacred halo
I thought you just started to use Google colab. I found another one and the see ...
is this a sample brother ?
sacred halo
sinful surge
is this a sample brother ?
right, you can find many of those in the net.
sinful surge
sacred halo
right, you can find many of those in the net.
what shall i type there like
sacred halo
sinful surge
what shall i type there like
You download it and change it. Means import your data from your google drive and analysis it.
prime hearth
thanks everyone and also, is this a good idea: I am planning to make a NLP project that categories/labels the topic of reviews. I was planning to use LDA model for this. However, i have two pathways:
- I feed reviews to this a pre-train LDA model that was trained on general reviews and labels the review with general tags or inaccurate tags possibly
- I do clustering on the business where the reviews come from to able to sort businesses by categories such as Food, Health care, IT support then feed the reviews to specific LDA models such as Food, or Health or IT support etc in that way I get more speific and related tags to the reviews
the second way I am doing right now but the thing is I still am working on it using principal component analysis and i could end up having 20 LDA models pretrained and saved depending on the clustering how many clusters I get and PCA so not sure if this is good practice or looks bad to employers
grand veldt
prime hearth
the second way I am doing right now but the thing is I still am working on it us...
imo you should just go for a BERT model from hugging face. Try using it and fine tuning with new classes idk
prime hearth
Thanks for your feedback I would try this except I dont really know bert
I was planning on learning it in future as right now I just trying to get a project working to put on resume, but will look into!
prime hearth
@grand veldt but do you think option 2 is okay? This is just for now, in the future I can try bert and improve but for now do you think option 2 is good or i should go with 1?
grand veldt
prime hearth
<@265005889784643585> but do you think option 2 is okay? This is just for now, ...
Yes, I think so. Keep going.
 leaden bane
I have finish ML overview but The course did not provide any project to work in, can anybody give me some projects to do and how to do them?
 prime hearth
@leaden bane if google machone learning projects for beginners there are lots of ideas and can choose ones that use wht you already know.
You can try kaggle as it has lots of ML challenges and datasets with it
Just a caution though if you plan to put these on resume make sure the project is unpopular or unique and solves real world problem , projects like cats vs dog classification is not really practical or titantic dataset on kaggle etc.
grand veldt
you can start by using some kaggle challenges to practice and them find a real world problem to try to solve using ML.
prime hearth
Thanks g.srv also for answering il try option 2
leaden bane
Thank you guys (:
 quiet seal
How do I ask this question to google, I have a pandas DataFrame that can contain rows where df['Name'] == 'foo' and there may be rows containing either of df['Credentialed'] == True or df['Credentialed'] == False and I only want to select out those records where for a given Name, there are both True and False records, not rows where there is only one or the other?
Thinking about it, I guess I would first use drop_duplicates to drop any duplicates on ['Name','Credentialed'] and then use drop_duplicates again on Name only but keep duplicate records and dropping non-duplicates?
I guess DataFrame.duplicated()
grand veldt
if you only filter by the Name, isn't it enough?
what is the data structure you are using to store both True and False values in the same cell?
quiet seal
It only stores one of True or False in the given cell; the problem is if I have a credentialed and uncredentialed record, the system doesn't know they're referencing the same object, so I'm trying to only select those rows that reference the same name but show up with both types of records
grand veldt
ooh okay, got it
quiet seal
…df[df.drop_duplicates(subset=['Name','Credentialed']).duplicated(subset=['Name'])] gave me IndexingError: Unalignable boolean Series provided as an indexer o_O?
that…should give me one line for every name-credentialed pair, and then a boolean array that's True for any row where Name shows up in multiple rows, how did I break the indexing?
grand veldt
quiet seal
…`df[df.drop_duplicates(subset=['Name','Credentialed']).duplicated(subset=['Name...
in this case, only would be a duplicate if you have a pair of values repeated, for example (Name, True) and (Name, True), and not (Name, True), (Name, False)
Name, True and Name, False are not duplicates
quiet seal
Right
so that gives me a dataframe that has only one instance of each pair
…or one instance of each that's not a pair.
grand veldt
Okay, so you have a name and credentials multiple times in your data?
quiet seal
yeah
grand veldt
oh, all right
quiet seal
It looks like I have to apply the .duplicated() output as a boolean index on the result of drop_duplicates(), not on df
grand veldt
Stack Overflow
I'm trying to run what I think is simple code to eliminate any columns with all NaNs, but can't get this to work (axis = 1 works just fine when eliminating rows):
import pandas as pd
import numpy ...
it looks like an axis problem
 young terrace
is this the place to ask for help with web scrapping?
grand veldt
I don't think so 
young terrace
ok ok  thanks anyway
steel forge
how can i acces the color of this code, im trying with BeautifulSoup but can't find the answer in the documentation
 hasty mountain
Guys, just to make sure: in Pytorch, if I create a tensor that requires grad out of nowhere inside my model, when I call optimizer.step(), it'll apply the gradients to every tensor which has requires_grad=True, right? Even to the tensor I made?
hasty mountain
I hope my array of weights can be properly optimized... matrix multiplication is too mean to my poor computer
spare briar
It won't get gradients if it isn't attached to the loss by the model graph
you can be very sure that it doesn't by calling .detach()
hasty mountain
Oh, it directly multiplies my model input, so then I guess it might do
Uh...no, it doesn't seem to do at all...
Unless I stopped the process before the optimizer applied the gradients... I'll try again and let it run for more minutes.
hasty mountain
Strange...its gradients are being computed, but they aren't being applied...
odd meteor
young terrace
is this the place to ask for help with web scrapping?
So long it relates to scrapping data, yes you can ask your questions here.
 compact egret
Hello, does anyone know how one can get the previous predicted value after each training sample, from a keras model
I want to use the last predicted value as input feature for the next training sample
Havent been able to find anything on google regarding this, if you could point me in the correct direction that'd be great
 rotund osprey
I come from Video game environment art; no clue about machine learning or ai, and I know little about python; I am here to understand how to recognize lighting information from an image. What do I need to consider for implementing an AI tool for this specific recognition stuff?
Does anything have to do with OpenCV?
hasty mountain
compact egret
Havent been able to find anything on google regarding this, if you could point m...
Save it into a variable that won't be changed through training, then use it in the next step
compact egret
Thing is im not sure how you can access a prediction after each training sample, i just have this

Nm found something https://keras.io/guides/customizing_what_happens_in_fit/

 limber kiln
Can someone please help with this - https://stackoverflow.com/questions/74869773/how-do-i-get-all-1000-results-using-the-github-search-api
Stack Overflow
I understand that the GitHub Search API limits to 1000 results and 100 results per page. Therefore I wrote the following to view all 1000 results for a code search process -
import requests
for i in
I believe GitHub mining is data science 🙂
young terrace
odd meteor
So long it relates to scrapping data, yes you can ask your questions here.
yes it does!!!
 viral dust
What's up
 odd relic
ahhhh I missed this chat, I would just like some opinions on this model result
 wooden sail
interesting that the validation loss is better than the training one. you must've done some nasty augmenting
odd relic
wooden sail
interesting that the validation loss is better than the training one. you must'v...
hehe yep
odd relic
wooden sail
interesting that the validation loss is better than the training one. you must'v...
so my question is, should I push the model to do 20 epochs instead of 15?
It dont seem like it leveled off
wooden sail
sure, give it a shot and see
odd relic
yay another 3 days of training
cloud sand
compact egret
Hello, does anyone know how one can get the previous predicted value after each ...
previous = 0
for X, y in dataset:
y_pred = model(cat(X, previous))
previous = y_pred
compact egret
Yh thx
 rich river
Im building a deep learning virtual env. Do you think I should use the latest 3.11, or is 3.10 better?
dusk tide
Has anyone worked with tpu??
 jovial goblet
Hello can someone teach me programing python language? please
steel forge
what tool do you guys use to get specific data out of huge strings
 arctic flame
What would you recommend for visualising a graph of size 256 with labelled edges?
 stone coral
Any good resources to start learning machine learning
I don’t have experience with Numpy with arrays and stuff.
grand veldt
rotund osprey
Does anything have to do with OpenCV?
https://pyimagesearch.com/2016/10/31/detecting-multiple-bright-spots-in-an-image-with-python-and-opencv/
Is it useful for you?
Learn how to detect multiple bright spots in an image using basic computer vision and image processing techniques with OpenCV and Python.
mint palm
my supervisor was talking about some backbone and architecture for "video transformers". I dont quite remember what he said. Can you guys please help me if you know about something having following things:
- transformer incorporating backbone with "such" a feature extractor that takes clips as input
- he said transformers with multi-modal input
second seems to make sense but first one i don't know if i remember correctly.
Can i get some context/research paper related to these? I will ask him but i dont want to completely oblivious about it. Thanks
wooden sail
rich river
Im building a deep learning virtual env. Do you think I should use the latest 3....
you should check whether all the libraries you need are compatible with the python versions you're considering. things like the 3.11 performance boost don't affect ML because the math operations don't run in python anyway
for example, as of november there still isn't full pytorch support in 3.11 other than using beta builds in linux
3.9 is a very safe bet and still has a decent life time ahead of it. 3.10 should also have support for most things you want, but anyway check for compatibility
 heavy bay
Why do most people prefer using anaconda environments for AI-related stuff? Is there a specific reason to use anaconda over something like pipenv?
wooden sail
yes, that it's easier to install optimized versions of some libraries
particularly ones optimized with intel mkl, which makes linear algebra quite a bit faster
otherwise you have to compile them from source
heavy bay
oh i see
grand veldt
I think because it's easier to manage the envs also.
and you can easily install on windows and unix OS
heavy bay
thanks
wooden sail
it used to be that installing numpy AT ALL was almost impossible without anaconda. many people that have used it for a long time just stuck with it, even though it's not that big of a problem now
grand veldt
yeah, I used it for a long time, but had lot of problems with it. I prefer to use poetry right now.
 hybrid mica
The code runs fine as expected. Why does VS Code put a yellow squiggly line under these imports?
from tensorflow.keras.models import Sequential
from tensorflow.keras.layers import Dense
Import "tensorflow.keras.models" could not be resolvedPylancereportMissingImports
Import "tensorflow.keras.layers" could not be resolvedPylancereportMissingImports


 hybrid mica
(venv) C:\Users\username\OneDrive\Desktop\SA\PROGRAMMING\Projects\IPL\flask_app>pip install sklearn
Requirement already satisfied: sklearn in c:\users\username\onedrive\desktop\sa\programming\projects\ipl\flask_app\venv\lib\site-packages (0.0.post1)

(venv) C:\Users\username\OneDrive\Desktop\SA\PROGRAMMING\Projects\IPL\flask_app>python __init__.py
Traceback (most recent call last):
  File "C:\Users\username\OneDrive\Desktop\SA\PROGRAMMING\Projects\IPL\flask_app\__init__.py", line 15, in <module>
    from sklearn.model_selection import train_test_split
ModuleNotFoundError: No module named 'sklearn'
Despite having installed sklearn, it says that there is no module named sklearn. How can I fix this issue?
grand veldt
are you in the right environment? Have you installed the sklearn in the same env you are trying to run it?
hybrid mica
grand veldt
are you in the right environment? Have you installed the sklearn in the same env...
yes, yes
grand veldt
try using python -m init.py
hybrid mica
grand veldt
try using python -m __init__.py
pip install scikit-learn worked
hybrid mica
hybrid mica
The code runs fine as expected. Why does VS Code put a yellow squiggly line unde...
what about this?
grand veldt
hybrid mica
pip install scikit-learn worked
oh, okay. Didn't realised it. you installed 'sklearn'
grand veldt
hybrid mica
what about this?
Is vs code using the environment?
hybrid mica
grand veldt
Is vs code using the environment?
yes
grand veldt
tried closing it and opening again after installing the lib?
hybrid mica
grand veldt
tried closing it and opening again after installing the lib?
i installed this in april and the webapp has always worked, but this yellow warning has always remained
grand veldt
lol
usually, when vs code doesn't recognize something is because it is not using the same env. So, idk
sorry
versed gulch
Hi,
My medical images are CZI files containing metadata regarding pixel spacing etc, I wanted to know that if I convert these images to tiff files and disregard their metadata would this have an effect on the numpy arrays as well as when using these arrays for AI segmentation, or can I just plug the metadata back after my segmentation task?
 kindred totem
Hello guys, I'm tryna build a network from scratch. What initial values should i give to weights and biases? random between -1 and 1?
And if i wanted to mutate my network, do i just
weight = weight + (random() * 2 - 1) * a
where a is a change factor
does this work?
kindred totem
kindred totem
Hello guys, I'm tryna build a network from scratch. What initial values should i...
pls ping me if u answer cuz i got notif off
tidal bough
kindred totem
Hello guys, I'm tryna build a network from scratch. What initial values should i...
how to initialize weights is a pretty complicated question, actually: https://www.deeplearning.ai/ai-notes/initialization/index.html
but usually you use a normal distribution with mean 0 and variance determined by, uhh, complicated arguments from what you want the activations to be (see article). I don't think uniform distributions are used often
kindred totem
oh oke
will it work if i just set between -1 and 1?
i need it for a car ai
with 7 sensors
im doing mutations, without mixing genes of parents or cost functions and so on, just by applying some random small change to each weight of the parent for each child
austere swift
rich river
Im building a deep learning virtual env. Do you think I should use the latest 3....
3.10 is better, 3.11 still doesn't have all packages built for it yet
 silent flare
hi guys, do you know if it's possible in some way to run GPT-JT with google collab?
12gb is not enough
 hardy kernel
hey guys and gals I'm not that experienced with ml stuff, started hardly a couple months ago. I learned about a few models, followed some tutorials, etc. But how do I practice using them. What kind of stuff can I do to gain more knowledge. I'm kinda lost and overwhelmed with this.
grand veldt
hardy kernel
hey guys and gals I'm not that experienced with ml stuff, started hardly a coupl...
you can use kaggle challenges to practice. Kaggle has a lot of cool datasets, lot of people teaching how to process data, improve model and etc. If you already did that, you can find some real world problem to solve by yourself, I think that's the best way to improve on it.
hardy kernel
I see. I tried doing one kaggle comp with the Titanic dataset but it went over my head a bit 😅
grand veldt
what do you mean?
hardy kernel
I was lost because I was trying to use a library i wasn't comfortable with (xgboost). I should give it another shot
grand veldt
I think you should search for some video tutorials teaching how to make predictions on titanic dataset. After that, try yourself. Then, go to another dataset
hardy kernel
Alright will do. Thanks g
grand veldt
welcome
 crude zephyr
Hello Everyone, so basically I'm getting confused in this problem, as I'm learning Data Science right now, if anyone can help me

This is the question basically
and this is the dataframe

I don't understand why did we use groupby here, like how ?
grand veldt
to sum up the quatities of each item
grand veldt
crude zephyr
you group by item_name, then use the sum method to sum all columns that are numbers, after that you sort the values by quantity and get the first value, that is, the item that has the most quantity.
plush jungle
I don't understand why my deep q learner isn't learning
the neural net looks like this
class NeuralNetwork(nn.Module):

    def __init__(self):
        super(NeuralNetwork, self).__init__()

        self.number_of_actions = 3
        self.gamma = 0.999
        self.final_epsilon = 0.0001
        self.initial_epsilon = 0.1
        self.number_of_iterations = 2000000
        self.replay_memory_size = 10000
        self.minibatch_size = 320


        self.conv1 = nn.Conv2d(4, 32, 8, 4)
        self.relu1 = nn.ReLU(inplace=True)
        self.conv2 = nn.Conv2d(32, 64, 4, 2)
        self.relu2 = nn.ReLU(inplace=True)
        self.conv3 = nn.Conv2d(64, 64, 3, 1)
        self.relu3 = nn.ReLU(inplace=True)
        self.fc4 = nn.Linear(3136, 512)
        self.relu4 = nn.ReLU(inplace=True)
        self.fc5 = nn.Linear(512, self.number_of_actions)

    def forward(self, x):
        out = self.conv1(x)
        out = self.relu1(out)
        out = self.conv2(out)
        out = self.relu2(out)
        out = self.conv3(out)
        out = self.relu3(out)
        out = out.view(out.size()[0], -1)
        out = self.fc4(out)
        out = self.relu4(out)
        out = self.fc5(out)

return out```I'm using code from this github
and I'm training it on the following problem:

the blue dot is the player, the red line is the direction it's facing
and it simply gets a reward proportional to how far it is from straight up
so straight down is a reward of 0
and 0 and 90 degress are both reward 90
and north is reward 180
and like every other problem I've trained this on, all it learns is to go in one direction constantly
but that shouldn't happen, because moving left or right when it's pointing north should get a lower reward
 charred light
plush jungle
and like every other problem I've trained this on, all it learns is to go in one...
charred light
plush jungle
and like every other problem I've trained this on, all it learns is to go in one...
Because that direction always results in a reward. It's not going to differentiate the 90 vs 180, as it's always positive. You might want to include penalties. (e.g. Going in X direction after Y times results in a negative reward)
rich river
wooden sail
3.9 is a very safe bet and still has a decent life time ahead of it. 3.10 should...
you mean 3.9 is best for deep learning currently right?
 stoic compass
Which type of correlation coefficient should I use?
Hi, I want to analyze the correlation between two variables that are quantitative, have no outliers, and have a linear relationship but are non-normal distributed. Should I use Pearson’s r, Spearman’s rho, or any other coefficient?
charred light
stoic compass
**Which type of correlation coefficient should I use?**
Hi, I want to analyze t...
stoic compass
charred light
<https://stats.stackexchange.com/questions/3730/pearsons-or-spearmans-correlatio...
I read it, but couldn't get to a clear conclusion as I also saw some articles, like this one: https://www.scribbr.com/statistics/correlation-coefficient/ mentioning that is better to use the Pearson coefficient when the data is normalized. What do you think about it?

A correlation coefficient is a number between -1 and 1 that tells you the strength and direction of a relationship between variables. In other words, it
charred light
You can always try to normalize your data (e.g log transform) and see the results too.
stoic compass
Great, I will try that
charred light
Side note: I love this response...
This answer seems rather indirect. "When the variables are bivariate normal ..." And when not? This kind of explanation is why I never get statistics. "Rob, how do you like my new dress?" "The dark color emphasizes your light skin." "Sure, Rob, but do you like how it emphasisez my skin?" "Light skin is considered beautiful in many cultures." "I know, Rob, but do you like it?" "I think the dress is beautiful." "I think so, too, Rob, but is it beautiful on me?" "You always look beautiful to me, honey." sigh – user14650
stoic compass
ahaha
charred light
Reminds me of "WHAT DOES THE P-VALUE TELL YOU"
misty flint
charred light
Reminds me of "WHAT DOES THE P-VALUE TELL YOU"
why im trying to move away from stats part of job duties and into eng
odd relic
ax.scatter(RA, DEC, c=Class, cmap='viridis', marker='s', s=360)
I would like to turn this into a plt.imshow() code because this is actually an image but I cant figure out how to plot it
@wooden sail sorry for the ping, but If I could get some help
plush jungle
charred light
Because that direction always results in a reward. It's not going to differentia...
I tried that too, and it still only chooses to move in one direction
the only time it doesn't is when it's doing exploration
 ivory mountain
Hello! I have a DataFrame table already available in my Python, but how can I see the URL of it?
P.S. I am taking courses in DataCamp, and there are all tables already "injected", that's why I wanna see where the table is, i.e. URL of it using their built-in command line.
ivory mountain
sns.catplot(x='study_time', y='G3', data=student_data)
How to see the URL of student_data?
young granite
so if the given curve misses values in a certain area and i use scipy interpolate cubic on it ill receive spiking in that area. Is there a way to pretreat the curve?
I tried to add values with a linear method, however then i already used my interpolated x_values.
 lapis sequoia
I wanna get started with AI and ML
FROM where should i start.
any suggestions
 mellow wraith
 silk rune
Just curious, if I have latex code which i want to use as an input to a neural network...
In what form would i give it to TensorFlow?
I don't really know anything about it but im just curious...
Like would i structure it into a tree first, just input it raw, would it matter that it can be of variable length?
fallow frost
Anybody familiar with SpaCy by chance?
odd meteor
ivory mountain
`sns.catplot(x='study_time', y='G3', data=student_data)`
How to see the URL of ...
In the shell provided, i mean the lower part on DataCamp where results are displayed, just use 'student_data.head()` to see the composition of the data in your dataframe
odd meteor
fallow frost
Anybody familiar with SpaCy by chance?
Hi Hannibal, don't ask question to ask question. If you rephrase your question to reveal what you actually need help with in spaCy, I'm sure you'll get a swift and better feedback from people
odd meteor
silk rune
Just curious, if I have latex code which i want to use as an input to a neural n...
Hi Mezza, you can't feed a latex code to a neural network. You can feed only data to your NN. You didn't even show us the latex code to get the complete picture.
Meanwhile, I guess you mean to say, you want to use NN to perform the same operations that's coded in Latex, yeah?
If that's the case, you'd have to convert the latex code to python / R etc...then feed your NN the corresponding dataset to perform the operation
Then you'd have to then implement that same latex code with NN.
fallow frost
odd meteor
Hi Hannibal, don't ask question to ask question. If you rephrase your question t...
Do you know SpaCy by chance
odd meteor
fallow frost
Do you know SpaCy by chance
Yeah... 😁 You're still asking question to ask question. You haven't mentioned what exactly you need help with yet in spaCy.
 thick seal
I was planning on making a simulation on prey vs predator
Collectively, predators(red) chase preys(green) both have a speed and energy, energy depletes over time. Predators need to eat to split, preys just have to survive.
and I was planning matplotlib to plot this, How would I go on making the code after I've made the classes for doing the basic stuff with prey and predator?
mint palm
contrastive loss vs combinatorical loss?
fallow frost
odd meteor
Yeah... 😁 You're still asking question to ask question. You haven't mentioned w...
but Im trying to gauge how good you are with the package, how comfortable are you with SpaCy from 1 to 10
serene scaffold
fallow frost
but Im trying to gauge how good you are with the package, how comfortable are yo...
Please just ask your question. You don't need a commitment from a specific person before you reveal what you need help with.
grand veldt
fallow frost
but Im trying to gauge how good you are with the package, how comfortable are yo...
why don't you ask the question and anyone comfortable with spacy answer it.
fallow frost
Im just trolling bro
but yeah, im not gonna write my problem in detail if nobody that is familiar with is in the channel
I rather to just ask.. and then explain my issue
grand veldt
then you're not trolling
however, you don't need to explain in detail what is your problem. You're just missing a chance to get help.
serene scaffold
fallow frost
Im just trolling bro
Please don't waste the time of volunteers.
serene scaffold
fallow frost
but yeah, im not gonna write my problem in detail if nobody that is familiar wit...
you're asking people to help you for free. which is fine--like I said, we're volunteers. but you have to be willing to front some of the effort.
no one wants to say "yes, I will answer your spaCy question, no matter what it turns out to involve". people want to know what the question will be, so they can decide if they want to dive in or not. (and it might turn out that the question doesn't require as much familiarity with spaCy as you think it does.)
im not gonna write my problem in detail if nobody that is familiar with is in the channel
you could flip this around: an answerer isn't going to idle in this channel waiting for you to type out your question if you're not willing to reveal the question outright.
patent lynx
Hey so, I read that Kendall's tau is superior to spearman and pearson correlation but there is gonna be a catch to this right when applying in python?
wooden sail
patent lynx
Hey so, I read that Kendall's tau is superior to spearman and pearson correlatio...
there's never a clear "better" when discussing metrics. which one is better depends on your application. as for implementation, yeah. the closed form scales as n^2, and the naive form scales as n choose 2
 crystal nexus
Hello, for a project I would like to convert one or more sentences to a topic (can be one or multiple keywords).
For example if i was to say "I had a bad day, i hate my job" it would return something like ["hate", "job"]
I'm already quite good with Python but i have not yet done any AI / Data with it.
Would be happy to know any resources that could help me on my quest
 modest onyx
Hello friends,
I just released a Youtube video where I try to give one way to interpret neural networks
https://youtu.be/pdNYw6qwuNc

In this video, I try to crack open the black box we call a neural network 💪💪
Would love to hear feedback from AI pros and nonpros around here 💪💪
 somber sable
Hello all,
I am currently working on a logistics project (Streamlit) would like to create a kind of movement map.
I have a map of a warehouse with all storage locations, available as PNG and DWG file.
And a table of the movement data with time, person, storage location (coordinate).
I would like to represent now on the map its movement with a line. I have no idea how to do this best, is there by any chance already a framework does this work in Plotly? Or has someone already done something similar?
I find only things to Openmaps or Google, but I have my own map 🙂
Translated with www.DeepL.com/Translator (free version)
hasty mountain
Guys, I'm trying to use Minimum Bayes Risk in order to select the sample with higher similarity score/lower MSE Loss from many outputs generated by my model. However, I don't really know how to do this without creating a spaghetti full of if statements. Can anyone give me a hint?
lossA = (eval_loss(outputA, outputB) + eval_loss(outputA, outputC) + eval_loss(outputA, outputD)) * 1/3
lossB = (eval_loss(outputB, outputA) + eval_loss(outputB, outputC) + eval_loss(outputB, outputD)) * 1/3
lossC = (eval_loss(outputC, outputA) + eval_loss(outputC, outputB) + eval_loss(outputC, outputD)) * 1/3
lossD = (eval_loss(outputD, outputA) + eval_loss(outputD, outputB) + eval_loss(outputD, outputC)) * 1/3
The idea would be selecting the lower loss between those 4.
I was thinking about creating a list and using sorted, but I think this would be good to select the loss specifically, but not the best output itself(if loss A is the best one, I'd have to also select the outputA as the best one)
 steady basalt
 grand veldt
hasty mountain
Guys, I'm trying to use Minimum Bayes Risk in order to select the sample with hi...
grand veldt
hasty mountain
Guys, I'm trying to use Minimum Bayes Risk in order to select the sample with hi...
maybe using a dictionary.
compact egret
I'm genuinely confused as to what is sparse and what is dense, isn't sparse the matrix that is full of zeroes?
 lapis sequoia
Does anyone know how to speedup multivariate_normal.pdf from scipy.stats? Or if there is some C/C++ implementation that can be used in python?
hasty mountain
grand veldt
maybe using a dictionary.
I was thinking about using a pandas. I think DataFrames can be sorted by indices, can't they?
grand veldt
hasty mountain
I was thinking about using a pandas. I think DataFrames can be sorted by indices...
yeah, they can
tidal bough
compact egret
I'm genuinely confused as to what is sparse and what is dense, isn't sparse the ...
well, yes, and your matrix only has 3 nonzero values, hence it can be represented with decent efficiency as a sparse one
roughly speaking, a sparse array is some representation that only stores the nonzero elements (there's a bunch of such representations). They are good for matrices most elements of which are zeros.
wooden sail
compact egret
I'm genuinely confused as to what is sparse and what is dense, isn't sparse the ...
here, sparse refers to a special representation of the matrix where only the nonzero entries are stored. if you call to_dense, the zeros are put back in. the larger a matrix is, the more its sparsity can be exploited to save memory and do your math faster
as far as numpy, tensorflow, etc. are concerned, all matrices are dense unless you explicitly say otherwise
so a matrix like the one you put last is a waste of memory
serene scaffold
wooden sail
here, sparse refers to a special representation of the matrix where only the non...
Unless the matrix itself isn't actually sparse 
plush jungle
I'm trying to figure out why my reinforcement learning isn't working, and one of my theories is that it has to do with color
since the code I'm using grayscales the image input
        image_data_1 = resize_and_bgr2gray(image_data_1)
        image_data_1 = image_to_tensor(image_data_1)

plt.imshow(image_data_1.cpu()[0])```I added the imshow call, which displays it in color
but if bgr2gray is greyscaling it, why would it be in color on imshow?
iron basalt
wooden sail
here, sparse refers to a special representation of the matrix where only the non...
@compact egret Specifically, they use COO format, so 3 lists, non-zeros values (nnz), indices (2-tuples, sorted), and shape (positive integers). The indices being sorted is important for speed of operations such as matrix multiplication. COO can be built incrementally quickly, even though insertion requires an O(n) shift of values, because if your matrix is actually sparse then the number of nnz values should be small (small N).
(Also if built in order, then you can just O(1) append at the end (on average, it's a dynamic array))
compact egret
Alright thank you for the explanation
plush jungle
ok I'm becoming increasingly convinced my Q learner can't actually see the game at all
I dumbed down the problem as much as I could think to and turned it into a game called "Go West Young Man", where there are 3 states, east, mid, and west. The zone the player is in is lit up green, and the other two are white. The goal is to go west and stay there.
east: reward -1
mid: reward 0
west: reward 1
there are 3 actions,
go left
do nothing
go right
in the first version of the game I made it so that going right when you're already west would just make you stay in the west zone
in that version, the agent learned to always go right no matter which zone it was in
in the second version I made it so going all the way one direction would loop back around, so going right when you're already west would put you in east
instead of learning to go west and stay there, the agent always chose to stay still (unless exploring)
and when I checked the output of the neural network in each of the three states (east, mid, west), the q values for the actions were the same in all 3

the only reasonable explanation for why all 3 states would produce the exact same q values for actions after 25k iterations is that the neural network can't distinguish the different states
the zones look like this

this image is then turned into a tensor, and concatenated together with the reward and action tensors and then passed to the neural net
        # get next state and reward
        image_data_1, reward, terminal = game_state.frame_step(action)
        image_data_1 = resize_and_bgr2gray(image_data_1)
        image_data_1 = image_to_tensor(image_data_1)
        state_1 = torch.cat((state.squeeze(0)[1:, :, :], image_data_1)).unsqueeze(0)

        action = action.unsqueeze(0)
        reward = torch.from_numpy(np.array([reward], dtype=np.float32)).unsqueeze(0)

        # save transition to replay memory
        replay_memory.append((state, action, reward, state_1, terminal))

        # if replay memory is full, remove the oldest transition
        if len(replay_memory) > model.replay_memory_size:
            replay_memory.pop(0)

        # epsilon annealing
        epsilon = epsilon_decrements[iteration]

        # sample random minibatch
        minibatch = random.sample(replay_memory, min(len(replay_memory), model.minibatch_size))

        # unpack minibatch
        state_batch = torch.cat(tuple(d[0] for d in minibatch))
        action_batch = torch.cat(tuple(d[1] for d in minibatch))
        reward_batch = torch.cat(tuple(d[2] for d in minibatch))
state_1_batch = torch.cat(tuple(d[3] for d in minibatch))```It's so curious how attention layers can be so simple yet so...mighty.
I just adapted a MultiHead Attention to be an array multiplication(instead of a matrix multiplication) and threw it into a GAN which I was having quite a hard time to generate anything that wasn't black and white random figures...
...and then, after 50 epochs, I could get something...despite the fact it doesn't have anything to do with my dataset.