#data-science-and-ml
1 messages · Page 33 of 1
 lapis sequoia
 serene scaffold
@lapis sequoia this?
In [24]: df.pivot_table(index='hour', values=['earns', 'age'], columns='draw').swaplevel(axis='columns').sort_index(axis='columns')
Out[24]:
draw   1         3         4
     age earns age earns age earns
hour
123    2   200   2   300   2     0
yes, but it miss the case of draw=2
that's my issue 🙂
i want the same like your code, BUT, with draw = 2 & then fill age = -1 ears = -1
df.pivot(index="hour", columns="draw", values="earns").reindex(columns=range(1, 4+1), fill_value=-1)
This do the job for one feature
wanna mix both, seems not so easy to do
draw   1         2        3         4
     age earns age earns age earns age earns
hour
123    2   200   -1   -1  2   300   2     0
 boreal gale
reindex with pd.MultiIndex.from_product([range(1, 4+1), ['age', 'earns']])
kinda like how you just reindex'd before
df.pivot_table(index='hour', values=['earns', 'age'], columns='draw').swaplevel(axis='columns').sort_index(axis='columns').reindex(
  columns=pd.MultiIndex.from_product([range(1, 4+1), ['age', 'earns']]), fill_value=-1
  )
excuse my lack of formatting
lapis sequoia
boreal gale
reindex with `pd.MultiIndex.from_product([range(1, 4+1), ['age', 'earns']])`
ki...
should i conserv pivot then?
boreal gale
yes, my point was the provided solution was really close already and you just had to apply a trick you have already used once before 😉
 fallen crown
Hi i am trying to visualize the cost function of my dataset which has 2 features, is matplotlib a good library for 3D plots ? And do i really need to calculate by myself all the derivatives or there is a library that can do it for me 😀 ?
 wooden sail
matplotlib can indeed do this with surf plots. you can use pytorch, tensorflow, or jax to compute your derivatives for you
 inland eagle
does anyone know how to grab values from a column of a df and replace them to equate to somethng different but still keep their same position as before?
serene scaffold
inland eagle
does anyone know how to grab values from a column of a df and replace them to eq...
can you show the column in question and explain what transformation you want to do? because your question is too abstract to be able to help.
 bronze prism
In order to prevent my machine learning algorithm from tending to a certain data, I want to reduce the frequency differences in my dataset, which is a pandas table, for example, in column X;
A value is 1500 times,
B value is 3000 times,
C value is 1300 times.
Is there a way to get 1250 of them all?
inland eagle
serene scaffold
can you show the column in question and explain what transformation you want to ...
so i want to take the values from this column of this df

and i want to change all the rows that are "Bisexual Characters" and "Homosexual Characters" and change them to say "Minority"

so then later when i have to do a permutation test by groups, it would be easier
because right now i have a function i can apply to sort a numerical value based on whether they are minority or not minority, but when i apply the permutation test i can only choose either bi or homosexual characters
serene scaffold
@inland eagle you should encode "is" or "is not" values as booleans, not as strings. and you can accomplish that with df['GSM'] = df['GSM'] != 'Not Minotiry'
you should also replace all your "Data Unavailable" values with nan
inland eagle
trying

trying.get("GSM").unique()```

```output: array(['Bisexual Characters', 'Homosexual Characters'], dtype=object)```
it still doesn't replace 'Bisexual Characters'& 'Homosexual Characters' to say "Minority" instead because then when I try to apply the permutation it will only have those and not the not minority. I am trying to compare not minority to minority@serene scaffold
def sexuality_type(character):
    if character == "Not Minority":
        return 1
    elif character == "Bisexual Characters" or character == "Homosexual Characters":
        return 0
    else:
        return -1
trying = dc[(dc.get('GSM') != "Not Minority")]
trying

trying.get("GSM").unique()

sexuality = trying.assign(SEXUALITY = trying.get("GSM").apply(sexuality_type))
sexuality
minority_or_not = sexuality.get(['GSM', 'SEXUALITY'])

Minority = dc[(dc.get('GSM') == 'Bisexual Characters') | (dc.get('GSM') == 'Homosexual Characters')]
Not_Minorty = dc[dc.get('GSM') == 'Not Minority']

minority_or_not_test = permutation_test(minority_or_not, "GSM", "Not Minority", minority_or_not[minority_or_not.get('GSM') != "Not Minority"], "SEXUALITY")
minority_or_not_test
#1. Group 1 is more good than Group 2 (at a 5% p-value cutoff).
#2. Group 2 is more good than Group 1 (at a 5% p-value cutoff).
#3. Neither group is statistically significantly more good than the other (at a 5% p-value cutoff).```this is all my code atm
serene scaffold
inland eagle
```trying = dc[(dc.get('GSM') != "Not Minority")]
trying
trying.get("GSM").uniq...
did you do the thing that I said? because you don't want strings that represent boolean values.
inland eagle
serene scaffold
did you do the thing that I said? because you don't want strings that represent ...
i did, it just looks a bit different because my class is using baby pandas atm, not pandas
serene scaffold
once you have replaced the GSM columns with only True and False values, using dc['GSM'] = dc['GSM'] != 'Not Minotiry', then we can continue.
serene scaffold
inland eagle
i did, it just looks a bit different because my class is using baby pandas atm, ...
idk what baby pandas is
inland eagle
i still did a query
inland eagle
serene scaffold
idk what baby pandas is
it is just a simplified version of pandas but imo it is more tedious
serene scaffold
I can only help with actual pandas. I don't want to spend time helping, only to find out that my solution doesn't work because of secret constraints. But I can't imagine a simplified version of pandas that doesn't even allow booleans.
if your instructor is telling you to encode everything except numbers as strings, they're doing you a disservice.
bronze prism
In order to prevent my machine learning algorithm from tending to a certain data, I want to reduce the frequency differences in my dataset, which is a pandas table, for example, in column X;
A value is 1500 times,
B value is 3000 times,
C value is 1300 times.
Is there a way to get 1250 of them all?
serene scaffold
bronze prism
In order to prevent my machine learning algorithm from tending to a certain data...
df.groupby('X').head(1250) will pick the first 1250 rows for each value in column X.
bronze prism
serene scaffold
`df.groupby('X').head(1250)` will pick the first 1250 rows for each value in col...
When grouping by X column, the frequency of the values of the X column does not change.
serene scaffold
bronze prism
When grouping by X column, the frequency of the values of the X column does no...
please do print(df.sample(10).to_dict('list')) and show the result as text (no screenshots) before we can continue. Please make sure it is in your next message, unless you have a question about how to do it, or there's a reason that you can't.
bronze prism
 serene scaffold
bronze prism
serene scaffold
bronze prism
This is very clearly not what I asked for.
bronze prism
As it can be seen, the frequency is very scattered, to give an example from the picture, if 500 pieces of each data are selected, the frequency can be more regular.
bronze prism
serene scaffold
please do `print(df.sample(10).to_dict('list'))` and show the result as text (no...
{'Il': ['İstanbul', 'İzmir', 'İzmir', 'İstanbul', 'İstanbul', 'Ankara', 'Bursa', 'Ankara', 'İstanbul', 'İstanbul'], 'Ilce': ['Avcılar', 'Narlıdere', 'Çeşme', 'Büyükçekmece', 'Maltepe', 'Çankaya', 'Osmangazi', 'Çankaya', 'Ümraniye', 'Bakırköy'], 'Mahalle': ['Cihangir', 'Huzur', 'İsmet İnönü', 'Murat Çeşme', 'Zümrütevler', 'İlkadım', 'Panayır', 'İlkbahar', 'Site', 'Osmaniye'], 'OdaSayisi': ['2 + 1', '3 + 1', '1 + 1', '2 + 1', '2 + 1', '2 + 1', '3 + 1', '4 + 1', '2 + 1', '2 + 1'], 'BrutMt2': [85, 135, 55, 80, 121, 110, 140, 200, 95, 90], 'NetMt2': [80, 120, 50, 70, 97, 90, 125, 180, 90, 80], 'IsinmaTipi': ['Kombi', 'Merkezi (Pay Ölçer)', 'Klima', 'Kombi', 'Merkezi (Pay Ölçer)', 'Merkezi', 'Kombi', 'Merkezi (Pay Ölçer)', 'Kombi', 'Kombi'], 'KatSayisi': [4, 7, 3, 4, 15, 14, 8, 13, 5, 5], 'BulunduguKat': [2, 4, 2, 3, 11, 10, 8, 7, 4, 2], 'BanyoSayisi': [1, 1, 1, 1, 2, 1, 2, 2, 1, 1], 'BinaYasi': [12, 28, 7, 11, 8, 18, 6, 4, 15, 28], 'EsyaDurumu': [1, 0, 1, 0, 0, 1, 0, 0, 0, 0], 'Fiyat': [1497, 7250, 6700, 5000, 17000, 9000, 6000, 6250, 9250, 8000]}
so you want to sample so that the values in OdaSayisi are equally represented?
bronze prism
@serene scaffold i found the solution thank you
df2 = pd.concat([
    df[df['OdaSayisi']=='3 + 1'][:500],
    df[df['OdaSayisi']=='2 + 1'][:500],
    df[df['OdaSayisi']=='1 + 1'][:500],
    ...
])
that looks like a slower/more complicated way of doing df2 = df.groupby('OdaSayisi').head(500)
bronze prism
serene scaffold
that looks like a slower/more complicated way of doing `df2 = df.groupby('OdaSay...
this is working. When you just wrote it, I couldn't assign it to a variable and it looked like a normal head command.
Sorry for the disagreement. thank you again
serene scaffold
bronze prism
this is working. When you just wrote it, I couldn't assign it to a variable and ...
No problem. Feel free to ask in this channel if you ever have another question
inland eagle
serene scaffold
I can only help with actual pandas. I don't want to spend time helping, only to ...
ok i figured out how to apply what you said. tysm for your help!
you probs don't care, but this is what i ended up doing
def sexuality_type(character):
    if character == "Not Minority":
        return "True"
    elif character == "Bisexual Characters" or character == "Homosexual Characters":
        return "False"

GSM_remix = dc.assign(GSM = dc.get('GSM').apply(sexuality_type))

def sexuality_values(character):
    if character == "True":
        return 1
    else:
        return 0

sexuality = GSM_remix.assign(SEXUALITY = GSM_remix.get("GSM").apply(sexuality_values))
minority_or_not = sexuality.get(['GSM', 'SEXUALITY'])
minority_or_not

minority_or_not_test = permutation_test(minority_or_not, "GSM", "True", "False", "SEXUALITY")
minority_or_not_test

#1. Group 1 is more good than Group 2 (at a 5% p-value cutoff).
#2. Group 2 is more good than Group 1 (at a 5% p-value cutoff).
#3. Neither group is statistically significantly more good than the other (at a 5% p-value cutoff).```def sexuality_type(character):
if character == "Not Minority":
return "True"
elif character == "Bisexual Characters" or character == "Homosexual Characters":
return "False"
You're still using strings, except that the strings happen to be "True" or "False". All you need to do to encode this column is dc['GSM'] = dc['GSM'] == "Not Minority" as one statement, and you don't need this function at all.
lapis sequoia
serene scaffold
```py
def sexuality_type(character):
if character == "Not Minority":
...
Why are you returning a boolean as a damn string
It's burning my eyes
 rare socket
Hello, has anyone here worked with PyGad before? I am having issues with the fitness function.

Stack Overflow
I am trying to train a genetic algorithm but for some reason it does not work when it's stored inside of a class. I have two equivalent pieces of code but the one stored inside of a class fails. It
lapis sequoia
If I send a diagram in here of a MLP. Can someone show me how it would be done in PyTorch or tensorflow?
serene scaffold
lapis sequoia
Why are you returning a boolean as a damn string
that's not my code.
 agile cobalt
"this" what exactly?
serene scaffold
you can always do == n to get a dataframe of bools for what elements equal n.
lapis sequoia
inland eagle
you probs don't care, but this is what i ended up doing
```#Group 1 = gender or ...
Why don't you just use df.loc or np.select?
df.apply is basically a glorified for loop
Stack Overflow
How do I add a color column to the following dataframe so that color='green' if Set == 'Z', and color='red' otherwise?
Type Set
1 A Z
2 B Z
3 B ...
You can use np.where to create a pandas column
agile cobalt
so yeah, depends on what that "function" is
lapis sequoia
Absolutely no incompatibility with that.
lapis sequoia
serene scaffold
that's not my code.
Still it's burning my eyes
Alternatively, use df.where and specify other=
lapis sequoia
lapis sequoia
Still it's burning my eyes
It just makes the code a bit extra complicated
serene scaffold
lapis sequoia
Still it's burning my eyes
that's why I was telling them not to do it.
lapis sequoia
serene scaffold
that's why I was telling them not to do it.
Ok
agile cobalt
if you want to apply an arbitrary python function, you might need to use something like apply which is a bad idea overall
if it's some specific operation, you should try to rewrite it using pandas's vectorized operations instead
 serene plume
import scipy.spatial.distance as spd

pairwise_sims = spd.pdist(matrix, metric=np.dot)
This is horribly slow because the metric=np.dot is not vectorized. How can I achieve the same - a sequence of pairwise dot products on the matrix rows - but vectorized?
Please ping me if you reply
It can also be expressed like
from itertools import combinations
[np.dot(row_a, row_b) for row_a, row_b in combinations(matrix, 2)]
But again, those are punctual np.dots, so non-vectorized and really slow
 tidal bough
serene plume
It can also be expressed like
```py
from itertools import combinations
[np.dot(r...
tidal bough
serene plume
It can also be expressed like
```py
from itertools import combinations
[np.dot(r...
hmm, so res[i,j] should be sum_k mat[i,k]*mat[j,k]?
because I'm pretty sure that's equivalent to just res = matrix@matrix.T
well, this calculates twice the number of elements you need (since the distance is symmetric), but should be pretty fast at least
serene plume
tidal bough
well, this calculates twice the number of elements you need (since the distance ...
Indeed. I would end up doing
res = np.triu(matrix@matrix.T)
np.fill_diagonal(res, 0)
It's more work, but yes, it should be faster. I'll try it out, thank you
 robust pewter
hello there
im unable to install speechrecognition
pip install SpeechRecognition
bash: /Library/Frameworks/Python.framework/Versions/3.10/bin/pip: No such file or directory
what could i do
 delicate apex
!dashmpip might help
 arctic wedgeBOT
Install packages with `python -m pip`
When trying to install a package via pip, it's recommended to invoke pip as a module: python -m pip install your_package.
Why would we use python -m pip instead of pip?
Invoking pip as a module ensures you know which pip you're using. This is helpful if you have multiple Python versions. You always know which Python version you're installing packages to.
Note
The exact python command you invoke can vary. It may be python3 or py, ensure it's correct for your system.
robust pewter
thank you
thank you so much
idk why I installed the packages but still getting the same error
 wooden sail
are you using vscode or pycharm by any chance?
these (can) make virtual environments by default, meaning you have to install packages (just as you did above) in the terminal inside the ide
robust pewter
wooden sail
these (can) make virtual environments by default, meaning you have to install pa...
I did do them inside the terminal provided by visualstudio code
  Found existing installation: chardet 4.0.0
    Uninstalling chardet-4.0.0:
      Successfully uninstalled chardet-4.0.0
  Found existing installation: idna 3.3
    Uninstalling idna-3.3:
      Successfully uninstalled idna-3.3
  Running setup.py install for googletrans ... done
Successfully installed certifi-2022.9.24 chardet-3.0.4 googletrans-3.1.0a0 h11-0.9.0 h2-3.2.0 hpack-3.0.0 hstspreload-2022.11.1 httpcore-0.9.1 httpx-0.13.3 hyperframe-5.2.0 idna-2.10 rfc3986-1.5.0 sniffio-1.3.0
yet its not working
wooden sail
can you type which python
robust pewter
wooden sail
can you type ```which python```
in the terminal right?
wooden sail
yes
robust pewter
/usr/local/bin/python
wooden sail
how about python --version
robust pewter
3.10.5
wooden sail
hmm looks ok
robust pewter
k
both the packages are install
also is there anyway to remove unwanted packages?
wooden sail
python -m pip uninstall [package]
robust pewter
LETS GO
thanks to a yt vid
but
now im getting this error
I think my code is correct
nvm fixed
nvm its broken
here is the error
Traceback (most recent call last):
File "/Users/name/Desktop/abc/Body/Listen.py", line 22, in <module>
Listen()
File "/Users/name/Desktop/abc/Body/Listen.py", line 5, in Listen
r = sr.Microphone()
File "/Library/Frameworks/Python.framework/Versions/3.10/lib/python3.10/site-packages/speech_recognition/init.py", line 79, in init
self.pyaudio_module = self.get_pyaudio()
File "/Library/Frameworks/Python.framework/Versions/3.10/lib/python3.10/site-packages/speech_recognition/init.py", line 110, in get_pyaudio
raise AttributeError("Could not find PyAudio; check installation")
AttributeError: Could not find PyAudio; check installation
wooden sail
have you installed pyaudio? 😛
robust pewter
wooden sail
have you installed pyaudio? 😛
not able to install it :/
wooden sail
why not?
lookie here, from the pyaudio website https://people.csail.mit.edu/hubert/pyaudio/#downloads
PyAudio provides Python bindings for PortAudio, the cross platform audio API.

it has some dependencies that you need to install with apt
robust pewter
Traceback (most recent call last):
  File "/Users/name/Desktop/abc/Body/Listen.py", line 22, in <module>
    print(Listen())
  File "/Users/name/Desktop/abc/Body/Listen.py", line 10, in Listen
    audio = r.listen(source,0,8)
AttributeError: 'Microphone' object has no attribute 'listen'
finally it installed
robust pewter
wooden sail
got it
robust pewter
robust pewter
```py
Traceback (most recent call last):
File "/Users/name/Desktop/abc/Body/Li...
i cant understand this
yet
def Listen():
      r = sr.Microphone()

      with sr.Microphone() as source:
            print("I am Listening...")
            r.pause_threshold = 1
            audio = r.listen(source,0,8)
nvm i think i got it
wooden sail
idk anything about sr, i'd recommend to read the docs on the microphone class or method od whatever it is
robust pewter
k
i got it
local variable 'query' referenced before assignment
im 90% sure my code is correct yet
          print("I am Recognising...")
          query: r.recognize_google(audio,language="hi")

    except:
          return ""

    query = str(query).lower()
    return query

print(Listen())```if you get an error when defining query in the try, it does not get defined. then str(query) cannot be done
robust pewter
Traceback (most recent call last):
  File "/Users/clchoudhary/Desktop/Jarvis/Jarvis.py", line 50, in <module>
    if 'wikipedia' in query:
TypeError: argument of type 'builtin_function_or_method' is not iterable
here is the code
 if 'wikipedia' in query:
                  speak("Searching Wikipedia...")
                  query = query.replace("wikipedia", "")
                  results = wikipedia.summary(query, sentences=2)
                  speak("Wikipedia says")
                  speak(results)
could anyone help?
 rugged comet
It looks like query is a method that you forgot to call.
robust pewter
fixed it
 heavy crow
I finally got my unsupervised contrastive learning to work and was able to perform a grid search to find the optimal architecture 🙂
Here i am visualizing the 128-dim vectorspace in 3D. you can see the obvious clusters everywhere!
the grid search yielded that the projector should consist of only one layer, as well as that the sweet spot for embedding size is around 128-Dim. Bigger backbones/encoders perform better but with diminishing returns. The difference between the smallest embedding space i tried (16) and the biggest (256) is only 35%
Here is a bit longer video
The visualization was made using moderngl https://github.com/moderngl/moderngl for anyone interested
 hasty mountain
Are GANs supposed to generate more directed outputs as we use a lower learning rate? Or am I just collapsing my model?
I suppose that, if I got the mathemagic correctly, it'll always generate an specific output when passing a noise A as input, and always generate another specific output when passing noise B.
But idk, I had so much bad luck with those things that I wouldn't discard the possibility of being self-deluded 
I remember that specific outputs in GANs are usually attached to VAEs to correlate certain noise sizes to certain outputs(classes), but I don't know if this relates here...
 keen notch
hey are the help channels no longer available
I have an error that I'm trying to solve in python/numpy
 arctic wedgeBOT
Hey @keen notch!
You either uploaded a .txt file or entered a message that was too long. Please use our paste bin instead.
 fervent hatch
how can i transform back the scaled value to the original value in prediction?
 mild dirge
keen notch
hey are the help channels no longer available
mild dirge
keen notch
hey are the help channels no longer available
The system has been changed, there are now forum posts
But you can ask in here too if it's relevant 😉
keen notch
keen notch
keen notch
I have an error that I'm trying to solve in python/numpy
this is the code with my error
mild dirge
What's the error? Do you mean the warning in the screenshot you showed?
The answer on this SO seems to explain it pretty well, seems to be a problem with your data
https://stackoverflow.com/questions/50371428/scipy-curve-fit-raises-optimizewarning-covariance-of-the-parameters-could-not
Stack Overflow
I am trying to fit this function to some data:
But when I use my code
import numpy as np
from scipy.optimize import curve_fit
import matplotlib.pyplot as plt
def f(x, start, end):
res = np.
keen notch
yes let me check again when I run it, it doesn't seem right my curve either
 keen notch
mild dirge
The answer on this SO seems to explain it pretty well, seems to be a problem wit...
keen notch
mild dirge
The answer on this SO seems to explain it pretty well, seems to be a problem wit...
oo let me read this
 dusty valve
https://github.com/HRLO77/predictor used tensorflow to make an lstm regressor, does everything look alright?
mild dirge
dusty valve
<https://github.com/HRLO77/predictor> used tensorflow to make an lstm regressor,...
I mean, that's like hundreds of lines of codes to look though 😛
dusty valve
mild dirge
I mean, that's like hundreds of lines of codes to look though 😛
Just ./weights/weights.md
The loading weights for a model and training a model examples
keen notch
not sure what's wrong stilll
keen notch
mild dirge
What's the error? Do you mean the warning in the screenshot you showed?
can you spot the problem in my pastebin
mild dirge
I don't know where the warning occurs
 mild dirge
You should probably find out by running lines individually, since you are already using a notebook
 gilded oasis
Hi, how can I fix this problem with my training score ?

Maybe the problem come from of my optimization of DesicionTreeRegressor() ?
 mild dirge
gilded oasis
Hi, how can I fix this problem with my training score ?
mild dirge
gilded oasis
Hi, how can I fix this problem with my training score ?
Training score is 1.00, which is perfect, so what is the problem?
It might only be that the model is overfitted, since the difference between training and testing is a bit high
 foggy yarrow
What would be most efficient way of extracting from this type of formatted PDF into CSV format, I have around 4 patients on each page and around ~40 000 pages. (jpg image of PDF for reference)

 river sapphire
so i'm not exactly using python for this project but I legit got no responses or replies that solved my issue, so I am trying to train a DDQN to play snake and the agent seems to crash into the wall over and over again for some reason
I have a full detailed post here: https://www.reddit.com/r/reinforcementlearning/comments/z3ockm/ddqn_snake_agent_still_takes_same_action/


reddit
5 votes and 0 comments so far on Reddit
serene scaffold
foggy yarrow
What would be most efficient way of extracting from this type of formatted PDF i...
Extracting tabular data from PDFs is really difficult to get right. If accuracy matters (and I can't imagine that it doesn't), you'll probably need to use an OCR approach
mild dirge
foggy yarrow
What would be most efficient way of extracting from this type of formatted PDF i...
It really depends on the consistency of the layout too, if they are at the exact same position, the documents are all the same size and font, you could maybe even use template matching and stuff
gilded oasis
mild dirge
Training score is 1.00, which is perfect, so what is the problem?
Ok thanks !


 whole tendon
I was trying to install tensorflow probability with pip install --upgrade tfp-nightly but then I got this massive error message: ERROR: Command errored out with exit status 1:
command: 'C:\Python311\python.exe' -u -c 'import io, os, sys, setuptools, tokenize; sys.argv[0] = '"'"'C:\Users\ashee_mpie0zd\AppData\Local\Temp\pip-install-be8dz805\dm-tree_1e61a6111d5f419a963eb0234dcff694\setup.py'"'"'; file='"'"'C:\Users\ashee_mpie0zd\AppData\Local\Temp\pip-install-be8dz805\dm-tree_1e61a6111d5f419a963eb0234dcff694\setup.py'"'"';f = getattr(tokenize, '"'"'open'"'"', open)(file) if os.path.exists(file) else io.StringIO('"'"'from setuptools import setup; setup()'"'"');code = f.read().replace('"'"'\r\n'"'"', '"'"'\n'"'"');f.close();exec(compile(code, file, '"'"'exec'"'"'))' bdist_wheel -d 'C:\Users\ashee_mpie0zd\AppData\Local\Temp\pip-wheel-qz4fl119'
Can some help me resolve this issue?
 austere swift
iirc tensorflow isn't supported on python 3.11 yet
 minor lily
yea it aint supported
fallen crown
Hi, I am working on a dataset which has the
living space as only feature and the price for the house is the target
I tried to plot the costFunction (MSE) in a 3D surface plot on matplotlib but it
but it doesn't look like the graph of a quadratic equation

I think the error could be in the calcul of MSE, or thetas i don't know
fallen crown
I tried on anto plot cost_function on a other dataset
The dataset contains x and y values:
x values are just iterating values.
y values depend on the equation y = mx+c
same rror

 maiden pawn
!resources
arctic wedgeBOT
Resources
The Resources page on our website contains a list of hand-selected learning resources that we regularly recommend to both beginners and experts.
fallen crown
maiden pawn
!resources
there is no topic on this issue...
maiden pawn
I was trying to get the link 😅
maiden pawn
Hows 365datascience course? Or should i buy some other courses?
 idle urchin
how do I write to an xlsb file from a pandas dataframe
austere swift
!d pandas.DataFrame.to_excel
arctic wedgeBOT
DataFrame.to_excel(excel_writer, sheet_name='Sheet1', na_rep='', float_format=None, columns=None, header=True, index=True, index_label=None, startrow=0, startcol=0, engine=None, ...)```
Write object to an Excel sheet.

To write a single object to an Excel .xlsx file it is only necessary to specify a target file name. To write to multiple sheets it is necessary to create an ExcelWriter object with a target file name, and specify a sheet in the file to write to.

Multiple sheets may be written to by specifying unique sheet\_name. With all data written to the file it is necessary to save the changes. Note that creating an ExcelWriter object with a file name that already exists will result in the contents of the existing file being erased.@idle urchin
idle urchin
austere swift
<@433723196122988575>
that's for xlsx file not xlsb files
austere swift
idle urchin
that's for xlsx file not xlsb files
it works for any excel file iirc
it'll change the engine parameter accordingly depending on which extension you put in
idle urchin
austere swift
it works for any excel file iirc
it says no engine for filetype 'xlsb'
austere swift
idle urchin
it says no engine for filetype 'xlsb'
it might just not support it then
you might be able to try openpyxl or pyexcel
but that's pretty much the extent of pandas' excel support
idle urchin
austere swift
it might just not support it then
so there's no way to write pandas dataframe to xlsb file
austere swift
not as far as I know
openpyxl can work with pandas dataframes
so if that supports xlsb (I don't know if it does though) then you'd be able to use that for writing
 warm aspen
i need projects to practise my pandas skills 🥺
serene scaffold
warm aspen
i need projects to practise my pandas skills 🥺
any time you use pandas, and you're tempted to write a for loop or use apply, exhaust all options before giving in to the temptation. that's how I learned it.
delicate apex
https://stackoverflow.com/a/60019546
supposedly, this is enough since january 2020:
import pandas as pd
df = pd.read_excel('path_to_file.xlsb', engine='pyxlsb')
do need to install pyxlsb though, as it doesn't come with pandas by default
idle urchin
delicate apex
https://stackoverflow.com/a/60019546
supposedly, this is enough since january 20...
this is reading I'm talking about writting
 warped osprey
how can I change the background color of a seaborn plot based on the x-value? I have a plot like this and I want to change the color to red or blue based on the year (x-value)


to make something like this
%matplotlib inline
import matplotlib.pyplot as plt
import numpy as np
import seaborn as sns
sns.set_theme()
sns.set(font_scale=0.7)

fig, ax = plt.subplots(2, 1, sharex=True)
fig.set_figwidth(10)
ax[-1].set_xlabel('Year')
ax[-1].set_xlim(pd.to_datetime('1981'), pd.to_datetime('2022'))
ax[-1].set_xticks([pd.to_datetime(str(year)) for year in range(1981, 2023, 2)])

sns.lineplot(unrate.query('DATE >= 1981'), x='DATE', y='UNRATE', ax=ax[0])
ax[0].set_ylabel('Unemployment Rate (%)\nSeasonally Adjusted')

sns.lineplot(debt.query('DATE >= 1981'), x='DATE', y='GFDEGDQ188S', ax=ax[1])
ax[1].set_ylabel('Total Public Debt (% of GDP)')
huh, interesting question. I'd probably try setting the background to be an image like this, after generating such an image.
https://stackoverflow.com/a/68734579
e.g. here it's done with just imshow
whole tendon
austere swift
iirc tensorflow isn't supported on python 3.11 yet
Ok thank you
 tropic matrix
I'm using machine learning to predict a price of an item in an in-game economy based on the item's attributes, and the data I'm using has a wide range of prices, but the grand majority of prices are worth much less than the top 1% of prices. How should i handle this so that a model (or models) can be accurate over all price ranges?
Here's the spread of the prices:
0 percentile value is 1
10 percentile value is 15000
20 percentile value is 55000
30 percentile value is 99999
40 percentile value is 200000
50 percentile value is 398000
60 percentile value is 700000
70 percentile value is 1000000
80 percentile value is 1900000
90 percentile value is 6000000
100 percentile value is  2000000000
90 percentile value is 6000000
91 percentile value is 7299000
92 percentile value is 8500000
93 percentile value is 10000000
94 percentile value is 11988999
95 percentile value is 14000000
96 percentile value is 16999999
97 percentile value is 21000000
98 percentile value is 27450000
99 percentile value is 46500000
100 percentile value is  2000000000
I can't just ignore the outlying prices, the model should be able to accurate predict the price of some items which routinely go above 100,000,000 and sometimes even routinely above 1,000,000,000
 mighty patio
Not my field exactly, but you can try to predict log(price) instead of price
 fringe urchin
Hope I posted this in the correct section :S enjoy https://www.youtube.com/watch?v=-DVyjdw4t9I

Guido van Rossum is the creator of Python programming language. Please support this podcast by checking out our sponsors:
- GiveDirectly: https://givedirectly.org/lex to get gift matched up to $1000
- Eight Sleep: https://www.eightsleep.com/lex to get special savings
- Fundrise: https://fundrise.com/lex
- InsideTracker: https://insidetracker.com...
 upper saffron
is this channel suitable for opencv questions
im having an issue w one part of my code :((
serene scaffold
upper saffron
is this channel suitable for opencv questions
yes
upper saffron
okie im having issues w trying to read a video file (i've structured my code using OOP so there are multiple files with different classes which i've imported all into a main.py file)
this is the error
 upper saffron
serene scaffold
yes
upper saffron
serene scaffold
yes
im not very sure what im doing wrong here cuz the code works when it's not structured in the OOP paradigm
serene scaffold
upper saffron
im not very sure what im doing wrong here cuz the code works when it's not struc...
don't aim the question at me. I don't know opencv.
upper saffron
serene scaffold
don't aim the question at me. I don't know opencv.
oh sorreh
 dusk tide
I am having a hard time finding plant species dataset with proper training and testing set. And also the no. Of images in each category is also around 30. Can someone help??🙏🙏
 elder bloom
Hello Everyone I just finished my new notebook on Heart Disease prediction Exploratory Data analysis.. Do check it out if you have time- https://www.kaggle.com/code/sandipan001/heart-failure-eda-using-plotly
And pls do upvote if you like the notebook

Explore and run machine learning code with Kaggle Notebooks | Using data from Heart Failure Prediction Dataset
 willow gale
hihihi, im new to pandas and im totally lost; how can I separate the string which contains n2 on last column and separate these 2nd and 3rd column by - and / delimiters?
 serene scaffold
willow gale
hihihi, im new to pandas and im totally lost; how can I separate the string whic...
serene scaffold
willow gale
hihihi, im new to pandas and im totally lost; how can I separate the string whic...
use expand=True
willow gale
oh my
willow gale
serene scaffold
https://pandas.pydata.org/pandas-docs/stable/reference/api/pandas.Series.str.spl...
thanks a lot! :D
I've removed those values with "n2" but I'm still confused on splitting the columns :/
 serene scaffold
willow gale
thanks a lot! :D
I've removed those values with "n2" but I'm still confused on ...
serene scaffold
willow gale
thanks a lot! :D
I've removed those values with "n2" but I'm still confused on ...
which one has the n2?
serene scaffold
please do print(df.head().to_dict('list')) and give the text to continue.
no screenshots
willow gale
{'Model': ['Apple M2', 'Apple M1', 'Apple A16 Bionic', 'Apple A15 Bionic', 'Qualcomm Snapdragon 8 Gen 2'], 'MHz - Turbo': ['2424\xa0‑\xa03480', '2064\xa0‑\xa03200', '\xa0‑\xa02460', '\xa0‑\xa03230', '2000\xa0‑\xa03200'], 'Cores / Threads': ['8/8', '8/8', '6/6', '6/6', '8/8'], 'Process\xa0(nm) \xa0': [5.0, 5.0, 4.0, 5.0, 4.0], 'Days\xa0old \xa0': [160, 736, 70, 428, 8], 'Perf. Rating': [99.2, 86.8, 79.3, 71.4, 67.7], 'Geekbench 5.4 Single-Core': [1914, 1730, 1882, 1734, 1493], 'Geekbench 5.4 Multi-Core': [8951, 7578, 5533, 4788, 5243]}
understandable
serene scaffold
I don't see any ns in the last column.
willow gale
yes, I just filtered them out
serene scaffold
you have to rewind to where the problem existed for me to offer a solution.
willow gale
uhm, the problem is that, I want to split up the column Cores / Threads
into Cores and Threads
serene scaffold
please print the dataframe the way I showed, as it existed in your first screenshot.
willow gale
alright
{'MHz - Turbo': ['2424\xa0‑\xa03480', '2064\xa0‑\xa03200', '\xa0‑\xa02460', '\xa0‑\xa03230', '2000\xa0‑\xa03200'], 'Cores / Threads': ['8/8', '8/8', '6/6', '6/6', '8/8'], 'Process\xa0(nm) \xa0': [5.0, 5.0, 4.0, 5.0, 4.0], 'Days\xa0old \xa0': [160, 736, 70, 428, 8], 'Perf. Rating': [99.2, 86.8, 79.3, 71.4, 67.7], 'Geekbench 5.4 Single-Core': ['1914', '1730', '1882', '1734', '1493'], 'Geekbench 5.4 Multi-Core': ['8951', '7578', '5533', '4788', '5243']}
in previous screenshot last column dtype wasn't int so I had to remove n
Out[67]:
Model
Apple M2                       8951
Apple M1                       7578
Apple A16 Bionic               5533
Apple A15 Bionic               4788
Qualcomm Snapdragon 8 Gen 2    5243
                               ...
Mediatek Helio A22 MT6761       439
Mediatek MT8766B                455
Mediatek Helio A20 MT6761D      477
Mediatek MT6737                 291
Mediatek MT6580M                248
Name: Geekbench 5.4 Multi-Core, Length: 134, dtype: object
In [71]: t["Geekbench 5.4 Multi-Core"]
Out[71]:
Model
Apple M2                       8951
Apple M1                       7578
Apple A16 Bionic               5533
Apple A15 Bionic               4788
Qualcomm Snapdragon 8 Gen 2    5243
                               ...
Mediatek Helio A22 MT6761       439
Mediatek MT8766B                455
Mediatek Helio A20 MT6761D      477
Mediatek MT6737                 291
Mediatek MT6580M                248
Name: Geekbench 5.4 Multi-Core, Length: 134, dtype: int64
``` after changing itIn [19]: df['Cores / Threads'].str.split('/', expand=True)
Out[19]:
0 1
0 8 8
1 8 8
2 6 6
3 6 6
4 8 8
In [20]: df['Cores / Threads'].str.split('/', expand=True).rename({0: 'cores', 1: 'threads'}, axis='columns')
Out[20]:
cores threads
0 8 8
1 8 8
2 6 6
3 6 6
4 8 8
:O
serene scaffold
you can do this sort of thing for each problematic column, and then pd.concat everything together.
serene scaffold
don't worry about it. pandas takes a while to wrap ones head around.
willow gale
thanks a lot for your patience and politeness :D
serene scaffold
of course!
willow gale
I really feel the gratitude since other servers are quite toxic
serene scaffold
we hate that about them
lapis sequoia
Hello!
To follow my subject tow days ago, i build with the dataset my model:
& i obtains some results as output, but, i'm not sure to really undesrtand the ouput and recall / val loss obtain.
My question is: how to "rank" with efficency output metrics obtains? some ratios? or really "case study" dependant?


for my personnal case, i obtain something like 0.04 as min val loss, but realy don't know what does it mean exactly to be concrete about my subject
maybe the good question is "i'm supposed to ask the good request on dedicated model"?
 wind barn
dusk tide
I am having a hard time finding plant species dataset with proper training and t...
wind barn
dusk tide
I am having a hard time finding plant species dataset with proper training and t...
you may get under life sciences: https://archive.ics.uci.edu/ml/datasets.php or in kaggle..
 frank shard
Hey im having probably really silly problem with my Tensorflow model,
while using .evaluate func it's not returning accuracy in result. Anyone know why?
    linear_est = tf.estimator.LinearRegressor(feature_columns=feature_columns)
    linear_est.train(train_input_fn)
    result = linear_est.evaluate(val_input_fn)
    print(result)
    print(f"Accuracy: {result['accuracy']}")
{'average_loss': 595.8566, 'label/mean': 23.561148, 'loss': 595.567, 'prediction/mean': -0.34731048, 'global_step': 4000}
Traceback (most recent call last):
  File "C:\Users\style\Documents\samedi\core\ai\t.py", line 65, in <module>
    print(f"Accuracy: {result['accuracy']}")
KeyError: 'accuracy'
If u need more code please mention' me
 odd meteor
upper saffron
im not very sure what im doing wrong here cuz the code works when it's not struc...
odd meteor
upper saffron
im not very sure what im doing wrong here cuz the code works when it's not struc...
Hi Pink, have you resolved this problem yet? I'm into CV yet, however, If you've not fixed the problem, you might wanna try asking your question in #media-processing channel as well.
 desert bear
Hi, question regarding optimization. What does oracle calls mean?
E.g.:
We give a simple algorithm which solves this problem with O~(n2) oracle calls
 obtuse talon
Hello guys, someone here is familiar with decision trees in python?
odd meteor
lapis sequoia
for my personnal case, i obtain something like 0.04 as min val loss, but realy d...
That means your the value of the error term in the validation set is 4%. So in simpler terms, your model is 96% accurate in performing whatever task you trained it on and 4% inaccurate in its prediction (using the validation set only).
So for you tell how well your model generalizes, you will then have to compare its performance on the train set Vs. on the validation set.
odd meteor
obtuse talon
Hello guys, someone here is familiar with decision trees in python?
Hi An0ny, don't ask question to ask question. Just ask your question directly and anyone who knows it can easily respond without having to interrogate further to know what exactly you need help with in Decision Trees. ✌🏾
obtuse talon
odd meteor
Hi An0ny, don't ask question to ask question. Just ask your question directly an...
Aight thanks but already got an answer
odd meteor
tropic matrix
I'm using machine learning to predict a price of an item in an in-game economy b...
What's the distribution of this feature? Does it follow Gaussian distribution? If yes, is it right or left skewed? Try to figure this out. Then you'd know if it's necessary to perform normalization or standardize the distribution of the price feature.
tropic matrix
odd meteor
What's the distribution of this feature? Does it follow Gaussian distribution? I...
i believe it does not follow a gaussian distribution, but my method of data analysis may be flawed:
i first simply plotted the density of prices:
df['price'].plot(kind='kde')
and i get the first image
then i decided to plot just the prices between the 25th and 75th percentile:
df[(df['price'].quantile(0.25) < df['price']) & (df['price'] < df['price'].quantile(0.75))]['price'].plot(kind='kde')
and i get the second image
what else should i attempt to do?

 serene scaffold
@odd meteor hope you're doing great  💚
💚
odd meteor
tropic matrix
i believe it does not follow a gaussian distribution, but my method of data anal...
You'd need to standardize the price feature if you're certain the outliers aren't really anomalies in that column
odd meteor
serene scaffold
<@519319496868233227> hope you're doing great <:lemon_hyperpleased:7544418798226...
Hi Pope 😃 it's been a minute. I'm doing great myself and you?
tropic matrix
odd meteor
You'd need to standardize the price feature if you're certain the outliers aren'...
how would I go about doing that?
odd meteor
tropic matrix
how would I go about doing that?
You can use StandardScaler to shift the distribution of the price feature to have a mean of 0 and a standard deviation of 1.
 iron basalt
desert bear
Hi, question regarding optimization. What does **oracle calls** mean?
E.g.:
```
...
iron basalt
desert bear
Hi, question regarding optimization. What does **oracle calls** mean?
E.g.:
```
...
Iterations.
tropic matrix
odd meteor
You can use `StandardScaler` to shift the distribution of the price feature to h...
alright, and is there any possibility of losing resolution in the data after doing so? i'm concerned that since the range of prices is so high (1 to 2,000,000,000) that there would be a chance that the numbers become too small and the model becomes inaccurate because of it
 brave ore
Hi guys. I want to compare the metrics of 6 different models when those are trained on different ratios of class imbalance (IE, Y: metric value, X: imbalance ratio from 0.1 to 1). Which visualization would be optimal in this case? line chart or column chart? and which lib you would recommend (mpl, sns...)?
 crude orchid
I wrote some code around 5 months ago to gather comment data from reddit to do some analysis using the PMAW wrapper for the Pushshift API and have just come back to it recently and I think there might be some issues going on with that API wrapper (Found here: https://github.com/mattpodolak/pmaw)
The specific method I'm having issues with is the 'search_submission_comment_ids' method, I know that I am feeding it a list of submission ids that have comments, so I don't think the inputs are causing me issues. Just hoping there might be someone who has had similar issues or if anyone has any suggestions for a potential workaround
river sapphire
I noticed when training my DDQN snake agent that the loss seems to spike to extremely large numbers, how do I fix this?

 fading crane
Can someone explain to me how diffusion models learning to reveres the noise process leads to them being able to synthesize images?
river sapphire
fading crane
Can someone explain to me how diffusion models learning to reveres the noise pro...
so I don't actually know a lot about diffusion models but from what I heard you basically plug in random noise after it's trained and the model diffuses that to create an image
 tidal bough
keen notch
does anyone see how I can fix this
tidal bough
keen notch
does anyone see how I can fix this
does curve_fit here return a 2-element tuple or some other number of elements? if it's not that, it might just be wrong


 bronze basalt
Hello everyone, i have a question about the method of the least squares for linear models.
On Wikipedia, it is written :
The least-squares method finds the optimal parameter values by minimizing the sum of squared residuals
(Which i understand as a kind of cost function ?)
And also :
The minimum of the sum of squares is found by setting the gradient to zero.
But by setting the gradient to zero, we'll just find one local minimum (or maximum), and not the global minimum, right ? Unless the function will necessarily know one global minimum for linear models ?
How do the algorithms using the method of the least squares decide which minimum they will use ?

 wooden sail
bronze basalt
Hello everyone, i have a question about the method of the least squares for line...
wooden sail
bronze basalt
Hello everyone, i have a question about the method of the least squares for line...
your observations are correct. the squared error, which is equivalent to euclidean distance, is a cost function. one can show that applying this cost function to a linear model results in a function that is convex over the parameters. convexity guarantees that all local minimizers are also global, i.e. they are all equally good. it also guarantees you can find them via gradient descent. in special cases, the model matrix has a full column rank, which implies that the function is strictly convex and there is a single global minimizer. if this is the case, then linear least squares will find that unique solution. if it is NOT strictly convex, then linear least squares finds the solution with the smallest 2 norm.
you can use eigenvalue decompositions or singular value decompositions, along with some matrix calculus, the definition of (strict) convexity, and taylor's theorem to show all these properties
bronze basalt
Thank you so much Edd! It's much clearer now!
wooden sail
i provide a handwavy proof of the relationship between convexity and the hessian of a function in this pdf, and then show when it is that linear least squares problems have a unique solution
bronze basalt
Ah great, thanks again !
 tiny wadi
Hey, If I have a game simulation in c++ that I would like to train a rl model on, should I create python library, use it in python, or i should use tensorflow in cpp directly? Or I should maybe store millions of games and later train the model in python? What is the correct approach-what do the big companies like openai/deepmind do?
 long zephyr
Anyone knows how can I assign a point to multiple clusters?
I am trying to find vanishing points in an image and it looks something like this

The problem is some of the green points should also belong to the blue cluster
Top left
 latent tundra
Hey there. I'm searching for an idea/ dataset to practice my data science skills. My last project was image segmentation on google maps like photos to detect solar panels (to give context on my skills). I've searched kaggle for datasets but I find them either boring, they have been done a million times, or the datasets are bad/small
hasty mountain
latent tundra
Hey there. I'm searching for an idea/ dataset to practice my data science skills...
There's the MedMNIST dataset, which uses microscopic cell images and some imaging exams
Or you could try and create your own dataset
Guys, about GANs...
How do I get rid of those damn 9 squares that appear in the image?

Are they an indicator that my network is having trouble somehow? Or does it just need more training time?
(It's at the beginning of its training, yes, but I had some problems with good images being formed with those squares)
 blissful dock
In a neural network do more hidden layers = better?
hasty mountain
blissful dock
In a neural network do more hidden layers = better?
Not necessarily. You might get an overfit model if you use too many layers for a simple problem
blissful dock
hasty mountain
Not necessarily. You might get an overfit model if you use too many layers for a...
So to figure out how many hidden layers I should use, just trial and error?
hasty mountain
blissful dock
So to figure out how many hidden layers I should use, just trial and error?
Kinda
You might be able to use logic to determine more or less how many layers you want, and use some consolidated models for that.
For example, if you want to classify an image, there's VGG19, which uses a certain number os conv2D layers followed by MaxPool2x2, this for 256x256x3 images. If you want to classify images that are grayscales and size 100x100, you can use the same pattern but fewer layers.
I'm right now trying to make a GAN based on SRGAN, but instead of using it for SuperResolution, I'm trying to simply generate images. But the layers pattern is close to what SRGAN uses.
hasty mountain
hasty mountain
Guys, about GANs...
*How do I get rid of those damn 9 squares that appear in th...
Decreasing learning rate and let the model train more

 keen root
I can't seem to understand what is wrong with this code:
model=NN(masks,
        dx_cam,
        dy_cam,
        10, 10,
        x_cam_period,
        y_cam_period,
        x0, y0,
        saturation=False,
        Isat=None)

print(model)

optimizer = torch.optim.Adam(model.parameters(), lr=1)

x,y=speckle_dataset[0]
out=model.forward(x.unsqueeze(0))

loss_fn=nn.CrossEntropyLoss()
loss=loss_fn(out, y)
loss.backward()
optimizer.step()
optimizer.zero_grad()

# model.zero_grad()
out=model.forward(x.unsqueeze(0))
loss=loss_fn(out, y)
loss.backward()
It throws an error in the second backward pass:
RuntimeError: Trying to backward through the graph a second time (or directly access saved tensors after they have already been freed). Saved intermediate values of the graph are freed when you call .backward() or autograd.grad(). Specify retain_graph=True if you need to backward through the graph a second time or if you need to access saved tensors after calling backward.
Can someone give me a hand
This says that I'm calling backward pass on the graph a second time even though it has been freed. Indeed, calling loss.backward() frees the graph. optimizer.step() updates the gradients and optimizer.zero_grad() zeros the gradients. Then out=model.forward(x.unsqueeze(0)) should initiate the graph again and thus I was not expecting an error in the second backward pass
what is wrong here?
hasty mountain
You're using .backward() two times
On the first time you've used .backward(), it frees the gradients that have been computed through the forward pass. Thus, there can be no backpropagation during the second .backward() call
keen root
hasty mountain
On the first time you've used `.backward()`, it frees the gradients that have be...
yeah, but then I call the forward pass again
shouldn't that reset the graph?
Plus, this is essentially the same approach as almost every tutorial I've seen in pytorch (https://machinelearningmastery.com/pytorch-tutorial-develop-deep-learning-models/)

While he does a for loop I just do 2 steps
This really is breaking me
hasty mountain
Hm...indeed... Maybe it's considering the grads from x.unsqueeze(0) again? Which I guess shouldn't be the case?
hasty mountain
mild dirge
Instead of forward
I think model.forward() would be quite the same thing, wouldn't it?
keen root
yeah, it's the same
mild dirge
I think calling the model might call the forward method, but when doing .forward() it might not create the graph
keen root
hasty mountain
Hm...indeed... Maybe it's considering the grads from `x.unsqueeze(0)` again? Whi...
I changes x to another sample of the dataset and the error still shows
mild dirge
But yeah not sure
keen root
mild dirge
I think calling the model might call the forward method, but when doing .forward...
just tested it. Error still shows
No idea if this helps, but the graph is like this:

(rendered with torchviz)
It's unreadable...damn it... would it help though?
mild dirge
Nah I can read it, opened the link
From what I read it seems that the graph is basically extended, like you need the output of the first for the gradient of the second epoch or something
Some solutions are thus keeping the graph with a param loss.backward(retain_graph=True)
Or "detaching" the "hidden state" in between batches (not really sure what that all means)
keen root
mild dirge
From what I read it seems that the graph is basically extended, like you need th...
You got that from the graph I sent? Can you teach me to read it? I just use it to see if it is not broken
mild dirge
No not from that graph, from the error alone
Same problem, first batch works, second gets the error
I am probably as stumped as you are on this problem, but if I were you I would try maybe loading the dataset again before the second epoch, check if that gives the same error. maybe it is because you use the same tensor twice.
model=NN(masks,
        dx_cam,
        dy_cam,
        10, 10,
        x_cam_period,
        y_cam_period,
        x0, y0,
        saturation=False,
        Isat=None)

print(model)

optimizer = torch.optim.Adam(model.parameters(), lr=1)

x,y=speckle_dataset[0]
out=model.forward(x.unsqueeze(0))

loss_fn=nn.CrossEntropyLoss()
loss=loss_fn(out, y)
loss.backward()
optimizer.step()
optimizer.zero_grad()

# model.zero_grad()
x,y=speckle_dataset[0]
out=model.forward(x.unsqueeze(0))
loss=loss_fn(out, y)
loss.backward()
So like this
keen root
yeah, I tried that
like this:
model=NN(masks,
        dx_cam,
        dy_cam,
        10, 10,
        x_cam_period,
        y_cam_period,
        x0, y0,
        saturation=False,
        Isat=None)

print(model)

optimizer = torch.optim.Adam(model.parameters(), lr=1)

x,y=speckle_dataset[0]
out=model(x.unsqueeze(0))

loss_fn=nn.CrossEntropyLoss()
loss=loss_fn(out, y)
loss.backward()
optimizer.step()
optimizer.zero_grad()

# model.zero_grad()
x,y=speckle_dataset[1]
out=model(x.unsqueeze(0))
loss=loss_fn(out, y)
loss.backward()
The layers in my NN are customized. The error could be inside. Any idea what could cause this within the layers?
mild dirge
Maybe some kind of dependence on previous state or something, you could try this second suggestion of detaching hidden state in between batches
keen root
yeah, but I have no idea what the "hidden state" they refer to is
mild dirge
hidden layers I assume
keen root
I assume that has something to do with recurrent nn
mild dirge

PyTorch Forums
I was going through the pytorch official example - “word_language_model” and found the following line of code in the train() function. # Starting each batch, we detach the hidden state from how it was previously produced. # If we didn't, the model would try backpropagating all the way to start of the dataset. hidden = repackage_hidden(hidden) ...
This seems relevant
I haven't used lstm in pytorch before, maybe its normal to detach hidden states between batches for recurrent neural networks
keen root
I'm still reading that last link, but mine is just a simple feed forward NN. The layers simply take a weird form, but there's no recurrence
mild dirge
Well I'm not sure. Maybe someone else knows more about this topic. just as a small note, a learning rate of 1.0 is normally pretty high for adam, you might want to try something lower when it works.
 crude galleon
My friends, where should I ask my questions?
 hollow citrus
I think you can ask questions here, regarding data science and AI
serene scaffold
crude galleon
My friends, where should I ask my questions?
this is for data science/ai questions. there's also #1035199133436354600
 signal robin
how to get weights of a model after using ridge from sklearn.linear_model
odd meteor
signal robin
how to get weights of a model after using ridge from sklearn.linear_model
To get the coefficients of your trained regression model you use the attribute coef_ on the object
So model.coef_ returns the coefficients of your model (weights in ML lingo) while model.intercept_ returns the intercept of your model (bias in ML lingo)
signal robin
odd meteor
To get the coefficients of your trained regression model you use the attribute ...
thenkuuu will check
 prime knot
Question: Can I train a tensorflow keras AI with variable length input?
basically a variable length binary blob
wooden sail
you need to think of a clever way to parameterize it regardless of length
 terse oracle
lets say I have a RNN that classifies positive and negative sentiment in a sentence,
in addition to the classification output, can I get a quote of the sentence that caused this classification?
lapis sequoia
Hello, do face recognition algorithms already do face detection? Should I use another algorithm to detect faces?
I need to detect and recognize faces in my project
mild dirge
terse oracle
lets say I have a RNN that classifies positive and negative sentiment in a sente...
I think you would need something like "attention" to be able to see what part of the sentence played a large role
mild dirge
lapis sequoia
Hello, do face recognition algorithms already do face detection? Should I use an...
There are already libraries that do that in python yes
What do you mean with detect though? Just a True or False on whether or not there is a face
Or also including location?
terse oracle
mild dirge
I think you would need something like "attention" to be able to see what part of...
can that be added to RNN? or would I need to do something different
lapis sequoia
mild dirge
What do you mean with detect though? Just a True or False on whether or not ther...
Just True or False
serene plume
Is there a server command for timing code? I'm trying to see which one of these is faster
edges_1 = list((int(from_), int(to_)) for from_, to_ in zip(*matrix.nonzero()))
edges_2 = list((int(from_), int(to_)) for from_, to_ in np.transpose(matrix.nonzero()))
Welp, got my answer

I suppose it makes sense, since the first uses built-ins rather than a library call, but I was hoping for numpy simd magic
 vivid sundial
Hey everyone, I'm getting started in Computer Science at the University of Florida... I've learned Python and I'm currently interested in specializing towards Deep Learning and Artificial Intelligence... I havent taken data structures or data science courses yet, but I'd like some advice regarding what extra-curricular paths I should take to secure an internship next year. I'm preferably looking to intern at a startup since it would be more hands on and any advice is greatly appreciated
serene scaffold
vivid sundial
Hey everyone, I'm getting started in Computer Science at the University of Flori...
you mention not having taken algos and data structs. is that a prereq for any AI-related courses that your university offers? Because the best way to make yourself stand out for an AI internship is to do well in AI courses.
I also wouldn't count on being able to find an internship with a startup (and I don't think a startup internship would necessarily be more hands-on anyway). It only makes sense to have an intern when you can afford extra staff, and you have work that a junior person can do, but which isn't absolutely necessary. I can't imagine that startups find themselves in that scenario all that often.
fwiw, I work for an AI company that definitely is not a startup, and which hires interns, and they have things to do. (and a few from this summer's cohort were given the option to stay on part-time.)
serene scaffold
showing up to like, irl stuff? wtf.
vivid sundial
Yeah I joined the machine intelligence research lab, its not really a club, more of a research credit course
serene scaffold
vivid sundial
Yeah I joined the machine intelligence research lab, its not really a club, more...
is there some tangible result of your participation there? like a github repo? have you done a poster presentation?
odd meteor
Or sited as one of the contributors to a published research paper
vivid sundial
I wasnt able to contribute much since I had no knowledge of the language our software team was using (python), so I essentially observed and learned what they were doing (aka i basically helped with nothing) but I have a really deep grasp of Python now (since I took the class and started practicing my leetcode) and I figured I would try to find a similar situation with an unpaid internship that could accelerate my knowledge in deep learning using Python because my school doesn't have a club for my interests
I'll definitely have work to contribute next semester though, so I guess I'll wait till I can get that on my resume till I start looking for internships
odd meteor
vivid sundial
I'll definitely have work to contribute next semester though, so I guess I'll wa...
No please. Don't wait till you contribute to a research before sending that internship application. So long as you have a couple of unique personal end-to-end ML projects you can talk about in your interview as one of the projects you really enjoyed working on / struggled with to build, you're good to go.
vivid sundial
I'm learning Tensorflow and some little stuff about Numpy, Pickle, JSON to build a Syntactic NLP in Python rn
I was gonna use that as a crutch even though I know its very basic
odd meteor
vivid sundial
I'll definitely have work to contribute next semester though, so I guess I'll wa...
Do you like Computer Vision? if yes, perhaps you can think of building a project where people get recommended a cloth to wear for an event given the model has some information about the said event. LOL I don't know ... just build something fun that you can literally talk about with so much passion and joy when asked by your interviewer to talk about something you've built.
You'll definitely get an extra points if you deployed the model and your interviewer can play around with it.
vivid sundial
Thats a good idea
 soft badge
Guys, I have a question to calculate a multiple linear regression, can someone help me?
vivid sundial
I just learned my first language, but nothing else really seems interesting except for AI... I definitely don't wanna end up a fullstack developer, I was thinking of AI specialization because of the job security
odd meteor
vivid sundial
I'm learning Tensorflow and some little stuff about Numpy, Pickle, JSON to build...
I'm wishing you the very best bro! 🙌🏾
vivid sundial
odd meteor
I'm wishing you the very best bro! 🙌🏾
thanks so much for all the advice
serene plume
What comprehension?
That's a list call
That's a comprehension?
Even without using the [] syntax?
That's just calling the list __init__ afaiu
odd meteor
soft badge
Guys, I have a question to calculate a multiple linear regression, can someone h...
Hi Leonard, I feel if you had provided more details to your question people could easily provide more useful answer your question. Tell us what you've done so far.....
Are you asked to use OLS or NN to do it? Have you started but got stuck somewhere?
Provide more context
soft badge
odd meteor
Hi Leonard, I feel if you had provided more details to your question people coul...
I have doubts about the multiple linear regression equation, do I need to calculate the intercept for each independent variable?
odd meteor
vivid sundial
I just learned my first language, but nothing else really seems interesting exce...
I started with Data Science, then at some point I tried frontend web development... I didn't really enjoy it so I returned back to ML. Well, so long as you're in tech, there's always gonna be demand for tech skill.
odd meteor
soft badge
I have doubts about the multiple linear regression equation, do I need to calcul...
You only have one intercept (bias) term in a linear model or are you referring to the slope? If yes, then your model weights / coefficients should be equal to the number of explanatory variables in your data.
soft badge
my discord is crashing all the time
serene plume
Oh I think I see the disconnect here. You call the for-expression a comprehension. To me we only talk about comprehensions when there is a [...for ... in...] syntax with the brackets
odd meteor
soft badge
my discord is crashing all the time
Try updating your Discord app if you believe it's not a problem from your local machine.
soft badge
i am using on web
i will download here
lets go
on the web were falling
for example

this is formule of regression multiple my question is B2 , B3 and B4 are the same value?
or need to calculate according to the variable?
odd meteor
soft badge
for example
Are you Italian? 😀 This language on the picture looks Italian
odd meteor
Hahahaha Pele, Roladinho. I'm watching the World Cup too.
soft badge
cool where are you from?
serene plume
%timeit list(zip(*m.nonzero()))
%timeit list(np.transpose(m.nonzero()))
7.99 ms ± 142 µs per loop (mean ± std. dev. of 7 runs, 100 loops each)
8.13 ms ± 23.1 µs per loop (mean ± std. dev. of 7 runs, 100 loops each)
Yeah they're much closer without the conversion to tuples of int 😮 But that work is my actual use case so I'm going with that
terse oracle
mild dirge
I think you would need something like "attention" to be able to see what part of...
Guys anyone knows what does he mean by “attention”?
I did some Googling and I don’t think I found what I wanted
odd meteor
soft badge
this is formule of regression multiple my question is B2 , B3 and B4 are the sam...
They're not same value.
soft badge
odd meteor
They're not same value.
the intercept is the same value for all right?
mild dirge
terse oracle
Guys anyone knows what does he mean by “attention”?
I did some Googling and I do...
I'm not even sure if it is super relevant tbh, but it is something used in neural networks to train "where the model looks" at each point of the process
odd meteor
soft badge
cool where are you from?
Nigeria. Since we didn't make it to the world cup, I'm supporting Ghana and Morocco
serene plume
For transforming tuples of np.int64 to tuples of python int? Doubt it
soft badge
odd meteor
Nigeria. Since we didn't make it to the world cup, I'm supporting Ghana and Moro...
cool, i admire your people always happy
terse oracle
mild dirge
I'm not even sure if it is super relevant tbh, but it is something used in neura...
Yes but what I want in addition to the classification output, is a quote of the sentence that caused this classification, is it possible?
odd meteor
soft badge
the intercept is the same value for all right?
The intercept is just B1 the rest ( from B2 to B4) are the slope. Your model will figure out the value of the Weights (B2, B3, B4) and Bias (B1) by fitting a regression line on your data. U on the other hand is just the white noise / error term.
odd meteor
soft badge
thanks so much
You're welcome.
soft badge
because i was studying but the content don't explain what happened on formula
do you recommend any material, course or books, easy to understand?
hasty mountain
Diffusion Models don't tend to use epochs to measure the number of iterations, right? At least I don't see this word that often in the codes and articles I'm seeing...
Is it because a single "epoch"(complete forward diffusion and complete reverse diffusion) takes so much time that it's better to simply use iterations rather than epochs?
(I'm trying to make a "diffusion" sketch here and, though I'm using Google Colab, it's taking quite a while to complete a single epoch with batch=64)
odd meteor
soft badge
do you recommend any material, course or books, easy to understand?
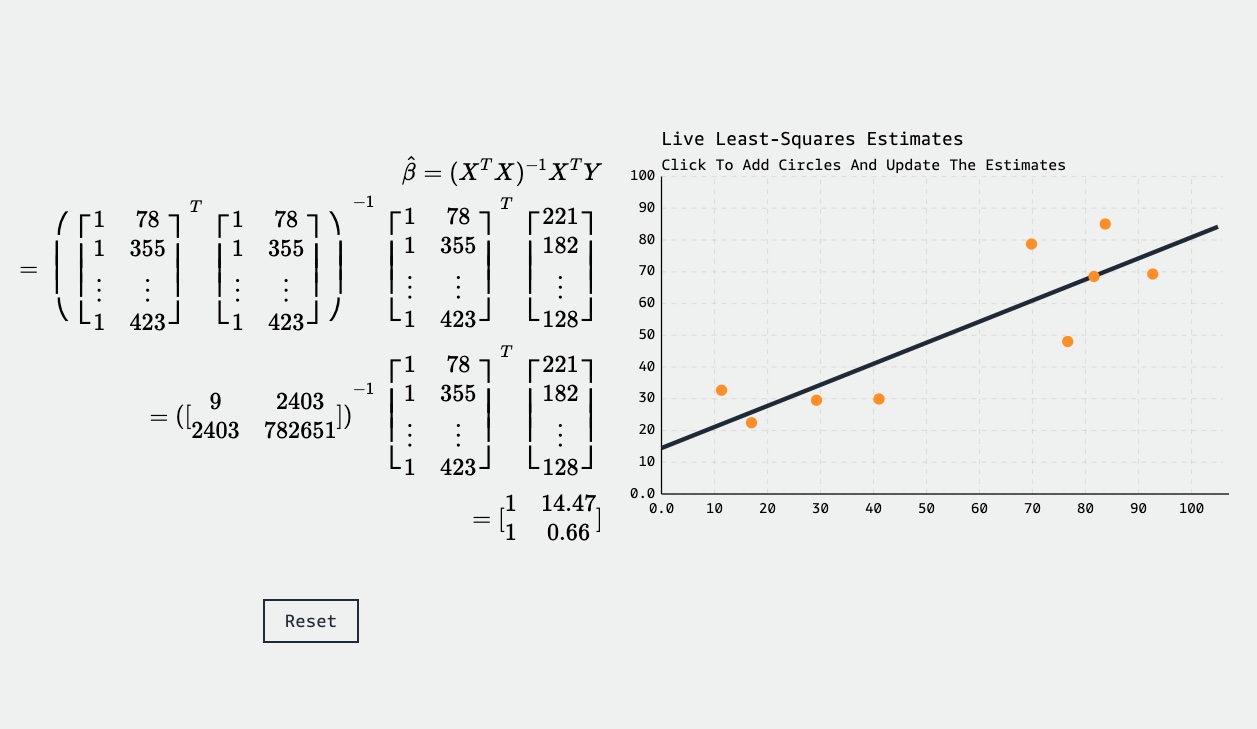
MLU-Explain
A visual, interactive explanation of linear regression for machine learning.
The math part is also not so complicated. So long you're good with Liner Algebra you'll understand it. Use this for refresher http://matrixmultiplication.xyz/
An interactive matrix multiplication calculator for educational purposes
soft badge
odd meteor
Enjoy! https://mlu-explain.github.io/linear-regression/
thanks so much my friend
 rich finch
We have a csv file meant to represent a bunch of information from various amazon products. the different sellers are saved in.... I have no clear idea of what this is; a dict of lists of dicts?
"{""seller""=>[{""Seller_name_1""=>""Amazon.co.uk"", ""Seller_price_1""=>""£3.42""}, {""Seller_name_2""=>""**stop-&-shop-uk**"", ""Seller_price_2""=>""£0.19""}, {""Seller_name_3""=>""World Wide Shopping Mall Ltd"", ""Seller_price_3""=>""£9.99""}, {""Seller_name_4""=>""MyHobbyStore Retail"", ""Seller_price_4""=>""£8.00""}, {""Seller_name_5""=>""francejouet"", ""Seller_price_5""=>""£37.62""}]}"
what I need to do is to count how many sellers there are.
a single seller appears with their name and their price of the item, Besides that I am unsure as to how to do what I want to do
How the seller thing looks like:
{""Seller_name_1""=>""Amazon.co.uk"", ""Seller_price_1""=>""£3.42""}
is this what people call a nested dictionary?
is it necesary to clean however? after all I just need to know how many of... these
{""Seller_name_1""=>""Amazon.co.uk"", ""Seller_price_1""=>""£3.42""} there are
like str.split and stuff?
arctic wedgeBOT
@charred egret :white_check_mark: Your 3.11 eval job has completed with return code 0.
[{'Seller_name_1': 'Amazon.co.uk', 'Seller_price_1': '£3.42'}, {'Seller_name_2': '**stop-&-shop-uk**', 'Seller_price_2': '£0.19'}, {'Seller_name_3': 'World Wide Shopping Mall Ltd', 'Seller_price_3': '£9.99'}, {'Seller_name_4': 'MyHobbyStore Retail', 'Seller_price_4': '£8.00'}, {'Seller_name_5': 'francejouet', 'Seller_price_5': '£37.62'}]
what did you do???
still new to the whole code formats within discord
oh okok
I meant more like why it looked blue but thank you
rich finch
arctic wedge
<@303873532863971330> :white_check_mark: Your 3.11 eval job has completed with r...
... I have a feeling len might work
well, now at the very least.
going to clean my colu- a
let me just go scream into a pillow
thank you. can this be done without json? not how; i think I know how, but mainly want to know it's possible
since I have no idea how json works
thank you
 misty flint
going viral over LI atm https://ryxcommar.com/2022/11/27/goodbye-data-science/

This is more of a personal post than something intended to be profound. If you are looking for a point, you will not find one here. Frankly I am not even sure who the target audience is for this (p…
more relevant to data scientists at an average company
wooden sail
what is LI
 hoary wigeon
Hi @ everyone, I'm using kmodes to create cluster on categorical datapoints. Finding the optimum number of cluster with elbow method approach is manual. I want to automate the task where the n_clusters can be calculated automatically.
 tacit basin
wooden sail
what is LI
tacit basin
wooden sail
what is LI
LinkedIn probably
hoary wigeon
Hey @mighty patio , I need more help on kmodes, if you don't mind.
while testing for 2-40 iteration, i get 37 as best k,
while testing for 30 - 70 i get 64 as best k,
max cost changes so affects the best k
lapis sequoia
what's this

 untold bloom
at least one of those (pf, pf1) has non-unique columns
 jaunty storm
yea
lapis sequoia
soo am building a logistic regression model
ah i am applying feature scaling on it
but i want to apply it on some features not on categorical data
i cnt manage the indexes
cn u help with that?
lapis sequoia
ahn
okie okie
cn u send it in pvt i have a classs
i gotta go
or tag me and send it here
ill take a loooook
tysmmmmmmmmmmmmmmmmmmmmmmmmmmm
mighty patio
hoary wigeon
Hey <@228565229913505793> , I need more help on kmodes, if you don't mind.
The max cost will always be at k == 2, so instead of using the max cost in the range, you could use the cost at k==2.
jaunty storm
with open('world', 'w') as worldfile:
world = worldfile.write('hello world')
print(world)
@lapis sequoia
jaunty storm
yw
jaunty storm
tbh I have zero idea what a logisitc blah blah is
lapis sequoia
Its fine
jaunty storm
teach me
lapis sequoia
Its Machine learning
jaunty storm
yo trygvard how hard is it to type of your keyboard, either your keyboards too big or you have hands bigger than shaq's
you typed one sentence in like 10 minutes
you okay?
mighty patio
@jaunty storm this is not an off topic channel, if you have nothing to contribute please go to one of the off topic channels
jaunty storm
mighty patio
<@501240151939350558> this is not an off topic channel, if you have nothing to c...
I was just checkin on a homie
mighty patio
<@&831776746206265384>
lapis sequoia
Hi all! I use multiIndex for my dataset to pivot, but seems not working when i try to do some predict, who can help me around pandas pivot with multi index in my case?
I use 2 columns as multi index (one date & one libelle). For training dataset, seems okay, but when i prepare my datas for predict, my pivot have strange comportement (he use old values from Multiindexes and not new ones)
no one already encounter that kind of issue?
 indigo cove
Hello? Does anyone know how I can plot such values easily in Python?

So every row needs to be plotted where the cell value is the y-axis value and the column-entry is the x-axis value
lapis sequoia
indigo cove
Hello? Does anyone know how I can plot such values easily in Python?
Maybe with mitosheet? depends if you need to view/understand values, maybe could be enought?
elder bloom
Hello Everyone I just finished my new notebook on Heart Disease prediction Exploratory Data analysis.. Do check it out if you have time- https://www.kaggle.com/code/sandipan001/heart-failure-eda-using-plotly
And pls do upvote if you like the notebook
Explore and run machine learning code with Kaggle Notebooks | Using data from Heart Failure Prediction Dataset
mild dirge
indigo cove
Hello? Does anyone know how I can plot such values easily in Python?
You can load in a csv into a pandas dataframe and then plot it. But I doubt that plot will visualize the relevant information, it looks quite chaotic 😛
lapis sequoia
alo
anyone here
hi
ayo
uk anything about ml?
have a question
where can we use model of its creation
how can we what is the best algorithm for dataset
after its creation
bro u a bit or wht
bot
how does standardscaler works
what is me
lazyweeb
give answer to my question nd ill tell u a gud anime
no need
let's talk normal
okie
i am good at coding i have done many projects for example automation login page
so u knw nothing about ml?
but i have issue with math
i know
its important
math
rightnow i am class 11
if u wanna be an average programmer then u cn do it without math
but if u wanna be great
hmmm
u have to do maths
what level are you math?
yeah i asked same question to someone once
tier?
lapis sequoia
lapis sequoia
what level are you math?
guess what
m also bad in itb
Silver
but m in uni
hooo
ow
Dimiond
m not baddd
i just stopped doing it
then now i again started
where u from
idk
bruh
okie cool
where did u learned python from

giga chad
bros a pro
nah python was easy
it took me millsecond to learn it
lol
what projects hve u made

do u knw oop?
in python
ye but that for kids
oop?
bruh
m also 18 though
some bot have say i can't post image
that's bad
yeah
19 hehe
so whats ur level in ml
i will say God tier
lapis sequoia
lapis sequoia
19 hehe
but am in uni nd u r in 11
bwahahaha
we started late schoool
lapis sequoia
lapis sequoia
i will say God tier
whats difference between minmax scaker and standardscaler
lapis sequoia
lapis sequoia
we started late schoool
u got two people in one body?
nah
how do u calculate
standardscaler
my finger
with finger
u on github
do u post projects there
ye
i wanna see ur projects
i have one project wanan see it
sure
wht is it though
you will have to wait i window user
me too
window
1
arctic wedgeBOT
Hey @lapis sequoia!
It looks like you tried to attach file type(s) that we do not allow (.ipynb). We currently allow the following file types: .gif, .jpg, .jpeg, .mov, .mp4, .mpg, .png, .mp3, .wav, .ogg, .webm, .webp, .flac, .m4a, .csv, .json.
Feel free to ask in #community-meta if you think this is a mistake.
lapis sequoia
arctic wedge
Hey <@456226577798135808>!
LOL
i will send in private w9
okieeeeeeeeeeee
w8
i hope it doesnt have virus
dont try to be clever okie
we frands
no
i swear on my mom
it is no virus
 neon garden
I can't fix stringVar() error "not defined"
 steady basalt
what has this chat develolved into
 versed gulch
does anyone know how to remove the small noisy segments from this image? seems pythons connected components joins some of these disconnected components as 1 component

 devout sail
versed gulch
does anyone know how to remove the small noisy segments from this image? seems p...
devout sail
versed gulch
does anyone know how to remove the small noisy segments from this image? seems p...
Can you clarify what you mean by "joins"? Connected components just finds connected regions, they would be already joined
mild dirge
versed gulch
does anyone know how to remove the small noisy segments from this image? seems p...
You could maybe check every pixel on how many white neighbors it has, and if it is less than x you make it black
Which is similar to something called "erosion" but I think that would remove a bit too much since they are very thin lines
versed gulch
devout sail
Can you clarify what you mean by "joins"? Connected components just finds connec...
so the isolated pixels have other black pixels as part of its connected group
# p_skel is a skeletonized image
num_labels, labels = cv2.connectedComponents(p_skel)
clusters = []

for label in np.unique(labels).tolist()[1:]: # exluding background label 0 so idx with 1 to end
  xs, ys = np.where(labels == label)[0].tolist(), np.where(labels == label)[1].tolist()
  cluster_pts = list(zip(xs, ys))
  clusters.append(cluster_pts)
never mind I solved it
thanks for your input
devout sail
Ok. fwiw you can do something called regionprops to get the size of each connected component
keen root
mild dirge
https://discuss.pytorch.org/t/solved-why-we-need-to-detach-variable-which-contai...
I found where the error is! But I have no idea why it happens. So here's what's causing me trouble:
self.params=torch.Parameters(torch.tensor(Ny,Nx))
self.expanded_params=torch.kron(self.params, torch.ones(My, Mx))
It is this sort of expansion of the params that is causing problems. No idea why. Any thoughts?
(Sorry for the ping, if you're out of patience, just ignore this XD)
mild dirge
I wouldn't know, never used those methods I don't think
keen root
mild dirge
I wouldn't know, never used those methods I don't think
hmm, what if put it like this:
expanded_params=torch.zeros(Ny*My, Nx*xMx)

        for i in range(Ny):
            for j in range(Nx):
                expanded_mask[i*My:(i+1)*My,
                              j*Mx:(j+1)*Mx]=self.params[i,j]
does exactly the same thing, and reproduces the error
 hushed kraken
what's the best way to save my trained neural netwerk with its weights?
serene scaffold
hushed kraken
what's the best way to save my trained neural netwerk with its weights?
what library did you use to make the network?
hushed kraken
keras
serene scaffold
hushed kraken
keras

TensorFlow
hushed kraken
thnx man
 floral hollow
Does anyone know why i get this error when importing tensorflow
tensorflow.python.framework.errors_impl.NotFoundError: D:\real_Python\projects\test\lib\site-packages\tensorflow-plugins\tfdml_plugin.dll not found Image
hushed kraken
your image is probably in the wrong fileplace
bronze basalt
Hello guys, i have a quick beginner question (sorry for the other people who need help, i have no idea how to help you).
Basically, i have a Decision Tree model for regression, and i noticed that it's inconsistent : each time i build it, it gives different results.
Thus i plan on going with Random Forest. Is there any specific mathematical metric that i can use to quantify the "inconsistency" of the tree ?
agile cobalt
bronze basalt
Hello guys, i have a quick beginner question (sorry for the other people who nee...
show the code you're using to create the model rn
also... you are not happy about the current model being "inconsistent", thus you decided to pick a model that literally has "random" in the name?
hushed kraken
for saving my model. I work in jupyter notebook, but if I copy the adress from my windows explorer it gives me an error, why?

nmv im dumb
hasty mountain
agile cobalt
also... you are not happy about the current model being "inconsistent", thus you...
If I remember correctly, Random Forest is a bunch of Decision Trees, where the one with best performance is selected to be the main tree...
I think the name for this is ensemble model...
(Been a while since I don't make contact with those "fundamental" machine learning algorithms)
 young ridge
I have a question regarding Feature Engineering for machine learning.
If I were to create a new column using multiple existing columns in the dataset, should I be dropping those multiple columns before I run the new dataframe through the machine learning model? Technically if I still include the columns used to derived the new column it would introduce noise in our dataset.
Could someone help me with this answer because I'm relatively new in machine learning
hasty mountain
bronze basalt
Hello guys, i have a quick beginner question (sorry for the other people who nee...
I think it uses different values for initialization. Try using a fixed value for a random seed
mild dirge
young ridge
I have a question regarding Feature Engineering for machine learning.
If I were...
If you think the new information is the only relevant information from the old columns for your model then you could drop the old columns I would say
hasty mountain
Sklearn models has seeds for random number generator. If you use the same seed, I think you'll get the same values when initializing a model, thus, will get the same results
mild dirge
If there is additional information to be gained from the old columns then I would keep them. That just means you have extracted some useful information manually and put it in a new column.
bronze basalt
In Random Forest, a bunch of trees are trained and the decisions are made with a vote among all trees, which makes it way less sensitive to overfitting!
I used fixed seed and noticed indeed that the tree is consistent  actually it was the algorithm that i put above that is inconsistent and also a weird problem on my dataset that i'm currently trying to solve
 young granite
is there something like pandas.value_counts for rows and cols combined?
 kind summit
young granite
kind summit
young granite
currently im trying to create boolean:
   index  col1  col2  col3  col4  col5
0      1     0     0     0     0     0
1      2     0     0     0     0     0
2      3     0     0    10     0     0
3      4     0    50     0     0     0
4      5     0     0     0     0     0
   index   col1   col2   col3   col4   col5
0   True  False  False  False  False  False
1   True  False  False  False  False  False
2   True  False  False   True  False  False
3   True  False   True  False  False  False
4   True  False  False  False  False  False
and search for rows in which same cols are defined as True any tips?
desert bear
Hey, regularised logistic regression question here. How do you modify logistic regression with an non-convex regularizer?
floral hollow
Does anyone know why i get this error when importing tensorflow?
tensorflow.python.framework.errors_impl.NotFoundError: D:\real_Python\projects\test\lib\site-packages\tensorflow-plugins\tfdml_plugin.dll not found Image
the entire code is import tensorflow as tf
signal robin
Do we evaluate the loss function of our model on the training data or test data
wooden sail
both
on the training data to compute gradients and evaluate how the training is going, and on the test data to validate
untold bloom
don't validate on the test set
and sometimes the metrics used between train, validation & test sets could be different
 pure sable
bronze basalt
Hello guys, i have a quick beginner question (sorry for the other people who nee...
pure sable
bronze basalt
Hello guys, i have a quick beginner question (sorry for the other people who nee...
While running the Decision tree did you add random_state has a parameter? If not then you should assign some value to this parameter and hence if u run the Decision model multiple times it will give the same result
 copper trout
im sorry guys to bother your conversations, im on GTX 1650 super right now can i do machine learning and deep learning on GTX 1650 super? or is it very necessary to buy RTX 4090 to do such tasks?
hasty mountain
copper trout
im sorry guys to bother your conversations, im on GTX 1650 super right now can i...
If you're not going to copy a paper where the guys make models with 10 neural networks attached, each one with 200 layers, you can do it just fine
In fact, I used a 2007 notebook to make a neural network from scratch in numpy and it worked out quite fine
copper trout
hasty mountain
In fact, I used a 2007 notebook to make a neural network from scratch in numpy a...
are you for real brother? you make my optimism fly high right now
hasty mountain
copper trout
are you for real brother? you make my optimism fly high right now
The only thing that will really change is how much data you'll be able to process at once.
You might not be able to use a neural network with 200 layers, for example.
Or might not be able to use a batch size of 1024.
So, the training time might be longer, or you might have to use a model with a lower performance
copper trout
so in conclusion, for not so complex machine learning and deep learning, we can use any hardware?
copper trout
hasty mountain
The only thing that will really change is how much data you'll be able to proces...
im new in data science, would u explain what is neural network with 200 layers and batch size of 1024?
mild dirge
200 layers means that it is a very deep (and thus maybe big) network.
Batch size of 1024 means you show it 1024 examples at a time
hasty mountain
Batch is how much data you'll be dealing in a single iteraction.
If you use a batch size of 1024, you're dealing with 1024 inputs at once
For that neural network I made in that old notebook, I had to use around 6, 7 Dense/Fully Connected/Linear layers, which are simply matrix multiplications. And I couldn't use matrices that were too big(like a matrix with 1000 rows and 10,000 columns)
copper trout
i can understand it so clear as a mercury
copper trout
mild dirge
200 layers means that it is a very deep (and thus maybe big) network.
meaning like a big data?
mild dirge
No, big model
copper trout
okay thank you for answering my questions, i hope you guys have a great success in whatever you do
mild dirge
Normally bigger models take more data though, so it is not totally unrelated
hasty mountain
Bigger models = more operations at each iteration.
copper trout
now i understand better
copper trout
can i do computer vision in GTX 1650 also or do i really need to buy RTX 4090 in order to do such task?
mild dirge
You can do certain computer vision tasks with a cpu even
But you can probably run some computer vision neural networks on your GTX 1650
hasty mountain
Does anyone know of an article/tutorial/video about diffusion models?
 upbeat dagger
Is there a popular format for writing data dictionaries?
 spice mountain
What would be the cheapest way to store hundreds of thousands of images?
upbeat dagger
What would be your total storage size?
An image can be anywhere from a few kilobytes to several megabytes.
spice mountain
upbeat dagger
What would be your total storage size?
Actually just calculated it to be a little under 10 gb, so I will jsut create a Google drive 🤦♂️ 😆
upbeat dagger
Yep, hard to get cheaper than free
spice mountain
upbeat dagger
Yep, hard to get cheaper than free
Amen.
 thorn zephyr
upbeat dagger
Is there a popular format for writing data dictionaries?
thorn zephyr
upbeat dagger
Is there a popular format for writing data dictionaries?
pickle? If you use within Python.
upbeat dagger
I meant data dictionary as in the document for describing what each column represents.
 soft badge
have 2 way of find intercept and angular on linear regression?
 still bane
boys someone good with pandas?
serene scaffold
still bane
boys someone good with pandas?
don't ask to ask
and some people here might not be men.
still bane
sorry, i found out the i could simply ask it on #1035199133436354600 and so i did
 robust jungle
I'm trying to associate an integer list of undetermined length (e.g. 1, 2, 3, 4) with a single integer as the target for the purpose of model.fit
I attempted to input a list of those integer lists and a similarly ordered list of targets as x and y variables respectively to model.fit()
This is the error I'm getting:
ValueError: Data cardinality is ambiguous:
x sizes: 8, 8, 8
y sizes: 3
Make sure all arrays contain the same number of samples.
anyone able to help?
 silent spade
anyone know how to space out the graphs using seaborn and subplot? The titles of each graph overlaps the units on the x axis

nvm got it. plt.subplots_adjust(hspace = 0.8)
upbeat dagger
I've seen this in a few job descriptions:
Perform reverse engineering of physical data models
What does that mean?
hasty mountain
Uh... Anyone here with some knowledge on Diffusion Models?
What's the difference between I creating a neural network that receives a noised image and tries to recompose it entirely to a proper Diffusion Model?
(I hope the answer isn't simply "one won't work, the other will". I'm testing this right now)
 sweet crypt
Hi has anyoneused Jax here?
serene scaffold
sweet crypt
Hi has anyoneused Jax here?
always ask your actual question. never ask to ask.
tacit basin
hasty mountain
Uh... Anyone here with some knowledge on Diffusion Models?
What's the difference...
For example stable diffusion has many components to it. Auto encoder for encoding decoding as it works on latent representation of an image, uses Clip text to embedding, embedding to image i think. Noise part is handled by another component. Probably there are more ...
But if the simpler version with just nn would work that would be awesome. Interested to hear results of your experiment
rare socket
Is there a type of parent selection type in genetic evolution that completely replaces the genes that give a fitness of 0 or lower? What would be the name of this?
misty flint
maybe someone who is familiar with genetic algorithms can weigh in 
 worldly dawn
rare socket
Is there a type of parent selection type in genetic evolution that completely re...
worldly dawn
rare socket
Is there a type of parent selection type in genetic evolution that completely re...
A selection operator wouldn't replace anything. It would just select individuals
 covert saddle
Hi
Can anyone help me I am having issues with feature selection for my predictive model, I am a non-coder and was tasked with an assignment for a class
My model is very inaccurate, I hope to increase the accuracy
 abstract saddle
why this error is coming

 pliant jetty
AAA
hasty mountain
tacit basin
For example stable diffusion has many components to it. Auto encoder for encodin...
Oh, OpenAI's models are always full of crazy things. But I was hoping to learn the basic first, as I have no idea about Diffusion Models yet(and right now I'm a bit too lazy to study it deeply...the math seem to be complicated)
keen root
After some trouble I found the mistake that had been bothering me the last 2 days! I just now need to understand this further:
I have a variable a which is a parameter of a neural net. This parameter is initialized within a layer layer1 in the __init__ function. In it I also define b such that b[c1:c2, c3:c4]=a. (c1,c2,c3,c4 are some integers) When I do the backwards update with the optimizer, a gets updated, but b does not! How can I force b to be updated by the optimizer?
(A workaround this is to redefine b in the layer1.forward() method, but I wanted to avoid this
 silent stump
Hi guys when performing linear regression with statsmodels why do we need to add a constant (x = sm.add_constant(x1), x1 being the SAT scores, and y being GPA scores, to add a bit of context)? I get that its there to account for a bias, but what is meant by that?
 fossil ivy
hey everyone, I have a question if anyone could help me I would appreciate it. It isn't methodological as such, but I do not know the correct words tbh...
I have created a Markov Chain model to simulate weather conditions. For this I use 29 years of hindsight time series to calculate the transition matrices
Basically, I just count how often a state i is followed by a state j, and divide that by the total number i
I use pd.crosstab for this purpose. Can I just say I created a frequency table from the historical data and normalized those into prrcentages? Or can I even just say I simply cross tabulated the data?
 fierce condor
I have a set of basketball data, with 30 features, i feel like there are clusters of features that are predictive of the team winning
these clusters of features are independent to each other
what is a good ml model to use that can model this
like a b c can predict x, and also d e f can also predict x
i feel like if i use a linear model, i would average out feature importance
i need a model that can find multiple independent predictive pattern
mild dirge
You could use an mlp with drop-out in the first layer maybe
Drop-out makes it so some of the features are dropped randomly, so that the model is forced to try and use sub-sets of features for predicting
Could also maybe make multiple models, one for each "cluster" of features, and then combine them.
odd meteor
abstract saddle
why this error is coming
What are you trying to do that resulted to this error? It appears you were trying to use a context manager to access a file in your local machine.
lapis sequoia
Hello, I am trying to create a image classification, using keras and tf, but when the any image is checked, it predicts the exact same class, every time. I have retrained the dataset, and there is no problem in the dataset, but it is predicting the same thing, when it more accurately can pick a different one
mild dirge
Is your data balanced? @lapis sequoia
lapis sequoia
mild dirge
Is your data balanced? <@456226577798135808>
what do you mean? the amount of images?
mild dirge
how imbalanced is it?
lapis sequoia
very
lapis sequoia
I dont know
i am doing rough and calm seas
rough seas had around 25 images and calm had about 100
mild dirge
And it guesses calm all the time?
lapis sequoia
yep
mild dirge
And is it 100% of the guesses, or just most?
mild dirge
Just reduce it it 25
lapis sequoia
too late...
mild dirge
That way you have 25 of each, and as many as you can possible have without augmentation
lapis sequoia
alright, it predicts it correctly now, let me go get some other images and test it
mild dirge
You should really look into some pre-processing steps for images, and augmentation
And how to deal with imbalanced classes
There are all sorts of tricks to deal with it
Throwing 75 images to only keep 25 makes it balanced, but you are throwing away useful data
lapis sequoia
I kind of just read the docs, and copied it down
mild dirge
well :/

 swift fern
Are there anyone who can help me integrating AWS SageMaker?
odd meteor
silent stump
Hi guys when performing linear regression with statsmodels why do we need to add...
Remember, the equation of a simple regression model is Y = a + bX
where:
X = the explanatory variable
Y = the response variable.
So essentially, If an intercept term (i.e a) exists in the model, the least squares estimate of the slope parameter (i.e b) will be unbiased. Omitting the constant term (i.e a) can cause severe bias in the other regression coefficients (in our case b) because it forces the regression line to start from zero point. Not only could it cause your normal regression coefficients (e.g., b) to be of a different magnitude, in extreme cases it could even take on the opposite sign (e.g., positive instead of negative).
It's also pertinent to mention that by including a constant, one degree of freedom for error will be lost, but it's a small price to pay for the protection against bias.
odd meteor
covert saddle
Can anyone help me I am having issues with feature selection for my predictive m...
You need to give us more details. The code you've written, what's the current accuracy score etc
hasty mountain
Do GANs tend to give better results if I use a Fully Connected layer as the final layer instead of a Conv2D/TranposeConv2D?
I noticed that Conv2Ds tend to generate some squares in my output image, but I also remember that FCC layers tend to get a bit meh when dealing with too much data(like if I try to make images bigger than 64x64x3)
Those squares do tend to disappear as the training progresses, but they look like just another bothering obstacle in the architecture
wooden sail
odd meteor
Remember, the equation of a simple regression model is `Y = a + bX`
where:
X = ...
i'd just point out that unbiasedness of linear least squares depends on the noise statistics. what you described there is model misspecification
dusty valve
I'm learning about q tables and RL, and I've studied the bellman equation with some examples. A while ago i recreated snake game on the terminal, and I want to make a model to play it
So, the data the agent would receive would be an 9 dimensional array
First 4 would be 1 or 0, 4 directions and if there is a wall or snake there
2nd 4 would be 1 or 0 and would e plain which quadrant the apple is in relative to the snake
Last would be the current direction
Using numpy ( maybe tensorflow or tf_agents ) how would the model make predictions based on the current state, q table and next state
I already have an agent made not the model though
austere swift
@short socket I didn't get back to your post in time before it timed out, but we can discuss that here
the pytorch dataloaders accept pytorch datasets, which can be created from numpy arrays
rare socket
I'm having problems with my genetic algorithm. If anyone wants to help I would highly appreciate it https://stackoverflow.com/questions/74632038/why-is-my-genetic-algorithm-not-improving
Stack Overflow
The fitness output is always 0 when my genetic algorithm is training. This should be normal at first but it does this for the entire duration of the training and does not improve at all. I have the
 plush jungle
how does error play into backpropagation?
cause my slides have something like this

and then you update the weights like this

but this just uses o, which is the neuron output
I don't see error used anywhere
fierce condor
suppose i knew nothing about college admission , i have this dataset for college admission, and the general data suggest, that being white/asian , high sat, high gpa was a good predictor for admission. however there are anomaly in the data such as being black, athlete, lower gpa, which is also a predictor for admission.
what ml algo would capture the general pattern, and the anomaly pattern in the dataset.
can the analysis show the grouped feature importance
plush jungle
 real kiln
How t learn AI
real kiln
How t learn AI
what application are you interested in? images? language translation? prediction? video games?
sweet crypt
whats the meaning of state in transform_with_state function in Haiku? what states are we talking about?
real kiln
plush jungle
what application are you interested in? images? language translation? predict...
text
like auto generatying etxt'
plush jungle
@real kiln if you start to understand markov chains and want to move on to something more powerful, look into neural networks and RNNs
fallen crown
Hi i need help please, it has been 2 days that i tried to show a surface plot of my cost function regarding 2 parameters thet0 and theta1 but i have always errors, please can someody help me ?
X,y = make_regression(n_samples = 100, n_features = 1, noise = 20)
y = y.reshape(100,1)
X = np.hstack((X, np.ones(X.shape)))
theta = np.random.randn(2,1)```x = np.linspace(-50, 50, 100)
y = np.linspace(-50, 50, 100)
AX, AY = np.meshgrid(x, y)
ax = plt.axes(projection = '3d')
Z = (1/(200))*sum((linear_model(X, np.array([[X], [Y]])-y)**2))
ax.plot_surface(AX, AY, Z)```is it possible to multiply two vectors of different lengths?
real kiln
!code
arctic wedgeBOT
Here's how to format Python code on Discord:
```py
print('Hello world!')
```
These are backticks, not quotes. Check this out if you can't find the backtick key.
mild dirge
plush jungle
is it possible to multiply two vectors of different lengths?
What would you expect from f.e. [1, 2, 3, 4] and [5, 6, 7] ?
plush jungle
mild dirge
What would you expect from f.e. `[1, 2, 3, 4]` and `[5, 6, 7]` ?
well see that's the problem. I actually don't know how it would work, but in the backpropagation algorithm it's supposed to happen
mild dirge
They have different lengths? Or do they have different amount of dimensions?
plush jungle
    gradient = -((y - output[i]) * output[i]* (1-output[i]) * output[i-1])
ValueError: operands could not be broadcast together with shapes (3,) (10000,) ```And is it multiplying or dot product?
Well yeah, that shows that it is not possible 😛
plush jungle
mild dirge
Well yeah, that shows that it is not possible 😛
ok but help me understand this

o is the output of the neuron, and x is the input to the neuron
mild dirge
So which part of that line gives the error then?
plush jungle
this corresponds to my line of code throwing the error
mild dirge
y and o should be the same shape
plush jungle
yes
mild dirge
So that should not give the error
plush jungle
they are, but x and o are not
wait
I think maybe I'm doing this for all the neurons as a single vector
I think I'm supposed to do it individually
mild dirge
I assume j is a associated with a single input/output pair, and i is a weight number?
plush jungle
mild dirge
I assume j is a associated with a single input/output pair, and `i` is a weight ...
the teacher said i is sample and j is neuron

so it's summing over all the samples
mild dirge
Wouldn't that make j a sample?
mild dirge
Isn't x_i^j a scalar?
plush jungle
no, it should always be a vector
the input of a single neuron is always a list of outputs of the previous neurons
mild dirge
oh, hmm yeah right
plush jungle
so in my last layer, y and o are scalars
mild dirge
Wait no, but I meant that because you are calculating the change of the error for a single weight
plush jungle
and x is a 3 vector
mild dirge
And a single weight only takes a single input
iron basalt
plush jungle
Is w here the weight vector for a single neuron?
mild dirge
It's a bit annoying, normally people make vectors bold, and scalars not
plush jungle
iron basalt
Is w here the weight vector for a single neuron?
it should be, yes
iron basalt
plush jungle
it should be, yes
Then this is a dot product between the derivative of the error (with sigmoid activation) and the input x.
plush jungle
my code is like this currently
gradient = -((y - output[i]) * output[i]* (1-output[i]) * output[i-1])```output[i-1] is the previous layer's output, i.e. x
y is the ground truth
output[i] is o
I wonder if my problem is that I'm trying to do it all at once
iron basalt
- is elementwise multiplication in numpy.
plush jungle
I have 3 hidden layer neurons with 10,000 weights
fallen crown
can somebody help me to plot the surface graph of a cost function o a linear model ith 2 parameters ?
plush jungle
so I have a [3,10000] matrix
plush jungle
iron basalt
* is elementwise multiplication in numpy.
I've tried doing np.dot() but it just gives different shape errors
plush jungle
plush jungle
my code is like this currently
```py
gradient = -((y - output[i]) * output[i]* (...
should I be calculating this for each individual neuron? right now I'm trying to do it for all the neurons at once
 strange elbow
 iron basalt
plush jungle
should I be calculating this for each individual neuron? right now I'm trying t...
iron basalt
plush jungle
should I be calculating this for each individual neuron? right now I'm trying t...

Note that doing multiple dot products is just matrix multiplication.
(There is a weight matrix for multiple neurons)
plush jungle
iron basalt
ok this is really good. walk me through some of this. consider my last layer, a single neuron with 3 weights and 1 bias, which outputs a scalar
consider updating its weights with a single training example
so my u^j is
(y - output[i]) * output[i] * (1-output[i])```where output[i] is the scalar that the neuron outputted, and y is the ground truth scalar
is that correct so far?
iron basalt
That is u, not u^j.
plush jungle
what is the j indexing over?
iron basalt
Oh wait, i'm getting a bit confused, what is j suppose to be here?
It can be multiple things without knowing your NN structure.
plush jungle
my professor made it seem like j is the sample number
so if there's only one sample
it's no longer a sum
iron basalt
So only 1 neuron i'm assuming then.
plush jungle
yes for the last layer
iron basalt
Ok, well the dot product idea still works, but let's leave that for now.
If you drop the whole sum over all the samples it becomes more obvious.
plush jungle
the problem comes when I try to multiply x^ij times u^j
I thought x is supposed to be input
iron basalt
If you drop the sum there is no j.
plush jungle
ok, so lets call it
x * u
iron basalt
u = (y - o)o(1 - o)
iron basalt
Now x is actually a vector, assuming you have more than 1 input.
w is also a vector.
plush jungle
I'm confused because the x^i implies it's looping over each neuron individually
but all the "backpropagation from scratch" tutorials I've seen just have one loop
and it's over layers
for example, this person
https://github.com/marcospgp/backpropagation-from-scratch/blob/master/backpropagation-from-scratch.ipynb
GitHub
A python notebook + a PDF with the theoretical foundations - backpropagation-from-scratch/backpropagation-from-scratch.ipynb at master · marcospgp/backpropagation-from-scratch
their backpropagation code looks like this
for i in range(len(weights) - 1, -1, -1): # Traverse layers in reverse
    ...

    if last_layer:
      ...

      weight_gradients[i] = np.matmul((a - y), a_prev.T)
      bias_gradients[i] = a - y

    else:
      ...

      weight_gradients[i] = np.matmul(x, a_prev.T)
      bias_gradients[i] = x

    ...

    # Update weights & biases based on gradient
    weights[i] -= weight_gradients[i] * learning_rate
biases[i] -= bias_gradients[i].flatten() * learning_rate```that seems to me like they're updating all 32 neurons' weights and biases at the same time rather than looping over each one individually
iron basalt
The loops are hidden from you, matmul is not free, it requires a bunch of nested loops.
hasty mountain

iron basalt
One of the neat things about linear algebra is that you can write things in a way that does not get lost in the details of the loops.
hasty mountain
Bruh...when I did my backpropagation code it seemed way more easy
iron basalt
See in your math, you are computing the partial of E with respect to w_i.
plush jungle
hasty mountain
Bruh...when I did my backpropagation code it seemed way more easy
do you happen to still have that code? all I'm trying to do is code backpropagation from scratch, so if there's a simpler way I'd like to know it
hasty mountain
plush jungle
their backpropagation code looks like this
```py
for i in range(len(weights) - 1...
Oh, now I think I got the idea...it's iterating through each layer in a list weights...I guess...
iron basalt
(A for loop with index i)
hasty mountain
A bit crazy
hasty mountain
plush jungle
do you happen to still have that code? all I'm trying to do is code backpropag...
It's a quite long file because I did everything in a one go and it's full of coments
And it's not a jupyter notebook because no
iron basalt
plush jungle
and then you update the weights like this
See how here there is w_i being updated, but there are multiple of those so there is a loop.
plush jungle
hasty mountain
https://github.com/Martyn0324/NumpyNetwork/blob/main/Unga%20Bunga.py
this is hard-coded right? if you changed the number of layers or neurons it would break?
iron basalt
However, if you had w as a vector in numpy, you can just not write any loops yourself. The loops are still happening under the hood.
hasty mountain
plush jungle
this is hard-coded right? if you changed the number of layers or neurons it wou...
Nah. But you'll have to adapt the backpropagation according to the number of layers
plush jungle
iron basalt
However, if you had w as a vector in numpy, you can just not write any loops you...
well my weights of every neuron in the layer are already a single vector, but how do I do it the linear algebra way?
np.matmul?
iron basalt
Subtraction of two vectors is a loop.
iron basalt
plush jungle
np.matmul?
Yes.
They reason it's a full matmul and not a single vector dot product is because then you can also have multiple neurons (and batches and so on).
(Doing a dot product for each)
plush jungle
iron basalt
Yes.
ok but I tried it like this
hasty mountain
plush jungle
well my weights of every neuron in the layer are already a single vector, but ho...
Oh yes...my weights in that code are matrices, not a single vector. But a vector can be seen as a 1 dimension matrix...
plush jungle
            x = output[i-1]
gradient = -np.matmul((y - output[i]) * output[i]* (1-output[i]) , x)```and it threw this error
ValueError: matmul: Input operand 1 has a mismatch in its core dimension 0, with gufunc signature (n?,k),(k,m?)->(n?,m?) (size 3 is different from 1)```x is the previous layer's output
output[i] is the current layer's output
iron basalt
Try to get a single neuron working first though.
plush jungle
ok
iron basalt
No backprop.
Since there is only 1 neuron there is only 1 vector dot product happening, so either matmul or dot (dot in numpy is also a matrix multiply depending on shapes of inputs ("matrix dot product", etc)) will work with some shape wrangling.
When you go backwards with the single neuron, you are computing each of the partials of E with respect to w_i, so you have N of those (where N is the number of inputs).
plush jungle
plush jungle
and it threw this error
```
ValueError: matmul: Input operand 1 has a mismatch i...
i'm still getting this error on both the last neuron and the hidden layer
iron basalt
No hidden layers, just a single neuron for now in a new project.
plush jungle
iron basalt
Try to get a single neuron working first though.
the single neuron works with this:
                x = output[i-1]
gradient = -((y - output[i]) * output[i]* (1-output[i]) * x)```the shapes are
y = scalar
output[i] = scalar
x = [3,]```What does you forward pass look like right now for a single neuron?
plush jungle
iron basalt
What does you forward pass look like right now for a single neuron?
I'm just looking at my last layer, which has a single neuron
it takes lenght 3 vector input from the hidden layer and outputs a scalar
iron basalt
Compute a single dE\dw_i. Not all of them, just 1. Like dE\dw_0. What would like look like in your code?
plush jungle
iron basalt
Compute a single dE\dw_i. Not all of them, just 1. Like dE\dw_0. What would like...
are you saying to make a new neural net with a single neuron?
or to just do the backpropagation step for my last neuron
iron basalt
plush jungle
are you saying to make a new neural net with a single neuron?
Yes new project. Just to get this right and we can build up to linear algebra and doing it with numpy the fast way.
plush jungle
ok
plush jungle
iron basalt
Yes new project. Just to get this right and we can build up to linear algebra an...
ok I've got this
    def backpropagate(self, x, output, y):
        gradient = -((y-output) * output * (1-output) * x)
self.neuron.weights -= self.lr * gradient```What does you forward pass look like?
*Also there is no "backpropagation" since it's just 1 layer.