#data-science-and-ml
1 messages · Page 31 of 1
 mighty patio
 pastel warren
can some one help me out with this
perform a new Esemble Learning method called "Bagging" based on Voting on 19 decision tree classifiers
 feral cave
mighty patio
from https://stackoverflow.com/questions/1393324/given-a-url-to-a-text-file-what...
feral cave
mighty patio
from https://stackoverflow.com/questions/1393324/given-a-url-to-a-text-file-what...
got it, thanks!
cheers, I made it to separate the name with subjects, but how to split those subjects' column is still tricky for me🤦
 alpine spruce
feral cave
cheers, I made it to separate the name with subjects, but how to split those sub...
alpine spruce
feral cave
cheers, I made it to separate the name with subjects, but how to split those sub...
if you want, you can share a part of the csv with me, only 2 rows is enough. after that i can write the code and send it back to u
 steady crypt
.

 boreal gale
 mint palm
just in case you haven't figured it out, cos is not plain cosine here, it's cosine similarity (it even said so above the equation)
mint palm
actually idk how but math notation that i know seems quite different
 steady basalt
mint palm
steady basalt
mint palm
Doesn’t that mean that both satisfy the equation ?
@wooden sail your time to shine!
 merry ridge
I'm confused why a comma is the part that you find confusing. The operator cos in this case is a function of two variables.
This is no different from writing f(x,y)
 latent swan
not really data science related as much, but dont know where else ask this... i am using the mip library for a constraints programming problem. and when i optimize i get back a solution with status "OPTIMAL" but some constraints have been violated. doesnt it mean that it should be infeasible and only feasible solutions can be optimal??? i am so confused pls someone help :((


 bold timber
Hello guys, can anyone enlighten me on the purpose of save_best_only as true or false? I don't really understand this for making a decision on when to use save_best_only= True or save_best_only=False
 hasty mountain
@desert oar using data from 30 pages of a book instead of simply 6 sentences also provided a better output, with a higher variety of words.
To be honest, I think that assigning arbitrary numbers to each word would work for a dataset of 6 sentences, as my vector embedding model assigned numbers that were, like... within range [6,7] for the most common characters and numbers within range ]0, 1] to the ones that were more rare, which made my model outputs being translated as almost always being the word corresponding to 1 and 6(the most common outputs were within range [1,6])
But, when I used 30 pages of a PDF book to make a word predictor model, this vector embedding indeed worked, generating a higher diversity of words, generating values that were way more closer to the values in the encoded data.
Thanks again for your patience. Now I think I'll try to adapt this for my RL algorithm.
However, I should say that, though my data had vectors like 2.4253 and my model almost correctly predicted 2.4162, it still couldn't predict correctly any of the words because of how close each vector value is from each other in my dictionary
I suppose this could be helped if I made a better model...or used more data...or even optimized my embedding model(which had a loss of around 3.618, while the actual word predictor had 0.496)
Also, I didn't arrange my data into sequences, so it could be directly fitted into the FCC layers. Maybe using attention layers instead of simple matrix multiplication could also help.
 serene scaffold
bold timber
Hello guys, can anyone enlighten me on the purpose of ``save_best_only`` as true...
serene scaffold
bold timber
Hello guys, can anyone enlighten me on the purpose of ``save_best_only`` as true...
it's apparent from the context that save_best_only is a function parameter, but you have to say what function you're talking about, or no one knows what you're asking.
bold timber
serene scaffold
it's apparent from the context that `save_best_only` is a function parameter, bu...
What happens when we use save_best_only = True as the parameter?
This image is the result of both which is on the left when I used save_best_only = False and on the right when I used save_best_only = True what's different between both? @serene scaffold

 tacit basin
bold timber
This image is the result of both which is on the left when I used ``save_best_on...
tacit basin
bold timber
This image is the result of both which is on the left when I used ``save_best_on...
Is this keras or something?
bold timber
tacit basin
Is this keras or something?
I use tf.keras.callbacks.ModelCheckpoint
tacit basin
bold timber
I use ``tf.keras.callbacks.ModelCheckpoint``
It tells Whether to only keep the model that has achieved the "best performance" so far, or whether to save the model at the end of every epoch regardless of performance.
The screen shot looks random to me 😜. I mean in relation to the question
 warm jungle
pnumpy (https://github.com/Quansight/pnumpy) seems to speed up numpy.argsort quite a bit for large arrays, which is useful in my application. But it looks a bit like it might be abandonware (no commits for 2 years). Is there a fork or something similar that's actively maintained?

GitHub
Parallel NumPy seamlessly speeds up NumPy for large arrays (64K+ elements) with no change required to existing code. - GitHub - Quansight/pnumpy: Parallel NumPy seamlessly speeds up NumPy for large...
 rugged comet
I've never seen loss and accuracy graphs shaped like this before. The validation loss and accuracy seemingly doesn't change (very much).
Here is the training output
https://paste.pythondiscord.com/olaluverul
What could cause the validation loss to not change very much at all? I tried changing the number of units in my Dense layer but that didn't seem to affect things very much.
Here is the code
https://www.kaggle.com/code/urkchar/determine-if-tweet-is-about-disaster

 bold timber
tacit basin
It tells Whether to only keep the model that has achieved the "best performance"...
bold timber
tacit basin
It tells Whether to only keep the model that has achieved the "best performance"...
Thank you!
But can you elaborate on the sentence "save the model at the end of every epoch"?
Is the difference between both (True/False) only referred to in epoch? @tacit basin
tacit basin
bold timber
But can you elaborate on the sentence ``"save the model at the end of every epoc...
True means that only the best model will be stored, so for example if model performance as loss (the lower the better) after epochs look like that:
- epoch 0, loss: 10, model saved because it's first one
- epoch 1, loss: 5, model saved because it's better than first one
- epoch 2, loss: 7, model not saved because not better than second one
as opposed to false, where all model checkpoints will be saved, after each epoch regardless of the model performance
bold timber
tacit basin
as opposed to false, where all model checkpoints will be saved, after each epoch...
does it mean when we set it to False, all of the models will be saved for the entire epoch?
bold timber
tacit basin
True means that only the best model will be stored, so for example if model perf...
can you give me an example like this for False?
tacit basin
bold timber
can you give me an example like this for ``False``?
false:
epoch 0, model saved
epoch 1, model saved
epoch 2, model saved
epoch 3, model saved ...
bold timber
tacit basin
false:
epoch 0, model saved
epoch 1, model saved
epoch 2, model saved
epoch 3, m...
If I have three models, will they do the same or overwrite each other?
tacit basin
bold timber
If I have three models, will they do the same or overwrite each other?
just looked it up in docs:
save_best_only: if save_best_only=True, it only saves when the model is considered the "best" and the latest best model according to the quantity monitored will not be overwritten. If filepath doesn't contain formatting options like {epoch} then filepath will be overwritten by each new better model.
https://keras.io/api/callbacks/model_checkpoint/

filepath: string or PathLike, path to save the model file. e.g. filepath = os.path.join(working_dir, 'ckpt', file_name). filepath can contain named formatting options, which will be filled the value of epoch and keys in logs (passed in on_epoch_end). For example: if filepath is weights.{epoch:02d}-{val_loss:.2f}.hdf5, then the model checkpoints will be saved with the epoch number and the validation loss in the filename. The directory of the filepath should not be reused by any other callbacks to avoid conflicts.
bold timber
tacit basin
just looked it up in docs:
save_best_only: if save_best_only=True, it only saves...
Sorry, I've misunderstood before.
thank you so much for your explanation! it's really helpful!
tacit basin
bold timber
Sorry, I've misunderstood before.
thank you so much for your explanation! it's ...
i don't use keras i literally looked it up in docs and pasted it here 🙂
hope docs are correct in this case 🙂
 young granite
someone knows a better way to insert new values to a df instead of creating a new df reindexing and then concat?
array_1 = df.index[df["X"] >= -140]
first_index = array_1[0]
array_2 = df.index[df["X"] <= 170]
last_index = array_2[len(array_2)-1]
new_df = df.loc[first_index:last_index]
new_df.at[first_index, "X"] = -140.00
new_df.at[last_index, "X"] = 170.00
new_df = new_df[['X', "X"]]
x = new_df.iloc[:, 1]
y = new_df.iloc[:, 0]

f = interp1d(x, y, kind='cubic')
x_int = np.linspace(start=x.min(), stop=x.max(), num=621)
y_int = f(x_int)
int_df = pd.DataFrame({"X": x_int, 'Y': y_int})

x_range = np.linspace(start=-160, stop=-140.5, num=40)
range_df = pd.DataFrame({"X":x_range, 'Y':np.NaN})
concat_df = pd.concat([range_df, int_df])
concat_df = concat_df.reset_index(drop=True)
concat_df.at[concat_df.index[0], 'Y'] = concat_df['Y'][concat_df.index[-1]]
concat_df = concat_df.interpolate(method='linear', axis=0)```do you understand about EfficientNet model?
tacit basin
bold timber
do you understand about EfficientNet model?
A little bit
bold timber
tacit basin
A little bit
I've run the EfficientNetB0 from tf.hub. In there, I used the data with scaling first and I get a score is 87%, but when I try to re-run again without scaling the data first I get a worse score of around 10%. Why did it happen?
As I know, EfficientNet has a compound scaling which is no need to scale the data first.
 vestal spruce
does anyone knows an article or journal that tackles with fixing the tilted object with rotation so that it is parallel to the x and/or y axis?
 bright pasture
ValueError: zero-size array to reduction operation maximum which has no identity
That's the error I'm getting while trying to preprocess audio files.
 wooden sail
you're calling some flavor of np.max on an empty numpy array
!e
import numpy as np
x = np.array([])
np.amax(x)
 arctic wedgeBOT
@wooden sail :x: Your 3.11 eval job has completed with return code 1.
001 | Traceback (most recent call last):
002 |   File "<string>", line 3, in <module>
003 |   File "<__array_function__ internals>", line 180, in amax
004 |   File "/snekbox/user_base/lib/python3.11/site-packages/numpy/core/fromnumeric.py", line 2793, in amax
005 |     return _wrapreduction(a, np.maximum, 'max', axis, None, out,
006 |            ^^^^^^^^^^^^^^^^^^^^^^^^^^^^^^^^^^^^^^^^^^^^^^^^^^^^^
007 |   File "/snekbox/user_base/lib/python3.11/site-packages/numpy/core/fromnumeric.py", line 86, in _wrapreduction
008 |     return ufunc.reduce(obj, axis, dtype, out, **passkwargs)
009 |            ^^^^^^^^^^^^^^^^^^^^^^^^^^^^^^^^^^^^^^^^^^^^^^^^^
010 | ValueError: zero-size array to reduction operation maximum which has no identity
Well, I'm not doing it like that. I'm running a command which is supposed to allow me to preprocess audio files and binarize them.
wooden sail
i know you're not doing it like that, i'm just exemplifying. the idea is that you somehow loaded the audio file incorrectly, and so your array is empty
bright pasture
It also constantly keeps saying, "Torch not compiled with CUDA enabled"
bright pasture
bright pasture
It also constantly keeps saying, "Torch not compiled with CUDA enabled"
Could this be why? Because of the CUDA thing?
I'm using conda, btw.
wooden sail
seems like you installed pytorch without cuda
 wooden sail
you have to point pytorch to the correct cuda version when you install it though
if you install it without any flags, it doesn't bring gpu support
try this. do conda remove pytorch
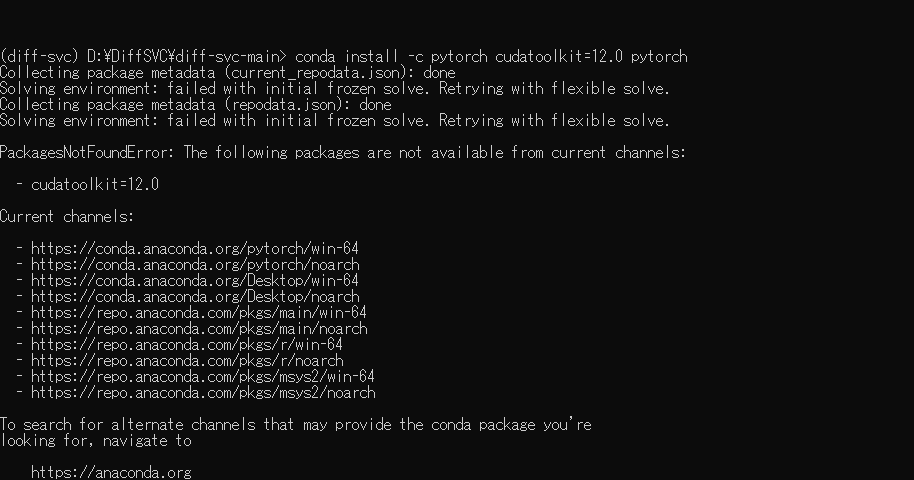
and then do conda install -c pytorch cudatoolkit=12.0 pytorch
 wooden sail
i guess you're remoting into a cluster or smth?
bright pasture
What on earth does that mean?
wooden sail
you're running this on your own computer?
wooden sail
ok. sadly idk about that SSL error, never seen it before
does conda update --all work?
bright pasture
Same error.
wooden sail
ok this appears to be a moderately recent issue
check this out https://github.com/conda/conda/issues/11982
mint palm
what exactly is attention weight? is it softmax_number*(key*query)??
bright pasture
wooden sail
ok this appears to be a moderately recent issue
Okay, so I fixed (that*.
But now...
 bright pasture
mint palm
what exactly is attention weight? is it ``softmax_number*(key*query)``??
bright pasture
mint palm
what exactly is attention weight? is it ``softmax_number*(key*query)``??
I have no idea.
wooden sail
seems conda doesn't have this version of cuda yet?
wooden sail
not use anaconda, if this is the only gpu you have, or ignore the warning and have stuff run on cpu (this'll be slow)
wooden sail
wdym "on python itself"
conda is just a package manager
you could use pip to install the libs you want
bright pasture
wooden sail
conda is just a package manager
Like, all the requirements are apparently already installed.
I just checked.
Would I have to downgrade cuda somehow?
How would I do that?
And if so, would this mean that the latest version of cuda is incompatible?
bright pasture
wooden sail
you could use pip to install the libs you want
I'm still very confused by all this.
wooden sail
yes, you'd have to downgrade cuda. the problem is that cuda is backwards compatible, but not forwards. i don't know if your gpu can work with an older cudatoolkit
bright pasture
For reference, I have a 3090.
 coral nimbus
Hi, I have some questions about the data input for object recognition
I used roboflow for this project, which is to recognise plastic bottles
I labelled about 1000 plastic bottle images but the result turned out to be useless as it confuses other things with plastic bottles, and I have to hold the camera at a certain angle for it to recognise plastic bottles
What can I do to improve the quality of data input?
tacit basin
bold timber
I've run the EfficientNetB0 from tf.hub. In there, I used the data with scaling ...
by scaling you mean adjusting mean and standard deviation?
steady basalt
Mooooods
mighty patio
<@&831776746206265384>
 silk garden
mighty patio
<@&831776746206265384>
silk garden
mighty patio
<@&831776746206265384>
Sorry, I delete it 🙂
 neat crescent
👍
mint palm
when we use transformer for video, while feeding for say 8 frames a time, and there are n patch from each frames, do we feed array of (8*n, something)?
 fast rivet
error: "No values given for wildcard 'i'"
code:
configfile: "/home/comp/user/projects/python/emoClassifier/config.yaml"
n=[i for i in range(50)]
output = ["{work_dir}/emoClassifier/output/models/weighted/pt_save_pretrained_{n}/train_args/checkpoint-{i}/hamming_loss.png"]


rule all:
    input:
        expand(output,
                work_dir=config['workdir'],
                n=n,
                )


checkpoint fine_tuner:
    input:
        script="{work_dir}/emoClassifier/emo_classifier.py",
        dataset="{work_dir}/emoClassifier/output/bootstrapped_datasets/dataset_{n}"
    output:
        directory("{work_dir}/emoClassifier/output/models/weighted/pt_save_pretrained_{n}")
    conda:
        "emoClassifier_new.yaml"
    shell:
        "python3 {input.script} -w -ds {input.dataset} -sd {output}"


def loss_plotter_input(wildcards):
    checkpoint_output = checkpoints.fine_tuner.get(**wildcards).output[0]
    return expand("{work_dir}/emoClassifier/output/models/weighted/pt_save_pretrained_{n}/train_args/checkpoint-{i}/trainer_state.json",
        work_dir=wildcards.workdir,
        n=wildcards.n,
        i=glob_wildcards(os.path.join(checkpoint_output,"/train_args/checkpoint-{i}")).i,
    )


rule loss_plotter:
    input:
        script="{work_dir}/emoClassifier/loss_plotter.py",
        json=loss_plotter_input
    output:
        "{work_dir}/emoClassifier/output/models/weighted/pt_save_pretrained_{n}/train_args/checkpoint-{i}/hamming_loss.png"
    conda:
        "loss_plotter.yaml"
    shell:
        "python3 {input.script} {input.json} {output}"
question: How can I run this when wildcard i doesn't exist yet?
I'm using snakemake btw
 candid garnet
cbar.set_label("Reflectivity")```

If I'm generating plots (colormesh plots) for an experiment at a range of different angles using a for loop, how should I include a color bar in a way that it isn't constantly adding on a new bar each time?

Code:
```def plot_function(angle, params):
    rotation = np.degrees(rotation)

    params = {'mathtext.default': 'regular' }
    plt.rcParams.update(params)
    plt.pcolormesh(x_axis, y_axis, reflectivity)
    cbar = plt.colorbar() # This is causing duplication
    cbar.set_label("Reflectivity")
    plt.savefig("path_xyz")

def main_heatmap_all_rotations():
    rotation_angles = np.linspace(0, np.pi/4., 90)

    for rotation_angle in rotation_angles:
        #Processing stuff removed
plot_function(rotation_angle, other_params)```for example 0 degrees vs 17 degrees

 mint palm
WHY decode side has 2 attentions but one in encoder?
silk garden
Hi! I wrote an answer but seemed to be self-promotion. So I would be really interested to continue the discussion with you. Here's my email : taha@edenai.co (or add me on Discord)
mighty patio
candid garnet
```cbar = plt.colorbar()
cbar.set_label("Reflectivity")```
If I'm generating pl...
Easiest way is probably to close and remake the figure every time:
import matplotlib.pyplot as plt
params = {'mathtext.default': 'regular' }
plt.rcParams.update(params)

def plot_function(angle):
    rotation = np.degrees(rotation)
    fig, ax = plt.subplots()
    cs = ax.pcolormesh(x_axis, y_axis, reflectivity)
    cbar = fig.colorbar(cs, ax = ax)
    cbar.set_label("Reflectivity")
    fig.savefig("path_xyz")
    plt.close(fig)
I also removed params as a parameter, as you did not actually use the provided params in the function, and moved plt.rcParams.update() outside
I also changed to the object-oriented interface (fig.-, ax.-) instead of the pyplot functional interface (plt.-)
 deft socket

Does anyone know how I can add multiple exogenous variables to the statsmodels ARIMA
I cant find anything about this in the documentation, and for now can only add one
bold timber
tacit basin
by scaling you mean adjusting mean and standard deviation?
No. Scaling means deviding each pixel value with 255
To clarify about this, the problem is image classification of food101 dataset
 silk garden
Hi @desert oar: I would like to continue this discussion with you without spamming the others or being accused of self-promotion. Happy to talk on Discord or by email: taha@edenai.co

 sly wadi
 gilded oasis
Seems like the formula is a string, and not a dictionary.
sly wadi
gilded oasis
You should be able to fix it with mapping the formula to this function.
def fix_dict(s):
s = s.replace("'", '"')
return json.loads(s)df["formula"] = df["formula"].map(fix_dict)
gilded oasis
sly wadi
You should be able to fix it with mapping the formula to this function.
> def fi...
Hi, thank you for your message.
I'll try that tonight
 dusty valve
Yellow line is real Walmart stock, blue line is what my model predicted

Not half bad
deft socket
dusty valve
Yellow line is real Walmart stock, blue line is what my model predicted
What model are you using?
deft socket
Ahh an ML model
dusty valve
Yes
deft socket
I thought you were using an econometrics model like ARIMA
 tidal bough
dusty valve
Yellow line is real Walmart stock, blue line is what my model predicted
tidal bough
dusty valve
Yellow line is real Walmart stock, blue line is what my model predicted
why do they start at different points... oh right, probably just not a time series prediction
deft socket
The fit seems pretty good
dusty valve
tidal bough
why do they start at different points... oh right, probably just not a time seri...
It's off by a bit
There are a few in accuracies such as at the 120 - 150 days
bright pasture
When trying to train on my 3090 GPU, I'm getting this error.
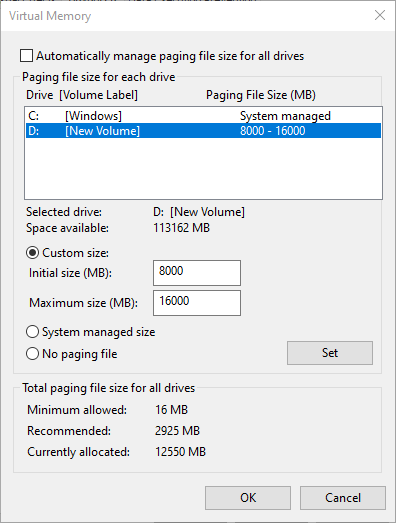
OSError: [WinError 1455] The paging file is too small for this operation to complete. Error loading "C:\Users\phill\AppData\Local\Programs\Python\Python310\lib\site-packages\torch\lib\cufft64_10.dll" or one of its dependencies.
dusty valve
bright pasture
When trying to train on my 3090 GPU, I'm getting this error.
```OSError: [WinEr...
Turn up paging size
bright pasture
But for which drive? And for which initial and maximum size?
dusty valve
Type in performance in search bar
And open performance settings
I'm not on PC rn
So, there should be an advanced option
Look around and there should be paging size options
Set to manual and crank it up
Maybe 2 -3 gb
 crisp jackal
Has anyone already implemented Item to Item collaborative filtering using pyspark?
 bright pasture
It's not like the paging file error tells me how much I need...
dusty valve
2-3 gb
 deft socket
dusty valve
Ngl kinda looks over fitting
deft socket
dusty valve
Ngl kinda looks over fitting
yeah, but it fairs okay out-of-sample so i dont mind
bright pasture
dusty valve
2-3 gb
So would I change what's there then?
dusty valve
bright pasture
So would I change what's there then?
Yes ( don't change initial size, only max)
bright pasture
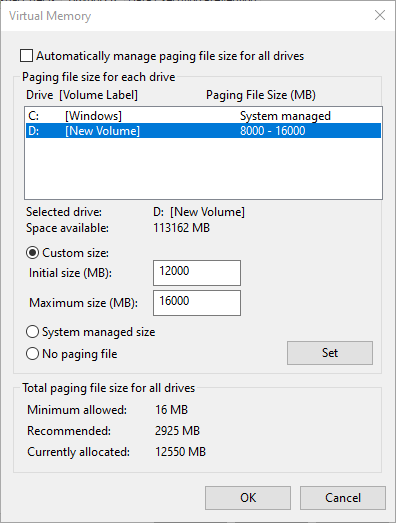
But it's 8 gb already.
dusty valve
Try C drive then
bright pasture
Why would the maximum be smaller than the initial?
No no, I mean that the initial is already set to 8 GB.

At least I think it is?
 deft socket
dusty valve
Yellow line is real Walmart stock, blue line is what my model predicted
deft socket
dusty valve
Yellow line is real Walmart stock, blue line is what my model predicted
actually for this, do you think its normal for a forecast to be lagging from the actual?
like when you have a turning point
im facing that issue atm
dusty valve
deft socket
actually for this, do you think its normal for a forecast to be lagging from the...
Yes
If it's linear model
I used ELU for my activation which seemed to reduce that
 dusty valve
Like relu but goes below zero
deft socket
As you can see, the lags here are pretty bad
deft socket
dusty valve
I used lstm with elu and dropouts
im not using an ML model at all
dusty valve
K
bright pasture
  File "D:\DiffSVC\diff-svc-main\run.py", line 15, in <module>
    run_task()
  File "D:\DiffSVC\diff-svc-main\run.py", line 11, in run_task
    task_cls.start()
  File "D:\DiffSVC\diff-svc-main\training\task\base_task.py", line 234, in start
    trainer.fit(task)
  File "D:\DiffSVC\diff-svc-main\utils\pl_utils.py", line 495, in fit
    self.run_pretrain_routine(model)
  File "D:\DiffSVC\diff-svc-main\utils\pl_utils.py", line 588, in run_pretrain_routine
    self.train()
  File "D:\DiffSVC\diff-svc-main\utils\pl_utils.py", line 1364, in train
    self.run_training_epoch()
  File "D:\DiffSVC\diff-svc-main\utils\pl_utils.py", line 1385, in run_training_epoch
    for batch_idx, batch in enumerate(self.get_train_dataloader()):
  File "C:\Users\phill\AppData\Local\Programs\Python\Python310\lib\site-packages\torch\utils\data\dataloader.py", line 681, in __next__
    data = self._next_data()
  File "C:\Users\phill\AppData\Local\Programs\Python\Python310\lib\site-packages\torch\utils\data\dataloader.py", line 1359, in _next_data
    idx, data = self._get_data()
  File "C:\Users\phill\AppData\Local\Programs\Python\Python310\lib\site-packages\torch\utils\data\dataloader.py", line 1325, in _get_data
    success, data = self._try_get_data()
  File "C:\Users\phill\AppData\Local\Programs\Python\Python310\lib\site-packages\torch\utils\data\dataloader.py", line 1176, in _try_get_data
    raise RuntimeError('DataLoader worker (pid(s) {}) exited unexpectedly'.format(pids_str)) from e
RuntimeError: DataLoader worker (pid(s) 18644, 17332) exited unexpectedly
Epoch 1: : 0batch [00:10, ?batch/s]```I just got this error.
deft socket
dusty valve
I used lstm with elu and dropouts
im using ARIMA(4,2) with some exogenous regressors
I intend on trying some ML models, then combining them to get a combined forecast
dusty valve
Never heard of that
deft socket

this is when I add in the exogenous regressor, it tracks the direction better , but the magnitude is dampened for some reason
deft socket
dusty valve
Never heard of that
ARIMA is a baseline model that one should ideally beat
to show that their model is better than the baseline
dusty valve
Whats the regressor look like
deft socket
*ARIMA(1,1)
deft socket
dusty valve
Whats the regressor look like
one moment
dusty valve
I gtg now, send all your stuff and ping me and I'll get back after
deft socket
bright pasture
Can someone help?
im not too sure about it sorry
deft socket
dusty valve
I gtg now, send all your stuff and ping me and I'll get back after

ARIMA(p,q) is a combo of AR(p) and MA(q)
AR is a regression model with p lags of Y
MA is a regression model with q lags of error terms
(I is for integrated, but thats not important here)
 agile cobalt


Natural Language Processing is the discipline of building machines that can manipulate language in the way that it is written, spoken, and organized
 plush jungle
what's the difference between
np.sum(weights * x)```
and
```py
np.dot(weights, x)``` sly wadi
plush jungle
so dot(arr,2) and arr * 2 are the same?
sly wadi
plush jungle
so dot(arr,2) and arr * 2 are the same?
Not really. np.dot calculates the dot product of two arrays. But since the second array is a number in this case, the result is the same.
 plush jungle
sly wadi
Not really. np.dot calculates the dot product of two arrays. But since the secon...
plush jungle
sly wadi
Not really. np.dot calculates the dot product of two arrays. But since the secon...
ok i'm confused. given two vectors of equal length, which functions produce the same result?
!e
import numpy as np

mat1 = np.array([1,2,3,4])
mat2 = np.array([1,2,3,4])

print(np.dot(mat1, mat2))
print(np.sum(mat1 * mat2))```@plush jungle :white_check_mark: Your 3.11 eval job has completed with return code 0.
001 | 30
002 | 30
these are the same so long as the inputs are equal length vectors right?
so this distinction only matters when multiplying vector * scalar or vector * matrix etc
sly wadi
I think they are equal as long as both arrays are 1-d arrays. (But I'm no expert)
plush jungle
ok thanks
gilded oasis
sly wadi
You should be able to fix it with mapping the formula to this function.
> def fi...
I tried the code but I got an error
sly wadi
gilded oasis
I tried the code but I got an error
What error=
gilded oasis

 gilded oasis
sly wadi
What error=
gilded oasis
sly wadi
What error=
sorry its just me
sly wadi
gilded oasis
sorry its just me
Figured it out?
gilded oasis
I copied the code wrong, sorry.
sly wadi
gilded oasis
I copied the code wrong, sorry.
Ok
gilded oasis
Its good thx !!!
 sly wadi
gilded oasis
Its good thx !!!
sly wadi
gilded oasis
Its good thx !!!
Great! No problem! 🙂
 iron basalt
plush jungle
so this distinction only matters when multiplying vector * scalar or vector * ma...
iron basalt
plush jungle
so this distinction only matters when multiplying vector * scalar or vector * ma...
Yes, for two 1-d arrays: https://en.wikipedia.org/wiki/Dot_product#Algebraic_definition
In mathematics, the dot product or scalar product is an algebraic operation that takes two equal-length sequences of numbers (usually coordinate vectors), and returns a single number. In Euclidean geometry, the dot product of the Cartesian coordinates of two vectors is widely used. It is often called the inner product (or rarely projection prod...
Not sure why this wiki page decided to use colors.
tacit basin
what are the most hot / best paid 🙂 keywords in AI these days 🙂 ?
plush jungle
can someone help me understand backpropagation? If the forward function is like this:
    def forward(self,x):
        return sigmoid(np.sum(self.weights*x) + self.bias)```
then derivative of Error with respect to weights for the last layer what?in my lecture notes it's formulated like this:

where z is the weighted sum
I only really understand the first term, which is just the error
but how do I get
δsigmoid/δz```I've got this
def derivative_of_sigmoid(z):
return np.exp(z)/((np.exp(z) + 1)**2)```but what do I pass it?
and how do I know what
δz/δwi```
is in code? inland eagle
does anyone know how to convert a column in a df from a float to int values using pandas?
serene scaffold
inland eagle
does anyone know how to convert a column in a df from a float to int values usin...
df['col'] = df['col'].astype(int)
https://en.wikipedia.org/wiki/Logistic_function#Derivative Note the f(x)(1-f(x)).
plush jungle
iron basalt
https://en.wikipedia.org/wiki/Logistic_function#Derivative Note the `f(x)(1-f(x)...
wait so it should be
sigmoid(z) * (1 - sigmoid(z))```And sigmoid(z) was already computed during the forward pass.
This function was chosen in part due to this property.
plush jungle
iron basalt
And sigmoid(z) was already computed during the forward pass.
the final layer's output vector is sigmoid(z), right?
iron basalt
plush jungle
the final layer's output vector is sigmoid(z), right?
If it's a sigmoid layer.
plush jungle
iron basalt
And sigmoid(z) was already computed during the forward pass.
when I forward pass, do I need to store the output of every single layer?
or just the last one?
iron basalt
Whenever simgoid(z) is needed.
plush jungle
iron basalt
Whenever simgoid(z) is needed.
every layer looks like this
sigmoid(np.sum(self.weights * x) + self.biases)```So each needs sigmoid(z).
 thorn sable
 vestal siren

Can someone help me with the negative log likelihood?
I don't understand what I did wrong?
Maybe the N?
 delicate apex
vestal siren
delicate apex
vestal siren
first glance, N is supposed to be the count of objects, and you have n = target_pred, which makes it an ndarray. I believe the mismatch means you might be getting unintended matrix multiplication instead of scalar-matrix
tidal bough
debugging without any sort of error whatsoever is a bad idea, but I notice something more obvious: surely np.divide is a two-argument function, not one-argument? 😛
delicate apex
!d numpy.divide
arctic wedgeBOT
numpy.divide(x1, x2, /, out=None, *, where=True, casting='same_kind', order='K', dtype=None, subok=True[, signature, extobj]) = <ufunc 'divide'>```
Divide arguments element-wise.Oh I see! How can I get the count of objects?
vestal siren
tidal bough
debugging without any sort of error whatsoever is a bad idea, but I notice somet...
Sharp haha!
delicate apex
vestal siren
Oh I see! How can I get the count of objects?
probably either len(target_pred) or target_pred.shape[0] - these should be the same
vestal siren
That worked, thank you!
 runic igloo
 vestal siren
# Implement the following function to return all rows in X and Y such that the left
# child gets all examples that are less than the split value and vice versa.
def w1_tree_split_data_left(X, Y, feature_index, split_value):
    """Split the data `X` and `Y`, at the feature indexed by `feature_index`.
    If the value is less than `split_value` then return it as part of the left group.

    # Arguments
        X: np.array of size `(n_objects, n_in)`
        Y: np.array of size `(n_objects, 1)`
        feature_index: index of the feature to split at
        split_value: value to split between
    # Output
        (XY_left): np.array of size `(n_objects_left, n_in + 1)`
    """
    X_left, Y_left = None, None
    #################
    ### YOUR CODE ###
    #################
    return XY_left
Can someone help me with this problem? I received a hint that I have to append the output (Y) to the X vector of features, so that XY will have n_in + 1 columns. But I don't quite understand this hint?
 umbral charm
runic igloo
https://tenor.com/view/witchcraft-hunchback-of-notre-dame-frollo-claude-frollo-t...
umbral charm
runic igloo
https://tenor.com/view/witchcraft-hunchback-of-notre-dame-frollo-claude-frollo-t...
You’re like a day late
But yea
 copper willow
Hi guys, anyone have some advanced experiencie with google sheets that can assist me with something really quick? I dont think it'll take more than 10 mins
rugged comet
Bumping this
#data-science-and-ml message
It seems to be not generalizing at all.
https://www.kaggle.com/code/urkchar/determine-if-tweet-is-about-disaster/notebook
What insight do you guys have on why this is happening?
Explore and run machine learning code with Kaggle Notebooks | Using data from Natural Language Processing with Disaster Tweets
 serene plume
pairwise_similarities = 1 - pdist(self.encode(sentences), metric="cosine").astype(np.float16)
pairwise_similarities[pairwise_similarities < sim_threshold] = 0
Much cleaner and way less redundant work. Thanks for the pointer!
bright pasture


While the finishing touches are being done for JSUT, I'm also making a (private, unfortunately) Diff-SVC model of Beyonce herself. Here's how she sounds like like with 42000 steps, singing Enemy by Imagine Dragons. Not the best, but she's going to sound a lot better soon.
 Twitter
·
rugged comet
rugged comet
Bumping this
https://discord.com/channels/267624335836053506/366673247892275221/...
Twitter
·
rugged comet
rugged comet
Bumping this
https://discord.com/channels/267624335836053506/366673247892275221/...
I expected a shape more like this.

 deft spire
Hey guys, I am absolute beginner in machine learning and neural networks and am willing to learn them, I don't have knowledge of higher maths (I'm at like full school level, knowing functions, trigonometry, partially exponent, logarithm), can you recommend any good books/free courses for such beginners?
rugged comet
deft spire
Hey guys, I am absolute beginner in machine learning and neural networks and am ...
Books
https://www.oreilly.com/library/view/ai-and-machine/9781492078180/
https://www.manning.com/books/deep-learning-with-python-second-edition
Courses
https://www.coursera.org/learn/introduction-tensorflow
https://www.udacity.com/course/intro-to-tensorflow-for-deep-learning--ud187
O’Reilly Online Learning

Manning Publications
In this extensively revised new edition of the bestselling original, Keras creator offers insights for both novice and experienced machine learning practitioners.

Coursera
Offered by DeepLearning.AI. If you are a software developer who wants to build scalable AI-powered algorithms, you need to understand how to ... Enroll for free.

Developed by Google and Udacity, the Intro to TensorFlow free online course teaches a practical approach to virtual reality for software developers. Learn online with Udacity.
@deft spire More
https://www.tensorflow.org/resources/learn-ml

TensorFlow
Start your TensorFlow training by building a foundation in four learning areas: coding, math, ML theory, and how to build an ML project from start to finish.
deft spire
@rugged comet thanks a lot
deft spire
rugged comet
Books
https://www.oreilly.com/library/view/ai-and-machine/9781492078180/
https:/...
.bm
 strange elbowBOT
Click the button to be sent your very own bookmark to [this message](#data-science-and-ml message).
bold timber
Anyone can enlighten me why I get so different results when I uses load_weights with the cloned model?
Please give me an insight about this because I've been stuck in there for 4 days 🙏

this is my checkpoint path

 grand quarry
bold timber
Anyone can enlighten me why I get so different results when I uses ``load_weight...
grand quarry
bold timber
Anyone can enlighten me why I get so different results when I uses ``load_weight...
Maybe test data is a generator?
bold timber
grand quarry
Maybe test data is a generator?
I'm generating test data by using tfds like this:
 grand quarry
bold timber
I'm generating test data by using tfds like this:
grand quarry
bold timber
I'm generating test data by using tfds like this:
Never used tfds but check if the test data is the same.
Check if loss function is the same too
bold timber
grand quarry
Never used tfds but check if the test data is the same.
Check if loss function i...
what do you mean about "test data is the same" ?
grand quarry
The variable test_data should be the same when you call evaluate()
The first time you evaluate and second time after you load the model
bold timber
grand quarry
The first time you evaluate and second time after you load the model
wait a minute, I will re-run all again
bold timber
grand quarry
The first time you evaluate and second time after you load the model
test_data form of both is the same
 grand quarry
bold timber
test_data form of both is the same
grand quarry
bold timber
test_data form of both is the same
That means the shape is the same, but the values might be different
bold timber
grand quarry
That means the shape is the same, but the values might be different
how do we know?
grand quarry
Do
from copy import deepcopy

copied_test_data = deepcopy(test_data)
And do both evaluations on copied_test_data. Maybe that will work
bold timber
I get an error like this

I know another way by using .set_weights(model.get_weights()) but I think it just take from the last epoch during training not the best epoch
 prime knot
bold timber
I get an error like this
prime knot
bold timber
I get an error like this
lol theres a Search Stack Overflow button
push that
<_>
bold timber
prime knot
lol theres a `Search Stack Overflow` button
I've push of it but I don't understand what happened in there because it discusses about pickle _thread.RLock objects
prime knot
bold timber
I've push of it but I don't understand what happened in there because it discuss...
try something called SCROLLING on 
bold timber
prime knot
`try something called SCROLLING on `<:logo_stack_overflow:769344643489464391>
 grand quarry
The variable test_data should be the same when you call evaluate()
grand quarry
grand quarry
The variable test_data should be the same when you call evaluate()
Just do this, Google how tfds works. I'm on my phone so can't help more
vestal siren
#At each node in the tree, the data is split according to a split criterion and each split is passed
#onto the left/right child respectively. Implement the following function to return all rows in X and Y
#such that the left child gets all examples that are less than the split value and vice versa.
def w1_tree_split_data_left(X, Y, feature_index, split_value):
    """Split the data `X` and `Y`, at the feature indexed by `feature_index`.
    If the value is less than `split_value` then return it as part of the left group.

    # Arguments
        X: np.array of size `(n_objects, n_in)`
        Y: np.array of size `(n_objects, 1)`
        feature_index: index of the feature to split at
        split_value: value to split between
    # Output
        (XY_left): np.array of size `(n_objects_left, n_in + 1)`
    """
    X_left, Y_left = None, None
    XY_left = []
    XY = np.append(X, Y)
    n = len(XY)
    for row in range(n):
        if row[feature_index] < split_value:
            XY_left.append(row[feature_index])

    return XY_left
Hi, can anyone help me with this problem? I don't understand what I do wrong.
arctic wedgeBOT
Hey @bold timber!
It looks like you tried to attach file type(s) that we do not allow (.ipynb). We currently allow the following file types: .gif, .jpg, .jpeg, .mov, .mp4, .mpg, .png, .mp3, .wav, .ogg, .webm, .webp, .flac, .m4a, .csv, .json.
Feel free to ask in #community-meta if you think this is a mistake.
mint palm
UserWarning: User provided device_type of 'cuda', but CUDA is not available. Disabling
warnings.warn('User provided device_type of 'cuda', but CUDA is not available. Disabling')
I am training YOLOv7 but it is not using GPU
 hoary wigeon
Anyone here have used KModes? I want to automate the procedure of finding the value of n_cluster in KModes.
 lapis sequoia
Does anyone have a working example of using Grad Cam with PyTorch or tensorflow?
Activation maps*
 silent stump
Hi guys does anyone know, is the coefficients essentially the slope in linear regression? and intercept the location? just trying to understand this scikit module. thx
dusty valve
I'm just wondering if my regressor is predicting wrong, I got 40 years of Walmart stock price data, split it into 1 week and the day after the week is the label. So the shape of train data is (2080, 7, 1)). 2080 weeks of prices. I take the last year worth of data for testing and verifying, so it's (52, 7, 1) as a shape. And I just do model.predict(x_test). But it seems too accurate. Did I mess up somewhere? ( I can paste code if required )

I trained for 10 epochs only
serene scaffold
mint palm
UserWarning: User provided device_type of 'cuda', but CUDA is not available. Dis...
I'd need to see the code. do you know if you have a GPU or not?
dusty valve
It gets similar results with other stocks ( predicting them not training )
So is the prediction data wrong?
serene scaffold
vestal siren
```py
#At each node in the tree, the data is split according to a split criterio...
you return a list at the end instead of an array. do you have any test cases? do you know how your output differs from the expected output?
vestal siren
serene scaffold
you return a list at the end instead of an array. do you have any test cases? do...
XY_left is an array right?
serene scaffold
vestal siren
XY_left is an array right?
nope, you did XY_left = [], which is a list.
mint palm
serene scaffold
I'd need to see the code. do you know if you have a GPU or not?
i just did a git clone and edited data.yaml and added the dataset.
Nothing else, its all the same code.
i have nvidia gtx1660ti
serene scaffold
mint palm
i just did a git clone and edited data.yaml and added the dataset.
Nothing else,...
is it trying to use pytorch or tensorflow or what
mint palm
torch
serene scaffold
mint palm
torch
can you do nvidia-smi at the terminal and show the output?
vestal siren
serene scaffold
nope, you did `XY_left = []`, which is a list.
If I don't include that, I get that it is not defined
serene scaffold
vestal siren
If I don't include that, I get that it is not defined
do you know the difference between a list and an array?

 serene scaffold
mint palm
serene scaffold
mint palm
great, what is your python version and your os? please do not show any more screenshots--just text.
mint palm
import torch
print(torch.__version__)
print(torch.cuda.is_available())
3.10
is it a cuda mismatch?
serene scaffold
please say your OS
vestal siren
serene scaffold
do you know the difference between a list and an array?
yes, an array can only store one data type
lapis sequoia
mint palm
```
import torch
print(torch.__version__)
print(torch.cuda.is_available())
```
thats wrong
mint palm
window 11 insider 22623.891
serene scaffold
one moment.
@mint palm please run pip install https://download.pytorch.org/whl/cu117/torch-1.13.0%2Bcu117-cp310-cp310-win_amd64.whl
mint palm
do i need to remove previous cuda
serene scaffold
no
 serene scaffold
vestal siren
yes, an array can only store one data type
serene scaffold
vestal siren
yes, an array can only store one data type
that's one of the differences. an array also has a fixed shape, and can have more than one dimension.
mint palm
PS C:\Users\rahul> pip install https://download.pytorch.org/whl/cu117/torch-1.13.0%2Bcu117-cp310-cp310-win_amd64.whl
WARNING: pip is being invoked by an old script wrapper. This will fail in a future version of pip.
Please see https://github.com/pypa/pip/issues/5599 for advice on fixing the underlying issue.
To avoid this problem you can invoke Python with '-m pip' instead of running pip directly.
Defaulting to user installation because normal site-packages is not writeable
ERROR: torch-1.13.0+cu117-cp310-cp310-win_amd64.whl is not a supported wheel on this platform.```it might be that pytorch does not provide wheels for win11. I do not know what to do.
if you have the C++ build tools, you might be able to build it from source
vestal siren
serene scaffold
that's one of the differences. an array also has a fixed shape, and can have mor...
Ah I see
I now have this:
#At each node in the tree, the data is split according to a split criterion and each split is passed
#onto the left/right child respectively. Implement the following function to return all rows in X and Y
#such that the left child gets all examples that are less than the split value and vice versa.
def w1_tree_split_data_left(X, Y, feature_index, split_value):
    """Split the data `X` and `Y`, at the feature indexed by `feature_index`.
    If the value is less than `split_value` then return it as part of the left group.

    # Arguments
        X: np.array of size `(n_objects, n_in)`
        Y: np.array of size `(n_objects, 1)`
        feature_index: index of the feature to split at
        split_value: value to split between
    # Output
        (XY_left): np.array of size `(n_objects_left, n_in + 1)`
    """
    X_left, Y_left = None, None
    XY_left = np.empty(0)
    XY = np.append(X, Y)
    n = len(XY)
    for row in range(n):
        if row[feature_index] < split_value:
            XY_left.append(row[feature_index])

    return XY_left
you will not be able to append to XY_left if it is an array, since the shape of arrays cannot be changed.
vestal siren
Ooooo
serene scaffold
if you keep it as a list, you might be able to convert it to an array at the very end, with return np.array(XY_left)
though that might cause an error depending on what is in XY_left
you can also do
return np.array([
    row[feature_index] for row in range(len(XY))
    if row[feature_index] < split_value)
])
and delete the for loop. But that assumes that your current for loop does what you need it to do. It might not.
vestal siren
serene scaffold
if you keep it as a list, you might be able to convert it to an array at the ver...
Yes if do that, I still get the same errors😓
serene scaffold
vestal siren
Yes if do that, I still get the same errors😓
errors? remember to never say that there's an error without showing the error. we don't know what the error is unless you show it.
vestal siren
O true sorry, TypeError: 'int' object is not subscriptable
This is about the if statement line
serene scaffold
that probably means that row is an int. what type do you expect row to be?
vestal siren
I though int?
serene scaffold
what would 5[3] mean?
vestal siren
Not sure exactly? Is that possible?
serene scaffold
it's not.
the [3] part is a subscript, and the error message told you that ints aren't subscriptable.
remember that [ ] is a list when it's by itself, and a subscript when it's on the end of something.
anyway, you have for row in range(n). range(n) is an int iterator. but you named it row, so you probably want a sequence of some kind.
vestal siren
Yes, I wanted to return all rows in X and Y
vestal siren
serene scaffold
anyway, you have `for row in range(n)`. `range(n)` is an int iterator. but you n...
But how should I do it then? I have been stuck on this problem for quite some time now 😦
serene scaffold
vestal siren
But how should I do it then? I have been stuck on this problem for quite some ti...
the actual rows that you want come from X or Y, do they not?
steady basalt
serene scaffold
do you know the difference between a list and an array?
i dont in any meaningful way backend
u referring to numpy array vs python list?
serene scaffold
you create the XY variable and never use it.
serene scaffold
steady basalt
u referring to numpy array vs python list?
yes.
vestal siren
I used that to get the size, so I could iterate over it
steady basalt
what are the main differences?
serene scaffold
vestal siren
I used that to get the size, so I could iterate over it
but you don't actually iterate over it. your loop never touches X, Y, or XY
vestal siren
serene scaffold
but you don't actually iterate over it. your loop never touches X, Y, or XY
I'm confused now haha
serene scaffold
steady basalt
what are the main differences?
they are both sequences where you can overwrite elements, and they are both implemented as contiguous blocks of memory on the hardware side. but those are the only similarities.
arrays have to be homogenous, they can have more than one dimension, and the shape cannot be changed (though elements can be).
lists can be heterogenous, and the length is dynamic. but there is no such thing as a "2d list", because nested lists are entirely separate objects from their container.
serene scaffold
vestal siren
I'm confused now haha
the XY_left array is intended to contain elements from both the X and Y arrays, right?
vestal siren
Yes that is what I thought
serene scaffold
vestal siren
Yes that is what I thought
    for row in range(n):
        if row[feature_index] < split_value:
            XY_left.append(row[feature_index])
at what point in this loop are you getting values from X or Y to go in XY_left?
vestal siren
Oooo now I see
Nowhere
Should it be ```py
for row in X, Y
That's what I had first, but that didn't work either
arctic wedgeBOT
The zip function allows you to iterate through multiple iterables simultaneously. It joins the iterables together, almost like a zipper, so that each new element is a tuple with one element from each iterable.
letters = 'abc'
numbers = [1, 2, 3]
# list(zip(letters, numbers)) --> [('a', 1), ('b', 2), ('c', 3)]
for letter, number in zip(letters, numbers):
    print(letter, number)
The zip() iterator is exhausted after the length of the shortest iterable is exceeded. If you would like to retain the other values, consider using itertools.zip_longest.
For more information on zip, please refer to the official documentation.
steady basalt
serene scaffold
they are both sequences where you can overwrite elements, and they are both impl...
ah ok
arrays more efficient than nested lists then
vestal siren
Oooo okay
steady basalt
i wonder how they get the computer to treat arrays not like nested lists
serene scaffold
steady basalt
ah ok
novices often use "list" and "array" interchangeably, but this is actually just as coherent as using "list" and "tuple" interchangeably.
vestal siren
But what I also didn't understand was that there is hint that says: you can append the output (Y) to the X vector of features so XY will have n_in+1 columns
Could you maybe clarify that that?
serene scaffold
steady basalt
i wonder how they get the computer to treat arrays not like nested lists
it's a contiguous block of memory. so if the array starts at memory address 3000, and it's a (10, 5) shape array, then the last column is every 5th element.
and the computer can get every 5th element efficiently with pointers and some basic math
steady basalt
why does python not want to do that
serene scaffold
steady basalt
why does python not want to do that
because python is intended to be flexible, and it was never intended to be the data science language
serene scaffold
vestal siren
But what I also didn't understand was that there is hint that says: you can appe...
I would need to see examples of an expected input and output tbh
vestal siren
serene scaffold
I would need to see examples of an expected input and output tbh
X = [[ 4.71567238 6.68123077]
[-3.69180559 9.44406079]
[ 2.68261778 -5.94012254]
[-0.23107767 -3.87688414]
[-3.15434128 7.80434338]
[ 9.09166842 -9.08484675]
[ 4.8891211 0.39291965]
[-4.19826749 3.55734465]] And Y =
[[0.]
[1.]
[1.]
[0.]
[0.]
[0.]
[0.]
[0.]]
serene scaffold
vestal siren
X = [[ 4.71567238 6.68123077]
[-3.69180559 9.44406079]
[ 2.68261778 -5.94012...
I still need values for feature_index, split_value and the expected output to know what the function should be.
vestal siren
feature_index = 1
and split_value = 1.9751321507065613
I don't know what the expected output is, because my code doesn't work
(XY_left): np.array of size (n_objects_left, n_in + 1)
serene scaffold
vestal siren
I don't know what the expected output is, because my code doesn't work
you can ask your instructor for test cases 
vestal siren
Unfortunately, he won't provide them😓
I can only run my code code and see if it works
 dusk tide
Is balancing the dataset Is necessary to implement transfer learning??
 vernal anchor
hey can someone help me?
I'm trying to create something like this

I have some values in a list and I want to see how many clusters are created and what are the boundary values of each other
I could really use some help cause I have a deadline coming up
thanks in advance!
oh btw I already asked several times at the help channels but didn't receive much help
 silver widget
Hi all . I need advice on code performance
for col in self.df.select_dtypes(exclude='object').columns:
     self.table.loc[self.table.variable_name == col, f"{self.category}: {cat} \n mean ± sd "] = \
                    f"{self.df[self.df[self.category] == cat][col].mean():.2f} ± " \
                    f"{self.df[self.df[self.category] == cat][col].std():.2f}"
This is my code to create a table(pd.dataframe object) which includes n counts and % of each category of each column
but streamlit raises performance error to change the code to pd.concat(axis=1)
can anyone suggest how to improve the performance here?
 zenith shard
You're doing self.df[self.df[self.category] == cat] multiple times
you can do it once and cache the result
 desert oar
silver widget
Hi all . I need advice on code performance
```
for col in self.df.select_dtypes...
desert oar
silver widget
Hi all . I need advice on code performance
```
for col in self.df.select_dtypes...
!code note that you might want to use code formatting to make this easier to read, see below for instructions:
arctic wedgeBOT
Here's how to format Python code on Discord:
```py
print('Hello world!')
```
These are backticks, not quotes. Check this out if you can't find the backtick key.
silver widget
desert oar
!code note that you might want to use code formatting to make this easier to rea...
Thank you, sorry for the inconvenience. Editing now
desert oar
vernal anchor
I have some values in a list and I want to see how many clusters are created and...
my go-to algorithm for clustering with an unknown number of clusters in an unfamiliar feature space is hdbscan
desert oar
silver widget
Can you show me an example how to do it in one iteration?
just save df[category] == cat to a variable and use the variable. remember that pandas is just a python library, and you can still use all the normal python language features like saving variables and defining functions
also just for your own sanity, i'd avoid doing computations inside f-strings. makes the code hard to follow
for col in self.df.select_dtypes(exclude='object').columns:
     colname = f"{self.category}: {cat} \n mean ± sd "
     mask = self.df[self.category] == cat
     m = self.df[mask, col].mean()
     s = self.df[mask, col].std()
     self.table.loc[self.table.variable_name == col, colname] = f"{m:.2f} ± {s:.2f}"
here's how i'd rewrite your code @silver widget . but again i think we can make this even more efficient
also, this looks questionable self.table.variable_name == col
 fallen crown
Hi, i don't understand something with my model, I used the same dataset for training and validation so my score should be equal to 1 ? But it is actually equal to 0.83, does somebody have an idea of what happens ?
desert oar
fallen crown
Hi, i don't understand something with my model, I used the same dataset for trai...
most models can't reach 100% accuracy even on a training set
fallen crown
okkey thanks !
desert oar
@fallen crown as always, i suggest working through some actual equations and convincing yourself of this, instead of taking my word for it
consider the model y = ax + b with parameters a,b, but try to fit that to data generated from y = x^2 + 3
@silver widget self.table probably should be using variable_name as its index, unless you already have another index that you are using
fallen crown
desert oar
consider the model `y = ax + b` with parameters `a`,`b`, but try to fit that to ...
i gonna try
desert oar
also @silver widget what are self.category and cat? i assume the former is supposed to be a column name and the latter is supposed to be a specific value thereof?
 river sapphire
how does backpropagation work with 2 or more hidden layers?
desert oar
river sapphire
how does backpropagation work with 2 or more hidden layers?
same as with 1 🙂 that's the beauty of it
river sapphire
desert oar
same as with 1 🙂 that's the beauty of it
wait can you expand so it's like you calculate the chain derivative paths
silver widget
desert oar
also <@332642267565391882> what are `self.category` and `cat`? i assume the form...
Exactly.
desert oar
@river sapphire the chain rule uses multiplication, not addition. but yes, you end up with a separate partial derivative for every single weight in the model
river sapphire
desert oar
<@1005111740943568947> the chain rule uses multiplication, not addition. but yes...
no i'm talking about

the article i'm reading says to add the orange and blue essentially
desert oar
can you post the article?
river sapphire

Jeremy Jordan
In my first post on neural networks, I discussed a model representation for neural networks and how we can feed in inputs and calculate an output. We calculated this output, layer by layer, by combining the inputs from the previous layer with weights for each neuron-neuron connection. I mentioned that
this is what they said

but from what i'm understanding if I have say a weight^1 subscript 11 with 2 hidden layers and 2 hidden nodes per layer with 2 outputs
that weight would affect the 1st node in the 1st hidden layer but also all the nodes in the second hidden layer
which would affect all the outputs so i'm wondering how you would calculate the chain derivative path
or I mean better stated how would you calculate the partial derivative of the total error with respect to that weight
desert oar
@river sapphire i see, is this a network with two outputs?
river sapphire
desert oar
<@1005111740943568947> i see, is this a network with two outputs?
yes
desert oar
river sapphire
that weight would affect the 1st node in the 1st hidden layer but also all the n...
this is precisely what the chain rule is for!
river sapphire
so do you calculate all the chain derivative paths then add them?
desert oar
remember that we are interested in the vector of partial derivatives with respect to every individual weight
river sapphire
i'm kinda confused
desert oar
don't guess at the math here
go back to one output
rather, start there
and look at how the article builds this up from the loss function. remember that we are computing the gradient of the loss function, so we must start there
the sum arises because, in the words of the article:
Because our cost function is a summation of individual costs for each output, we can calculate the derivative chain for each path and simply add them together.
you also need to sum up over observations in the dataset/batch
but that's because the derivative of a sum is just a sum of the derivatives. the important part is understanding each of those summed-up derivatives, and that's the chain rule.
wooden sail
hmm
ah for a moment i thought linearity was being conflated with chain rule, but no. all good 😛
desert oar
phew, i get nervous when i'm talking about neural network math and you or emyrs or squiggle show up to correct me 😆
river sapphire
wait ok so
 serene scaffold
I feel excluded. but you're right 😢
desert oar
serene scaffold
I feel excluded. but you're right 😢
hey i didn't mean to enumerate everyone, just the people that know the NN stuff better than me!
serene scaffold
that's my point 
river sapphire
shoot i'm still confused
desert oar
river sapphire
shoot i'm still confused
i'm going to suggest spending a bit more time working through the equations, rather than looking at the diagrams
it seems like you're focused on the latter too much
i also am going to suggest not reading past the "Generalizing a Method" headline until you get the first part comfortably. because understanding the first part is essential to making sense of the "generalizing" part
it sounds incredibly tedious, but sit down with a notepad and try to re-derive the equations that the author derived
river sapphire
alright
desert oar
maybe not all of them because that's a lot of writing, but derive one of the "layer 1" partial derivatives and one of the "layer 2" partial derivatives
remember: you're looking for the partial derivative of the loss function with respect to one of those parameters. stay focused on that and your calculus fundamentals, and you should be OK.
wooden sail
in the same link you shared, you should really focus on the case with a single "hidden layer"
the rest kinda telescopes from there quite naturally
river sapphire
ok I'll try that
wooden sail
this is basically all you'll need
 river sapphire
for the notation of the biases do you say b^1 or b^2
desert oar
notation whenever you have multiple "indexes" always gets messy
river sapphire
desert oar
notation whenever you have multiple "indexes" always gets messy
yeah it confuses me a lot
desert oar
when i write these things by hand, i do use superscript indexes, but i try to write them a bit lower than i would write an exponent
wooden sail
the best kept secret in math is that the notation means nothing alone 😛 you can define whatever notation you want, and that is also what everyone else does. so the first thing to do when reading something is figure out what the specific notation in what you're reading means
river sapphire
the problem is when the notation everyone else uses in their articles is one that you don't understand
desert oar
you can also put a , in the subscript to separate different indexes, or another option is to write each item as if it were a function, using () and no subscripts. or you can even use numpy-style array indexing
desert oar
river sapphire
the problem is when the notation everyone else uses in their articles is one tha...
notation in machine learning articles is notoriously sloppy and inconsistent. don't feel bad
wooden sail
it helps if you take a moment with pen and paper to translate the expressions into the notation you prefer
(and it's essentially necessary as you move into more complex reads)
fallen crown
@desert oar I use a linear regression model and fit it with data generated from y = x**2+3 like that ```python
x = np.arange(1,50)
y = np.array(list(map(lambda x : x**2+3, dataset)))
model = LinearRegression()
X = x
Y = y
X = X.reshape(49,1)
Y = Y.reshape(49,1)
model.fit(X,Y)
model.score(X,Y)```score is 0.93
desert oar
fallen crown
<@389497659087650836> I use a linear regression model and fit it with data gener...
try it from -25 to 25
desert oar
fallen crown
But i still don't get it.... What is the meaning of 0.93
it's whatever the score function means. in this case you'll need to check the scikit-learn docs to see what the default scorer is for linear regression. possibly r-squared, but i wouldn't want to guess.
as for what each score function means, that depends on the score function
wooden sail
in general though, the value of the score alone means nothing 😛
you don't actually care about the minimum, you care about the minimizer (the parameters)
desert oar
wooden sail
in general though, the value of the score alone means nothing 😛
in scikit-learn the score isn't necessarily the objective function
the objective function is treated like an implementation detail in sklearn
wooden sail
even so, it's useful to keep in mind that no single metric or score can tell you the whole story
desert oar
very true
also in the case of LinearRegression specifically, .score is r-squared https://scikit-learn.org/stable/modules/generated/sklearn.linear_model.LinearRegression.html#sklearn.linear_model.LinearRegression.score
scikit-learn
Examples using sklearn.linear_model.LinearRegression: Principal Component Regression vs Partial Least Squares Regression Principal Component Regression vs Partial Least Squares Regression Plot indi...
r-squared is also called the "coefficient of determination" which other people have explained better than i can https://stats.stackexchange.com/questions/tagged/r-squared https://en.wikipedia.org/wiki/Coefficient_of_determination

Cross Validated
Q&A for people interested in statistics, machine learning, data analysis, data mining, and data visualization
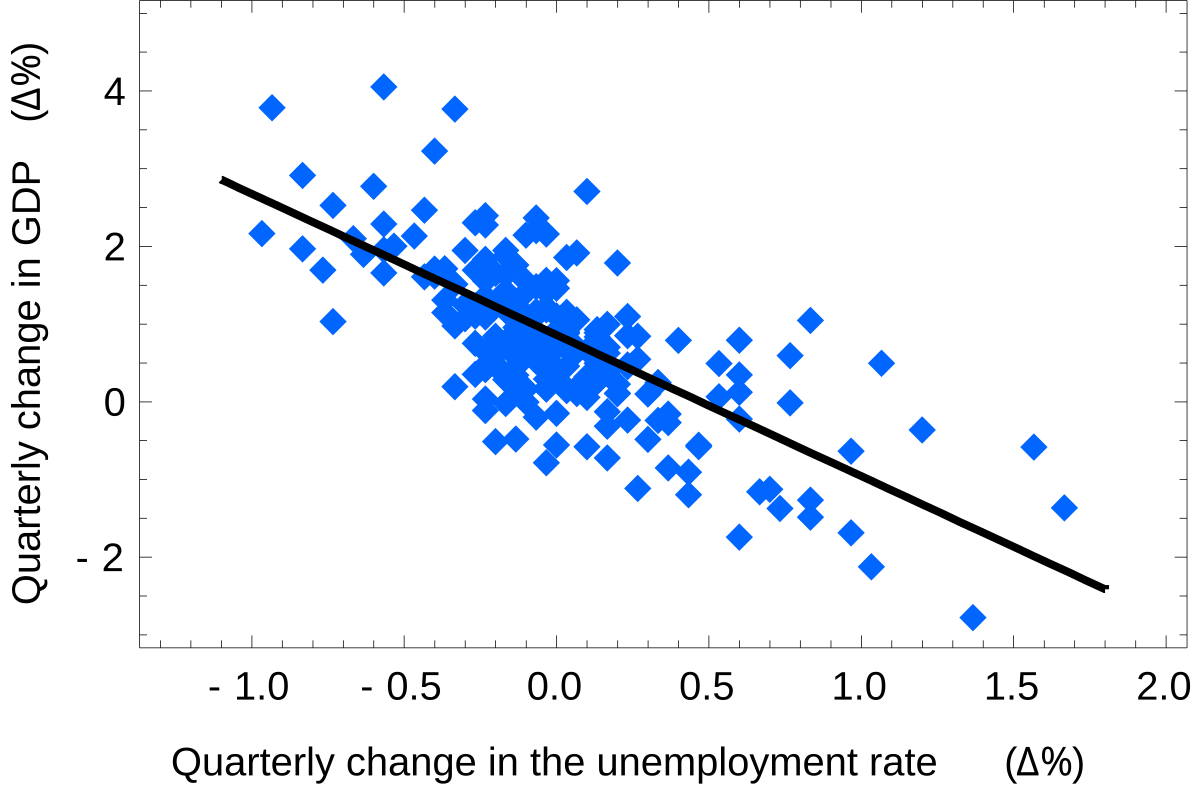
In statistics, the coefficient of determination, denoted R2 or r2 and pronounced "R squared", is the proportion of the variation in the dependent variable that is predictable from the independent variable(s).
It is a statistic used in the context of statistical models whose main purpose is either the prediction of future outcomes or the testing ...
wooden sail
r-squared is also an affine transformation of the usual 2-norm error/euclidean distance/mean squared error
just scaled and shifted
desert oar
hm, that's one way to think about it. but the scale and shift is dependent on the data
wooden sail
yes, but those things don't affect the gradient. the constant vanishes and the scale is multiplied to all the gradients
so in that sense it's equivalent
you could choose r-squared as your cost func and you'd get exactly the same parameters as output
desert oar
true, so it's an affine transformation of the loss function when fitting with least squares
the statistical interpretation though is that it's the % of variance in y explained by variance in x
wooden sail
indeed
vestal siren
def w2_flatten_forward(x_input):
    """Perform the reshaping of the tensor of size `(K, L, M, N)`
        to the tensor of size `(K, L*M*N)`
    # Arguments
        x_input: np.array of size `(K, L, M, N)`
    # Output
        output: np.array of size `(K, L*M*N)`
    """
    vol_shape = x_input.shape[:-1]
    n_voxels = np.prod(vol_shape)
    output = x_input.reshape(n_voxels, x_input.shape[-1])
    return output
Question: The Flatten layer receives a 4-dimensional tensor of size (n_obj, n_channels, h, w) as its input and reshapes it into a 2-dimensional tensor (matrix) of size (n_obj, n_channels * h * w).
Can anyone help my why I get a wrong output?
wooden sail
you're doing something weird
also it seems they want you to unfold in fortran order
my suggestion would be return x_input.reshape(x_input.shape[0], -1, order='F')
what's your thinking when doing vol_shape = x_input.shape[:-1] ?
lookie here
!e
import numpy as np
x = np.zeros((2,3,4,5))
print(x.shape[:-1])
@wooden sail :white_check_mark: Your 3.11 eval job has completed with return code 0.
(2, 3, 4)
what that does is ignore the last index, when what you want is to only keep the first
if anything you could've used 1:
vestal siren
wooden sail
what's your thinking when doing vol_shape = x_input.shape[:-1] ?
Oh I did that because you can think of the 4D array as a sequence of 3D volumes, but that didn't work😅
wooden sail
that's the same as i did, but you counted from the wrong direction :p
vestal siren
Oh wait, if I replaced it by 1, I get this error: ValueError: cannot reshape array of size 76800 into shape (100,16)
vestal siren
wooden sail
my suggestion would be return x_input.reshape(x_input.shape[0], -1, order='F')
I tested your suggestion and it worked on the test case! but it failed some local tests...
are there maybe some edge cases that are missing?
wooden sail
no
it does exactly what you asked for for any 4D array
keep the 1st dimension untouched and unfold the other 3
if you want a special unfolding order different from fortran order/matlab unfolding order, some changes are needed. but given that you said it worked on the test case, it should be fine
what are you testing it on
vestal siren
Automark in notebook
vestal siren
test_input = np.zeros((100, 3, 16, 16))
print(w2_flatten_forward(test_input).shape)
This was in the description: You can use test data and compare the final shape. It should be (100, 768) for the following example.
Please ignore the use of np.zeros in this case. We are just interested in transforming shapes.
Be aware: This test will fail if you do not return an array like object!
wooden sail
sure, so
!e
import numpy as np
x = np.zeros((100,3,16,16))
x = x.reshape(100, -1, order='F')
print(x.shape)
order='f' is fortran order right?
arctic wedgeBOT
@wooden sail :white_check_mark: Your 3.11 eval job has completed with return code 0.
(100, 768)
yes
vestal siren
Hmm, then I'm not sure why it would fail
wooden sail
it could be that the test cases ignore the ordering. you can remove the order='F' part and try it out
 bitter wasp
@wooden sail
wooden sail
though that's technically wrong
bitter wasp
Hey Edd
wooden sail
yeah well, that's also transposing
bitter wasp
Is there anyone have Discord bot py system code?
wooden sail
i would argue it's incorrect because the size of the first dimension SEEMS the same as in the original array, but the samples are now different!
look at this example
!e
import numpy as np
x = np.random.rand(2,3)
print(x)
print(x.reshape(6, order='F'))
print(x.reshape(6))
@wooden sail :white_check_mark: Your 3.11 eval job has completed with return code 0.
001 | [[0.59967224 0.86778639 0.86594742]
002 |  [0.50774334 0.52727131 0.88028635]]
003 | [0.59967224 0.50774334 0.86778639 0.52727131 0.86594742 0.88028635]
004 | [0.59967224 0.86778639 0.86594742 0.50774334 0.52727131 0.88028635]
there we go
vestal siren
Aha
wooden sail
look at the first column in the matrix. it has 0.599 etc, then 0.5077 etc
so if i do something that preserves the size of this first dimension (the columns), i would also expect the samples themselves to remain the same
vestal siren
Ooo I see
wooden sail
so with order='F' we stack the columns on top of each other. but if you remove that, numpy uses C ordering by default, which stacks ROWS, not columns
that preserves the entries of the rows, and in doing so shuffles the columns
i would claim reshaping this way makes no sense 😛 but anyway. ask your lecturer to be clear with the ordering because it matters
vestal siren
Yes I will for sure ask about this
Thanks for your help!
I also had another question about decision trees
wooden sail
i have to go sleep :x someone else will help you out
 soft badge
Guys what do you recomend for learn machine learning
serene scaffold
soft badge
Guys what do you recomend for learn machine learning
!resources data-science
arctic wedgeBOT
Resources
The Resources page on our website contains a list of hand-selected learning resources that we regularly recommend to both beginners and experts.
soft badge
!resources data-science
arctic wedgeBOT
Resources
The Resources page on our website contains a list of hand-selected learning resources that we regularly recommend to both beginners and experts.
serene scaffold
soft badge
!resources data-science
you're supposed to click the link from the bot
serene scaffold
soft badge
do you guess dificult learn this?
people study for years to be able to do machine learning professionally, yes
serene scaffold
I'm sorry, but I do not understand what you are saying.
soft badge
I say to develop applications with machine learning, do you need to have a high level of knowledge?
serene scaffold
soft badge
I say to develop applications with machine learning, do you need to have a high ...
do you want to do that professionally, or for fun?
soft badge
professional
serene scaffold
soft badge
professional
and you're in italy, yes?
river sapphire
according to wolfram it says:

and this is the cost function they used in the article i'm reading

but the article i'm reading says this:

wouldn't it be a - y?
desert oar
river sapphire
but the article i'm reading says this:
why would it be?
river sapphire
they're saying you take the derivative of the cost function with respect to the output
desert oar
a being the model output?
river sapphire
yes
desert oar
what's f'?
river sapphire
that one's just the partial derivative of the output with respect to the activation function
desert oar
is f the activation function?
river sapphire
wait
desert oar
can you share the actual article?
river sapphire
now i'm confused lol
it's the same article
Jeremy Jordan
In my first post on neural networks, I discussed a model representation for neural networks and how we can feed in inputs and calculate an output. We calculated this output, layer by layer, by combining the inputs from the previous layer with weights for each neuron-neuron connection. I mentioned that
river sapphire
a would be the activated version of z
desert oar
i don't particularly like their notation here
river sapphire
yeah it's kinda confusing
desert oar
the (3) and a are both somewhat nonstandard and therefore mysterious
i suppose they mean a to be mnemonic for "activation", which makes sense
i see, a(3) is the activation after layer 3, treating the input as layer 1
river sapphire
i have no clue what the f'(a(3)) means
desert oar
i don't know why they didn't call the input layer 0
but okay, fine. a(3) is the output of the 3rd layer including activation function, which in this case is the output layer, and therefore the output of the entire model
river sapphire
a(3) would be the final output wouldn't it
desert oar
yep
river sapphire
so why do they do f'(a(3))?
desert oar
i'm getting there 😛
https://www.jeremyjordan.me/content/images/2017/07/Screen-Shot-2017-07-16-at-1.42.55-PM.png yeah okay, the notation is a little funny but the diagram is good
 river sapphire
wouldn't it be like a'(3)
desert oar
hang on, still getting there 😛
ah, you're getting into the "Generalizing a method" part now
river sapphire
yeah the part where the combine first and second column
desert oar
i think this is meant to sketch out the general form of these δ things
i think it's meant to be a placeholder for "the derivative of some other function, evaluated at a(3)"
meaning that δ(3) has this very general format, no matter what else is in layers 1 and 2
river sapphire
no it says they're combining the first and second column so
that means combining these
 river sapphire
my first question was what mysterious function is f being performed on a
or is that just to indicate the partial derivative of a with respect to z?
desert oar
yes, i think that's what f'(a(3)) is supposed to be
and i think the author is trying to de-emphasize what exactly f' looks like, in order to make the rest of the "shape" of the expression clearer
desert oar
it was confusing to me too, they didn't explain it
river sapphire
also second question say m=2 therefore the cost would be 1/2 * (y - a)
desert oar
i only understood what it meant because i know that the first factor must be (1/m) (y - a(3)), hence the other factor must be the f'(a(3))
river sapphire
the partial derivative of the cost with respect to a should be a - y according to wolfram
desert oar
river sapphire
also second question say m=2 therefore the cost would be 1/2 * (y - a)
careful now. the cost is (1/2) (y[i] - a[i])^2) for each data point i. you need to add those costs up across all data points in the training set (or batch)
river sapphire
oh so it would be 1/2 * ((y[i] - a[i])^2 + (y[i2] - a[i2])^2)?
desert oar
oh sorry. the (1/2m) is in front
river sapphire
but then they say 1/2m sigma (y[i] - a[i])^2
desert oar
so the loss for 2 data points is (1 / 2) * (1 / 2) * ((y[1] - a[1])^2 + (y[2] - a[2])^2)
river sapphire
yes then the partial derivative would be what then
of the cost function with respect to the neural network outputs
desert oar
with respect to a[i]? that's a good homework assignment 😛
don't use wolfram alpha! this is power rule & chain rule, you should be able to eyeball this with some practice
river sapphire
I know it's just i'm confused because other websites said it's a - y but when I did it it was different
desert oar
well you can write a - y or y - a and it's the same, because you're squaring it
stick to whatever the author does, to keep your life simple
river sapphire
no the derivative
desert oar
just take the derivative of the loss function as written, don't worry about what other websites say
river sapphire
ok one last question so in your calculation of the loss for 2 data points
you said 1/2 * 1/2 right
oh wait ok so it's 1/4 * the entire squared error loss?
desert oar
river sapphire
oh wait ok so it's 1/4 * the entire squared error loss?
yeah, but it might be easier to do this if you leave m as m instead of filling it in with 2
then you results will match the author's
river sapphire
why do some people use sigma 1/2(target-output)^2
river sapphire
yeah
no like there's a difference because if you put 1/2 outside the sigma
it's saying 1/2 times the squared error loss
but when you put it inside it's saying 1/2 * each loss
this is confusing to explain i'll just show you an image
desert oar
i see your confusion
river sapphire
 desert oar
you know that the big sigma means "summation" right?
river sapphire
yes
desert oar
do you agree that these two are equivalent @river sapphire ?
c*a[1] + c*a[2] + c*a[3]

c * (a[1] + a[2] + a[3])
well there's your answer 🙂
desert oar
river sapphire
why does this person drop the m though
because technically it doesn't matter what the factor in front is. you get the same fitted model either way
river sapphire
oh
desert oar
the 1/2 just makes the output nicer when you apply the power rule
(which you will hopefully see when you work through it)
it's a general fact about convex optimization that a monotonic transformation of the function being maximized does not change the argmax
draw some pictures and convince yourself of that
river sapphire
ok
rugged comet
Bumping this question
#data-science-and-ml message
soft badge
guys about study of ia, is most theoric or practice?
iron basalt
rugged comet
I've never seen loss and accuracy graphs shaped like this before. The validation...
The training and validation are unrelated. The data was not shuffled. The data is not balanced. There is a bug where the training results are not being applied during validation. The model is designed in a way that it extremely overfits.
*And any other bugs.
rugged comet
iron basalt
The training and validation are unrelated. The data was not shuffled. The data i...
The data was not shuffled
https://www.tensorflow.org/api_docs/python/tf/keras/Model#fit
shuffleis a kwarg that is set toTrueby default though.
The data is not balanced.
I'll check this. Thanks for the idea.
iron basalt
river sapphire
or is that just to indicate the partial derivative of a with respect to z?
Yes, consider that the derivative of say, sigmoid is f(x)(1-f(x)), replacing f(x) with a, we get a(1-a), we can say that we have some function that takes a as input (previously computed).
I would not have written it this way though.
But this kind of loose notation with pattern matching required by the reader is common in ML.
iron basalt
rugged comet
> The data was not shuffled
https://www.tensorflow.org/api_docs/python/tf/keras/...
Yeah i'm just listing some things for you to consider.
rugged comet
Thank you.
soft badge
squiggle, for learn machine learning what do you recommend?
serene scaffold
@soft badge I don't think you answered my earlier question. or you didn't ping me when you did.
serene scaffold
soft badge
guys about study of ia, is most theoric or practice?
Anyway, "theory vs practice" is often a false dichotomy. but AI does require a lot of theoretical knowledge that isn't really part of programming.
soft badge
serene scaffold
and you're in italy, yes?
no friend
soft badge
serene scaffold
Anyway, "theory vs practice" is often a false dichotomy. but AI does require a l...
IA is math pure right?
serene scaffold
soft badge
IA is math pure right?
it's "AI" in English--some people might not infer that you mean "inteligencia artifical", or what have you.
AI is closer to pure math than it is to software development. and it can be described using only mathematical constructs. but I don't know where something stops being "pure math".
desert oar
rugged comet
I've never seen loss and accuracy graphs shaped like this before. The validation...
overfitting
@rugged comet that chart is such a bad example of overfitting that i suspect there's a bug in how you're using the validation data
like you're using the wrong dataframe, or it contains all the same value, or something else weird
soft badge
serene scaffold
it's "AI" in English--some people might not infer that you mean "inteligencia ar...
mean, and using function that have in math
for example i an studying on course of IBM
but have concepts that i search other content for explain
iron basalt
soft badge
squiggle, for learn machine learning what do you recommend?
Reading books, papers, and implementing things from scratch, even computing by hand on paper. Make sure your mathematical fundamentals are solid and try applying that math to problems other than ML for practice (random fun example: https://massaioli.wordpress.com/2013/01/12/solving-minesweeper-with-matricies/ (I spend my free time on random problems like this / I do math for fun)). It's hard to really recommend something since a lot of what I know just came from random problem solving over a long period of time. Books are great, but they are a starting point or for when i'm in the mood for the "pure" math / want to do some formal proofs (which I also enjoy).

What is your motivation for writing this? Note: skip to the next section if you don’t care about the back-story and want to get straight to the actual algorithm. Back in 2008 I was starting C…
As for AI, that is even more difficult, as it's even more scattered knowledge, much of which came from finding the right people online and in person / connecting with the lineage of ideas (some dating back to the late 1800s).
soft badge
ok, cool, I start to study but I seem to not learn or forget, do you have any tips?
iron basalt
soft badge
ok, cool, I start to study but I seem to not learn or forget, do you have any ti...
Yes, you need to solve problems as described. Ones that you find interesting, then you are less likely to forget.
serene scaffold
iron basalt
Reading books, papers, and implementing things from scratch, even computing by h...
.bm
strange elbowBOT
Click the button to be sent your very own bookmark to [this message](#data-science-and-ml message).
soft badge
for example is it better to focus on one topic eg decorators know everything or give an introduction at the beginning and focus on the most important things at the beginning?
iron basalt
The problems found in many text books are for one specific aspect (e.g. "now prove that this is continuous at x0"), but the more interesting problems are ones that require multiple ideas at the same time. Such problems are more difficult, but because they kind of have a "journey" to them, they are memorable, like a story.
It's hard to remember specific little things without a bigger picture / story.
It needs to fit in with something else, for your associative memory (ML concept too) to be fully utilized.
(*It's also why traditionally things such as a tribe's morals and which animals (such as snakes) to stay away from, etc, come in the form of stories)
soft badge
understood, make sense
i was studying programming, hacking and IA in same day
do you guess interisting focus in one?
river sapphire
confused on what this equation means

so it mentioned proportional error meaning if we multiplied columns 1 and 2 (δ) by column 3 it would give us a measure of proportional error

then it says
We'll also redefine δ for all layers excluding the output layer to include this combination of weighted errors.
i'm not sure what to say i'm confused on what's going on in that equation
river sapphire
river sapphire
confused on what this equation means
so δ_i(l+1) means the error and the theta symbol represents the weight on layer l connected to node i on the next layer and coming from node j of layer l
it said excluding the output so this equation wouldn't work on the output layer correct?
wait what's n again
n is the number of nodes in the layer I think
not sure they didn't define what n is
rugged comet
iron basalt
The training and validation are unrelated. The data was not shuffled. The data i...
The data isn't really balanced.
 river sapphire
confused on what this equation means
river sapphire
river sapphire
confused on what this equation means
figured it out, the matrix equation helped me understand it more
 iron basalt
river sapphire
figured it out, the matrix equation helped me understand it more
iron basalt
river sapphire
figured it out, the matrix equation helped me understand it more
Individual indices notation can be much more difficult to work with instead of just using matrix/vector notation.
wooden sail
though to derive matrix calculus identities in the first place one usually has to go indexwise anyway :p it just using them tho, yea
rugged comet
@desert oar Did you have a chance to look at the notebook?
Here is the most recent version with weighted classes.
https://www.kaggle.com/code/urkchar/determine-if-tweet-is-about-disaster
Explore and run machine learning code with Kaggle Notebooks | Using data from Natural Language Processing with Disaster Tweets
 fervent hatch
is it possible to predict the result of 3 dice based from how high I drop those dice from and the side of the dice that is on top?
wooden sail
statistically the chance is the same regardless of that if it's a fair die. if not, you could possibly do it with several thousands of examples. but what you're asking is really more in the direction of a physical simulation, where you'd solve differential equations to model the die
fervent hatch
wooden sail
statistically the chance is the same regardless of that if it's a fair die. if n...
so is it possible to like use prediction models? given i have like a dataset with 2k dice roll simulation
wooden sail
2k is probably too few
and the amount of things you would be able to model would be very limited
i wouldn't trust such a model to work in general unless you can exactly reproduce the throwing conditions
fervent hatch
wooden sail
i wouldn't trust such a model to work in general unless you can exactly reproduc...
how about if my features are just like the 4 sides of the dice (left, top, right and front) and their outcome?
wooden sail
6, you mean
what you'll get is effectively the same as a histogram
there are already optimal strategies to pick the outcome without using machine learning
fervent hatch
we just used the 4 sides as our features for the dice initial state and we are like required to use machine learning to predict the outcome
fallen crown
Hi i am trying to add to add a legend to my iris dataset but i don't know how to do it....

 finite knoll
Hi everyone. I seem to be having a very basic problem with manipulating data in pandas.
I wrote this line of code which, in theory, should act as a simple if statement when creating new columns. Create columns A2, B2, C2. If column D has value "HRK" then take values from A, B, C and divide them by 7.
I get a successfull load of data, but the new columns are not dividede by 7.
When it's out of the where syntax, then it works normally. I know that I am missing a step here as probably Python is not sure how to divide the columns. I just don't know how to tell him to divide each column by 7.
df[['A2','B2','C2']] = df[['A','B','C']].where(df['D'] == 'HRK', df[['A','B','C']] / 7 )
mighty patio
fallen crown
Hi i am trying to add to add a legend to my iris dataset but i don't know how to...
Easiest way is to slice your dataset before you plot it, and then plot each category with its corresponding label
I assume you have some category variable in addition to the color
import numpy as np
import matplotlib.pyplot as plt
x = np.random.random(25)
y = np.random.random(25)
categories = np.random.random_integers(0,2, 25)
def graphique():
    fig, ax = plt.subplots()
    for cat in range(3):
        ax.scatter(x[categories == cat], y[categories == cat], label = f"category: {cat}")
    ax.legend()
graphique()
 river sapphire
so in the article i'm reading it says equal to [s_1(2) s_2(2)]
https://www.jeremyjordan.me/neural-networks-training/

Jeremy Jordan
In my first post on neural networks, I discussed a model representation for neural networks and how we can feed in inputs and calculate an output. We calculated this output, layer by layer, by combining the inputs from the previous layer with weights for each neuron-neuron connection. I mentioned that
but when I multiplied the matrices I got

do I add the 1st row and 1st column and the 2nd row and 1st column?
and do the same for the 2nd column?
how do they get a matrix of 1 * 2?
lapis sequoia
finite knoll
Hi everyone. I seem to be having a very basic problem with manipulating data in ...
!d pandas.DataFrame.divide
arctic wedgeBOT
DataFrame.divide(other, axis='columns', level=None, fill_value=None)```
Get Floating division of dataframe and other, element-wise (binary operator truediv).

Equivalent to `dataframe / other`, but with support to substitute a fill\_value for missing data in one of the inputs. With reverse version, rtruediv.

Among flexible wrappers (add, sub, mul, div, mod, pow) to arithmetic operators: +, -, *, /, //, %, **.This would prob work, tho I guess you may have some different issue.
Why don't you share the exact error?
finite knoll
lapis sequoia
Why don't you share the exact error?
there is no error. The code just doesn't do anything. I will try divide. Migh have placed it in the wrong spot.
lapis sequoia
why do we need df.where here tho? np.where should be sufficient.
finite knoll
I will give it a go. I might have skipped some fundamentals concerning code structure.
 lapis sequoia
finite knoll
Hi everyone. I seem to be having a very basic problem with manipulating data in ...
lapis sequoia
finite knoll
Hi everyone. I seem to be having a very basic problem with manipulating data in ...
What would be the value here if D is not HRK?
finite knoll
lapis sequoia
What would be the value here if D is not HRK?
should be the same as columns A B C. If D is HRK, values from those columns should be divided by 7
lapis sequoia
Oh right. hold on.
lapis sequoia
finite knoll
should be the same as columns A B C. If D is HRK, values from those columns shou...
this is working fine.

you are making new cols, lemme see if that works.
That is working fine as well.
 torn hull


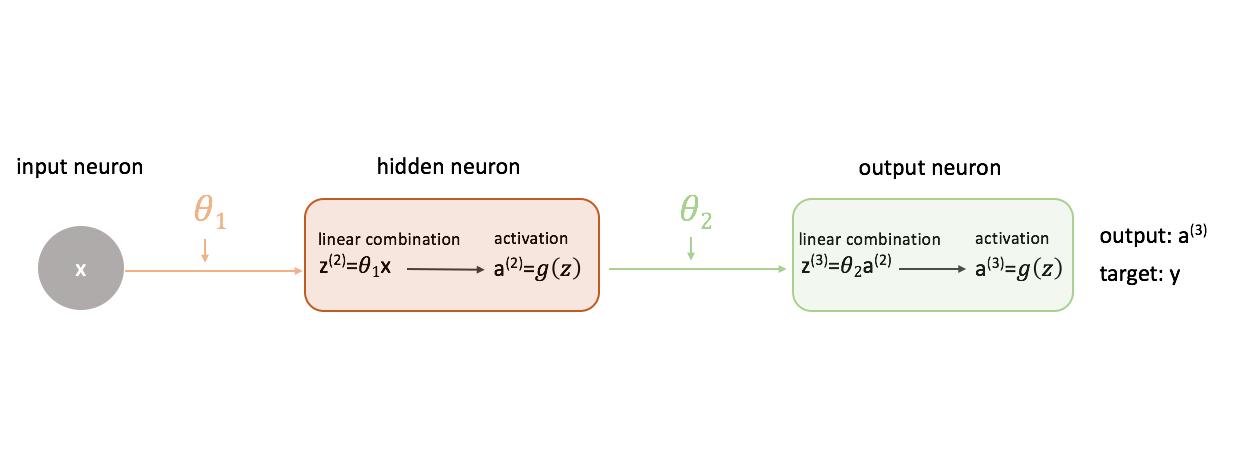 finite knoll
lapis sequoia
this is working fine.
finite knoll
lapis sequoia
this is working fine.
I don't get it. I got the exact form in my code. I checked that it's a good datatype. :/
finite knoll
lapis sequoia
this is working fine.

 lapis sequoia
finite knoll
lapis sequoia
finite knoll
My guess would be you may be making some silly mistakes.
 spice edge
Hello, I have a question, how can i convert nested list into numpy to prevent the Value error : failed to convert a Numlpy array to a Tensor
lapis sequoia
spice edge
Hello, I have a question, how can i convert nested list into numpy to prevent th...
np.array(list) works just fine.
spice edge
but then i still have this error :/
lapis sequoia
Because I think your error is saying you have a numpy array and you cant convert it to tensor.
spice edge
do you know what can be the possible reason for this problem of conversion to a tensor ?
lapis sequoia
The data, gotta see what the data is.
spice edge
hm can i share the data here or should i open a help session ?
lapis sequoia
You can share here.
finite knoll
lapis sequoia
My guess would be you may be making some silly mistakes.
eh probably. I will check it out more and post a solution
spice edge
lapis sequoia
You can share here.
The data are generated by different function so it not like a panda dataframe or csv. I posted the code on stackoverflow so it's easier to copy paste it. Can I share the link here ?
lapis sequoia
spice edge
The data are generated by different function so it not like a panda dataframe or...
you can. sure.
spice edge
lapis sequoia
you can. sure.

Stack Overflow
Hello I am trying to generate synthetic data to use them as input inside a simple model for now.
Here is the code for creating the generic data:
trajectories = 200
y = 20 #degrees
ns0 = 180 #contact
Thanks :)
Tell me if there is any errors.
lapis sequoia
spice edge
Tell me if there is any errors.
Give me shapes of X and y.
spice edge
it's says (200,) for both of them
lapis sequoia
Given your model shouldn't it be like (200, 64) and (200,) ?
And given this code
RUL = []
for i in range(len(finalDays)):
    rulTemp = [np.max(finalDays[i]) - x for x in finalDays[i]]
    RUL.append(rulTemp)
I expect RUL to be a 2D array
lapis sequoia
yep.
spice edge
Thanks
 robust cliff
someone told me to ask here: https://paste.pythondiscord.com/qajoreroco i'm getting this error when running
py -m pip install scikit-image
it would be dope if someone figured out what the hell is happening
it's trying to build binaries for some reason i don't know
python: 3.11 (tried with 3.8 and does the same)
os: windows 11
wheel is on the latest version
so is pip
tidal bough
robust cliff
it's trying to build binaries for some reason i don't know
it's trying to build binaries for some reason i don't know
well, I can answer that at least - it's because it doesn't have wheels for 3.11 yet, only 3.10.
 robust cliff
that does the same exact thing on python 3.8 tho
tidal bough
Now that's somewhat strange, it does have 3.8 wheels. For python3.8, did you update pip and setuptools? That might help.
tidal bough
well, it's a different package from scikit-image, which is the one that's failing to build for you on 3.11
why would it build scipy, though, it has wheels for 3.8?..
try with --only-binary, perhaps?
robust cliff
like this pip install --only-binary scikit-image
tidal bough
yeah
tidal bough
"pip install --only-binary scikit-image scikit-image"? did you put scikit-image twice?
though strange either way
try maybe pip install --only-binary scipy and see if that works
robust cliff
i put it twice because it would not work with just one
ERROR: You must give at least one requirement to install (see "pip help install")
tidal bough
great, still don't see why it didn't just work normall though - pip is supposed to prefer wheels by default
What's your pip --version?
robust cliff
pip 22.3.1 from c:\users\dbuon\appdata\local\programs\python\python38-32\lib\site-packages\pip (python 3.8)
did i somehow mess with pip settings without noticing?
tidal bough
ooh. That's the latest pip version, but you're apparently using 32-bit python.
robust cliff
OHZAM
tidal bough
That might be the reason, I guess?
robust cliff
ig i downloaded the 32 bit installer without noticing
still would you mind explaining the difference of pip being used by python 32 bit vs 64 bit?
tidal bough
I'm not sure still why 32-bit python would cause that problem... did pip mention the exact name of the wheel it downloaded for scipy?
robust cliff
Collecting scipy>=1.4.1
Downloading scipy-1.9.1-cp38-cp38-win32.whl (34.5 MB)
━━━━━━━━━━━━━━━━━━━━━━━━━━━━━━━━━━━━━━━━ 34.5/34.5 MB 6.4 MB/s eta 0:00:00
robust cliff
i don't know what's going on
tidal bough
so, here's the thing
robust cliff
shoot
tidal bough
The normal way pip works is as follows:
- first, it finds the last version of a library matching the constraints. Here, the only constraint
scikit-imagewants is>=1.4.1, so it just grabs the last version,1.9.3. - then, it checks if there's a compatible wheel for that version. If there is, it uses it. If there's not, it tries to compile from source (and for you, compiling from source doesn't work)
And for 1.4.3, there aren't any win32 wheels! Hence, compiling from source it is.
robust cliff
i see
tidal bough
But when you require --only-binary, it works differently - it finds the last version matching the requirements which also has compatible wheels. And as you can see by the name, here it actually grabbed scipy-1.9.1-cp38-cp38-win32.whl - that's a wheel for 1.9.1, not the latest 1.9.3. So it had to downgrade two versions to be able to use a wheel.
tidal bough
So pip isn't really at fault here, it was just trying to get you the latest version even if that meant building from source. If anyone's at fault, it's scipy maintainers for, I'm guessing, no longer posting win32 wheels.
tidal bough
sure, nowadays many things don't support 32bit. really, it's nice there were any wheels for it at all.
robust cliff
i actually ignored the -32 in the path thinking it was something related to the version, not the architecture ;_;
btw thanks for all the help, appreciate it
finite knoll
lapis sequoia
My guess would be you may be making some silly mistakes.
So the weirdest thing happened. It ignores Valuta if there are strings, but it's fine if it's an int. Which makes 0 sense since the column is an String not an int. I just don't get it.
df[['Uplata2','Isplata2','Saldo2']] = df[['Uplata','Isplata','Saldo']].where(df['Valuta'] == 1, df[['Uplata','Isplata','Saldo']].div(7))
EDIT:
I did it! Found the solution although am not sure why it works! Does a seperate pd.DataFrame somehow create some new context?
df[['Uplata2','Isplata2','Saldo2']] = df[['Uplata','Isplata','Saldo']].where( pd.DataFrame(df['Valuta']) == 'HRK', df[['Uplata','Isplata','Saldo']].div(7))
 random forum
When I do model.fit in tensor flow with verbose=0 it still prints epoch information does anyone know how can I fix this
lapis sequoia
finite knoll
So the weirdest thing happened. It ignores Valuta if there are strings, but it's...
Oh you mean in terms of comparison?
finite knoll
lapis sequoia
Oh you mean in terms of comparison?
Yea, it's like if I didn't specify anew that it's a pd.Dataframe, it was assumed I am only talking about 1 data type even if it was a comparison. I am not even sure what to google to understand this
iron basalt
river sapphire
so in the article i'm reading it says equal to [s_1(2) s_2(2)]
https://www.jerem...
>>> import numpy as np
>>> a = np.array([1, 2])
>>> b = np.array([[3, 4], [5, 6]])
>>> a
array([1, 2])
>>> b
array([[3, 4],
       [5, 6]])
>>> np.matmul(a, b)
array([13, 16])
>>> 1*3+2*5
13
>>> 1*4+2*6
16
>>>
 bold timber
Hello guys, can you give me intuition about why we need to use EarlyStopping and ReduceLROnPlateau at the same time?
Earlier I thought when we've been using EarlyStopping we didn't need ReduceLROnPlateau because EarlyStopping will be stopping the process if the model doesn't improve for x number of epochs.
river sapphire
iron basalt
```py
>>> import numpy as np
>>> a = np.array([1, 2])
>>> b = np.array([[3, 4], ...
oh shoot I forgot what the dot product did for a second thanks
 rancid sorrel
anyone know why on earth do you have to install python 3.6/3.7 to get amd tensorflow-directml to install?
serene scaffold
rancid sorrel
anyone know why on earth do you have to install python 3.6/3.7 to get amd tensor...
Without having researched it, the reason for that kind of thing is often that the library hadn't been maintained since that py version
 misty flint
anyone ever used onnx or torchscript for inference?
desert oar
bold timber
Hello guys, can you give me intuition about why we need to use ``EarlyStopping``...
because you don't always want to stop learning, you just want to reduce the learning rate to get through the plateau. like downshifting on a bike to get a better gear ratio for going up a steep hill.
desert oar
rugged comet
<@389497659087650836> Did you have a chance to look at the notebook?
Here is t...
my main complaint is the same as before: no explanation of the data. how was it collected? how were the labels applied? are these tweets a random sample? what date range do they cover? there's also not any exploratory analysis. i don't even know the distribution of classes or the most frequent words. what steps are you taking for string cleaning? how do you know some of the tweets aren't misclassified?
also this doesn't look great

oh i see the counts of both classes. that's barely imbalanced.
if anything that's surprisingly well balanced
since you're including hashtags in here, you might want to either remove the # (treat the hashtag like a word) or use character n-grams instead of words (more or less entirely avoiding the issue but maybe making the model work harder to find good features)
but without any discussion or analysis of the raw data this is all speculation
i wouldn't trust these results at all tbh, sorry to say
hopefully my reasons make sense
 idle urchin
name ID
bill.bob 3
albert.lee 3
sam.robert 2
adam.mason 2
kevin.fong 1 if this is my dataframe how can I sort by id and then under each id sort the names albhabetically
serene scaffold
idle urchin
name ID
bill.bob 3
albert....
df.sort_values(['ID', 'name'])
 brave sand
why does model.save() not work?
arctic wedgeBOT
Hey @charred umbra!
It looks like you tried to attach file type(s) that we do not allow (). We currently allow the following file types: .gif, .jpg, .jpeg, .mov, .mp4, .mpg, .png, .mp3, .wav, .ogg, .webm, .webp, .flac, .m4a, .csv, .json.
Feel free to ask in #community-meta if you think this is a mistake.
serene scaffold
brave sand
why does model.save() not work?
people coming to this channel have none of the context that you gave in #python-discussion, so you need to restate all relevant details.
rugged comet
desert oar
my main complaint is the same as before: no explanation of the data. how was it ...
The notebook is not complete yet. So I appreciate your detailed feedback.
Unfortunately, we weren't given much of any information about the dataset. This
https://www.kaggle.com/competitions/nlp-getting-started/overview
and this
https://www.kaggle.com/competitions/nlp-getting-started/data
is really all we know going into the problem. Even the link to website which gathered the data doesn't have the dataset anymore.
We don't know how the data was collected.
We know that the tweets were hand labeled.
We don't know if the tweets are a random sample.
We don't know what date range they cover.
On your comment about exploratory data analysis, I tried to do some starting with the Explore and analyze the data section. However, my impression from you is that it's not sufficient.
On your comment about the most frequent words, I didn't know that this could be important. After all, I'm just getting started with NLP.
On your comment about the graphs, I understand that it is significantly overfitting. Did you notice anything in the code that could cause something so intense?
On your comment about the hashtags, I agree with you that the # character could be removed. I will try this out. Can you talk to me a bit about character n-grams? I haven't heard of this before.
brave sand
serene scaffold
people coming to this channel have none of the context that you gave in <#267624...
why is my image classifier always classify numbers as 1?
serene scaffold
brave sand
why is my image classifier always classify numbers as 1?
I know you're new to this space, but you keep asking questions without giving enough context for anyone to answer them.
brave sand
serene scaffold
I know you're new to this space, but you keep asking questions without giving en...
when I run the keras tutorial for mnist classifier for digits, my output is always 1. I'm not sure why. Other people do not have this issue. Relevant code:
https://hastebin.com/vifohijocu.properties
Hastebin is a free web-based pastebin service for storing and sharing text and code snippets with anyone. Get started now.
serene scaffold
brave sand
when I run the keras tutorial for mnist classifier for digits, my output is alwa...
this code doesn't show how the model was trained, so it's still impossible to know.
brave sand
serene scaffold
this code doesn't show how the model was trained, so it's still impossible to kn...
https://hastebin.com/upalotacak.py
this is the code from the keras website
Hastebin is a free web-based pastebin service for storing and sharing text and code snippets with anyone. Get started now.
serene scaffold
brave sand
https://hastebin.com/upalotacak.py
this is the code from the keras website
try running it again, and keep track of what the Test loss and Test accuracy values are.
brave sand
loss is decreasing and accuracy increases
serene scaffold
how? the print statements only happen once, and are not in a loop.
brave sand
serene scaffold
how? the print statements only happen once, and are not in a loop.
the numbers are changing
Test loss: 0.027803506702184677 Test accuracy: 0.991599977016449 Keras weights file (<HDF5 file "variables.h5" (mode r+)>) saving: ...layers\conv2d ......vars .........0 .........1 ...layers\conv2d_1 ......vars .........0 .........1 ...layers\dense ......vars .........0 .........1 ...layers\dropout ......vars ...layers\flatten ......vars ...layers\max_pooling2d ......vars ...layers\max_pooling2d_1 ......vars ...metrics\mean ......vars .........0 .........1 ...metrics\mean_metric_wrapper ......vars .........0 .........1 ...optimizer ......vars .........0 .........1 .........10 .........11 .........12 .........2 .........3 .........4 .........5 .........6 .........7 .........8 .........9 ...vars Keras model archive saving: File Name Modified Size config.json 2022-11-19 20:44:11 2753 metadata.json 2022-11-19 20:44:11 64 variables.h5 2022-11-19 20:44:11 447568
serene scaffold
okay, I guess that information is displayed by model.fit (line 71) instead of the two print calls in 74-5.
serene scaffold
what did you expect it to be?
brave sand
the number I draw
in the canvas
when i run the streamlitapp.py, it opens a browser and I draw a number
everytime the number is 1
the predicted one at least
serene scaffold
@brave sand I'll try running your program and see what happens.
brave sand
serene scaffold
<@765319974469238814> I'll try running your program and see what happens.
updates?
serene scaffold
brave sand
updates?
the model seems to converge after three epochs (so you don't need 15), but for some reason I can't use streamlit.
brave sand
pip install streamlit == 1.13.0 @serene scaffold
serene scaffold
editing a message to add a ping has no effect, FYI. you have to do the ping when you first say the message.
brave sand
ah got it
serene scaffold
and that version of streamlit doesn't appear to exist. I was using
streamlit==1.12.0
streamlit-drawable-canvas==0.9.2
I can just make an image manually, I guess.
brave sand
serene scaffold
and that version of streamlit doesn't appear to exist. I was using
```
streamlit...
streamlit 1.13.0 streamlit-drawable-canvas 0.9.2
serene scaffold
brave sand
`streamlit 1.13.0
streamlit-drawable-canvas 0.9.2`
finally, I have created a 3

@brave sand it worked
In [39]: model.predict(_)
1/1 [==============================] - 0s 46ms/step
Out[39]: array([[5.2142264e-03, 1.4473951e-03, 2.0098801e-01, 7.2605598e-01, 2.1587194e-04, 8.9083081e-03, 2.4537125e-04, 3.1921629e-02, 7.0626062e-04, 2.4296993e-02]], dtype=float32)

In [40]: _.argmax()
Out[40]: 3
then how come it doesn’t work for me lol
serene scaffold
idk. one of my coworkers created MNIST, so maybe he blessed me.
brave sand
very strange behavior
 weary crown
so thx for carrying us
serene scaffold
weary crown
flex
he's one of the most important people in my division, and I'm the least.
brave sand
serene scaffold
he's one of the most important people in my division, and I'm the least.
is it because you used ‘.argmax’?
weary crown
@serene scaffold every time i predict it says "1" with 12.549% acc
serene scaffold
brave sand
is it because you used ‘.argmax’?
maybe? see how the predict method returns a row vector with 10 elements? the nth value is the probability that the number is n.
which means that the argmax is the "real answer"
weary crown
didnt work 😦
brave sand
serene scaffold
which means that the argmax is the "real answer"
still getting 1 when I draw a 3
brave sand
serene scaffold
maybe? see how the predict method returns a row vector with 10 elements? the nth...
[[0.1007437 0.12455555 0.11968374 0.10278029 0.08240162 0.10572257 0.09519128 0.10137118 0.08048391 0.0870661 ]]
this is the prediction array
serene scaffold
brave sand
`[[0.1007437 0.12455555 0.11968374 0.10278029 0.08240162 0.10572257
0.0951912...
did you take the argmax of it?
brave sand
yes
serene scaffold
I got 7 for my seven
 brave sand
if st.button("Predict"):
    img = Image.fromarray(canvas_result.image_data.astype('uint8'), 'RGB')
    img = img.convert('L')
    # preprocess image
    img = img.resize((28, 28))
    img = np.array(img)
    img = img.reshape(1, 28, 28, 1)
    img = img.astype('float32')
    img /= 255
    # predict digit
    prediction = predict_img(img)
    print(prediction)
st.write("The digit is: ", prediction.argmax())```this is so weird. is the conversion datatype wrong?
serene scaffold
my images are black and white, which means that the empty space is 255. so I do some arithmetic to invert it and to squish everything between 0 and 1
namely 1 - (np.asarray(Image.open("./seven.png").convert("L").resize((28, 28))) / 255)
I'm also passing it to the model as a (1, 28, 28) array. I'm not sure why you're doing (1, 28, 28, 1)
(you could do (3, 28, 28) if you wanted to predict 3 images at the same time, or whatever other number.)
brave sand
serene scaffold
I'm also passing it to the model as a `(1, 28, 28)` array. I'm not sure why you'...
changed it to that. same thing
serene scaffold
well fuck
brave sand
this is witchcraft
serene scaffold
I would print out img and see what it looks like
if your empty space isn't 0s, for example, that would mess up the model
brave sand
printing img doesn't work
serene scaffold
why not
brave sand
not sure why
serene scaffold
serene scaffold
I got 7 for my seven
you should see something like this
serene scaffold
weary crown
<@253696366952316929> img rn is only 0s
if it's all zeros, then that's a blank image.
weary crown
yes but that cant be
brave sand
serene scaffold
if it's *all* zeros, then that's a blank image.
then it shouldn't be predicting anything if it's blank
serene scaffold
brave sand
then it shouldn't be predicting anything if it's blank
that's not how models work. if you input something that's invalid, you either get an error or you get a seemingly random result.
and if you want to prevent the latter, you have to manually safeguard invalid inputs that don't cause an error.
brave sand
my output isn't all zeros
serene scaffold
like, if you make a model that classifies if something is a cat or a dog, and you give it a picture of a turtle, it will still say that it's a cat or a dog.
brave sand
Hastebin is a free web-based pastebin service for storing and sharing text and code snippets with anyone. Get started now.
weary crown
yeah wait its not all 0s i just didnt scroll enough
brave sand
serene scaffold
like, if you make a model that classifies if something is a cat or a dog, and yo...
data isn't all zeros, and I'm taking the argmax. this doesn't make any sense
weary crown
😭
serene scaffold
@brave sand try changing your numpy settings so that you can view the array like a picture (ie, no line breaks within rows) https://numpy.org/doc/stable/reference/generated/numpy.set_printoptions.html
serene scaffold
serene scaffold
I got 7 for my seven
like how I was able to visually confirm that my numbers "look like" the number
weary crown
serene scaffold
<@765319974469238814> try changing your numpy settings so that you can view the ...
@serene scaffold what are ur settings for this
like arguments
misty flint
serene scaffold
I got 7 for my seven
hahaha i like this
serene scaffold
weary crown
<@253696366952316929> what are ur settings for this
try setting linewidth=None
weary crown
@serene scaffold should we be loading with rgb or greyscale