#data-science-and-ml
1 messages · Page 29 of 1
 steady basalt
 fringe anvil
yeah its fun tho when it tickles your brain a bit lol
steady basalt
i probably need to get better at that and learn DSA coding before i even attempt another language
 serene scaffold
!warn 760895878159663166 Python Discord is not a platform for recruitment. This is stated clearly in our rules.
 arctic wedgeBOT
:incoming_envelope: :ok_hand: applied warning to @vapid crypt.
serene scaffold
steady basalt
wats the pay
Asking for paid work isn't allowed, either.
steady basalt
 ima beamer boy
serene scaffold
idk what that is.
steady basalt
off topic
 lapis sequoia
So transform returns the operation applied to all the rows of the group?
that's quite beautiful. And thanks for your detailed explanation. I missed it yesterday
did you learn about these functions from the documentation? @untold bloom
lapis sequoia
ArrowInvalid: Casting from timestamp[ns] to timestamp[us] would lose data: 1668020216913324032
what do I about this error
lapis sequoia
I am trying to convert a numeric column to type str
but even after that it stores some numeric rows
I have tried astype(str) and .apply(lambda x: str(x) )
spotted the issue
Actually I am writing a csv and re reading it again. And in the process pandas reads "3205" as 3205 in an object column. Is there any way to turn it off?
 untold bloom
lapis sequoia
So transform returns the operation applied to all the rows of the group?
untold bloom
lapis sequoia
So transform returns the operation applied to all the rows of the group?
yes it repeats what the aggregation says for each member of the group. please compare:
In [5]: df
Out[5]:
item month sales
2021-12-27 A 1 100
2021-12-28 A 2 200
2021-12-29 B 3 300
2021-12-30 A 2 100
2021-12-31 D 1 300
2022-01-01 Z 3 200
2022-01-02 Z 4 0
2022-01-03 B 2 500
In [6]: df.groupby("item")["sales"].sum()
Out[6]:
item
A 400
B 800
D 300
Z 200
Name: sales, dtype: int64
In [7]: df.groupby("item")["sales"].transform("sum")
Out[7]:
2021-12-27 400
2021-12-28 400
2021-12-29 800
2021-12-30 400
2021-12-31 300
2022-01-01 200
2022-01-02 200
2022-01-03 800
Freq: D, Name: sales, dtype: int64
```the "raw" GroupBy.sum reduces the number of rows to `grouper.nunique()` after it operates; OTOH, transform'ed version keeps the size as `len(df)` by repeating the found values (like A's 400 is repeated for every A seen in df above). GroupBy.transform is therefore favored when you want to keep the shape of the column of interest after applying a possibly-aggregator operation (and that's what we needed for `.where` above). Noting that `transform` can take any callable (and applies it to columns-of-interest *independently*); but for very common operations, like summation, it accepts string forms as well (this is also seen in some other places, e.g., `agg` accepts strings as function names). We could write `np.sum` there as well and the result will be the same (and as fast); but why type more and clutter the code instead of a beautiful string.
> did you learn about these functions from the documentation
uh, not directly, no. i spent some (probably unhealthy) time in stackoverflow's pandas tag. IMHO, after/next to documentation, popular Q&As as well as the recent ones in SO are very useful for both practice and seeing what other people have to write for learning new things. glad if it helps last ivy
 fossil ivy
Is there a way to make a graph like a box and whisker/ candlelight but without showing the std deviation etc.?
Like I basically have a list
[[5, 1.5, 1.7], [10, 1.6, 1.65], [15, 1.6, 1.60], ...] and I want the first element to be the xtick, the second to be the absolute lower bound and the last to be the absolute upper bound
No deviation or anything, more like just flying barplots
 regal ingot
what does a fuzzy set low medium and high numbers mean
fossil ivy
regal ingot
what does a fuzzy set low medium and high numbers mean
Looks like its a way to categorize your data


I have a brief question regarding a sensitivity analysis I am doing
Would you suggest this is better for analysis purposes (steps of 5)

Or do you reckon steps of 10 would be better because I cover more?

 copper trout
fossil ivy
Or do you reckon steps of 10 would be better because I cover more?
copper trout
fossil ivy
Or do you reckon steps of 10 would be better because I cover more?
is this matplotlib?
fossil ivy
copper trout
is this matplotlib?
no this is just done in Excel
Its less of a coding issue, more of a trying to get your data science opinion
 soft badge
Guys someone know a roadmap for data science, machine learning....deep learning?
 tacit talon
Hello guys, i want get started with AI using python, can you help me out what i need to do most
 floral hollow
How can i convert custom images to be fed to the keras.datasets.fashion_mnist model
this is the code i have but i do not beleive it works
drawn_image = cv2.imread(image_path, cv2.IMREAD_GRAYSCALE)
resized_drawn_image = cv2.resize(drawn_image, (28, 28), interpolation=cv2.INTER_LINEAR)
resized_drawn_image = resized_drawn_image.reshape(-1, 28, 28)
cause no matter what image i give it the model always guesses the same thing
 limpid patrol
i had a similar problem once, are the pixel values the same as the training data? i believe the values in the mnist dataset range from 0 to 255, while mine were 0 to 1
(assuming you trained on the mnist set)
floral hollow
limpid patrol
(assuming you trained on the mnist set)
yeah
wait this is weird
ohh
im such a bafoon
i did ```py
train_images_copy = train_images_copy / 255
but not for my test images
test_images_copy = test_images_copy / 255
``` this worked nowthanks
limpid patrol
ah nice!
floral hollow
limpid patrol
ah nice!
still guesses the same thing
limpid patrol
what does it show if you print resized_drawn_image?
floral hollow
before or after resized_drawn_image = resized_drawn_image / 255 ?
limpid patrol
after
limpid patrol
but isn't it supposed to be 28 x 28?
floral hollow
looks like: ```[[[1. 1. 1. 1. 1.
1.
-
1. 1. 0.8627451 0.58823529 0.19607843
0.34901961 0.56078431 0.56470588 0.49803922 0.25882353 0.47058824
0.78823529 1. 1. 1. 1.
1.
-
1. 1. 1. ]
[1. 1. 1. 1. 1.
1.
-
0.7372549 0.36862745 0.16470588 0.03921569 0.
0.05098039 0.15294118 0.15294118 0.03921569 0.03921569 0.01960784
0.0745098 0.25882353 0.58823529 1. 1.
1.
-
1. 1. 1. ]
[1. 1. 1. 1. 1.
1.
0.42352941 0.03921569 0.03921569 0.17647059 0.21176471 0.17647059
0.16470588 0.32941176 0.35294118 0.17254902 0.15686275 0.18039216
0.14509804 0.0627451 0. 0.18431373 0.89803922 1.```
thats a small portioin
before looks like: ```py
[[[255 255 255 255 255 255 255 255 255 220 150 50
89 143 144 127 66
120 201 255 255 255 255 255 255 255 255 255]
[255 255 255 255 255 255 255 188 94 42 10 0
13 39 39 10 10
5 19 66 150 255 255 255 255 255 255 255]
[255 255 255 255 255 255 108 10 10 45 54 45
42 84 90 44 40
46 37 16 0 47 229 255 255 255 255 255]
[255 255 255 255 255 142 0 43 47 51 56 51
43 40 42 42 44
47 42 46 44 0 62 255 255 255 255 255]
[255 255 255 255 221 28 48 45 42 52 55 56
54 46 45 48 47
47 45 44 39 32 0 125 255 255 255 255]
[255 255 255 255 89 25 58 42 42 55 55 57
56 53 51 52 48
47 46 45 39 30 41 6 196 255 255 255]
[255 255 255 172 17 61 59 43 41 57 56 58
59 57 55 52 49
47 46 47 44 31 50 22 30 242 255 255]
[255 255 227 41 45 60 59 43 40 54 57 58
61 60 56 55 53
50 48 48 47 31 48 53 6 81 245 255]
[255 239 58 24 65 58 57 48 44 53 57 58
60 62 60 58 56
53 49 50 49 31 47 52 46 0 149 255]
[255 235 93 24 40 60 56 50 46 55 58 57
58 60 63 60 57
54 49 52 53 33 52 38 9 108 225 255]
[255 255 255 173 56 18 54 53 48 56 59 58
58 59 60 60 57
55 52 55 54 33 16 38 163 255 255 255]
[255 255 255 255 240 124 38 34 54 59 60 59
58 59 58 58 58
57 55 59 56 8 78 220 255 255 255 255]
[255 255 255 255 255 255 203 75 36 60 59 59
57 58 58 57 57
56 58 52 53 156 255 255 255 255 255 255]
wdym?
limpid patrol
this is what the dataset looks like, where the white parts are 0 and the black is 1. in yours, the white parts are 1 and the black is 0
 limpid patrol
i guess a simple fix would be resized_drawn_image = abs(255 - resized_drawn_image) / 255

 dusty valve
Using a CNN, how could you return the position of a math in an image? Like object detection
 glad skiff
Hi all I have a very simple issue that I can't find a way to fix in Pandas.
Considering I have the following data:
        infoA = [dict(user=1, infoA=20), dict(user=2, infoA=10)]
        infoB = [dict(user=1, infoB=20), dict(user=2, infoB=10)]
        infoC = [dict(user=1, infoC=20), dict(user=2, infoC=10)]
        all_data = infoA + infoB + infoC
If add this all_data to pandas, pandas doesn't understand that each row is complementary, so it won't merge the records, and I get something like:
     infoA     infoB     infoC
user
1     20.0       NaN      NaN
2     10.0       NaN      NaN
1      NaN      20.0      NaN
2      NaN      10.0      NaN
1      NaN       NaN     20.0
2      NaN       NaN     10.0
Can find a way to flatten this. I can groupby, but groupby would expect some sort of transformation, no?
Any ideas?
floral hollow
I have a model made with keras mnist
i am trying to have a custom image be predicted by the model
it is not working
it always guesses the same thing
from tensorflow import keras
from pathlib import Path
import tensorflow as tf
import cv2

image_path = fr'{Path(__file__).parents[1]}/images/dress.png'

labels = [
    'T-shirt',
    'Pants',
    'Long sleeve shirt',
    'Dress',
    'Coat',
    'Sandal',
    'Shirt',
    'Shoe',
    'Bag',
    'Boot'
]

label = labels(3)

""" Retrieving and loading data """
(train_images, train_labels) = keras.datasets.fashion_mnists.load_data()
train_images_copy = train_images

""" Making the image the correct format """
drawn_image = cv2.imread(image_path, cv2.IMREAD_GRAYSCALE)
drawn_image = drawn_image[0:600, 0:600]
resized_drawn_image = cv2.resize(drawn_image, (28, 28), interpolation=cv2.INTER_LINEAR)
resized_drawn_image = resized_drawn_image.reshape(-1, 28, 28)

""" Pre-processing images to be between the values of 0 - 1 """
train_images_copy = train_images_copy / 255
resized_drawn_image = abs(255 - resized_drawn_image) / 255

""" Creating the model """
model = keras.Sequential([
    keras.layers.Flatten(input_shape=(28, 28)), # Input layer | here we give it information
    keras.layers.Dense(128, activation='relu'), # Hidden layer | Here we manipulate information
    keras.layers.Dense(10, activation='softmax') # Output layer | here we extract information
])

""" Compiling the model """
model.compile(
        optimizer='adam',
        loss='sparse_categorical_crossentropy',
        metrics=['accuracy'])

""" Fitting the model """
model.fit(
        tf.expand_dims(
        train_images_copy, axis=-1),
        train_labels,
        epochs=10)

""" Testing the model """
test_results = list(model.predict(resized_drawn_image)[0])

""" Getting the results """
guess_index = test_results.index(max(test_results))

""" Printing the results """
if labels[guess_index] == label:
    print(f'\n\n The model guessed {labels[guess_index]}, the model was correct!')
else:
    print(f'\n\n The model guessed {labels[guess_index]}, the correct answer was {label}.')
please tell me why this doesnt work

that is the image i am feeding it ^ (dress.png)
 sonic bison
 mental wind
floral hollow
mental wind
floral hollow
your dress looks more like a bag. that's not keras' fault.
 copper mica
is there any way to get static typing
i would learn how to use the API faster if things were statically typed. tried mypy but it isn't the same
mental wind
floral hollow
that is the image i am feeding it ^ (dress.png)
why do you invert the image? if you don't invert it, it seems to work.
inversion should be necessary if it has a bright background. but your input has a dark background.
i mean this part abs(255 - resized_drawn_image)
 tacit moss
guys, i am trying to train the random forest model using a historical dataset. Then, now i wanted to predict the outcome of the users' input using what i have trained the random forest model. How do i do that?
 compact star
Is there a a test that I can use to see if my back prop algorithm works, like test it against one that does or is that not possible
 silk garden
How to extract data from receipts using Python : https://www.youtube.com/watch?v=NrSjwk1jBy4

In this video you'll learn how to easily extract data from receipts with 🐍Python using different AI engines.
Eden AI simplifies the use and integration of AI technologies by providing a unique API connected to the best AI providers, combined with a powerful management platform: https://www.edenai.co/
Try the app for free 📲 http://app.edenai.r...
serene scaffold
@silk garden would you like to explain why this is interesting? Because this channel isn't for "dump and run" posting of links
 misty flint
@serene scaffold came across this gem

 ivory mural
hey folks, has anyone here had success running OpenAI Whisper on an M1 mac? I'm having some issues setting the device to mps:
LLVM ERROR: Failed to infer result type(s).
thanks, I'll send this to my friends!
misty flint
serene scaffold
thanks, I'll send this to my friends!
if they ask for details, link them this https://mlops.community/why-ml-in-production-is-hard-and-solutions-to-help/
serene scaffold
they won't have questions. they get it.
@elfin swan you asked a data science question in the wrong channel (namely #pedagogy)--it belongs here.
 shell sequoia
is anyone here have good knowledge of seaborn, good enough to be 50% of tableau
steady basalt
misty flint
<@253696366952316929> came across this gem
I'll be productionising via databricks
serene scaffold
what is databricks, anyway
misty flint
serene scaffold
what is databricks, anyway
the rival of snowflake 
steady basalt
serene scaffold
what is databricks, anyway
its a cool tool i believe azure bought out, lets you write ur stuff on the cloud and deploy it quite easily
u can even write jupyter notebook style stuff on it
(not that id ever want to put a notebook into production, but azure i think now lets you also make git like projects)
 desert oar
serene scaffold
what is databricks, anyway
desert oar
serene scaffold
what is databricks, anyway
hosted apache spark with a bunch of extra features layered on top: "delta lake" (basically version control for parquet files), mlflow integration, their own filesystem called dbfs (instead of the typical hadoop hdfs), and a notebook interface that supports collaborative editing
it runs on azure virtual machines and dbfs can mount azure blob storage and azure data lake volumes
and of course it supports sso with activedirectory
desert oar
misty flint
~~the rival of snowflake~~ <a:Running:955778347214962688>
just like how mysql is a rival of python, right? 😉
misty flint
desert oar
just like how mysql is a rival of python, right? 😉
lmao you right. theyre technically different services but theres this weird rivalry narrative going on
i guess theyre both trying to become "lakehouses" in a sense
but different interpretations of the term?

desert oar
databricks is fundamentally a big data computing platform with some data lake features bolted on. snowflake is a data warehouse.
desert oar
any rivalry is artificial and invented in the minds of engineering managers who post on twitter
misty flint

desert oar
and people writing vapid Towards Data Science and Analytics Vidhya and KDNuggets articles just so they can put that on their resume
misty flint
omg its true
desert oar
on the practical side, most companies need a data warehouse a lot more than they need big data compute
databricks is and should remain a niche product
something like azure data factory however is awesome
misty flint
yeah bigquery is said to be popular not bc of its big data processing capabilities
but its "easy-query" capabilities
desert oar
you can build a pretty robust ETL system with just airflow, dbt, and snowflake python UDFs, but you still have to run and host airflow for that
misty flint
desert oar
something like azure data factory however is awesome
oh yeah? ive heard good things about it

desert oar
i haven't used it myself much, but replacing "servers" with "services" is always good in a smaller team
and also in a bigger team where the servers need to be more robust
one problem w/ bigquery apparently is that it's easy to make a mistake and cost your company $10k in a few minutes
i haven't experienced that, but i have a coworker w/ lots of bigquery war stories
snowflake is honestly just really good. their pricing is fair and the feature set is huge.
of course i'd prefer if it was open source and self-hostable but i can't blame them for not wanting to do that
snowpark is also really interesting, and that is starting to edge into databricks/spark territory a bit
desert oar
it's a system where you connect from a regular python application, but it somehow pushes the computations up to the snowflake servers
the rivarly will begin if/when snowflake more explicitly moves into the "compute" space
misty flint
snowflake does have streamlit
sometimes i forget about that. but maybe more data apps built on snowflake compute?
desert oar
snowpark and their udf system is already robust enough to avoid the need for databricks. so if there's any rivalry, it's that the entire product category that databricks represents is somewhat obsoleted by snowflake for a lot of companies' needs
misty flint
yeah
desert oar
misty flint
sometimes i forget about that. but maybe more data apps built on snowflake compu...
it's a smart acquisition, i'm sure streamlit having tighter integration w/ snowflake is going to be a big value add for both products
misty flint
yeah for sure. i really like streamlit too. great for testing stuff
good for internal stuff too
desert oar
so right now our etl/elt system consists of airflow running dbt tasks, plain snowflake sql tasks, and python tasks that run on aws ecs
but the latter requires a lot of care and feeding
we need to have an ecs cluster and ecr registries for the docker images and a lot of testing and software boilerplate in the actual python tasks
misty flint
python on ecs huh? why not, what is it called aws glue
desert oar
precisely, so i've been looking into options like that
iirc aws glue is the equivalent of azure data factory but i'm not sure
the thing now is that we already have an airflow+dbt setup that works, so we don't want to migrate to some proprietary managed service if we can avoid it
misty flint
i think it doesnt have as many features but still relatively good. havent used it myself though but my friend that does ML monitoring has.
that makes sense
desert oar
so my main interest now is looking into ways of making the python jobs themselves simpler and less needing of boilerplate
and it turns out that snowflake has great support for running python stuff directly inside snowflake
it has "batch udfs" that give you whole chunks of the data table as a pandas dataframe, built right in with 0 additional setup
and you can upload arbitrary python packages into a snowflake stage
misty flint
oh shoot thats pretty dope
desert oar
it even has support for a limited set of packages from the anaconda conda channel, if you don't want to deal with uploading wheels or tarballs
and that's just the built-in udf system. there's also an "external function" system that can actually send data to a remote machine running an arbitrary application, basically what we are doing now with airflow, but the whole thing is abstracted away and just looks like a plain table udf when you're writing the query. and that uses snowpark
so snowflake offers a lot of interesting options
other options include something like aws lambda or fargate instead of ecs
i can look into glue though, maybe i missed something
hm, it does look like airflow can run glue tasks
misty flint
oh hey thats nifty
also im looking into fargate myself lol
for one project at work
its for a streamlit app funny enough

desert oar
i still haven't used or needed streamlit
we use some data dashboard tool and i never have to make dashboards anyway
steady basalt
desert oar
and people writing vapid Towards Data Science and Analytics Vidhya and KDNuggets...
Holy. So true. Databricks is good anyways. Coming from having no idea what’s going on with other cloud products.
desert oar
steady basalt
Holy. So true. Databricks is good anyways. Coming from having no idea what’s goi...
the databricks notebook interface was the worst thing i've ever used, but otherwise it's good 😆
steady basalt
desert oar
you can build a pretty robust ETL system with just airflow, dbt, and snowflake p...
Remind me again why to use airflow when you can crontab
And where to run airflow?
steady basalt
desert oar
i still haven't used or needed streamlit
I built and ran streamlit and used ct exaclty for this
desert oar
steady basalt
Remind me again why to use airflow when you can crontab
dependencies between tasks, determining if a task succeeded or failed, monitoring, can be distributed
steady basalt
Is that data analyst or data engineer
Don’t like glue for this purpose as u can’t easily clear old files out
steady basalt
desert oar
dependencies between tasks, determining if a task succeeded or failed, monitorin...
Where does airflow actually excecute
desert oar
steady basalt
Is that data analyst or data engineer
data engineer usually handles this stuff, but data scientists might write individual airflow tasks
steady basalt
desert oar
data engineer usually handles this stuff, but data scientists might write indivi...
My company gave me da title and I did this work, lol
desert oar
steady basalt
Where does airflow actually excecute
just a webserver, or you can pay a company to host airflow for you like aws
steady basalt
desert oar
just a webserver, or you can pay a company to host airflow for you like aws
So, not an Ubuntu instance
desert oar
steady basalt
So, not an Ubuntu instance
yes, that would be fine
you can run it on your laptop
steady basalt
So it’s similarly done as in, you run it as a cmd
Do u need to launch it like spark or does it run natively bash
I’m guessing u have to start it up
desert oar
steady basalt
Do u need to launch it like spark or does it run natively bash
bash needs to be "started" too
yes, airflow is an application and you need to run it
steady basalt
I like how I, a second rate analyst made a bootleg etl pipeline as I went along
Following zero best practise
steady basalt
I hosted my dash on heroku
And sent that shit refreshing on a vm lol
Had no idea just winged it
desert oar
a crontab entry is a lot like an airflow task. cron is a lot like airflow in that it runs continuously, and runs certain tasks when certain conditions are met.
steady basalt
Maybe my future lies in de not ds….
desert oar
steady basalt
Maybe my future lies in de not ds….
frankly, you'll find a job faster in DE
there's more demand for de than for ds nowadays, and lots of aspiring ds people are flooding de job applications trying to get in the door
steady basalt
I’d catch way less flak too - people almost have a break down when they hear I didn’t study maths past school and still work on ml pipelines
desert oar
a good data engineer needs to know some data science stuff anyway
steady basalt
desert oar
there's more demand for de than for ds nowadays, and lots of aspiring ds people ...
This is interesting
desert oar
almost every company could benefit from a data engineer that can also do some data analysis as needed
steady basalt
So I’m a analytics engineer
desert oar
a data scientist/analyst without a data engineer will end up being an ad-hoc data engineer anyway a lot of the time
ok, i shouldn't say most companies
but companies that are looking to build a data team basically need: 1) a ds lead, 2) a data engineer, 3) a business/data analyst to build dashboards and stuff while (1) figures out models and (2) figures out the data warehouse
steady basalt
It wud be vastly more easy for me to be a DE and drop my evening maths studying for my DS work…
I’d free up alot of hours
desert oar
the math can't hurt, but honestly yeah
desert oar
it's probably easier than self-studying math tbh
steady basalt
The main thing is exposure in the work place builds it passively
desert oar
self-studying math in particular is hard
steady basalt
desert oar
self-studying math in particular is _hard_
I’ve noticed this to be true. Especiallly frustrating at times
I did somewhat underestimate learning calculus and linear algebra within a year, simply because there’s things that need to come before that I’ve forgotten since school
I refused to move forward until I find myself doing well on the precalc tests
And that took literally months
Defiantly not enough time for both that and a new programming language
floral hollow
mental wind
your dress looks more like a bag. that's not keras' fault.
this was an image taken straight from the data fashionmnist website
floral hollow
floral hollow
this was an image taken straight from the data fashionmnist website
it was one of the testing images
i tried shirts, shoes,
nothing works
floral hollow
mental wind
why do you invert the image? if you don't invert it, it seems to work.
initially i didnt have this but someone said put it so i did, it made 0 diffrence, so i kept it in, it doesnt work with, or without
mental wind
yes, i found it. hmm.
but yeah, there is no inversion necessary. earlier with the numbers your input image was inverted so you had to invert it again. but the dress.png is correct as it is.
it should always be a white object on black background.
with white i mean something like 1.0 or 255 and with black i mean something like 0.0 or 0.
when you've taken an image straight from the training/test data set it's already perfect.
but for aesthetic reasons (black on white) sometimes they are displayed with inverted colors.
 wispy temple
Hello guys. I'm attempting to use catboost to build a classification model using UFC data. I'm trying to figure out the best way to scrap data from the UFC website to find the fighters style. I only want to scrape data from active fighters. https://www.ufc.com/athlete/aljamain-sterling for an example of the page layout. Would the most efficient way of doing this be to scrape every UFC fighters name and then format it into a url? Thanks

Aljamain “Funk Master” Sterling is an American professional mixed martial artist and the UFC bantamweight champion. Get the latest UFC breaking news, fight night results, MMA records and stats, highlights, photos, videos and more.
tacit moss
guys, i am trying to train the random forest model using a historical dataset. Then, now i wanted to predict the outcome of the users' input using what i have trained the random forest model. How do i do that?
 tacit basin
tacit moss
guys, i am trying to train the random forest model using a historical dataset. T...
tacit basin
tacit moss
guys, i am trying to train the random forest model using a historical dataset. T...
model.predict(new_data)
https://scikit-learn.org/stable/modules/generated/sklearn.ensemble.RandomForestClassifier.html#sklearn.ensemble.RandomForestClassifier
scikit-learn
Examples using sklearn.ensemble.RandomForestClassifier: Release Highlights for scikit-learn 0.24 Release Highlights for scikit-learn 0.24 Release Highlights for scikit-learn 0.22 Release Highlights...
tacit moss
tacit basin
model.predict(new_data)
https://scikit-learn.org/stable/modules/generated/sklear...
the new_data do i need to make it into a dataframe? since the new data is coming from wat the user input
tacit basin
tacit moss
the new_data do i need to make it into a dataframe? since the new data is coming...
Yeah it needs to be in the same format as data the model was trained on
tacit moss
tacit basin
Yeah it needs to be in the same format as data the model was trained on
same format as in same number of column or same type which is a dataframe?
tacit basin
tacit moss
same format as in same number of column or same type which is a dataframe?
The same features, so the same type, the same transforms applied. I think latest scikit learn ver models accept pandas so could be pandas
tacit moss
tacit basin
The same features, so the same type, the same transforms applied. I think latest...
the dataset used pandas dataframe to train and there are 10columns, however the newdata im going to predict will be 3columns.. thats fine right?
tacit basin
tacit moss
the dataset used pandas dataframe to train and there are 10columns, however the ...
Data to predict on must be the same shape as train data
So if you trained on 10 features you need to give 10 features for model to predict
All transforms like standardization, outliers removal etc needs to be applied in the same way as to train set
tacit moss
ok thanks for the help
tacit basin
wispy temple
Hello guys. I'm attempting to use catboost to build a classification model using...
Not sure but this repo may be interesting to you https://github.com/WarrierRajeev/UFC-Predictions/
GitHub
A web app to predict UFC fights. Contribute to WarrierRajeev/UFC-Predictions development by creating an account on GitHub.
 rugged comet
Determine if News is Fake or Real by Urkchar
https://www.kaggle.com/code/urkchar/determine-if-news-is-fake-or-real/
I'd love to hear some feedback on this notebook that I wrote.
Explore and run machine learning code with Kaggle Notebooks | Using data from Fake and real news dataset
tacit basin
desert oar
there's more demand for de than for ds nowadays, and lots of aspiring ds people ...
Interesting. Do you have link to some data on that? And about which job pays more? 😅
 edgy walrus
This might be obvious, but have you tried data augmentation, like doing random horizontal flips to increase the sample size?
Also, you mentioned that it's overfitting on some of the characters (like the MC). In that case, maybe you should stop and ask what you're actually trying to do... from the looks of it, you want to generate a new character or, to be more specific, generate the face of a new character in the ATLA style. In which case, maybe first clustering the faces (with a model/or by hand) and using that as one of the inputs for face generation could help (I'm just shooting ideas here).
 plush jungle
edgy walrus
This might be obvious, but have you tried data augmentation, like doing random h...
plush jungle
edgy walrus
This might be obvious, but have you tried data augmentation, like doing random h...
it's actually underfitting which seems to be the problem
data augmentation is on by default in stylegan which helps some
but my goal is essentially this
GitHub
Contribute to RyanWu2233/Style_GAN2_TWDNE development by creating an account on GitHub.
a model that produces clear character faces, but generalizes across all avatar characters
the underfitting produces images like these

some of which could barely be considered images of humans
overfitting only happens when I reduce the dataset size dramatically
from that guy's github
"The virtual Waifu pictures are generate by AI using NVIDIA famous style GAN2 algorithm. The training set is composed of 2500 images generated by TWDNE website. Resolution of each image is 512 x 512."
edgy walrus
plush jungle
a model that produces clear character faces, but generalizes across all avatar c...
Are you using a pre-trained model? Cause I don't think avatar style could be considered similar to eastern anime (it is on some level, but it also has western elements).
plush jungle
edgy walrus
Are you using a pre-trained model? Cause I don't think avatar style could be con...
stylegan comes with links to pretrained models trained on large datasets of human face photos, metropolitan museum of art faces, and animals
I've tried training from scratch, as well as retraining the human faces and the animal models
retraining any model seems to converge pretty quickly to the same sort of thing
edgy walrus
plush jungle
stylegan comes with links to pretrained models trained on large datasets of huma...
Isn't this a problem? I agree, doing it from scratch would be worse.
plush jungle
edgy walrus
Isn't this a problem? I agree, doing it from scratch would be worse.
what do you think the problem could be?
that ryan wu guy trained his to that level of quality with just 2500 images
edgy walrus
plush jungle
what do you think the problem could be?
idk. You gotta keep trying I guess. I'll come back to you once I read some papers on the topic.
edgy walrus
plush jungle
that ryan wu guy trained his to that level of quality with just 2500 images
2500 seems a decent number, I think going over that would make it worse. The model just needs the right types of inputs and maybe a better loss function.
plush jungle
after 16 hours of training from scratch I got this
but that was on a dataset of only 800

I think that's called mode collapse?
edgy walrus
plush jungle
but that was on a dataset of only 800
haha
plush jungle
I've got 1900 now but I'm not sure I'll get much better training from scratch. worth a shot though, computer's got nothing else to do while I sleep
edgy walrus
plush jungle
I've got 1900 now but I'm not sure I'll get much better training from scratch. ...
I feel like it'll get weirder with more abstract images, but sure you can give that a shot.
For now, I'll try downloading the package and running it locally, and stepping over the code to see how they actually implemented that.
edgy walrus
plush jungle
https://github.com/RyanWu2233/Style_GAN2_TWDNE/blob/master/Images/generation.gif
does this really not come with a paper?
plush jungle
that's just someone's github. stylegan3's paper is here https://nvlabs.github.io/stylegan3/
 edgy walrus
plush jungle
that's just someone's github. stylegan3's paper is here https://nvlabs.github.io...
edgy walrus
plush jungle
that's just someone's github. stylegan3's paper is here https://nvlabs.github.io...
ty. Wait, nvm, that's just the style gen model.
plush jungle
wait what were you looking for
edgy walrus
plush jungle
wait what were you looking for
like a cartoon-specific model, with style gen or any other framework. Just wanna see their transformations and hyperparameters.
plush jungle
this talks about it some, but sadly I don't think he goes into detail about his hyperparameters

I describe how I made the website ThisWaifuDoesNotExist.net (TWDNE) for displaying random anime faces generated by StyleGAN neural networks, and how it went viral.
edgy walrus
plush jungle
https://www.gwern.net/TWDNE
thanks again, I'll come back to you once I find something useful.
plush jungle
edgy walrus
thanks again, I'll come back to you once I find something useful.
thank, I appreciate you!
fossil ivy
The moment when you question your entire life and research because results do not seem to make sense
Seeing these mfkers

Guess who thought this would mean 1198
 tidal bough
fossil ivy
The moment when you question your entire life and research because results do no...
tidal bough
fossil ivy
The moment when you question your entire life and research because results do no...
me when I accidentally prove waves do not decay ever
 mint palm
yesterday while running feature extraction on video with 950 000 frames i slowed down server by utilizing 303GB, i wanted to know following:
considering there is 250 gb free memory(500+ total) and how much can i use without slowing down the server.
And, Even after using garbage collection what can cause memory usage to rise steadily?
lapis sequoia
Is there a way to just trigger a jupyter notebook (lets say example.ipynb) from another notebook(main.ipynb) so that all the cells are run in the original file (example.ipynb). %run won't do this as it will just list the outputs from example.ipynb in main.ipynb. What is the alternate solution?
tidal bough
lapis sequoia
Is there a way to just trigger a jupyter notebook (lets say example.ipynb) from ...
Like, you want the cells to update in that notebook? Huh, interesting. Maybe jupyter run can do that, the docs for ipython's %run mention it.
lapis sequoia
tidal bough
Like, you want the cells to update in that notebook? Huh, interesting. Maybe `ju...
is there any way to that in jupyter notebook itself instead of command line?
tidal bough
you can run console commands via, IIRC, !, so !jupyter run other_notebook should work
lapis sequoia
tidal bough
you can run console commands via, IIRC, `!`, so `!jupyter run other_notebook` sh...
I am getting this error:[RunApp] WARNING | Config option kernel_spec_manager_class not recognized by RunApp. Did you mean kernel_manager_class?
NameError Traceback (most recent call last)
<ipython-input-1-31fa03dbdf04> in <module>
3 {
4 "cell_type": "code",
----> 5 "execution_count": null,
6 "id": "c6715233",
7 "metadata": {},
NameError: name 'null' is not defined
Traceback (most recent call last):
File "/home/ec2-user/anaconda3/envs/python3/bin/jupyter-run", line 10, in <module>
sys.exit(main())
File "/home/ec2-user/anaconda3/envs/python3/lib/python3.6/site-packages/jupyter_core/application.py", line 254, in launch_instance
return super(JupyterApp, cls).launch_instance(argv=argv, **kwargs)
File "/home/ec2-user/anaconda3/envs/python3/lib/python3.6/site-packages/traitlets/config/application.py", line 664, in launch_instance
app.start()
File "/home/ec2-user/anaconda3/envs/python3/lib/python3.6/site-packages/jupyter_client/runapp.py", line 108, in start
raise Exception("jupyter-run error running '%s'" % filename)
Exception: jupyter-run error running 'a.ipynb'
tidal bough
lapis sequoia
I am getting this error:[RunApp] WARNING | Config option `kernel_spec_manager_cl...
huh, wild. That looks like it tried to execute the notebook's source as python code, which it isn't
which is very weird because that's the usage example
https://docs.jupyter.org/en/latest/running.html#using-a-command-line-interface
lapis sequoia
how can we solve the issue of no kernel name found with papermill?
 lucid sorrel
I’m not sure but I would like to learn to so if u have on @ me
 woven tundra
Hey Pythonistas, is anyone aware of a library or even a tool that's able to describe a tabular dataset in normal language after profiling it?
For e.g., if I feed in a dataset containing revenue by country, it generates "This table contains revenue by country". Perhaps a bit of a stretch but I'm wondering if machine intelligence is there yet. I can vaguely recall some BI tool having this feature, but I can seem to find or remember which one it was.
serene scaffold
woven tundra
Hey Pythonistas, is anyone aware of a library or even a tool that's able to desc...
It sounds possible, but I don't see the use case.
you would need to encode the schema of the tabular data as a set of features, and then write natural language descriptions of each table, and then train a NN to learn the relationship.
woven tundra
The use case is for data governance
Profile a dataset -> generate a natural language description -> human uses it to assign a sensitivity classification -> sensitivity classification determines default access privileges
misty flint
desert oar
databricks is fundamentally a big data computing platform with some data lake fe...
convergent evolution. what do you think about that?

 hard wing
Hey, is anyone familiar with the python pandas library and could maybe tell me why my read_csv(path) does not throw when there are problems with the file format, notably in the file I'm trying to read into a CSV file has a header with n values but the records in the file contain E.g. n+1 values, therefore it should result in a ValueError exception, but it isn't. Pictures are added for clarity. Picture number one contains the file I'm trying to convert. Picture number two contains the code snippet which is responsible for reading the file. Picture number three is the result.
Thank you in advance.


 desert oar
tacit basin
Interesting. Do you have link to some data on that? And about which job pays mor...
desert oar
tacit basin
Interesting. Do you have link to some data on that? And about which job pays mor...
nope, just personal observation
floral hollow
does anyone know how to fix this error? its an error with cv2.imwrite()
cv2.error: OpenCV(4.6.0) D:\a\opencv-python\opencv-python\opencv\modules\imgcodecs\src\loadsave.cpp:737: error: (-215:Assertion failed) image.channels() == 1 || image.channels() == 3 || image.channels() == 4 in function 'cv::imwrite_'
where did you get this dataset? you should describe where it comes from and how it was collected. this is critically important in a data project. the quality of any model is entirely dependent on the quality of the data.
in this case the content of the data is potentially opinion-driven and controversial, which will be reflected in the model output.
desert oar
misty flint
convergent evolution. what do you think about that? <:kekHands:94869794071158790...
yep this is what i was getting at. not at all surprised that this is how the market is going.
desert oar
regal ingot
episodic or sequential
what do you mean by this?
regal ingot
like agents have different enviroment types
so if a program uses naive bayes classification would it be epsiodic or sequential
desert oar
hard wing
Hey, is anyone familiar with the python pandas library and could maybe tell me w...
!e ```python
import io
import pandas as pd
buf = io.StringIO("""x,y
1,2,3
4,5,6""")
data = pd.read_csv(buf, sep=None, engine='python')
print(data)
@desert oar :white_check_mark: Your 3.11 eval job has completed with return code 0.
001 |    x  y
002 | 1  2  3
003 | 4  5  6
interesting. this seems like a bug in the python csv engine @hard wing . i would file a bug report with pandas
actually wait
it might be inferring that the first column is an unnamed index column
!e ```python
import io
import pandas as pd
buf = io.StringIO("""x,y
1,2,3
4,5,6""")
data = pd.read_csv(buf, sep=None, engine='python', index_col=False)
print(data)
@desert oar :white_check_mark: Your 3.11 eval job has completed with return code 0.
001 | <string>:8: ParserWarning: Length of header or names does not match length of data. This leads to a loss of data with index_col=False.
002 |    x  y
003 | 0  1  2
004 | 1  4  5
yeah, that's what's happening. it's treating the "extra" columns as unnamed index columns
if you pass index_col=False it simply drops the unnamed columns
desert oar
regal ingot
so if a program uses naive bayes classification would it be epsiodic or sequenti...
i see. i don't know about reinforcement learning. naive bayes is a probability model that can be used outside of RL, so perhaps the answer is "neither".
desert oar
floral hollow
does anyone know how to fix this error? its an error with `cv2.imwrite()`
what kind of data are you writing? the error is complaining that the image doesn't have the expected number of channels.
hard wing
desert oar
if you pass `index_col=False` it simply drops the unnamed columns
Right well now I'm at least getting realistic values back, I wonder what happened to the error message though, is it the python engine that doesn't have this feature or? Previously I was getting a nice exception with additional information like the line which is responsible for causing the exception etc.
I'd like to terminate because the data I'm going to be using on it is pretty important and has to be in the correct format etc
I.e. none of it can be lost in the process
Appreciate the help btw, been trying to figure this out for a day
floral hollow
desert oar
what kind of data are you writing? the error is complaining that the image doesn...
i fixed it thans
desert oar
hard wing
Right well now I'm at least getting realistic values back, I wonder what happene...
yes, try removing engine='python'. why do you have it at all? because you want to try to infer the separator?
if the data doesn't have an index column, set index_col=False to trigger the warning and then use a warning filter to convert that specific warning into an exception
hard wing
Yes, the delimiters are dynamic, known at run-time and the c engine doesn't support infering
desert oar
!e ```python
import io
import warnings
import pandas as pd
from pandas.errors import ParserWarning
buf = io.StringIO("""x,y
1,2,3
4,5,6""")
with warnings.catch_warnings():
warnings.simplefilter("error", category=ParserWarning)
data = pd.read_csv(buf, sep=None, engine='python', index_col=False)
print(data)
@desert oar :x: Your 3.11 eval job has completed with return code 1.
001 | Traceback (most recent call last):
002 |   File "<string>", line 13, in <module>
003 |   File "/snekbox/user_base/lib/python3.11/site-packages/pandas/util/_decorators.py", line 311, in wrapper
004 |     return func(*args, **kwargs)
005 |            ^^^^^^^^^^^^^^^^^^^^^
006 |   File "/snekbox/user_base/lib/python3.11/site-packages/pandas/io/parsers/readers.py", line 680, in read_csv
007 |     return _read(filepath_or_buffer, kwds)
008 |            ^^^^^^^^^^^^^^^^^^^^^^^^^^^^^^^
009 |   File "/snekbox/user_base/lib/python3.11/site-packages/pandas/io/parsers/readers.py", line 581, in _read
010 |     return parser.read(nrows)
011 |            ^^^^^^^^^^^^^^^^^^
... (truncated - too many lines)
Full output: https://paste.pythondiscord.com/ikotapevub.txt?noredirect
desert oar
it's helpful to know lots of python arcana once in a while!
 versed gulch
hi is there a way i can use list comprehension to make the code more efficient?
exact_tp_coords_g, exact_tp_coords_p = [], []
for g_c in g_clusters:
  for p_c in p_clusters:
    if len(set(g_c).intersection(set(p_c))) > 0:
      exact_tp_coords_g.append(g_c)
      exact_tp_coords_p.append(p_c)
appending to a list in a loop is very nearly the same performance as a list comprehension
however if you want to use fancy python features, you can write it this way:
from itertools import product
import numpy as np

exact_tp_coords_gp = np.asarray([
    (g_c, p_c)
    for g_c, p_c
    in product(g_clusters, p_clusters)
    if len(set(g_c).intersection(set(p_c))) > 0
])
exact_tp_coords_g = exact_tp_coords_gp[:, 0]
exact_tp_coords_p = exact_tp_coords_gp[:, 1]
yeah that bundling vs. unbundling debate. looks like market is moving towards bundling of services atm
desert oar
or even this:
rom itertools import product
import numpy as np

def check_gp(pair):
    g_c, p_c = pair
    return len(set(g_c).intersection(set(p_c))) > 0

pairs = product(g_clusters, p_clusters)
filtered_pairs = filter(check_gp, pairs)
exact_tp_coords_gp = np.asarray(map(tuple, filtered_pairs))
 agile lava
Hi! Theres some tutorial or example for nesting groupby in dataframe?
The ide is a to apply sucesive griupby ober every iteration
versed gulch
desert oar
or even this:
```python
rom itertools import product
import numpy as np
def che...
Thanks, but forgot to mention that g_clusters and p_clusters are of different lengths
 unreal charm
Hi I just trained a language model, how to talk with it? It's Bert model
serene scaffold
 brave lotus
I am a beginner in ML , could anyone please tell me the map to how to learn ML
brave lotus
I am a beginner in ML , could anyone please tell me the map to how to learn ML
First you need to understand probability, statistics, differential calculus, and matrix multiplication
 short heart
Ive got a task of identifying different whales and the way I wanted to do it is get cnn to get features and then train decision tree based on that. Now heres the question: would it be critical if whales didnt face the same side? (Some upside down, some with tail to the right side, some with tail to the left)
steady basalt
serene scaffold
First you need to understand probability, statistics, differential calculus, and...
ahahhaha lmfaooo
steady basalt
brave lotus
I am a beginner in ML , could anyone please tell me the map to how to learn ML
what britney spears said. spend a year studying math and coding xD
THEN you will fully understand ML models
 cloud steppe
Hello, everyone, what are the requirements for someone to learn data analytics using python?
Should have prior knowledge in mathematics and statistics?
serene scaffold
cloud steppe
Hello, everyone, what are the requirements for someone to learn data analytics u...
First you need to understand probability, statistics, differential calculus, and matrix multiplication
well I guess that's mostly for ML
but yes, you do need to know stats. And you need to understand what different kinds of data are.
steady basalt
serene scaffold
First you need to understand probability, statistics, differential calculus, and...
I love how u just copy pasted
of each of those areas, matrix multiplication seems to be the smallest/fastest to learn
its literally week 2 of linalg
cloud steppe
serene scaffold
but yes, you do need to know stats. And you need to understand what different ki...
Can I learn python first then learn statistics later before combining both?
Are calculus, probability and matrix multiplication needed in data analytics?
steady basalt
cloud steppe
Can I learn python first then learn statistics later before combining both?
Ar...
for ML its related to the models, but youre gona need python, sql and other analysis tools in order to do anything
applied stats is always useful for anything related to analysis
id think that being good at python would make u stand out vs others but thats just an opinion
 odd meteor
cloud steppe
Hello, everyone, what are the requirements for someone to learn data analytics u...
odd meteor
cloud steppe
Hello, everyone, what are the requirements for someone to learn data analytics u...
Hi Nancy, welcome to PythonDiscord. May I ask which country you're from?
To your question...
You don't need prior knowledge on math and statistics before learning python for data analytics. However, it's pertinent to mention that, for you to unleash your superpower as a pythonista in data analytics, you must learn stats as you progress in your journey.
As regards stats, when it comes to data analytics, you'd need to start with
- Measures of Central Tendency
- Probability
- Hypothesis Testing & Statistical Inference
- A/B Testing
- Treatment Effect & Confounding (you might not necessarily need this but it won't hurt to know it)
- Add SQL & PowerBI / Tableau for creating dashboards and you're good to go.
- Last but not the least, you'd need to learn Python for data analytics
All the best in your journey 👍🏾
odd meteor
short heart
Ive got a task of identifying different whales and the way I wanted to do it is ...
This is in fact one of the tricks used when performing data augmentation on an image dataset. So, it's not a big deal if the whales aren't facing same direction.
steady basalt
odd meteor
Hi Nancy, welcome to PythonDiscord. May I ask which country you're from?
To yo...
What is the main difference between analytics and data science, that you dont need maths?
odd meteor
unreal charm
Hi I just trained a language model, how to talk with it? It's Bert model
What are you trying to build or what project are you working on? In otherwords, on what task did you train the language model? NMT, Text Summarization, ASR, Sentiment Analysis, NLG, NLU, etc
steady basalt
probably start w watching some youtube videos?
odd meteor
brave lotus
I am a beginner in ML , could anyone please tell me the map to how to learn ML
PREREQUISITES
Machine Learning is a field of applied statistics & applied mathematics. Our statistical models are then simply implemented through computers. This means to start off, you need to learn prerequisite mathematics and statistics along with have some basic knowledge of python programming.
In particular, you need to learn multivariate calculus, linear algebra and statistics & probability theory.
Calculus
• Stewart - Calculus [Series]
A very standard introductory calculus series
• MIT OCW - 18.01 and 18.02
MIT's own calculus subjects
• 3blue1brown - Essence of Calculus
The one, the only, 3blue1brown's excellent video series. Best complimented by formal course
Linear Algebra
• Strang - Introduction to Linear Algebra
Good intro linear algebra book
• MIT OCW - 18.06 Linear Algebra
MIT's own LA course, taught by Strang
• 3blue1brown - Essence of Linear Algebra
Statistics & Probability
• MIT OCW - 18.05 Introduction to Probability and Statistics
Programming
• MITx on edX - Introduction to Computer Science and Programming Using Python
Excellent introduction to programming
MACHINE LEARNING
Before you start specialising in any particular field, it's important to learn the core theory of Machine Learning for a broad exposure to ideas and techniques that you can likely apply to any field.
Core
• Bishop - Pattern Recognition and Machine Learning
- Also check out Model-Based Machine Learning by the same author
• Tibshirani, Friedman, Hastie - The Elements of Statistical Learning
• ColumbiaX on edX - Machine Learning
SPECIALISATIONS
Computer Vision
• Stanford - CS231n: Convolutional Neural Networks for Visual Recognition
Natural Language Processing
• Stanford - CS224n: Natural Language Processing with Deep Learning
Reinforcement Learning
• Sutton, Barto - Reinforcement Learning: An Introduction
• Berkeley - CS285: Deep Reinforcement Learning
desert oar
versed gulch
Thanks, but forgot to mention that g_clusters and p_clusters are of different le...
would still work, the product is all possible pairs
well then numpy array stuff might be different
but the idea is that you're looping over possible pairs and filtering them
odd meteor
steady basalt
What is the main difference between analytics and data science, that you dont ne...
Data scientists often work with vast stores of raw data, working as investigators to create ways to analyze and model that data using statistical analysis and heavy coding. The goal of their work is to uncover the questions the data can answer. Data science often lays the foundation for further investigation.
Data analysts leverage the modeling of the data scientist to create actionable and practical insights using a variety of tools. The work of data analytics involves using organized data to apply findings immediately.
 desert oar
data analysts look at data and report on data, data scientists do more technical stuff
of course, good data analysts can build models and good data scientists can report to the business
it's more about business function than anything, but data science usually implies significantly more technical skills
steady basalt
What sort of technical skill does DS have that a da wouldn’t
desert oar
steady basalt
What sort of technical skill does DS have that a da wouldn’t
straight-up programming, as well as a more mathematical/deeper understanding of statistics and ml
probably more experience building models and designing project plans
steady basalt
Should a good programmer skip on da?
 iron basalt
A lot of these job titles / differences only happen at large enough companies due to corporate structure and just having a lot of employees. They like to have separate people present things to higher up.
desert oar
depends entirely on your goals @steady basalt
desert oar
iron basalt
A lot of these job titles / differences only happen at large enough companies du...
DA and BI is split from DS even at small companies now
usually the DAs build KPI dashboards while the DS build models
steady basalt
I prefer DS or de over da cause I r not once used bi
iron basalt
desert oar
DA and BI is split from DS even at small companies now
Yeah they are probably trying to split out the difference between can program and can't program.
steady basalt
As someone who can programme would I be over skilled as a da?
I don’t wish to peruse swe though
desert oar
iron basalt
Yeah they are probably trying to split out the difference between can program an...
that and model building. obviously deep learning has become fairly accessible but you still need to know what you're doing with it
odd meteor
desert oar
probably more experience building models and designing project plans
True that! 💯
iron basalt
Maybe, there are other skills, more business oriented. @steady basalt
steady basalt
Maybe sticking to ds and or de is best for my career even if da roles can look attractive and easier
desert oar
steady basalt
As someone who can programme would I be over skilled as a da?
not if you want to go down the DA path. being a good programmer will never be a bad skill around data
steady basalt
I’d suppose I’d be too limited on da path
desert oar
iron basalt
Maybe, there are other skills, more business oriented. <@119592011207540740>
this. DAs are expected to know the business deeply and might end up in meetings with alarmingly high-ranking people
iron basalt
A DA can insulate the DS from business.
desert oar
that too
odd meteor
steady basalt
I prefer DS or de over da cause I r not once used bi
So, DE or MLOps, which one do you prefer most? 😀
steady basalt
MLOps sounds good, but what’s the difference? Is it between DS and de?
That sounds exactly like what I do to be honest, a bit of both but without the formal math training DS ask for
Today I learnt how to solve 10th grade multivariate equations with improper powers 🥹
iron basalt
MLOps / DevOps is like the oil in the engine / a fixer.
odd meteor
They just keep coming up with all these names tbh... I think anyone who's into MLOps can straight up do Data Engineering. I think MLOps is broadly Software Engineering + DE + DevOps but for Machine Learning
iron basalt
DE can be a subset of DevOps / MLOps (same thing?).
The people that make things happen / work out (internally).
steady basalt
Good path?
Don’t see many advertised
Mlops
I beleive my new company will give me the regular “data scientist” role when I ask for it after my 6 month review… probably a good move career wise
Even if I’m not a algebra genius
iron basalt
If your team does not have Ops people explicitly, it will have them implicitly.
steady basalt
Ops is fun and a lot of learning
 craggy shadow
Hey if a company rents cloud space, what is then the process of data analysis/data flow? how do we clean the data from the cloud? do we store it in a separate RDMS and then analyze the data after? just trying to understand the process
odd meteor
I find this MLOps article from DataCamp quite interesting https://www.datacamp.com/blog/getting-started-with-mlops
Learn about the rise of MLOps and how to get started with a comprehensive set of resources
steady basalt
craggy shadow
Hey if a company rents cloud space, what is then the process of data analysis/da...
In my own experience yes the data sits on a database you pull from
Is collected by likely JavaScript devs or whatever they built their platform on
Graphql or some thing
You can technically download it locally using sql queries or just stream it straight over to cloud based tools for analysis
I spent weeks doing just this on Aws
serene scaffold
craggy shadow
Hey if a company rents cloud space, what is then the process of data analysis/da...
it's probably going to depend on the company, how much money they have to spend on cloud compute, and what compute resources they have as an alternative. One of my projects rents a VM on AWS, and we pretty much do everything for the project on that VM. Ideally, we'd be able to do more work locally, so that we could keep the cloud VM on for less time.
odd meteor
I'm not into MLOps yet so I don't know much about the field. More so, I think most Machine Learning Engineers can do what MLOps guys are doing.
steady basalt
EC2!!
Ster, u guys can just run a lambda to launch the VM when need be
If it’s a specific time
serene scaffold
steady basalt
Ster, u guys can just run a lambda to launch the VM when need be
we know what our options are
cloud steppe
odd meteor
Hi Nancy, welcome to PythonDiscord. May I ask which country you're from?
To yo...
Hello, I am from Kenya. Thanks for the detailed explanation. Would you mind suggesting any useful course or resources that I might use to learn data analysis. I intend to learn on my own.
steady basalt
Sorry…
iron basalt
odd meteor
I'm not into MLOps yet so I don't know much about the field. More so, I think mo...
Yeah, it's just that someone has to actually extract the value being generated by the rest of the team. Because this is so crucial, it has its own role dedicated to it.
steady basalt
What’s the name for the dev who codes the functions that allow Athena to pull data from a non rdb
desert oar
craggy shadow
Hey if a company rents cloud space, what is then the process of data analysis/da...
it depends on what kind of renting you're talking about. very often you're already storing your data in a cloud platform of some kind, so if you are doing cloud compute you just pull the data from wherever it's already hosted
steady basalt
Cloud engineer?
odd meteor
cloud steppe
Hello, I am from Kenya. Thanks for the detailed explanation. Would you mind sugg...
Another African in the house 🇰🇪 Karibu kwenye PythonDiscord. My swahili is rusty lol but I'm from Nigeria
desert oar
iron basalt
Yeah, it's just that someone has to actually extract the value being generated b...
in bigger organizations it's also there to support the team. running systems like mlflow and even airflow, as well as making sure the data scientists have access to the computer they need
steady basalt
odd meteor
Another African in the house 🇰🇪 Karibu kwenye PythonDiscord. My swahili is ru...
Jambo bwana
odd meteor
steady basalt
Jambo bwana
Wow are you Kenyan too? You speak Swahili?
steady basalt
No I’m British and we have close ties to Kenya especially in school
Stuff like school building, charity, twin school
craggy shadow
@desert oar Can the data already be in a RDMS where it is hosted on the cloud? or is that an additional cloud service that we would have to have that requires more than just cloud storage space?
steady basalt
craggy shadow
<@389497659087650836> Can the data already be in a RDMS where it is hosted on th...
Cloud services let a company have its data on a rdbs on its own as a service, as well as pure storage
Check out s3 and dynamodb
craggy shadow
@steady basalt even if you dont partner w them and just rent space on AWS?
odd meteor
cloud steppe
Hello, I am from Kenya. Thanks for the detailed explanation. Would you mind sugg...
Use this resources https://drive.google.com/file/d/19-LhSy30Pf1zxtk0GCmmevItl_xoob7W/view

Google Docs
steady basalt
Is that a thing? People rent space without partnering for services? In theory yeah nothing stopping u just renting s3 storage
Idk if that’s cost efficient
I guess if u only wanted file hosting
odd meteor
steady basalt
No I’m British and we have close ties to Kenya especially in school
Ohh that's cool. 
craggy shadow
I know but like im doing a school assignment where i have to create a process flow diagram as a data analyst and the scenario is that we just rented space on AWS for our applications and databases instead of partnering
steady basalt
craggy shadow
I know but like im doing a school assignment where i have to create a process fl...
As a analyst you’d probably wana use Athena tied with a rdbs
As well as glue between that and potentially quick sight
Or I think quicksight reads it straight up actually
No need for etl
Data stored on rdbs can be queried in sql
But for a DA u may just tell Amazon quick sight to pull data from the DB via Athena and display it
Entirely on cloud, feels very limited but will probably get ur job done
If you just use s3 I’d assume the same is possible but I never did that. You can also use boto3 to read, query and move data
 trail rune
odd meteor
Another African in the house 🇰🇪 Karibu kwenye PythonDiscord. My swahili is ru...
trail rune
odd meteor
Another African in the house 🇰🇪 Karibu kwenye PythonDiscord. My swahili is ru...
👋👋👋 Another Nigerian here too
steady basalt
Does anyone know if azure sdk has the same abilities as boto3?
odd meteor
trail rune
👋👋👋 Another Nigerian here too
Hi D_Lone, Kedu, Bawo ni, Hafa? 😄
trail rune
odd meteor
Hi D_Lone, Kedu, Bawo ni, Hafa? 😄
I dey o
trail rune
odd meteor
Hi D_Lone, Kedu, Bawo ni, Hafa? 😄
Wetin dey sup?
craggy shadow
@steady basalt How can we do this without using any additional cloud services? can we maybe access data on the cloud, clean it, store it in a seperate RDMS database and then analyze?
odd meteor
trail rune
I dey o
Are you into ML Research or Engineering?
trail rune
odd meteor
Are you into ML Research or Engineering?
Engineering
 queen lagoon
Hello guys
odd meteor
trail rune
Wetin dey sup?
I'm doing great myself bro.
queen lagoon
I'm very new to machine learning and deep learning, can you guide me please?
steady basalt
I have personally never build a rdms on the cloud you’d need software engineer help to get Tyne data from source if its live and not just csv uploads
@craggy shadow
steady basalt
I’d assume that’s largely what cloud use case is otherwise u can analyse locally
trail rune
odd meteor
I'm doing great myself bro.
What of you, are into engineering or research?
steady basalt
queen lagoon
Anyone here can help please?
Honestly I’d start by university or something or else projects will become insanely hard to self teach
queen lagoon
steady basalt
Honestly I’d start by university or something or else projects will become insan...
my project isnt that hard
steady basalt
There’s no way I could have self taught everything from no code, no stats to ds
And I’m pretty resilient
queen lagoon
I want to analyse a graph and make predictions
steady basalt
A graph?
queen lagoon
Yes, a chart
queen lagoon
can i dm you ?
steady basalt
I’m not sure if my account allows it so u can try
queen lagoon
check it out
steady basalt
Yeah didn’t work just ask here
But analysing a graph and making predictions may not require me
Ml
And definetley not deep learning
queen lagoon
Why not deep learning ?
queen lagoon
let's take the sp500 index for example
odd meteor
queen lagoon
I'm very new to machine learning and deep learning, can you guide me please?
Hi Artemys, welcome to PythonDiscord. Refer to this #data-science-and-ml message
Additional Resources
-
Mathematics for Machine Learning: Linear Algebra: https://www.youtube.com/watch?v=T73ldK46JqE&list=PLiiljHvN6z1_o1ztXTKWPrShrMrBLo5P3
-
Mathematics for Machine Learning: Multivariate Calculus: https://www.youtube.com/playlist?list=PLiiljHvN6z193BBzS0Ln8NnqQmzimTW23
-
https://www.reddit.com/r/MachineLearning/comments/j4avac/p_i_created_a_complete_overview_of_machine/
If these are overwhelming and you wouldn't mind making a financial commitment to learn ML, then I'll suggest checking out ML courses on any DataQuest, DataCamp, Udacity, or Udemy.
All the best 👍🏾

Welcome to the “Mathematics for Machine Learning: Linear Algebra” course, offered by Imperial College London.
Week 1, Video 1 - Introduction: Solving data science challenges with mathematics
This video is part of an online specialisation in Mathematics for Machine Learning (m4ml) hosted by Coursera. For more information on the course and to ...

YouTube
Welcome to the “Mathematics for Machine Learning: Multivariate Calculus” course, offered by Imperial College London. This video is an online specialisation i...
reddit
718 votes and 74 comments so far on Reddit
queen lagoon
not exactly
steady basalt
Then?
steady basalt
odd meteor
Hi Artemys, welcome to PythonDiscord. Refer to this https://discord.com/channels...
The imperial course is absolutely not suitable for beginners, awful
steady basalt
And what graph analysis are you doing?
queen lagoon
well, it has to analyse the prices doesnt it ?
I know that the ai doesnt need visual graphs
steady basalt
You want to visualise predictions of stock prices
odd meteor
trail rune
What of you, are into engineering or research?
Engineering & Research but I'm trying to get into NLP Research formally via Graduate School.
steady basalt
If ur brand new to ml this is a very very hard task because I don’t think experts could do it well, but if u just wana see what the output is I’d recommend learning timeseries analysis with python
queen lagoon
steady basalt
If ur brand new to ml this is a very very hard task because I don’t think expert...
why would it be hard ?
steady basalt
Because stop prices are effected by so many unknowns
queen lagoon
There's an easy way to make it teach itself
queen lagoon
its not quite random that is the thing
machine learning will find the patterns that are hidden
steady basalt
No technically not, but you need to understand that random things effect it more than what u can model
queen lagoon
bear with me a second, there is 2 ways to teach it right ?
odd meteor
odd meteor
Engineering & Research but I'm trying to get into NLP Research formally via Grad...
lol I see you bro @serene scaffold 😀
steady basalt
I’ve done time series on blood readings and was fairly straight forward because persons bloods are predictable
queen lagoon
either you give it a lot of data and label it like for example show it a dog and label it a cat etc
or you just give it a picture of a dog and let it find it itself by generations
right ?
steady basalt
This is different to predicting totally random stock fluctuations
queen lagoon
just bear with me
steady basalt
Because nothing is stopping a whale from making a random buy in and ruining ur pattern
Or a bomb going off somewhere, or a report leaking
queen lagoon
steady basalt
Because nothing is stopping a whale from making a random buy in and ruining ur p...
yes exactly, but that s the exception not the rule
the rule is simple
steady basalt
No it isn’t
queen lagoon
but sometimes shit happens
im saying, that the success rate of an ai that thought itself is much higher than a human
steady basalt
Ur basically saying u want to make something that can inform a trading algorithm
odd meteor
steady basalt
The imperial course is absolutely not suitable for beginners, awful
It's not customer-friendly or cool but too advance?
steady basalt
It’s some next level quant man
steady basalt
Yes for a team of experienced quants
queen lagoon
without quantum shit
steady basalt
Not with new to ml skills
steady basalt
Why???
queen lagoon
because i know it will work
steady basalt
How many data scientists have told u so?
queen lagoon
you will see brother
steady basalt
😬
Are u gona sit and buy when ur model predicts a increase and sell before it predicts a drop
trail rune
queen lagoon
because i know it will work
If it's as easy as you seem to think.
Don't you think all data scientists would be predicting stock prices and smiling to their banks?
queen lagoon
nop, im not gonna do anything, everything will be automated
steady basalt
How?
queen lagoon
I have a plan 🙂
steady basalt
What’s the plan
queen lagoon
come dm
steady basalt
Just put it here
tacit talon
help me withpython basic syntax please
serene scaffold
tacit talon
help me withpython basic syntax please
This is the data science channel. But if you want help, you need to ask an actual question.
 burnt falcon
desert oar
however if you want to use fancy python features, you can write it this way:
```...
burnt falcon
desert oar
however if you want to use fancy python features, you can write it this way:
```...
what the hell. that's cool. sorta can follow. props
lapis sequoia
anyone else gone through this? https://github.com/karpathy/nn-zero-to-hero

GitHub
Neural Networks: Zero to Hero. Contribute to karpathy/nn-zero-to-hero development by creating an account on GitHub.
 woeful hedge
With Reinforced Supervised Learning Using Machine Learning On A Closed System With Say Python, Is It Possible To Link My Library From Google Books And Choose Specific Books By Sequence For The AI To Read And Store It In Memory To Go Alongside Training Data For Such A System Later.
lapis sequoia
I am trying to have a list as all the values in a df column. But it's not allowing me

 woeful hedge
Nice data input. You put a lot of thought into it @lapis sequoia
lapis sequoia
hmm. Is it sarcasm
anyways. The issue is that it's considering the list as a series object rather than something to copy along in all the elements of a series
I wanna turn it off
lapis sequoia
woeful hedge
What language is that
python?
woeful hedge
I use VSCode dark mode so syntax color and wrapping look different from mine. Thanks
lapis sequoia
it's a jupyter notebook
woeful hedge
Oh! That's why. I do everything on a local M.2. So anyways double check your grammars real quick.
tacit moss
what is this error?
ValueError: Found input variables with inconsistent numbers of samples: [106582, 1]
so i was trying to use a trained random forest model from historical dataset [532909 rows x 8 columns]
to predict the user input (so the dataframe will be just 1 rows x 8 column.
however, i am getting this error. anyone know why?
 quartz thicket
This is a simplified and trimmed down chunk of code I want to run. But it is of course insanely slow. I've a notion to stop using lists of tuples and switch to ndarrays, but I don't see any easy way to reproduce the functionality of more_itertools distince_combinations (or other itertools for that matter) Should I investigate numpy further or tackle this from a totally different angle?
from more_itertools import distinct_combinations as dCombos
from more_itertools import flatten

possExtras = [(0, 5), (0, 8), (0, 10), (0, 11), (0, 19), (0, 23), (0, 24), (0, 31), (1, 5), (1, 8), (1, 10), (1, 11), (1, 19), (1, 23), (1, 24), (1, 31), (2, 9), (2, 12), (2, 13), (2, 14), (2, 15), (2, 16), (2, 26), (2, 30), (3, 9), (3, 12), (3, 13), (3, 14), (3, 15), (3, 16), (3, 26), (3, 30), (4, 5), (4, 8), (4, 10), (4, 11), (4, 19), (4, 23), (4, 24), (4, 31), (5, 17), (5, 21), (5, 27), (5, 28), (5, 29), (6, 9), (6, 12), (6, 13), (6, 14), (6, 15), (6, 16), (6, 26), (6, 30), (7, 9), (7, 12), (7, 13), (7, 14), (7, 15), (7, 16), (7, 26), (7, 30), (8, 17), (8, 21), (8, 27), (8, 28), (8, 29), (9, 18), (9, 20), (9, 22), (9, 25), (10, 17), (10, 21), (10, 27), (10, 28), (10, 29), (11, 17), (11, 21), (11, 27), (11, 28), (11, 29), (12, 18), (12, 20), (12, 22), (12, 25), (13, 18), (13, 20), (13, 22), (13, 25), (14, 18), (14, 20), (14, 22), (14, 25), (15, 18), (15, 20), (15, 22), (15, 25), (16, 18), (16, 20), (16, 22), (16, 25), (17, 19), (17, 23), (17, 24), (17, 31), (18, 26), (18, 30), (19, 21), (19, 27), (19, 28), (19, 29), (20, 26), (20, 30), (21, 23), (21, 24), (21, 31), (22, 26), (22, 30), (23, 27), (23, 28), (23, 29), (24, 27), (24, 28), (24, 29), (25, 26), (25, 30), (27, 31), (28, 31), (29, 31)]

if __name__ == '__main__':

    possCombos = [combo for combo in dCombos(possExtras, 16) if len(set(flatten(combo))) == 32]
    print(possCombos)
possExtras won't be the same every time, but this is a goor represntation of what I'd be dealing with.
floral hollow
how can i combine the training images and training labels to the testing images because i don't need to testing images anymore?
 livid goblet
Why should I install a Jupyter notebook environment on my computer when I can use it online for free ?
floral hollow
livid goblet
Why should I install a Jupyter notebook environment on my computer when I can us...
easier access
livid goblet
floral hollow
easier access
I see ! thanks for answering
 grave swallow
any way to auto train a image recognition ml model?
trail rune
There are tons of no code/low code AutoML services, if that's what you mean.
brave lotus
Anyone,here pls msg me if you have a grip on Anaconda,Gdal and jupyter??
lapis sequoia
grave swallow
any way to auto train a image recognition ml model?
Yes search tutorials for resnet50
 lapis sequoia
brave lotus
Anyone,here pls msg me if you have a grip on Anaconda,Gdal and jupyter??
lapis sequoia
brave lotus
Anyone,here pls msg me if you have a grip on Anaconda,Gdal and jupyter??
What do you need
 mild dune
I've noticed that when conducting a t test using thettest_1samp function from scipy.stats, the p-value is always about 0.004 less than than doing is manually using norm.cdf, is this supposed to happen? I can't figure out what's causing it
lapis sequoia
mild dune
I've noticed that when conducting a t test using the```ttest_1samp``` function f...
They’re not the same calculation?
mild dune
I'm just beginning to learn scipy and I'm not familiar with what caculation ttest_1samp is doing but for for norm.cdf I used the expected mean and np.std(dataset) / np.sqrt(len(dataset)) for the mean and standard deviation arguments
lapis sequoia
Right that’s for a normal distribution
T test is for a student t distribution whose tails are slightly heavier
 lapis sequoia
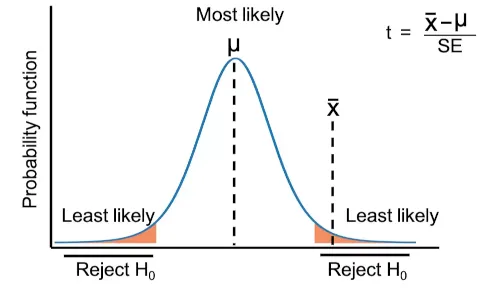
Data science blog
Calculate three types of t-test from scratch
lapis sequoia
mild dune
okay I didn't know that
Yes we use heavier tails of t student distribution usually for smaller samples as to not assume too much
mild dune
okay that's cool. For some reason I always assumed t tests were for normal distributions
lapis sequoia
mild dune
okay that's cool. For some reason I always assumed t tests were for normal distr...
Nope that’s a z test
mild dune
alright thanks for clear up the confusion
fossil ivy
hello everyone, I need to do a sensitivity analysis for my results right now
I simulate the day-to-day logistics of offshore wind farm decommissioning in hourly steps
And I want to identify the impact of learning effects, captured through a decrease in activity durations
In your opinion, should I do that in %-steps (like -10%, normal, +10%...) because this is quite hard
Since I run in hourly steps, taking 10% of 33 hours is a bit annoying because I would have to adapt my entire model
Would it in that case be valid to just say (-10 hours, -5 hours, 0, +5 hours, +10 hours)?
steady basalt
Did the definition of sensitivity analysis change with the advent of ML ? My stats tutor had a really different definition
 wooden sail
sensitivity analysis in statistics includes studies of curvature of probability density functions
e.g. the derivative of likelihood functions w.r.t. their parameters
steady basalt
So.. in ml it’s like, changing the model output?
wooden sail
that's one way to look at it
to study how much the output changes for small changes in the input
"sensitivity" is a rather broad term, so you find it in different flavors depending on the field
wooden sail
you'll find it being related to robustness (either to randomness or other effects), being "well conditioned", etc.
wooden sail
my best advice is to never do that lol. you see something, you read about it 😛
make sure you know what you're being asked for
steady basalt
I mean the question was just “sensitivity analysis” 5 marks
Half way down the assignment
wooden sail
well, and what did you learn in class about sensitivity analysis
steady basalt
They Didn’t explicitly mention it unless I just missed a week
This was like logistic modelling and linear modelling
And robustness
Or like “good practise” assumptions
wooden sail
there it is, then. robustness is probably what they meant
but yeah, better go review
steady basalt
What is robustness to you
wooden sail
depends on the context 😛 it doesn't matter what "i think" it is
brave lotus
brave lotus
Anyone,here pls msg me if you have a grip on Anaconda,Gdal and jupyter??
pls guys i need an urgent help??
serene scaffold
brave lotus
Anyone,here pls msg me if you have a grip on Anaconda,Gdal and jupyter??
you have to ask a specific question to get help.
 copper saddle
opt = gradient_descent_v2.SGD(learning_rate=lr, decay=lr/epochs)
NameError: name 'lr' is not defined
I got this while performing a chatbot python code,
How to clear this error?
serene scaffold
idk what gdal is. my recommendation is to not use anaconda, and to use jupyter sparingly.
serene scaffold
copper saddle
opt = gradient_descent_v2.SGD(learning_rate=lr, decay=lr/epochs)
NameError: name...
you have to define a value for lr. if you're copying from a tutorial, you must have missed the line where it's defined.
steady basalt
copper saddle
opt = gradient_descent_v2.SGD(learning_rate=lr, decay=lr/epochs)
NameError: name...
Learning rate probably takes a float !!!
@serene scaffold is it more common for people to set a lr variable? I prefer to just code it within whatever I’m making
serene scaffold
steady basalt
<@253696366952316929> is it more common for people to set a lr variable? I prefe...
it's just a matter of preference.
some people like to have all their hyperparameters as "constants" near the top of the file.
steady basalt
Fair, might make it easier to find if it’s a lot of n code
steady basalt
What’s this new harmonic mean joke? Since when is this a hard concept?
grave swallow
is there a way i can speed up the training of a image recognition model
currently using teachable and i have to manually put 800 images in the classes
any help woild be appreciated
serene scaffold
grave swallow
is there a way i can speed up the training of a image recognition model
current...
use a GPU and use the largest batch size that can fit on the GPU
grave swallow
serene scaffold
use a GPU and use the largest batch size that can fit on the GPU
uh sorry a lil new i am, can you explain it in laymen terms?
serene scaffold
grave swallow
uh sorry a lil new i am, can you explain it in laymen terms?
a GPU is a graphics processing unit, which is a piece of hardware. But the thing that makes GPUs good at rendering graphics for video games also means that they can run deep learning algorithms faster than a CPU. If you don't have a GPU, there is probably nothing you can do to speed up your training that will make a substantial difference.
you can get some GPU computation for free on google colab.
The point of the batch size, in this case, is to make sure you're always using as much of the GPU as possible.
grave swallow
nono what i meant by training was to upload the images, is there any way to automate that?
serene scaffold
upload the images. to where?
 timber sky
hi fellas. Does anyone know of a free to use library to extract text / digits from a picture?
grave swallow
serene scaffold
upload the images. to where?
teachable
if you know a better site for image recognition model builder pls lemme know
compact star
If I am trying to use q learning for smb1, and I want the ai to pick the action that has the maximum q value, do I need to store all possible actions like (left and run) as one action or(right jump and run)?
 sweet river
is anyone doing project related to deep learning?
compact star
yeah I am
sweet river
on which topic specially?
serene scaffold
lapis sequoia
can anyone help me with a chatbot pls ?
You have to be more specific before anyone will commit to helping
steady basalt
That guy yesterday is trying to make me build him a crypto predictor @serene scaffold
And won’t tell me his secret method until I do
Said I’d be rich
serene scaffold
steady basalt
That guy yesterday is trying to make me build him a crypto predictor <@253696366...
Just build a model with arbitrary outputs, but with a crash every Tuesday.
iron basalt
serene scaffold
Just build a model with arbitrary outputs, but with a crash every Tuesday.
Maybe there should be a pin of gambler's fallacy, inverse gambler's fallacy, gambler's conceit, gambler's ruin, and efficient-market hypothesis...
 strong sedge
steady basalt
Said I’d be rich
strong sedge
steady basalt
Said I’d be rich
Ahh
Afaik you can't really predict the price of a crypto or a stock cause it's not really just dependent on privious prices
It's dependent on the market, the news, general public intrest etc
There are a bunch of factors other than just price
The information given to the model is incomplete and hence the output given by the model is not better than a 50/50
steady basalt
serene scaffold
Just build a model with arbitrary outputs, but with a crash every Tuesday.
cringe how he said hes gona put together a team and be rich, and i asked him whats his secret ingrediant and apparnetly i wont know u ntil i finish his work
steady basalt
strong sedge
Ahh
Afaik you can't really predict the price of a crypto or a stock cause it's n...
yeah its not possible, unless we had more undersatanding
iron basalt
strong sedge
Ahh
Afaik you can't really predict the price of a crypto or a stock cause it's n...
I'm not sure if there is a term for this kind of thinking / fallacy, would be nice to have to reference.
iron basalt
steady basalt
cringe how he said hes gona put together a team and be rich, and i asked him wha...
Another term for "if it seems easy many have already tried it. How many of them are rich?" would be useful for reference too.
steady basalt
'someone whos never studied data science and thinks they somehow know better than those who have' ?
we can call them ducks
iron basalt
steady basalt
'someone whos never studied data science and thinks they somehow know better tha...
Sort of related to Dunning-Kruger effect.
serene scaffold
iron basalt
Maybe there should be a pin of gambler's fallacy, inverse gambler's fallacy, gam...
would you like to write it?
serene scaffold
We can call them Ducking Krugers. Or Dunning-Quackers.
 narrow verge
tensorflow or pytorch for reinforcement learning?
serene scaffold
narrow verge
tensorflow or pytorch for reinforcement learning?
they're basically the same, but more people are tending towards pytorch.
narrow verge
serene scaffold
they're basically the same, but more people are tending towards pytorch.
why's that?
serene scaffold
narrow verge
why's that?
I don't really know.
narrow verge
i've been trying to use tensorflow but i'm stuck with meaningless error messages that are like 8 calls down
tf_agents to be precise
serene scaffold
Sorry to hear.
narrow verge
it this an issue with pytorch too?
serene scaffold
are you alleging that it's an issue with tensorflow? because it's very unlikely that you've discovered a bug in tensorflow.
narrow verge
its not really a bug its probably somewhere i have gone wrong in my code
its more that the error is thrown in a weird place and is difficult to trace back
what im really asking is does pytorch have better input validation?
serene scaffold
That's a great question, but I'm not sure. Sorry I can't be more helpful.
narrow verge
np
steady basalt
narrow verge
i've been trying to use tensorflow but i'm stuck with meaningless error messages...
this is exactly why britney spears said people tending towards pytorch
serene scaffold
what
serene scaffold
which one are you talking about
narrow verge
i spent the last hour putting print statements in the tensorflow (tf_agents) code
steady basalt
tf where the guys got a error
honestly if u invest the time to learn pytorch for ur needs i think u wont get this error
ive never done RL tho
serene scaffold
narrow verge
i spent the last hour putting `print` statements in the tensorflow (tf_agents) c...
use pycharm
steady basalt
ye, pycharm + pytorch is a nice combo
im still not amazing at torch tho, takes a bit of effort to learn
but from what i can do i can feel how its much nicer for coders
serene scaffold
if something doesn't take effort to learn, no one will pay you that much to do it.
steady basalt
i wonder if tensorflow will become relegated to a teaching software and pytorch will take over
for production?
narrow verge
i was taught tensorflow through uni
steady basalt
same
narrow verge
i struggled a lot with finding documentation
narrow verge
serene scaffold
use pycharm
does it support jupyter notebooks?
serene scaffold
narrow verge
does it support jupyter notebooks?
yes. but don't give in to the notebook addiction
narrow verge
atm im running a remote vscode connection onto my uni machines (cos they have better gpus)
does pycharm like that?
serene scaffold
oh. pycharm doesn't let you do remote notebooks, last I checked. but dataspell does.
steady basalt
I’d still rather use pycharm community than dataspell
serene scaffold
I haven't used dataspell
I wonder if you can do remote notebooks if you use gateway
steady basalt
Why are notebooks so popular?
narrow verge
so its a good idea to ditch TensorFlow for what i'm doing and pick up PyTorch instead?
narrow verge
steady basalt
Why are notebooks so popular?
not too sure
they are alright but not revolutionary
steady basalt
Is it just to be able to get bearings of impact and dataframes as you go along?
serene scaffold
steady basalt
Why are notebooks so popular?
because non-programmer data scientists get addicted
steady basalt
I mean the pros
serene scaffold
what do you mean "the pros"?
steady basalt
U can run changes and see visually at each part
Dataframes in pycharm return as something very ugly in the console
serene scaffold
notebook addicts can still be very knowledgeable and deserve top-dollar salaries.
narrow verge
if i was doing something in prod i wouldnt use notebooks
serene scaffold
but we all know the real heroes are their ML-ops team
serene scaffold
narrow verge
if i was doing something in prod i wouldnt use notebooks
some people don't know that.
steady basalt
@serene scaffold how do you get nice output in pycharm like pretty dataframes that aren’t text based in console
When printed
serene scaffold
misty flint
<@253696366952316929> came across this gem
case in point
serene scaffold
steady basalt
<@253696366952316929> how do you get nice output in pycharm like pretty datafram...
I don't know. I only use notebooks when I'm SSHed into my prod VM and I need to make some matplotlib shit
steady basalt
This is one thing I like about notebooks, seeing data nicely at a certain point in code
which u cant rly do in pure ide
ud need to click on 'view df' somewher ein the debugger
narrow verge
well here we go
off to a good start already
Exception: You tried to install "pytorch". The package named for PyTorch is "torch"
steady basalt
wow, suprised that theres an error that can do that
narrow verge
could just download pytorch for me but nah i guess
narrow verge
yeah im downloading it now
probably saving time learning another framework because this isn't the first time that the error messages have been vague
narrow verge
gonna do the intro docs first see if its any good
serene scaffold
steady basalt
<@253696366952316929> do u like vscode
never used it.
steady basalt
@serene scaffold I don’t think it’s impossible to make a model that could predict if a stock will move up or down the next day tbh
If u had the right data
Wudnt be totally reliable but cud come close
Above 50%
Even 52% wud be good
Have read a couple papers which suggest current work is going to be on incorporating sentiment and more economics
serene scaffold
steady basalt
<@253696366952316929> I don’t think it’s impossible to make a model that could p...
you can't have a model that makes non-trivial predictions with 100% accuracy.
steady basalt
Of course, but you beat 50% and make money
serene scaffold
steady basalt
Of course, but you beat 50% and make money
I'm pretty sure most stock trades in the world are AIs interacting with eachother
steady basalt
Obviously retail investors don’t hold all the power to move stocks, but I wonder if a wide reaching sentiment analysis would foreshadow moves
serene scaffold
What do you think, @stark mulch?
steady basalt
Yeah, not something you could pull off if you’re not a Goldman Sachs funded lab unless you want to risk losing your savings, but I wonder if such work is being done and informing as of 2022
Not many papers
Meh
Not great
 thorn bobcat
hello!
 charred light
I'm doing a image classification CNN on the Standford Dog Breed dataset. My model is over fitting. I have a drop out layer, and I am doing augmentation. Model & image transformation code: https://paste.pythondiscord.com/waxokaguru. I can adjust my early stopping but what are ways I can increase validation?

Here's what the dataset loss can be if done properly.
 thorn bobcat
has anyone attempted a dynamic approach to model weight initialisation
like assuming a model was finetuned to dogs and cats, can't i use both the variations to preserve the performance of each model state?
I am asking cause I am working on this topic for my final graduation project.
lapis sequoia
does anyone knows how to train multilabel multiclass classification?


 vestal spruce
I'm trying to make a computer vision for measuring object with a plane/paper as reference on a mobile device, is it possible to use TFLite for this? or is there a straighforward method that I can use?
 dense lagoon
can you do supervised learning with pytorch?
 lost scarab
Hey
 glad ermine
Hi everyone, I'm new to matplotlib and would like to know if I can plot such a graph with it. Is there another tool that suits this task much better?
 floral hollow
How can i merge two training data sets?
essentially something like this
train_labels.append(extra_labels)```
the images in question are from keras.datasets.fashion_mnist
this is how i am loading the dataa
```clothes = keras.datasets.fashion_mnist
(train_images, train_labels), (extra_images, extra_labels) = clothes.load_data()``` neon vessel
would someone recommend me good tutorial about linear algebra 🙂
wooden sail
check out gilbert strang's course on mit ocw
but this sort of stuff requires a book as well. i'd also say gilbert strang's book is good
steady basalt
neon vessel
would someone recommend me good tutorial about linear algebra 🙂
i second strang book but it gets into the import stuff quite late as you need to cover basis first w vectors n stuff
but thats the kind of book u want to have a second material for such as videos, rather than solo
as it could be hard to do alone
wooden sail
that's a fair assessment. if all you want is to pick up some tools, there are other reads that just present them. this goes more in depth, which requires building up a base slowly
steady basalt
i h ave all linear algebra on hold until 10 months frmo now
im ONLY calculus
not for data science but for general competence
neon vessel
I forgot everything i have learnt at school about liner algebra 😄
steady basalt
if u ddi that in school ull prob recall very fast
serene scaffold
As much as we like to say that one needs to know linear algebra, do we really need to know more than general array arithmetic and matmul? because I don't think I've ever used determinants.
neon vessel
it was a long time ago haah
steady basalt
serene scaffold
As much as we like to say that one needs to know linear algebra, do we really ne...
this ^ id feel fine just knowing such basics
wooden sail
serene scaffold
As much as we like to say that one needs to know linear algebra, do we really ne...
my answer would be definitely yes
wooden sail
understanding the meaning of a transpose and a dot product is already super important
steady basalt
wooden sail
my answer would be definitely yes
on the job? modelling for clients?
steady basalt
wooden sail
understanding the meaning of a transpose and a dot product is already super impo...
I dont think this is also that far into linalg its prety basics no?
wooden sail
that's exactly my point, everything from the very basics to the very end is important
can't very well understand an svd if you don't understand a dot product
and as that's linked to PCA and so forth...
steady basalt
i feel like its the hardest to get your head around in all areas but its also the simplest for some reason
wooden sail
steady basalt
on the job? modelling for clients?
and well, that depends. if you just want to use tools, that's fine. i do need to know all of this stuff in my job, but i understand not everyone does
serene scaffold
I was taking linalg in spring 2020. and we all know what happened eight weeks into that semester 🙈
steady basalt
simplest/easiest but hardest to understand in the first place
i dont know
dropped?
serene scaffold
@wooden sail no crown. my point is that I probably need to review at some point.
wooden sail
the best part is that linalg isn't even about matrices and "vectors" as arrays of numbers, so it generalizes quite far
wooden sail
serene scaffold
<@467435887236612106> no crown. my point is that I probably need to review at so...
i put a crown cuz corona means crown
serene scaffold
wooden sail
i put a crown cuz corona means crown
ah right. in the US, we pretty much only call it covid
steady basalt
here covid start the nationwide lockdown end of march
uni shut down
do u guys still remember how to simplify surds
like cubed roots and stuff
wooden sail
do you have an example? i don't know the word "surd"
steady basalt
like
what is cubed root of 80 in simplest terms
then u say its cubed root of 10 times cubed root of 8
therefore answer is 2root10 or something like that
serene scaffold
I've never heard of a surd either.
wooden sail
that's fine, i just didn't know that word
steady basalt
surd is where you have irrational number
like u cant just turn it do wn to a integer
yeah this took up 2 hours of my day last night
good old days
 wooden sail
if you're given numbers, you usually try building something out of the prime factors
steady basalt
factoring took up 1 hour of my day
 dreamy isle
steady basalt
factoring took up 1 hour of my day
dreamy isle
steady basalt
factoring took up 1 hour of my day
why?
steady basalt
i was going throgh this 7 hour algebra video
because i forgot a bunch of rules that basically made clac harder than it should be
like rationalising
exponents
etc
also cause its kind of fun
copper mica
hey guys
i dont' have enough DevOps/MLOps knowledge here
my workflow with an IDE is a lot better than using the web ide on google colab. Can i still train a model on a cloud service but develop locally?
i'm guessing i need to deploy an app right?
i develop on a mac so no GPU. Testing locally is a pain
serene scaffold
copper mica
my workflow with an IDE is a lot better than using the web ide on google colab. ...
what IDE are you using?
and is your objection to colab the overall experience, or specifically it being a notebook environment?
desert oar
copper mica
my workflow with an IDE is a lot better than using the web ide on google colab. ...
yes, you'll need to run your code using ssh or equivalent
if your IDE supports remote editing, you can edit the files directly over SSH. otherwise you can write a script that runs your code by first rsync-ing it up to the cloud machine, and then invoking the run/train/whatever program on the cloud machine
e.g. you can put this in cloudrun.py:
#!/usr/bin/env python3 -u

import subprocess
import shlex
import sys


if __name__ == '__main__':

    # These are example values :)
    remote_user = 'user'
    remote_host = 'cloudhost.example.net'
    remote_path = '/path/to/cloud/working-dir'

   if remote_path[0] != '/':
        remote_path = f'/{remote_path}'
    rsync_target = f'{remote_user}@{remote_host}{remote_path}'
    rsync_cmd = ('rsync', '-av', './', cloud_target)
    subprocess.check_output(rsync_cmd)

    ssh_target = f'{remote_user}@{remote_host}'
    cd_cmd = f'cd {shlex.quote(workdir)}'
    remote_cmd = shlex.join(sys.argv)
    remote_script = f'{cd_cmd} ; {remote_cmd}'
    ssh_cmd = ('ssh', ssh_target, remote_script)
    subprocess.check_output(ssh_cmd)
the -u option to python prevents buffering, so you see output exactly as it's produced (rather than buffered and shown to you in chunks)
you could of course build a fancier CLI around this and/or use env vars for setting things like the remote username
misty flint
serene scaffold
and is your objection to colab the overall experience, or specifically it being ...
omg is it just me or am i finding that meme more and more relevant?
unreal charm
odd meteor
What are you trying to build or what project are you working on? In otherwords, ...
I'm trying to build a chatbot
steady basalt
copper mica
my workflow with an IDE is a lot better than using the web ide on google colab. ...
Wdym by develop exaclty?
Also the new macs can handle deep learning decently fast
Sounds like your solution is to just develop locally and copy paste to cloud to train
Run as a python script on a gpu cluster ?
 maiden pawn
Can you guys suggest me somr good sources to learn and get into DS?
What skills should i have? I am good at python and knows somewhat pandas and numpy.
serene scaffold
maiden pawn
Can you guys suggest me somr good sources to learn and get into DS?
!resources data science
arctic wedgeBOT
Resources
The Resources page on our website contains a list of hand-selected learning resources that we regularly recommend to both beginners and experts.
serene scaffold
tensor(3.0404, device='cuda:0', grad_fn=<NllLossBackward0>)
tensor(3.1936, device='cuda:0', grad_fn=<NllLossBackward0>)
tensor(3.3188, device='cuda:0', grad_fn=<NllLossBackward0>)
tensor(3.5685, device='cuda:0', grad_fn=<NllLossBackward0>)
tensor(3.0136, device='cuda:0', grad_fn=<NllLossBackward0>)
tensor(2.9961, device='cuda:0', grad_fn=<NllLossBackward0>)
tensor(3.2644, device='cuda:0', grad_fn=<NllLossBackward0>)

RuntimeError: CUDA error: device-side assert triggered
CUDA kernel errors might be asynchronously reported at some other API call,so the stacktrace below might be incorrect.
For debugging consider passing CUDA_LAUNCH_BLOCKING=1.
These are losses. I figure this means the gradient exploded?
iron basalt
serene scaffold
would you like to write it?
Sure, if I post it here at some point then you can pin it if you want. I don't actually know how to write posts on discord with blank lines (as in the other pins) without using the triple back ticks.
serene scaffold
If you hold control while you push enter
iron basalt
Testing
serene scaffold
I mean shift + enter
 shadow flower
I have a quick question about updating a dataframe column based on a value in an adjacent column
serene scaffold
shadow flower
I have a quick question about updating a dataframe column based on a value in an...
can you do print(df.head().to_dict('list')), give the text, and explain what is wanted?
shadow flower
I have a Description column and based on certain descriptions, I'm trying to update the category column
def consolidate_subscriptions(self) -> None:
for sub_cat in TransactionExtractor.subscriptions:
self.transactions.loc[self.transactions['Description']==sub_cat,'Category'] = 'Subscription'
Actually, let me paste a screen shot, that isn't formatted well
serene scaffold
@shadow flower please follow the instructions in my previous message before you continue.
I will not accept a screenshot.
shadow flower
Okay
serene scaffold
@shadow flower I will wait up to two more minutes for the result of print(df.head().to_dict('list')) as text. (where df is the dataframe in question.)
shadow flower
I'm trying to update it, the code was being used to process input and was being passed along somewhere else
serene scaffold
Is there something you don't understand about what I have asked you to do?
shadow flower
{'Date': ['2022-11-10', '2022-11-10', '2022-11-09', '2022-11-09', '2022-11-09'], 'Description': ['PECO Energy Company
111022', 'Spotify', 'Hotel Shocard', 'Hotel Shocard', 'Walmart'], 'Original Description': ['PECO Energy Company 111022', 'SPOTIFY 877-778-1161 NY', 'HOTEL SHOCARD NEW YORK NY', 'HOTEL SHOCARD NEW YORK NY', 'WAL-MART #2167270 INDIAN EXTON PA'], 'Category': ['Category Pending', 'Subscription', 'Hotel', 'Hotel', 'Shopping'], 'Amount': [-92.43, -14.03, -500.99, -225.09, -184.92], 'Status': ['Pending', 'Posted', 'Posted', 'Posted', 'Posted']}
serene scaffold
shadow flower
{'Date': ['2022-11-10', '2022-11-10', '2022-11-09', '2022-11-09', '2022-11-09'],...
Thank you. Bare in mind that I asked for this over five minutes ago--next time, please have it ready when you send your first message.
Can you explain what you want to do, without using any code to explain it? @shadow flower
 heavy vessel
Who understands fuzzy c-means algorithm here?
shadow flower
Yeah, the Description column contains descriptions that should be in the subscription category. They are being id'd as internet category
I'm trying to update them to be of category subscription
serene scaffold
heavy vessel
Who understands fuzzy c-means algorithm here?
You're more likely to get help if you just ask your whole question all at once. Put yourself in the shoes of a potential answerer and answer all their clarifying questions that you already know the answer to.
shadow flower
So I'm effectively trying to update category column of rows containing a specific description ie. a row with spotify in the description's category would be relabeled subscription
serene scaffold
shadow flower
So I'm effectively trying to update category column of rows containing a specifi...
Can you type what you want the expected output to be exactly for these rows?
                  Description          Category
0  PECO Energy Company 111022  Category Pending
1                     Spotify      Subscription
2               Hotel Shocard             Hotel
3               Hotel Shocard             Hotel
4                     Walmart          Shopping
I forgot the rules
The question is simple, can fuzzy c-means algorithm be used on one dimensional dataset?
can't find any information about it in the internet
serene scaffold
heavy vessel
I forgot the rules
The question is simple, can fuzzy c-means algorithm be used o...
So every data point is just one number, basically?
heavy vessel
yes, i have frequencies, i want to cluster them.
I know it can be done with k-means but didn't find anything about fcm
shadow flower
Spotify was already labeled correctly in this dataset, but there are others where it isn't and the code that I have to update it isn't working
serene scaffold
 serene scaffold
@heavy vessel in principle it should work. here's a visualization.
the data just exists on one axis, but you can still have clusters based on gaps in the data points
shadow flower
My apologies.
serene scaffold
shadow flower
Spotify was already labeled correctly in this dataset, but there are others wher...
there's probably a more elegant solution than what you're currently doing
In [89]: df[['Description', 'Category']]
Out[89]:
                  Description          Category
0  PECO Energy Company 111022  Category Pending
1                     Spotify      Subscription
2               Hotel Shocard             Hotel
3               Hotel Shocard             Hotel
4                     Walmart          Shopping

In [90]: descriptions_to_change = ['Spotify', 'Walmart']

In [91]: df.loc[df['Description'].isin(descriptions_to_change), 'Description'] = df['Category']

In [93]: df[['Description', 'Category']]
Out[93]:
                  Description          Category
0  PECO Energy Company 111022  Category Pending
1                Subscription      Subscription
2               Hotel Shocard             Hotel
3               Hotel Shocard             Hotel
4                    Shopping          Shopping
Yeah, actually, that is better than how I did it
heavy vessel
serene scaffold
<@199854215797932032> in principle it should work. here's a visualization.
I honestly not quite understand fcm itself and how to implement its algorithm with pythons.
Is there any documentation on how to do it?
shadow flower
Thank you so much for the help
serene scaffold
or, if the list is actually the ones you don't want to change, you'd do ~df['Description'].isin(descriptions_to_keep). note the ~
serene scaffold
heavy vessel
I honestly not quite understand fcm itself and how to implement its algorithm wi...
do you just need to be able to know what the fuzzy clusters are, or do you actually need to implement the whole algorithm?
heavy vessel
serene scaffold
do you just need to be able to know what the fuzzy clusters are, or do you actua...
i tried to use some libraries and use my dataset pops errors all the time. In short, very much confused. :/
Based on that yeah i might need to implement it
serene scaffold
heavy vessel
i tried to use some libraries and use my dataset pops errors all the time. In sh...
which libraries?
shadow flower
Thanks for the help @serene scaffold !
heavy vessel
i didn't find anything in sklearn and i saw github repo and didnt work
https://github.com/ranjiGT/Python-Hackerrank/blob/main/Fuzzy-c-Means.ipynb

GitHub
HackerRank practice solutions. Contribute to ranjiGT/Python-Hackerrank development by creating an account on GitHub.
 keen root
Hi, I need some help making sense of some code. All I want is pointers into what to look into. Blunt question: what does this code do? It's for pytorch. Suposedely it's a custom autograd function, but looking into this tutorial (https://pytorch.org/tutorials/beginner/examples_autograd/two_layer_net_custom_function.html) I can't understand the backward method. Apparently f_forward and f_backward are functions accept and return torch tensors as well
def make_pat_func(f_forward, f_backward):
    class func(torch.autograd.Function):
        @staticmethod
        def forward(ctx, *args):
            ctx.save_for_backward(*args)
            return f_forward(*args)
        def backward(ctx, grad_output):
            args = ctx.saved_tensors
            torch.set_grad_enabled(True)
            y = torch.autograd.functional.vjp(f_backward, args, v=grad_output)
            torch.set_grad_enabled(False)
            return y[1]
    return func.apply
Please don't ask people to read screenshots of text.
!code
arctic wedgeBOT
Here's how to format Python code on Discord:
```py
print('Hello world!')
```
These are backticks, not quotes. Check this out if you can't find the backtick key.
keen root
oh, my bad. 1se
serene scaffold
heavy vessel
i didn't find anything in sklearn and i saw github repo and didnt work
https://g...
try sklearn-extensions. you're right that sklearn itself doesn't have it
heavy vessel
serene scaffold
try sklearn-extensions. you're right that sklearn itself doesn't have it
This library i think is outdated
I am getting this error even though it is in docs
module 'sklearn_extensions' has no attribute 'fuzzy_kmeans'
heavy vessel
sorry, fixed some issues regarding this library imports.
What now, i tried this example, did i do it right with the 1d data? it seems not in my opinion, i am passing 2d array but each of it has on value.
np.random.seed(0)

batch_size = 45
centers = [[1], [-1], [-1]]
n_clusters = len(centers)
X, labels_true = make_blobs(n_samples=1200, centers=centers, cluster_std=0.3)

kmeans = KMeans(k=3)
kmeans.fit(X)

kmedians = KMedians(k=3)
kmedians.fit(X)

fuzzy_kmeans = FuzzyKMeans(k=3, m=2)
fuzzy_kmeans.fit(X)

print('KMEANS')
print(kmeans.cluster_centers_)

print('KMEDIANS')
print(kmedians.cluster_centers_)

print('FUZZY_KMEANS')
print(fuzzy_kmeans.cluster_centers_)
Output
KMEANS
[[ 0.9914344 ]
[-1.25156362]
[-0.79159916]]
KMEDIANS
[[ 0.9805198 ]
[-1.23923844]
[-0.85981725]]
FUZZY_KMEANS
[[-1.22482642]
[-0.75778351]
[ 1.00747844]]
desert oar
heavy vessel
sorry, fixed some issues regarding this library imports.
What now, i tried this ...
scikit-learn k-means treats each row as one "data point", and each column as one "attribute" of that data point. so a 2-dimensional array with 1 column is completely valid input.
heavy vessel
desert oar
scikit-learn k-means treats each row as one "data point", and each column as one...
Thank you! 🤝
desert oar
heavy vessel
Thank you! 🤝
note that pretty much all machine learning algorithms are set up to work this way mathematically. so pretty much all machine learning code will be structured similarly.
unreal charm
Hi I have a question, epochs in training args in transformer are responsible for training time?
like more epoch, the better model but it takes more time to train?
desert oar
unreal charm
Hi I have a question, epochs in training args in transformer are responsible fo...
all neural network models have "epochs", not just transformers. and essentially yes, an epoch is one complete pass over the training data. more epochs means more passes over the training data, which generally means that the model fits closer and closer to the training data each time.
sometimes you can overfit to the training data, which means that the model only works well on that specific dataset but doesn't work well on other datasets. there are many solutions to handle overfitting in machine learning, and one of them is "early stopping", training the model with fewer epochs.
unreal charm
ok thanks
 signal robin
Plotting a Bar plot where x - axis has multivalued values. So I am trying to get a bar plot that looks something like the image posted down below. I have managed to extract the required values in a form of pivot table but i can't seem to figure out a way to plot it using the seaborn library any help would be appreciated
Code Snippet:

 desert oar
signal robin
desert oar
signal robin
the 2nd example looks like exactly what you want to do
the one that says "Add a second layer of grouping:"
signal robin
desert oar
did you try https://seaborn.pydata.org/generated/seaborn.barplot.html ?
oh ty I will definitely check that
desert oar
signal robin
oh ty I will definitely check that
i just searched "seaborn barplot" on duckduckgo 🙂
learning to search for things will save you a lot of time
 gaunt anvil
pytorch 1.10.2 uses cuda 10.2 but idt geforce 3080's supports it 😔
does anyone know if 3060's support cuda 10
serene scaffold
gaunt anvil
pytorch 1.10.2 uses cuda 10.2 but idt geforce 3080's supports it 😔
you might be able to find the right wheel for your (torch-version, cuda-version, python-version, OS) combination here: https://download.pytorch.org/whl/torch
serene scaffold
gaunt anvil
does anyone know if 3060's support cuda 10
if that's the GPU you have, do nvidia-smi to see what CUDA version it is, and make sure there's a wheel for it before giving up.
gaunt anvil
serene scaffold
if that's the GPU you have, do `nvidia-smi` to see what CUDA version it is, and ...
i looked into it like an hour ago
i saw a solution to use docker
b/c cuda is backwards compatable it's just that there's weird stuff
thorn bobcat
Can't Build Pytorch from Source on my MacOS, can someone guide me through the process?
gaunt anvil
does anyone know how I could fix
  File "/home/user/HiFi-GAN/utils/train.py", line 87, in train
    step)
  File "/home/user/HiFi-GAN/utils/validation.py", line 25, in validate
    sc_loss, mag_loss = stft_loss(fake_audio[:, :, :audio.size(2)].squeeze(1), audio.squeeze(1))
  File "/home/user/.local/lib/python3.6/site-packages/torch/nn/modules/module.py", line 1102, in _call_impl
    return forward_call(*input, **kwargs)
  File "/home/user/HiFi-GAN/utils/stft_loss.py", line 130, in forward
    sc_l, mag_l = f(x, y)
  File "/home/user/.local/lib/python3.6/site-packages/torch/nn/modules/module.py", line 1102, in _call_impl
    return forward_call(*input, **kwargs)
  File "/home/user/HiFi-GAN/utils/stft_loss.py", line 91, in forward
    sc_loss = self.spectral_convergenge_loss(x_mag, y_mag)
  File "/home/user/.local/lib/python3.6/site-packages/torch/nn/modules/module.py", line 1102, in _call_impl
    return forward_call(*input, **kwargs)
  File "/home/user/HiFi-GAN/utils/stft_loss.py", line 46, in forward
    return torch.norm(y_mag - x_mag, p="fro") / torch.norm(y_mag, p="fro")
RuntimeError: The size of tensor a (151) must match the size of tensor b (146) at non-singleton dimension 1```

Using https://github.com/rishikksh20/HiFi-GAN on commit 7c049f9Read my last few messages about downloading the right wheel.
thorn bobcat
serene scaffold
Read my last few messages about downloading the right wheel.
could you tag me there?
also i am building from source
serene scaffold
serene scaffold
you might be able to find the right wheel for your (torch-version, cuda-version,...
@thorn bobcat
arctic wedgeBOT
Hey @woeful hedge!
It looks like you tried to attach file type(s) that we do not allow (.log). We currently allow the following file types: .gif, .jpg, .jpeg, .mov, .mp4, .mpg, .png, .mp3, .wav, .ogg, .webm, .webp, .flac, .m4a, .csv, .json.
Feel free to ask in #community-meta if you think this is a mistake.
Hey @woeful hedge!
It looks like you tried to attach a Python file - please use a code-pasting service such as https://paste.pythondiscord.com
Hey @woeful hedge!
You either uploaded a .txt file or entered a message that was too long. Please use our paste bin instead.
thorn bobcat
@serene scaffold thing is i'm trying to build from source
steady basalt
thorn bobcat
<@253696366952316929> thing is i'm trying to build from source
Why can’t you pip install or conda
gaunt anvil
gaunt anvil
does anyone know how I could fix
```
File "/home/user/HiFi-GAN/utils/train.p...
i am so good at this 🧌
 thorn bobcat
steady basalt
<@361955686185304074> what is vulkan for
thorn bobcat
steady basalt
<@361955686185304074> what is vulkan for
to run my AMD graphics card..
thorn bobcat
Why?
steady basalt
Wait are you sure u can’t just install it like a cuda gpu
I’d assume torch has support
thorn bobcat
seems good enough..
 steady basalt
It is but u can also get much faster
What’s the error when u pip install?
Does rocm not work
thorn bobcat
steady basalt
Does rocm not work
i want to use my macos
dont wanna change my os
also i didn't pip install it, i downloaded it and then followed the guide on pytorch github
steady basalt
Or metal?
thorn bobcat
but still didn't work..
steady basalt
Metal is a Apple api
thorn bobcat
steady basalt
Or metal?
metal is too slow..