#data-science-and-ml
1 messages · Page 27 of 1
 merry pike

Neural network algorithms are stochastic. This means they make use of randomness, such as initializing to random weights, and in turn the same network trained on the same data can produce different results. This can be confusing to beginners as the algorithm appears unstable, and in fact they are by design. The random initialization allows […]
 desert oar
so you want to group wave heights into bins, and then fit a markov stochastic model?
i think all you need is to estimate the transition probability matrix
 fossil ivy
desert oar
so you want to group wave heights into bins, and then fit a markov stochastic mo...
fossil ivy
desert oar
so you want to group wave heights into bins, and then fit a markov stochastic mo...
yes.
yes but I am working on that, not sure how
I've done an easy way like this I guess:
def round_to25(x):
    return math.ceil(x * 4) / 4

# Read weather time series and locate all entries from January, extract the timestamp
data = pd.read_csv("data/weather_data.csv")
prep_jan = data.loc[data['Month'] == 1]
jan = prep_jan[["Year", "Month", "Day", "Hour [UTC]", "Hs"]]


# Round every value to the next 0.25 step
for index, row in jan.iterrows():
    jan.at[index, "Hs"] = round_to25(row["Hs"])

 print(pd.crosstab(pd.Series(jan2[1:], name="Tomorrow"),
       pd.Series(jan2[:-1], name="Today"), normalize=1))
so compute the bins (pandas cut makes this easy), then compute the frequencies of all successive pairs of bins, then divide those frequencies by the total number of successive pairs, i.e. the total number of data points - 1
fossil ivy
desert oar
so compute the bins (pandas `cut` makes this easy), then compute the frequencies...
would pandas cut be better than the function I have defined?
desert oar
fossil ivy
would pandas cut be better than the function I have defined?
not necessarily, it has more features and is probably slower as a result. it's nice though because it produces a categorical dtype output, which is convenient, and the category labels have the bin ranges in their name
your function is fine
however you definitely do not need to iterate row-by-row
fossil ivy
It gives this
 desert oar
-
if you need to apply a function row-by-row, use
.applyor.map, it should be somewhat faster:jan["Hs_bin"] = jan["Hs"].map(round_to25) -
you can use numpy/pandas vectorized operations to compute this without explicitly looping at all, which can be 10x faster or even better:
jan["Hs_bin"] = np.(jan["Hs"] * 4) / 4
fossil ivy
But the way of constructing the matrix is fine?
desert oar
the crosstab solution looks good as well, although i suggest using .shift(1) and .shift(-1), or .iloc[1:] and .iloc[:-1]
using "plain" [] is equivalent to .loc[], which uses the row labels, not the row positions
the row labels by default are identical to the row positions, but that isn't always the case
it's a common newbie trap, and it results in weird error messages or confusing results if you mess it up and don't understand the difference
fossil ivy
desert oar
the crosstab solution looks good as well, although i suggest using `.shift(1)` a...
not sure how this would work
desert oar
import numpy as np
import pandas as pd

# Read weather time series
data = pd.read_csv("data/weather_data.csv")

# Locate all entries from January, extract the timestamp
jan = data.loc[
    data["Month"] == 1,
    ["Year", "Month", "Day", "Hour [UTC]", "Hs"]
]

# Round every value to the next 0.25 step
jan["Hs_bin"] = np.ceil(jan["Hs"] * 4) / 4

# Compute the transition probability matrix
transitions = pd.crosstab(
    jan["Hs_bin"].iloc[1:].rename("Tomorrow"),
    jan["Hs_bin"].iloc[:-1].rename("Today"),
)
 heavy crow
After around 10 steps the loss plateaus. What could this be a symptom of? To low learning rate? faulty loss function? too small network?

 wooden sail
maybe you reached the min already. note that loss alone means nothing, you care about the minimizer, not the minimum. check whether the output you get is good first
fossil ivy
desert oar
```python
import numpy as np
import pandas as pd
# Read weather time series
dat...
this gives a completely different result
desert oar
heavy crow
After around 10 steps the loss plateaus. What could this be a symptom of? To low...
low learning rate
probably not
faulty loss function
no, the results would look like nonsense
too small network
perhaps? the model seems to have learned as much as it can. "too small" is one possibility. maybe you want to think about different feature engineering or different architecture or getting more data
desert oar
fossil ivy
this gives a completely different result
does it? i might have messed something up
fossil ivy
Today     0.25   0.50   0.75   1.00   1.25   ...  9.00   9.25   9.50   9.75   10.50
Tomorrow                                     ...
0.25        1.0    0.0    0.0    0.0    0.0  ...    0.0    0.0    0.0    0.0    0.0
0.50        0.0    1.0    0.0    0.0    0.0  ...    0.0    0.0    0.0    0.0    0.0
0.75        0.0    0.0    1.0    0.0    0.0  ...    0.0    0.0    0.0    0.0    0.0
1.00        0.0    0.0    0.0    1.0    0.0  ...    0.0    0.0    0.0    0.0    0.0
1.25        0.0    0.0    0.0    0.0    1.0  ...    0.0    0.0    0.0    0.0    0.0
1.50        0.0    0.0    0.0    0.0    0.0  ...    0.0    0.0    0.0    0.0    0.0
1.75        0.0    0.0    0.0    0.0    0.0  ...    0.0    0.0    0.0    0.0    0.0
2.00        0.0    0.0    0.0    0.0    0.0  ...    0.0    0.0    0.0    0.0    0.0
2.25        0.0    0.0    0.0    0.0    0.0  ...    0.0    0.0    0.0    0.0    0.0
@fossil ivy can you actually share some of this data that i can work with?
fossil ivy
hmm tough one
desert oar
let me construct some fake data then
heavy crow
fair enough! I'll try it out first 🙂
fossil ivy
yeah sorry I had to sign that I won't share it, not that I don't trust but you never know
desert oar
no, that's understandable
 desert oar
!e ```python
import numpy as np
import pandas as pd
make fake data
rng = np.random.default_rng(606060)
x = pd.Series(rng.uniform(size=100), name="Hs")
make bins
x_bin = np.ceil(x * 4) / 4
Compute the transition probability matrix
transitions = pd.crosstab(
x_bin.rename("Today"),
x_bin.shift(-1).rename("Tomorrow"),
)
print(transitions)
 arctic wedgeBOT
@desert oar :white_check_mark: Your 3.11 eval job has completed with return code 0.
001 | Tomorrow  0.25  0.50  0.75  1.00
002 | Today
003 | 0.25         2     8     7     4
004 | 0.50        10     9     9     5
005 | 0.75         4    12    12     4
006 | 1.00         5     4     3     1
so the difference now was the transitions part is it?
desert oar
!e ```python
import numpy as np
import pandas as pd
Make fake data
rng = np.random.default_rng(606060)
x = pd.Series(rng.uniform(size=100), name="Hs")
Make bins
x_bin = np.ceil(x * 4) / 4
Compute the transition probability matrix
transitions = pd.crosstab(
x_bin.rename("Today"),
x_bin.shift(-1).rename("Tomorrow"),
)
print(transitions)
Verify by looping pairwise
from collections import defaultdict
transitions2 = defaultdict(int)
x_bin_lst = x_bin.to_list()
for v1, v2 in zip(x_bin_lst, x_bin_lst[1:]):
transitions2[v1, v2] += 1
transitions2_tbl = pd.Series(
list(transitions2.values()),
index=pd.MultiIndex.from_tuples(list(transitions2.keys()), names=["Today", "Tomorrow"])
).unstack()
print(transitions2_tbl)
pd.testing.assert_frame_equal(transitions, transitions2_tbl)
@desert oar :white_check_mark: Your 3.11 eval job has completed with return code 0.
001 | Tomorrow  0.25  0.50  0.75  1.00
002 | Today
003 | 0.25         2     8     7     4
004 | 0.50        10     9     9     5
005 | 0.75         4    12    12     4
006 | 1.00         5     4     3     1
007 | Tomorrow  0.25  0.50  0.75  1.00
008 | Today
009 | 0.25         2     8     7     4
010 | 0.50        10     9     9     5
011 | 0.75         4    12    12     4
... (truncated - too many lines)
Full output: https://paste.pythondiscord.com/edenusavup.txt?noredirect
desert oar
fossil ivy
so the difference now was the transitions part is it?
yeah, i think the .iloc didn't work right because the indexes (row labels) were preserved by pandas, and pandas performed a "join" using them when computing the counts
!d pandas.Series.shift
arctic wedgeBOT
Series.shift(periods=1, freq=None, axis=0, fill_value=None)```
Shift index by desired number of periods with an optional time freq.

When freq is not passed, shift the index without realigning the data. If freq is passed (in this case, the index must be date or datetime, or it will raise a NotImplementedError), the index will be increased using the periods and the freq. freq can be inferred when specified as “infer” as long as either freq or inferred\_freq attribute is set in the index.How could I normalize that then?
One thing it did, which I think I want is that now the current state is given in rows, not the column
desert oar
oh, i swapped them
fossil ivy
no I wanted them this way either wya
desert oar
then just switch the order of the arguments in crosstab
fossil ivy
but wasn't able to do it with my code, because normalize=0 gave the backward probabilities
desert oar
normalize=True?
fossil ivy
I reckon its identical to normalize=1?
In that case, this one gave the currect probabilities but with current state in the column
desert oar
fossil ivy
I reckon its identical to `normalize=1`?
pandas is probably just converting 1 to True
oh im sorry, it actually recognizes 0 and 1
you can freely swap the orders of the two args, and consult the pandas docs for the correct normalize= argument
fossil ivy
import numpy as np
import pandas as pd

# Read weather time series
data = pd.read_csv("data/weather_data.csv")

# Locate all entries from January, extract the timestamp
jan = data.loc[
    data["Month"] == 1,
    ["Year", "Month", "Day", "Hour [UTC]", "Hs"]
]

# Round every value to the next 0.25 step
jan["Hs_bin"] = np.ceil(jan["Hs"] * 4) / 4

# Compute the transition probability matrix
transitions = pd.crosstab(
    jan["Hs_bin"].rename("Today"),
    jan["Hs_bin"].shift(-1).rename("Tomorrow"),
    normalize=0
I believe this one gives the correct matrix
Tomorrow     0.25      0.50      0.75   ...  9.50   9.75      10.50
Today                                   ...
0.25      0.000000  1.000000  0.000000  ...   0.00    0.0  0.000000
0.50      0.000000  0.746032  0.238095  ...   0.00    0.0  0.000000
0.75      0.000000  0.076531  0.729592  ...   0.00    0.0  0.000000
1.00      0.000000  0.000000  0.121019  ...   0.00    0.0  0.000000
1.25      0.000000  0.000000  0.000000  ...   0.00    0.0  0.000000
1.50      0.000000  0.000000  0.000000  ...   0.00    0.0  0.000000
1.75      0.000000  0.000000  0.000000  ...   0.00    0.0  0.000000
2.00      0.000000  0.000000  0.000000  ...   0.00    0.0  0.000000
2.25      0.000000  0.000000  0.000000  ...   0.00    0.0  0.000000
2.50      0.000000  0.000000  0.000000  ...   0.00    0.0  0.000000
2.75      0.000000  0.000000  0.000000  ...   0.00    0.0  0.000000
3.00      0.000000  0.000000  0.000000  ...   0.00    0.0  0.000000
the 0.5 current state seems a bit off but I just inspected the dataset and there is only one entry with 0.25 and was followed by 0.5 so I guess that is just a data thing
 merry ridge
I'm trying to find a nice way to do something similar to explode and having trouble picking the correct terms to google. I have a pandas dataframe with n elements and a list of k elements. I want to create a new dataframe with n*k rows by taking each row from the dataframe and making k identical copies except they have a new column with one element of my list. Does that have a name?
Well I guess it's going to involve the word pivot
fossil ivy
desert oar
pandas is probably just converting `1` to `True`
Sorry, I hope not to bother but do you know how I could extract the stationary transition matrix from here? I create an individual matrix for each month of the year
And need to use the month matrix for my simulation model for research
desert oar
merry ridge
I'm trying to find a nice way to do something similar to explode and having trou...
https://stackoverflow.com/q/35491274 like this?

Stack Overflow
I have a Pandas DataFrame with one column:
import pandas as pd
df = pd.DataFrame({"teams": [["SF", "NYG"] for _ in range(7)]})
teams
0 [SF, NYG]
1 [SF, NYG]...
merry ridge
No, let me make an example real quick, but I'm not familiar with how to make the markup look nice.
fossil ivy
!code
arctic wedgeBOT
Here's how to format Python code on Discord:
```py
print('Hello world!')
```
These are backticks, not quotes. Check this out if you can't find the backtick key.
fossil ivy
If that is what you meant 🙂
merry ridge
I mean how to paste some python output and have it look "right"
desert oar
fossil ivy
Sorry, I hope not to bother but do you know how I could extract the stationary t...
this empirical transition probability matrix is an estimate of the "steady state" transition probabilities. it assumes that the markov property holds. if you want the stationary distribution, see https://stephens999.github.io/fiveMinuteStats/stationary_distribution.html for the relevant equatinos
desert oar
merry ridge
I mean how to paste some python output and have it look "right"
the box from !code explains it, or use our paste site
!paste see below:
arctic wedgeBOT
Pasting large amounts of code
If your code is too long to fit in a codeblock in Discord, you can paste your code here:
https://paste.pythondiscord.com/
After pasting your code, save it by clicking the floppy disk icon in the top right, or by typing ctrl + S. After doing that, the URL should change. Copy the URL and post it here so others can see it.
fossil ivy
desert oar
this empirical transition probability matrix is an estimate of the "steady state...
thank you
fossil ivy
desert oar
this empirical transition probability matrix is an estimate of the "steady state...
wait, for my understanding, do you mean by that that I can use the matrix I have at the moment for simulation purposes?
merry ridge
df = pd.DataFrame({'a': [1,2,3], 'b': [2,3,4]})
l = [1,2,3]
   a  b
0  1  2
1  2  3
2  3  4
If I have something like the above, I want it to look like this afterwards
   a  b  l
0  1  2  1
1  1  2  2
2  1  2  3
3  2  3  1
4  2  3  2
5  2  3  3
6  3  4  1
7  3  4  2
8 3 4 3```No wait, this is not quite it (Okay, fixed)
desert oar
fossil ivy
wait, for my understanding, do you mean by that that I can use the matrix I have...
sure, you've estimated all the transition probabilities from the data using the maximum likelihood estimator for the categorical distribution using the markov assumption. that's just about the best you can do
fossil ivy
I see, so no need for the steady state distribution
Thanks for your help, I am not really knowledgeable in mathematics, or stats as such
I do know what a markov chain is, the markov property etc. But the actual maths behind it are quite challenging for me tbh
desert oar
fossil ivy
I see, so no need for the steady state distribution
the steady state distribution says something different, that's the distribution of values overall
fossil ivy
for me its more like a "Get those transition matrices and implement them somehow"
merry ridge
The steady state distribution is just the normalized eigenvector corresponding to the eigenvalue 1.
fossil ivy
words 🫠
merry ridge
Such an eigenvector exists and is guaranteed by the perron frobenius theorem
fossil ivy
Now now stick to English lol honestly I do not understand this
desert oar
the steady state distribution s is vector that sums to 1, i.e. a probability distribution over state.
it is defined with the equation s = sP
solve that equation and you get s
fossil ivy
Reason behind me attempting a markov chain simply is that literature agrees that it is the best approach compared to gaussian statistics and AMRA to use in modeling the weather for simulation purposes
desert oar
it turns out that this is equivalent to s being an eigenvector of P with eigenvalue 1
fossil ivy
that's about how deep I went into markov chains
so essentially the steady state would be the resulting probabilities if you sampled from the transition matrix to infinity?
merry ridge
You could do it that way
desert oar
yes, exactly. if you simulated the markov chain forever, what would the distribution over states be?
fossil ivy
it would reach an equilibrium, I see
then, for my simulation, would it not be easier to implement the markov chain as a steady state system? Or would that not make a difference
desert oar
it depends on what info you need
merry ridge
You could also diagonalize the matrix and take the diagonal part to a high power
fossil ivy
so.. I simulate the day to day logistics of decommissioning an offshore wind farm in the North Sea.
Vessels are requried for logistical provisions, which are limited by its capabilities in terms of maximum wave height. The transition matrix are the significant wave heights
I run in hourly resolution and it should go
Calculate current wave height --> What is the wave height in the next hour --> next hour --> next hour etc.
desert oar
aren't some transition matrices not diagonalizable @merry ridge ?
fossil ivy
and the wave height then determines if operations can be done or if the vessel has to wait for better conditions
desert oar
fossil ivy
so.. I simulate the day to day logistics of decommissioning an offshore wind far...
exactly. and the markov property allows you to "forget" everything and just use the current wave height to predict the next wave height
fossil ivy
exactly
so then would I use the matrix I have right now:
Tomorrow      0.25      0.50      0.75  ...      9.00  9.25  9.50
Today                                   ...
0.25      0.700000  0.200000  0.100000  ...  0.000000   0.0   0.0
0.50      0.031579  0.768421  0.189474  ...  0.000000   0.0   0.0
0.75      0.000000  0.078125  0.730469  ...  0.000000   0.0   0.0
1.00      0.000000  0.000000  0.146628  ...  0.000000   0.0   0.0
1.25      0.000000  0.000000  0.000000  ...  0.000000   0.0   0.0
1.50      0.000000  0.000000  0.000000  ...  0.000000   0.0   0.0
1.75      0.000000  0.000000  0.000000  ...  0.000000   0.0   0.0
2.00      0.000000  0.000000  0.000000  ...  0.000000   0.0   0.0
2.25      0.000000  0.000000  0.000000  ...  0.000000   0.0   0.0
2.50      0.000000  0.000000  0.000000  ...  0.000000   0.0   0.0
2.75      0.000000  0.002203  0.000000  ...  0.000000   0.0   0.0
3.00      0.000000  0.000000  0.000000  ...  0.000000   0.0   0.0
3.25      0.000000  0.000000  0.000000  ...  0.000000   0.0   0.0
3.50      0.000000  0.000000  0.000000  ...  0.000000   0.0   0.0
...
7.25      0.000000  0.000000  0.000000  ...  0.000000   0.0   0.0
7.50      0.000000  0.000000  0.000000  ...  0.000000   0.0   0.0
7.75      0.000000  0.000000  0.000000  ...  0.142857   0.0   0.0
8.00      0.000000  0.000000  0.000000  ...  0.000000   0.0   0.0
8.25      0.000000  0.000000  0.000000  ...  0.000000   0.0   0.0
8.75      0.000000  0.000000  0.000000  ...  0.500000   0.0   0.0
9.00      0.000000  0.000000  0.000000  ...  0.000000   0.0   0.5
9.25      0.000000  0.000000  0.000000  ...  0.000000   0.0   0.0
9.50      0.000000  0.000000  0.000000  ...  0.000000   1.0   0.0
And go Current wave height = Row, take random number between 0 and 1, Get column name for next highest number in row
merry ridge
I haven't used markov chains in a long time, but I would expect the answer is yes they are not going to be all diagonalizable
fossil ivy
fossil ivy
so then would I use the matrix I have right now:
```py
Tomorrow 0.25 0...
so example:
Current wave height = 0.25
Random number = 0.5
Next wave height = 0.25

or

Current wave height = 0.25
Random number = 0.15
Next wave height = 0.5
It's definitely not the recommended way of doing things, but it is illustrative to see the diagonal matrix with 1 as an eigenvalue and the remaining eigenvalues less than 1 in magnitude that all get smaller with each iteration until that diagonal entry dominates the behavior.
desert oar
merry ridge
It's definitely not the recommended way of doing things, but it is illustrative ...
this is a good linear algebra review for me tbh... i forgot all about diagonalizability 😆
merry ridge
I've never liked Markov Chain notation because Linear Algebra is all about linear transformations of the form T(X) = AX and Markov Chains tend to transpose it
Anyway I don't suppose you know how I "should" pivot/explode my dataframe? I can do it with a for loop or something, but I know I shouldn't
desert oar
fossil ivy
so example:
```py
Current wave height = 0.25
Random number = 0.5
Next wave heigh...
you can do something like this:
def simulate_step(rng, transitions, current):
    p = transitions.loc[current]
    choices = transitions.columns
    return rng.choice(choices, p=p)

def simulate_seq(rng, transitions, init, count):
    history = [init]
    state = init
    for _ in range(count):
        state = simulate_step(rng, transitions, state)
        history.append(state)
    return history
def simulate_step(rng, transitions, current):
    p = transitions.loc[current]
    choices = transitions.columns
    return rng.choice(choices, p=p)
If I understand correctly I would then run this for each hour?
desert oar
fossil ivy
```py
def simulate_step(rng, transitions, current):
p = transitions.loc[curr...
yes, see simulate_seq for a basic technique
desert oar
merry ridge
Anyway I don't suppose you know how I "should" pivot/explode my dataframe? I can...
oh i thought you were still figuring out how to demonstrate your situation
oh, i see. it maybe looks like you want the cartesian product of several columns?
merry ridge
Oh yeah that would have been a very helpful way of putting it
fossil ivy
desert oar
you can do something like this:
```python
def simulate_step(rng, transitions, c...
Could you explain what rng is? Is it a package?
merry ridge
I essentially want a cartesian product of my rows with a list
It looks like merge does what I need
desert oar
fossil ivy
Could you explain what rng is? Is it a package?
import numpy as np
import pandas as pd

def simulate_step(rng, transitions, current):
    p = transitions.loc[current]
    choices = transitions.columns
    return rng.choice(choices, p=p)

def simulate_seq(rng, transitions, init, count):
    history = [init]
    state = init
    for _ in range(count):
        state = simulate_step(rng, transitions, state)
        history.append(state)
    return history

# the transition probability matrix we calculated above
transitions = ...

# initial state, pick one that makes sense
init = ...

# number of hours to sample
count = 72

# random seed for reproducible results
seed = 606060

# random number generator
rng = np.default_rng(seed)

# the results
history = simulate_seq(rng, transitions, init, count)
yep, use pd.merge(..., how='cross')
merry ridge
ugh you know, considering I am in a heavy math background. It is really embarrassing that of all the words I picked to describe my problem I didn't think of the phrase cartesian product.
It was immediately the top result once I had that
Thanks so much
desert oar
merry ridge
ugh you know, considering I am in a heavy math background. It is really embarras...
data science is absolutely ridiculous when you think of the breadth of things you need to know about. it's so easy to forget stuff.
fossil ivy
desert oar
```python
import numpy as np
import pandas as pd
def simulate_step(rng, transit...
okay I see, don't think I can use this though, I create different transition matrices for each month, and that should be included.
Is there any way to use a function for every time a next value has to be computed? That way I could say
When running the function, first check the month so that the right transition matrix is chosen, then take the current state and compute the next
merry ridge
I've been working at this data science job for 2 months and I am finding I am really terrible at everything.
desert oar
you need to be a database admin, a software developer, a statistician, and a business strategy consultant, while staying on top of extremely fast-moving developments in machine learning, and trying not to forget your math fundamentals
fossil ivy
nvm I think I should be able to implement that with your simulate_step() function actually
desert oar
fossil ivy
nvm I think I should be able to implement that with your `simulate_step()` funct...
flip the logic around. you would call simulate_step on the desired transition matrix. if you have 12 matrices, call it 12 times
(make sure you don't run it for more hours than there are in a month!)
merry ridge
If a task needs an integral transform, or heavy linear algebra, no problem. But I'm drowning under all the other stuff like databricks, aws, pyspark, paginating data, parallelization, and other things that I've always known are things but never had to care about
fossil ivy
desert oar
(make sure you don't run it for more hours than there are in a month!)
No so I have a clock running in my simulation, it counts every hour. I have a function that takes this time (hours since new years) and derives the month. I would feed that into the function to choose the correct transition matrix, then take the current state to compute the next one
if that makes any sense
desert oar
fossil ivy
No so I have a clock running in my simulation, it counts every hour. I have a fu...
i see. you'll have to adapt my code then
fossil ivy
anyway, I think you helped more than enough, thank you so much!
I saved the different matrices in a list, so transition will just become list[month] 🙂
desert oar
merry ridge
If a task needs an integral transform, or heavy linear algebra, no problem. But ...
yeah, there is a huge amount of tooling and bullshit to know about. and it's very hard to escape the need to at least become a competent "programmer"
fortunately you should be on a team with some support in this respect
merry ridge
I am getting help for sure. It's difficult to know how much I am really absorbing at times vs just blindly following a pattern. I really need to at least skim a text on data structures and get more basic concepts in my head down.
desert oar
merry ridge
I am getting help for sure. It's difficult to know how much I am really absorbin...
"data structures" in the CS sense are overrated. just make sure you understand how numpy arrays work internally (read their user guides), and get a general understanding of how python dicts work.
the only really important programming pattern you should know about is dynamic programming:
x_max = -inf
i_max = None
for i, x in enumerate(xs):
    if x > x_max:
        x_max = x
        i_max = i
return i, x
but in general, a lot of learning how to do things requires understanding how they work, but not spending too long learning more internal details than you need.
for example, the key idea with pyspark is that dataframe and rdd operations are not executed immediately; they form a graph of computations yet-to-be-executed. the computations only actually happen when the rdd/dataframe is "collected" or an aggregation is performed. everything else is analogous to sql and/or easy to figure out from the docs.
AWS you really shouldn't have to worry about. ask your data engineer / data ops / dev ops people for help. if you don't have any of those people, ask your CTO to hire one ASAP.
merry ridge
I got the part about operations not being executed immediately as soon as I was told that it is "quantum". Right now I think I struggle more with syntax more than anything and keeping track of what flavor of dataframe I am actually working with.
For example, when I was doing the Cartesian product we discussed earlier, I realized that I don't have a pandas dataframe because I had forgotten that this is a actually a pyspark.pandas.frame.DataFrame. So I found some docs that said what I really needed was to call crossJoin, but it wouldn't work on the list I was trying to take the Cartesian product with, so I tried changing my list to the right dataframe by calling spark.createDataframe, but that actuallys a pyspark.sql.dataframe.DataFrame which also doesn't work.
I feel like this entire chain of problems I am having should not happen and it is due to some big conceptual hole I don't really know where to look to fill. As it is right now I am just throwing stuff at a wall until it finally works.
 bold timber
Hello guys, I have a question: when we face the image classification problem with a large dataset and many classes, what are the metrics to evaluate the model performance for each class? Do we first need to check whether the data is balanced or not and so then if the dataset is Imbalanced we can focus on f1-score, but if the dataset is Balanced, we can focus on an accuracy score?
Please give me an insight about this.
 junior osprey
a.shape = (2160, 3840, 3)
b.shape = (2160, 3840)
it is possible to get this result ?
b.shape = a.shape
I try to do this:
from numpy import newaxis
b = b[:, :, newaxis]
but now b.shape = (2160, 3840, 1) and i want (2160, 3840, 3)
wooden sail
you cannot do that via reshaping
having used newaxis on b though, they're now broadcastable
the matter is that there are 2160 * 3840 * 2 values that you have to specify if you want to explicitly have that shape
e.g. by using repmat or padding zeros or something
desert oar
merry ridge
I got the part about operations not being executed immediately as soon as I was ...
don't forget it's literally python syntax. pyspark is an actual python library, it just happens to interact with the underlying spark engine instead of doing the computations directly
desert oar
junior osprey
a.shape = (2160, 3840, 3)
b.shape = (2160, 3840)
it is possible to get this res...
i can't emphasize enough how useful the numpy broadcasting doc is https://numpy.org/doc/stable/user/basics.broadcasting.html#broadcastable-arrays
junior osprey
wooden sail
e.g. by using repmat or padding zeros or something
oh i see
wooden sail
but what exactly are you trying to do? as salt and i have said, you might be able to broadcast your operations
desert oar
merry ridge
For example, when I was doing the Cartesian product we discussed earlier, I rea...
it's helpful to not mix data types in your code, e.g. if something is a pandas dataframe surrounded by spark dataframes, you might want to give it a name like _pd so you don't lose track of it
desert oar
merry ridge
I feel like this entire chain of problems I am having should not happen and it i...
this doesn't sound conceptual at all, it sounds like you're just getting used to working with the complicated libraries that we have in data science and juggling all the code in your head, while trying to keep track of the problem you're solving. it's not easy but it will improve with practice
junior osprey
wooden sail
but what exactly are you trying to do? as salt and i have said, you might be abl...
i want to write a video using opencv but when i modify my frame with cvtcolor(), my array is modify too and i can t write my video
while cap.isOpened():
    ret, frame = cap.read()
    if ret:
        print(frame.shape) # (2160, 3840, 3)
        gray = cv2.cvtColor(frame, cv2.COLOR_BGR2GRAY)
        print(gray.shape) # (2160, 3840)
        grayText = cv2.putText(frame, "Video en gris !", (75, 500), cv2.FONT_HERSHEY_SIMPLEX, 1, (0, 0, 0), 4)
        out.write(gray) #can t work because the array dimensions aren t good
        cv2.imshow("Video", grayText)
        if cv2.waitKey(1) & 0xFF == ord('q'):
            break
    else:
break```!e ```python
import numpy as np
rng = np.random.default_rng(5150)
x = rng.poisson(size=(10, 5, 3))
y = rng.poisson(size=(10, 5))
y_expanded = y[:, :, np.newaxis]
x_broadcast, y_broadcast = np.broadcast_arrays(x, y_expanded)
np.testing.assert_array_equal(x, x_broadcast)
print(x_broadcast.shape)
print(y_broadcast.shape)
@desert oar :white_check_mark: Your 3.11 eval job has completed with return code 0.
001 | (10, 5, 3)
002 | (10, 5, 3)
!e ```python
import numpy as np
rng = np.random.default_rng(5150)
x = rng.poisson(size=(10, 5, 3))
y = rng.poisson(size=(10, 5))
y_expanded = y[:, :, np.newaxis]
Broadcast y to match x:
x_broadcast, y_broadcast = np.broadcast_arrays(
x, y_expanded
)
np.testing.assert_array_equal(
x, x_broadcast
)
assert x_broadcast.shape == y_broadcast.shape
Mimic broadcasting manually:
y_concatenated = np.concatenate(
[y_expanded] * x.shape[2],
axis=2
)
np.testing.assert_array_equal(
y_broadcast, y_concatenated
)
@desert oar :warning: Your 3.11 eval job has completed with return code 0.
[No output]
what is out?
junior osprey
import cv2
from numpy import newaxis, reshape

cap = cv2.VideoCapture("videos/vtest.mp4")
fps = cap.get(cv2.CAP_PROP_FPS)
H, W = int(cap.get(cv2.CAP_PROP_FRAME_HEIGHT)), int(cap.get(cv2.CAP_PROP_FRAME_WIDTH))
fourcc = cv2.VideoWriter_fourcc(*'mp4v')
out = cv2.VideoWriter("videos/gray_video.mp4", fourcc, int(fps), (W, H))

while cap.isOpened():
    ret, frame = cap.read()
    if ret:
        print(frame.shape) # (2160, 3840, 3)
        gray = cv2.cvtColor(frame, cv2.COLOR_BGR2GRAY)
        print(gray.shape) # (2160, 3840)
        grayText = cv2.putText(frame, "Video en gris !", (75, 500), cv2.FONT_HERSHEY_SIMPLEX, 1, (0, 0, 0), 4)
        out.write(gray) #can t work because the array dimensions are not good, i need (2160, 3840, 3)
        cv2.imshow("Video", grayText)
        if cv2.waitKey(1) & 0xFF == ord('q'):
            break
    else:
        break

cap.release()
out.release()
cv2.destroyAllWindows()```what is gray's shape?
junior osprey
(2160, 3840)
wooden sail
i think there's a flag to set color to false
junior osprey
wooden sail
i think there's a flag to set color to false
even i can do that, it will be impossible with another color
wooden sail
hmm?
junior osprey
if i desactivate my frame's colors how can i have red color or something else?
wooden sail
doesn't matter because you're writing gray, which is in gray scale and not rgb?
junior osprey
it s rgb
wooden sail
that's the whole problem. gray is not RGB, but your videowriter is expecting rgb
you said gray is of shape W x H, not W x H x 3
that's why you're getting an error
wooden sail
you're explicitly converting to grayscale 😛
 sly lake
Hey guys! I have a question:
We took part in a hackathon and our problem statement is to create a software/app to detect tumour using MRI images
A quick google search gave out all such existing projects but all of them are for brain tumour. I wonder if it’s not possible to detect other tumours using MRI images and ML?
wooden sail
sure it's possible
 obtuse rose
can someone help me at #help-pancakes
sly lake
wooden sail
sure it's possible
But I don’t find any dataset 😭
 lapis sequoia
sly lake
Hey guys! I have a question:
We took part in a hackathon and our problem stateme...
lapis sequoia
sly lake
Hey guys! I have a question:
We took part in a hackathon and our problem stateme...
It can be done same way, they are images as well at the end(assuming its just jpeg they gave)
Thats basically same as is it a cat or a dog problem.
wooden sail
because a lot of medical data is protected, since people can be traced back to the data
i'm not sure how many medical image data sets are out there tbh. i know there are lots of phantoms, but actual data is closely protected
sly lake
Also, is it possible to integrate ML with android apps? Like I need to integrate this model with a Flutter app
lapis sequoia
Yeah you can just make an endpoint or something, call it with image and get the response back on app.
sly lake
Like I no nothing about ML but my other team mate is working on it. But I am tasked with making the app part
wooden sail
in several ways. as pd says, or if the model is very lean, you could even have the trained model do inference on the phone itself
sly lake
lapis sequoia
Yeah you can just make an endpoint or something, call it with image and get the ...
So it’s like the model will be hosted somewhere and the app will just make API calls to it?
wooden sail
sounds about right
sly lake
wooden sail
in several ways. as pd says, or if the model is very lean, you could even have t...
Like putting a .tflite file in the android code itself?
lapis sequoia
sly lake
So it’s like the model will be hosted somewhere and the app will just make API c...
That is one way. And pretty good too. You keep both different, using model on app side can be a headache if you have retrained it or changed it or whatever.
sly lake
Ah okay got it
lapis sequoia
I mean imagine the trial and error headache if its on app side. Atleast in testing mode.
sly lake
Ah yesss
wooden sail
yeah that'd require a whole different architecture to train remotely and then publish the trained params to the users
sly lake
I feel the accuracy of the project really plays a big role here. Like this problem statement would be given to other teams as well and I feel we will be judged on our accuracy
After doing some research I found out most of such projects use the CNN algorithm
Do you guys recommend anything better?
wooden sail
cnn sounds about right, since you're trying to find something in an images that might be registered differently each time
junior osprey
@wooden sail thank you since 5h i try to solve my problem and it s finally solve !!!
wooden sail
and you expect some spatial invariance
junior osprey
out = cv2.VideoWriter("videos/gray_video.mp4", fourcc, int(fps), (W, H), 0) #0 is for grayscale !!!!```im fucking dumb 🤣
sly lake
Also a very vague question, is Image Processing a part of ML?
wooden sail
small things are easy to miss. you had already done all the detective work when you figured out there was a dimension mismatch
lapis sequoia
sly lake
Do you guys recommend anything better?
Most people around use CNN for image classification, yes.
sly lake
Like can this be done using just IP techniques
wooden sail
sly lake
Also a very vague question, is Image Processing a part of ML?
ML is a weird umbrella term that means everything and nothing. so depending on who you ask, yesn't
junior osprey
wooden sail
small things are easy to miss. you had already done all the detective work when ...
after 3hours xD
and i dont know why there is nothing in the Internet about that
wooden sail
in my group, we tend to draw the line at classical algorithms vs data-driven ones whose parameters need not be meaningful
sly lake
Ah I see
lapis sequoia
sly lake
Also a very vague question, is Image Processing a part of ML?
Really depends, I'd say CNN is a part of ML but not whole image processing.
desert oar
my opinion: image processing is usually a pre-requisite for doing ML on images (e.g. downscaling and data augmentation), and you can use ML to do image processing (like what happens inside phone cameras), but it is not in and of itself ML
wooden sail
depends how deep you wanna go into image processing though. you can do several phds just in classical techniques
it gets quite involved without ever doing ML
desert oar
right
sly lake
Cool! I hope my teammate figures out the ML stuff lol
I hope to help him in some way
desert oar
and you can use ML to do advanced image processing which you then could use as inputs to other ML algorithms which you can then post-process with classical algorithms...
image processing is one possible application of machine learning, and machine learning is one of several tools for doing image processing
sly lake
Yeah! Some of it is making sense
desert oar
i'd argue that the same is true for NLP
sly lake
desert oar
i'd argue that the same is true for NLP
Ah okay!
I did something similar in NLP
desert oar
e.g. you can use classical NLP techniques (e.g. lemmatization) to preprocess text for an ML model, and/or you can use an ML model to process text. it goes both ways
sly lake
I made a chatbot using RASA and hosted the trained model on Heroku! Then made API calls from my website
desert oar
nice!
sly lake
Got it! Thanks 🙂
 serene scaffold
desert oar
e.g. you can use classical NLP techniques (e.g. lemmatization) to preprocess tex...
serene scaffold
desert oar
e.g. you can use classical NLP techniques (e.g. lemmatization) to preprocess tex...
gotta use some deep learning to lemmatize my corpus, amirite?
desert oar
serene scaffold
gotta use some deep learning to lemmatize my corpus, amirite?

ACL Anthology
Ranka Stankovic, Branislava Šandrih, Cvetana Krstev, Miloš Utvić, Mihailo Skoric. Proceedings of the Twelfth Language Resources and Evaluation Conference. 2020.
merry ridge
desert oar
this doesn't sound conceptual at all, it sounds like you're just getting used to...
Thanks for all the advice, I definitely feel a little better about where I am at now.
 somber prism
can someone explain me whether it's a bug in regex module or im just making a mistake here. i created a function to remove all the stop words and punctuation and finally give the lemmatized text, but for some some reason its removing the comma (,) even tho i made it not to remove specified punctuations.
def clean_text(text, keep_sw = [], keep_punct = '', nlp = nlp, verbose = False):
    # tokenize -> lemma -> remove stop words  -> clean text
    punct = re.sub(r'[{}]'.format(keep_punct), '', punctuation)
    for i in keep_sw:
        try:
            sw.remove(i)
        except:
          if verbose:
            print(f'{i} is not a stop word')
    # text = text.replace('.', ' ')
    text = re.sub(r'[{}]'.format(punct), '', text)
    text = [adv_to_adj(doc.lemma_) for doc in nlp(text) if doc.text not in sw]
    return ' '.join(text)

text = 'im currently experiencing a fever, cold and a vomit!'
# detect_symps(text)
clean_text(text, ['and', 'or'], ',!')
output : current experience fever cold and vomit !
it didn't remove ! but why its removing the comma tho ?
desert oar
somber prism
can someone explain me whether it's a bug in regex module or im just making a m...
as a general hint, i strongly recommend testing and debugging your regex using https://regex101.com (using "python" mode in the menu). it's a huge time saver.

regex101
Regular expression tester with syntax highlighting, explanation, cheat sheet for PHP/PCRE, Python, GO, JavaScript, Java, C#/.NET.
in general, constructing regex from a list of input characters is going to be a little messy. escaping will be an issue.
i had code to do this at an old job, and it turned out to be kind of a bear. lots of little edge cases.
somber prism
desert oar
as a general hint, i strongly recommend testing and debugging your regex using h...
i dont have any problem with regex
desert oar
at minimum you need to be careful with - and ] inside a [] character class
well it's almost certainly not a bug in python's re module
punct = re.sub(r'[{}]'.format(keep_punct), '', punctuation)
was this supposed to be
punct = re.sub(r'[{}]'.format(keep_punct), '', text)
?
somber prism
[] - means whatever char inside that will be used for matching, doesnt matter where they reside it always match them
desert oar
i'm aware of what [] means. i'm saying that feeding a list of letters into [] with string formatting requires a bit of care in order to not accidentally produce an incorrect pattern.
somber prism
desert oar
```python
punct = re.sub(r'[{}]'.format(keep_punct), '', punctuation)
```
was th...
firstly, im removing comma (,) from punctuation string and storing it in punct
desert oar
i also don't see where you actually tokenize the text, it looks like you're seeking the stop words directly in the un-tokenized text
and i don't see where punctuation is defined
somber prism
then im using that punct var to remove the remaining char from the text
desert oar
if you can provide a minimal example that i can copy and paste in order to reproduce your output, that would be very helpful
somber prism
desert oar
i also don't see where you actually tokenize the text, it looks like you're seek...
thats from string.punctuation
somber prism
desert oar
if you can provide a minimal example that i can copy and paste in order to repro...
sure wait
from string import punctuation
import re
import spacy
from nltk.corpus import stopwords

nlp = spacy.load('en_core_web_md')
sw = set(stopwords.words())

def adv_to_adj(doc):
  if doc[-2:] == 'ly':
    doc = doc[:-2]
  elif doc[-3:] == 'ing':
    doc = doc[:-3]
  return doc

def clean_text(text, keep_sw = [], keep_punct = '', nlp = nlp, verbose = False):
    # tokenize -> lemma -> remove stop words  -> clean text
    punct = re.sub(r'[{}]'.format(keep_punct), '', punctuation)
    sw = sw - set(keep_sw)
    # text = text.replace('.', ' ')
    text = re.sub(r'[{}]'.format(punct), '', text)
    text = [adv_to_adj(doc.lemma_) for doc in nlp(text) if doc.text not in sw]
    return ' '.join(text)

text = 'im currently experiencing a fever, cold and a vomit!'
clean_text(text, ['and', 'or'], ',!')
stop words
desert oar
is it a list of strings?
desert oar
that's fine. is it a list of strings?
somber prism
desert oar
that's fine. is it a list of strings?
yeh
desert oar
well.. it looks like your code keeps the , and ! because you told it to
you passed them to keep_punct
import re
from string import punctuation

import spacy
from nltk.corpus import stopwords

nlp = spacy.load('en_core_web_md')
stopwords = set(stopwords.words())

def re_escape_punct(p):
    if p == '\\':
        return '\\\\'
    if p == ']':
        return r'\]'
    elif p == '-':
        return r'\-'
    else:
        return p

def adv_to_adj(doc):
    if doc[-2:] == 'ly':
        doc = doc[:-2]
    elif doc[-3:] == 'ing':
        doc = doc[:-3]
    return doc

def clean_text(text, keep_sw=(), keep_punct='', nlp=nlp):
    sw = stopwords - set(keep_sw)

    punct_re = re.compile(
        '[{}]'.format(''.join([
            re_escape_punct(p)
            for p in punctuation
            if p not in keep_punct
        ]))
    )

    print(punct_re)

    text = punct_re.sub('', text)
    tokens = [
        adv_to_adj(token.lemma_)
        for token in nlp(text)
        if token.text not in sw
    ]

    return ' '.join(tokens)

if __name__ == '__main__':
    text = 'im currently experiencing a fever, cold and - a vomit!'
    print(
        clean_text(text, ['and', 'or'], ',!')
    )
this removes the - but leaves , and ! as you'd expect
as you can see, this punctuation regex business is not that straightforward
 shadow halo
Will check it out. Thank you for the recommendation
 iron basalt
sly lake
Also a very vague question, is Image Processing a part of ML?
iron basalt
sly lake
Also a very vague question, is Image Processing a part of ML?
Yes, because "processing" can be anything, but it's also its own thing. A lot of things are part of ML, but not exclusive to it. Such as reinforcement learning, which can be considered to be either part of optimal control theory, or ML (it's both).
(RL is also part of traditional CS in general due to its connection to dynamic programming)
 elfin venture
@lapis sequoia half-assed a fix for that data based on your suggestion, works perfect tho mucho gracias
and @desert oar I didn't see you gave me a different approach as well, but im going on 26 hours without sleep so i guarantee what i wrote will break sooner rather than later so i'll probably end up redoing it anyway lol
 iron basalt
*ML, originally, at its core, was memoization and was a synonymy for "self-teaching computers", both terms used to be used to mean the same thing. It also started with reinforcement learning (memorization of checker board states and rewards).
Effectively collecting data for later use (including stuff previously computed from the data), which makes the distinction between it and "data science" not so easy.
 abstract apex
Guys I need to create a function that solves for the determinant of a 3x3 matrix without using numpy
issue im running into is slicing/selecting the elements out of the matrix to put into the determinant equation while in a for loop
 grand quarry
abstract apex
issue im running into is slicing/selecting the elements out of the matrix to put...
grand quarry
abstract apex
issue im running into is slicing/selecting the elements out of the matrix to put...
I dont think you need for loops for this. Can be easily done without them. Unless you need to do multiple matrixes?
abstract apex
grand quarry
I dont think you need for loops for this. Can be easily done without them. Unles...
i know right... the question im attempting is asking for a loop though
its a single matrix
and i cant use recursion either
tried to look up the source code behind np.linalg.det() to no avail
grand quarry
Send the full question if you can
grand quarry
abstract apex
should be fairly simple
Yeah, just write it out on paper it should make it simpler
desert oar
elfin venture
<@456226577798135808> half-assed a fix for that data based on your suggestion, w...
this looks great!
 eternal zephyr
hello
 dense lagoon
NotImplementedError                       Traceback (most recent call last)
File C:\TCCHistly\yolov5\train.py:630
    628 if __name__ == "__main__":
    629     opt = parse_opt()
--> 630     main(opt)

File C:\TCCHistly\yolov5\train.py:524, in main(opt, callbacks)
    522 # Train
    523 if not opt.evolve:
--> 524     train(opt.hyp, opt, device, callbacks)
    526 # Evolve hyperparameters (optional)
    527 else:
    528     # Hyperparameter evolution metadata (mutation scale 0-1, lower_limit, upper_limit)
    529     meta = {
    530         'lr0': (1, 1e-5, 1e-1),  # initial learning rate (SGD=1E-2, Adam=1E-3)
    531         'lrf': (1, 0.01, 1.0),  # final OneCycleLR learning rate (lr0 * lrf)
   (...)
    557         'mixup': (1, 0.0, 1.0),  # image mixup (probability)
    558         'copy_paste': (1, 0.0, 1.0)}  # segment copy-paste (probability)

File C:\TCCHistly\yolov5\train.py:348, in train(hyp, opt, device, callbacks)
    346 final_epoch = (epoch + 1 == epochs) or stopper.possible_stop
    347 if not noval or final_epoch:  # Calculate mAP
--> 348     results, maps, _ = validate.run(data_dict,
...
FuncTorchGradWrapper: registered at C:\actions-runner\_work\pytorch\pytorch\builder\windows\pytorch\aten\src\ATen\functorch\TensorWrapper.cpp:189 [backend fallback]
PythonTLSSnapshot: registered at C:\actions-runner\_work\pytorch\pytorch\builder\windows\pytorch\aten\src\ATen\core\PythonFallbackKernel.cpp:148 [backend fallback]
FuncTorchDynamicLayerFrontMode: registered at C:\actions-runner\_work\pytorch\pytorch\builder\windows\pytorch\aten\src\ATen\functorch\DynamicLayer.cpp:484 [backend fallback]
PythonDispatcher: registered at C:\actions-runner\_work\pytorch\pytorch\builder\windows\pytorch\aten\src\ATen\core\PythonFallbackKernel.cpp:144 [backend fallback]```py 182 LOGGER.info('Using SyncBatchNorm()')
184 # Trainloader
--> 185 train_loader, dataset = create_dataloader(train_path,
...
--> 183 main_mod_name = getattr(main_module.__spec__, "name", None)
184 if main_mod_name is not None:
185 d['init_main_from_name'] = main_mod_name
AttributeError: module '__main__' has no attribute '__spec__'``` Re ran my training and now it says this, i tried to delete all and restart, it runs for a epoch, then errors, I run again and gives that error, keeps repeating, idk how to fix 😦can someone help me with Jupyter Notebook?
ipykernel is somehow missing and I cannot create any notebooks.
serene scaffold
eternal zephyr
ipykernel is somehow missing and I cannot create any notebooks.
please show the whole error message as text (no screenshots)
dense lagoon
eternal zephyr
ipykernel is somehow missing and I cannot create any notebooks.
install ipykernal
eternal zephyr
error: Microsoft Visual C++ 14.0 or greater is required. Get it with "Microsoft C++ Build Tools": https://visualstudio.microsoft.com/visual-cpp-build-tools/
      [end of output]

  note: This error originates from a subprocess, and is likely not a problem with pip.
  ERROR: Failed building wheel for psutil
Failed to build psutil
ERROR: Could not build wheels for psutil, which is required to install pyproject.toml-based projects```!build
arctic wedgeBOT
Microsoft Visual C++ Build Tools
When you install a library through pip on Windows, sometimes you may encounter this error:
error: Microsoft Visual C++ 14.0 or greater is required. Get it with "Microsoft C++ Build Tools": https://visualstudio.microsoft.com/visual-cpp-build-tools/
This means the library you're installing has code written in other languages and needs additional tools to install. To install these tools, follow the following steps: (Requires 6GB+ disk space)
1. Open https://visualstudio.microsoft.com/visual-cpp-build-tools/.
2. Click Download Build Tools >. A file named vs_BuildTools or vs_BuildTools.exe should start downloading. If no downloads start after a few seconds, click click here to retry.
3. Run the downloaded file. Click Continue to proceed.
4. Choose C++ build tools and press Install. You may need a reboot after the installation.
5. Try installing the library via pip again.
eternal zephyr
I just installed it
serene scaffold
Did you reboot?
eternal zephyr
the problem I was having is when I lauched jupyter it wont let me pick create a notebook
error: Microsoft Visual C++ 14.0 or greater is required. Get it with "Microsoft C++ Build Tools": https://visualstudio.microsoft.com/visual-cpp-build-tools/
      [end of output]

  note: This error originates from a subprocess, and is likely not a problem with pip.
  ERROR: Failed building wheel for psutil
Failed to build psutil
ERROR: Could not build wheels for psutil, which is required to install pyproject.toml-based projects```wont let me install the notebook now
gonna try anaconda and see if that fixes my issue
serene scaffold
I've never had any issues running notebooks on windows. I suspect your installation of the C++ build tools isn't right
 rugged comet
What are the potential consequences of including a feature for training that has little relation to the labels?
serene scaffold
rugged comet
What are the potential consequences of including a feature for training that has...
depends on the model, but the model should basically learn to ignore the feature after a while if it has no predictive power
rugged comet
Interesting, I wouldn't have guessed that.
 keen notch
say i want to title the second graph
how would i go about doing this
if i uncomment i'll just overwrite the first graph
 dense lagoon
Please see https://github.com/pypa/pip/issues/5599 for advice on fixing the underlying issue.
To avoid this problem you can invoke Python with '-m pip' instead of running pip directly.
Defaulting to user installation because normal site-packages is not writeable``` triewd everything to fix for 2 hrs...@serene scaffold You might be good at this considering your experience with AI linguistics. I'm trying to label some pieces of text with 0-5 labels. Attached is the model structure. For preprocessing, I do a TextVectorization layer followed by an Embedding layer.
The reason I bring this up with you is that I'm worried I might be doing something wrong that is obvious to someone with more experience than me.
Some things that stand out to me as being potentially a problem are the number of units in the Dense layers, the number of Dense layers, and Flattening the embedded input.
 serene scaffold
rugged comet
<@253696366952316929> You might be good at this considering your experience with...
serene scaffold
rugged comet
<@253696366952316929> You might be good at this considering your experience with...
it looks like you're doing preprocessing things as part of the model architecture, whereas I usually work in such a way that those are treated separately. have you tried this? what was your confusion matrix?
rugged comet
serene scaffold
it looks like you're doing preprocessing things as part of the model architectur...
My text Vectorization and Embedding layers aren't actually a part of the model. I do those preprocessing steps before feeding the data to the model. What you see in the image are all of the layers that are part of the model itself.
I don't have the confusion matrix. I just learned about it now lol. I'll try to get it.
https://www.tensorflow.org/api_docs/python/tf/math/confusion_matrix
TensorFlow
Computes the confusion matrix from predictions and labels.
serene scaffold
great. by the way, I don't really use tensorflow
rugged comet
What about Keras?
dense lagoon
Use pt
serene scaffold
rugged comet
What about Keras?
Keras is part of tensorflow
serene scaffold
it's just a wrapper for tensorflow, or something like that
I don't even think it's a separate installation
 haughty pewter
What’s the most simplest way to understand data leakage by definition
rugged comet
Traceback (most recent call last):
  File "c:\Users\urkch\AppData\Local\Programs\Python\Python_Projects\MtG ML\model_predict.py", line 53, in <module>
    matrix = tf.math.confusion_matrix(actual, predicted, num_classes=5)
  File "C:\Users\urkch\miniconda3\envs\tf\lib\site-packages\tensorflow\python\util\traceback_utils.py", line 153, in error_handler
    raise e.with_traceback(filtered_tb) from None
  File "C:\Users\urkch\miniconda3\envs\tf\lib\site-packages\tensorflow\python\framework\ops.py", line 7209, in raise_from_not_ok_status
    raise core._status_to_exception(e) from None  # pylint: disable=protected-access
tensorflow.python.framework.errors_impl.InvalidArgumentError: {{function_node __wrapped__ScatterNd_device_/job:localhost/replica:0/task:0/device:GPU:0}} Dimensions [0,2) of indices[shape=[6045,2,5]] must match dimensions [0,2) of updates[shape=[6045,5]]
         [[{{node ScatterNd}}]] [Op:ScatterNd]
What does this mean that the dimensions of indices must match dimensions of updates? actaul and predicted have the same shape, (6045, 5). I don't know where the extra 2 is coming from in (6045, 2, 5).
lapis sequoia
rugged comet
```
Traceback (most recent call last):
File "c:\Users\urkch\AppData\Local\Prog...
sharing code would help, as of now seems like your actual and predicted y are having different shape.
rugged comet
@serene scaffold I have 5 confusion matrices because I have 5 labels an this is multi-label classification. The capital letters are the labels.
W
[[4651  967]
 [ 334   93]]
U
[[2379  680]
 [2393  593]]
B
[[4690 1023]
 [ 266   66]]
R
[[4847 1049]
 [ 126   23]]
G
[[2775  779]
 [2001  490]]
I used
https://scikit-learn.org/stable/modules/generated/sklearn.metrics.multilabel_confusion_matrix.html
to generate the matrices.


scikit-learn
rugged comet
lapis sequoia
sharing code would help, as of now seems like your actual and predicted y are ha...
I think I got it now, thanks.
 magic sorrel
I got excited when I found out that my 1050Ti had cuda cores. spent the night and did a benchmark. my gpu makes everything slower.... aww man ..
lapis sequoia
'poa', 'sed', 'ced', 'lga', 'sal']``` How do I find out the rows which contain either of the following stringsI know for one I can do str.contains
But I wanna do str.contains either of them
 whole rain
i'm sorry i want to ask how to solve this problem from my code F.softmax(model(input_ids, attention_mask), dim=1) and this eror```
TypeError Traceback (most recent call last)
<ipython-input-42-96f6522cbd43> in <module>
----> 1 F.softmax(model(input_ids, attention_mask), dim=1)
4 frames
/usr/local/lib/python3.7/dist-packages/torch/nn/functional.py in dropout(input, p, training, inplace)
1250 if p < 0.0 or p > 1.0:
1251 raise ValueError("dropout probability has to be between 0 and 1, " "but got {}".format(p))
-> 1252 return VF.dropout(input, p, training) if inplace else _VF.dropout(input, p, training)
1253
1254
TypeError: dropout(): argument 'input' (position 1) must be Tensor, not str```
heavy crow
This is an amazing article on past and STOA contrastive representation learning:
https://lilianweng.github.io/posts/2021-05-31-contrastive/
Very well written imo
The goal of contrastive representation learning is to learn such an embedding space in which similar sample pairs stay close to each other while dissimilar ones are far apart. Contrastive learning can be applied to both supervised and unsupervised settings. When working with unsupervised data, contrastive learning is one of the most powerful app...
fossil ivy
Hello everyone, I need some help with my Markov Chains. I create monthly markov chains to investigate the impact of weather seasonality in offshore wind farm decommissioning projects performances
I derive my Markov Chains from 10+ years of historical data using this function:
def create_transition_matrices():

    # Read the time-series data
    data = pd.read_csv("data/weather_data.csv")
    matrixlist = []

    for i in range(12):
        # Extract the month
        month_data = data.loc[
            data["Month"] == i+1,
            ["Year", "Month", "Day", "Hour [UTC]", "Hs"]
        ]

        # Round every value to the next 0.25 step
        month_data["Hs_bin"] = np.ceil(month_data["Hs"] / 0.25) * 0.25

        # Compute the transition probability matrix
        transitions = pd.crosstab(
            month_data["Hs_bin"].rename("Today"),
            month_data["Hs_bin"].shift(-1).rename("Tomorrow"),
            normalize=0
        )
        # with pd.option_context("display.max_rows", None,
        #                        "display.max_columns", None,
        #                        "display.precision", 3,
        #                        "display.expand_frame_repr", False):
        matrixlist.append(transitions)

    return matrixlist
However, the individual transition matrices that are returned have different (ij)
for instance:


First one goes to 9, the other to 8.5
In the code, when there are transitions from one month to the other, this occasionally creates problems, raising i.e. for this example:
Key Error: 9
since 9 is not in the latter matrix, how can I approach this
heavy crow
I'm following a paper trying to reproduce the results.. all is well until i read this:
Training is distributed across 32 V100 GPUs and takes approximately 124 hours.
heavy crow
only 1.8 years on my gpu!
keen notch
hey how can I

 austere swift
whole rain
i'm sorry i want to ask how to solve this problem from my code ```F.softmax(mode...
austere swift
whole rain
i'm sorry i want to ask how to solve this problem from my code ```F.softmax(mode...
It looks like input_ids is a str
You have to tokenize it and convert it to a tensor for it to work
fossil ivy
Does anyone know why this could arise? Its averages from 20 runs of my model
 desert oar
fossil ivy
Does anyone know why this could arise? Its averages from 20 runs of my model
desert oar
fossil ivy
Does anyone know why this could arise? Its averages from 20 runs of my model
this is the output from your markov chain model?
you picked an initial state for jan 2022 and ran it for a year? or something else?
desert oar
fossil ivy
I derive my Markov Chains from 10+ years of historical data using this function:...
this is a good opportunity to start using pandas Categorical, to enforce consistent "bins" across all months
!d pandas.cut
arctic wedgeBOT
pandas.cut(x, bins, right=True, labels=None, retbins=False, precision=3, include_lowest=False, duplicates='raise', ordered=True)```
Bin values into discrete intervals.

Use cut when you need to segment and sort data values into bins. This function is also useful for going from a continuous variable to a categorical variable. For example, cut could convert ages to groups of age ranges. Supports binning into an equal number of bins, or a pre-specified array of bins. desert oar
abstract apex
desert oar
abstract apex
!code can you please post this as text, using a code block? read below for instructions:
arctic wedgeBOT
Here's how to format Python code on Discord:
```py
print('Hello world!')
```
These are backticks, not quotes. Check this out if you can't find the backtick key.
abstract apex
efhi = [x[1:] for x in matrix[1:]]
dfgi = [x[::2] for x in matrix[1:]]
degh = [x[0:2] for x in matrix[1:]]
thanks
@abstract apex one option of course is to just write a loop:
a = []
b = []
c = []
for x in matrix[1:]:
    a.append(x[1:])
    b.append(x[::2])
    c.append(x[0:2])
but if you are going to be concatenating these arrays together afterwards, then you might want to just use numpy fancy indexing:
a = matrix[1:, 1:]
b = matrix[1:, ::2]
c = matrix[1:, 0:2]
i assume these slicing operations are stand-ins for some "real" operations that are more sophisticated
abstract apex
slicing a matrix up
desert oar
!e but fyi
import numpy as np

rng = np.random.default_rng()

data = rng.normal(size=(500, 10))

a_slice = data[1:, 1:]
b_slice = data[1:, ::2]
c_slice = data[1:, 0:2]

a_loop = []
b_loop = []
c_loop = []
for x in data[1:]:
    a_loop.append(x[1:])
    b_loop.append(x[::2])
    c_loop.append(x[0:2])
a_loop = np.stack(a_loop)
b_loop = np.stack(b_loop)
c_loop = np.stack(c_loop)

# If they are not the same, this will raise an exception
np.testing.assert_array_equal(a_slice, a_loop)
np.testing.assert_array_equal(b_slice, b_loop)
np.testing.assert_array_equal(c_slice, c_loop)
@desert oar :warning: Your 3.11 eval job has completed with return code 0.
[No output]
ooo
desert oar
essential reading: https://numpy.org/doc/stable/user/basics.indexing.html
abstract apex
thanks
 wary estuary
desert oar
<@519591924995457024> one option of course is to just write a loop:
```python
a ...
wary estuary
desert oar
<@519591924995457024> one option of course is to just write a loop:
```python
a ...
This first option sure looks like the way to keep it simple
desert oar
wary estuary
This first option sure looks like the way to keep it simple
i think the numpy indexing version is simpler and easier to read, as long as you understand how it works. these slicing operations are standard idiomatic numpy, it's not some esoteric trick.
wary estuary
desert oar
i think the numpy indexing version is simpler and easier to read, as long as you...
Yup, when you're right, you're right.
 azure crystal
Does someone know why i am getting multiple zero values when using minmaxscaler?
My highest value is something around 11000 and my lowest something around 1
wooden sail
how many times does the minimum value occur?
azure crystal
~50-100 times in a 250x40 array
wooden sail
then that's the same amount of 0s you'll find after minmax scaling 😛
sly lake
Hi there again
Soo, I was looking at a project that classifies brain tumors from MRI images and it's built upon Keras
So I used a converter to change the Keras model into a TFLITE model (in hopes of easy integration with my Flutter app)
For this I used GoogleColabs to transform the .H5 file to a .tflite
But now, how can I actually test this .tflite file and see if it works?
 #Transforming the image from base64
        img_data = list_of_contents[0]
        img_data = re.sub('data:image/jpeg;base64,', '', img_data)
        img_data = base64.b64decode(img_data)

        stream = io.BytesIO(img_data)
        img_pil = Image.open(stream)

        #Load model, change image to array and predict
        model = load_model('model_final.h5')
        dim = (150, 150)
        img = np.array(img_pil.resize(dim))
        x = img.reshape(1,150,150,3)

        answ = model.predict(x)
classification = np.where(answ == np.amax(answ))[1][0]```Like this was the code for the Keras model which the guy deployed on something called DASH
So will the same code work in GoogleColabs for the tflite model?
azure crystal
wooden sail
then that's the same amount of 0s you'll find after minmax scaling 😛
I misunderstood the question I thought you meant how often the 0 occurs after scaling. There should be no duplicate values at all, otherwise it would be a big coincidence. So 50-100 times the same value is nearly impossibel
wooden sail
are you certain of that? because otherwise there is an error somewhere else
what do you get when you do np.sum(array == np.amin(array))
azure crystal
wooden sail
are you certain of that? because otherwise there is an error somewhere else
Yes I am getting data of 40 diiferent stocks so there should not be the same data
azure crystal
wooden sail
what do you get when you do np.sum(array == np.amin(array))
should I do this before scaling?
wooden sail
yes
azure crystal
alright I am running the code at the moment and this takes some time so I will write the results in like 15 mins
wooden sail
for a matrix of the size you said, this should be instant
you're doing something else you're not letting on
azure crystal
wooden sail
you're doing something else you're not letting on
No I meant I am currently running my complete code/training my model and I cant interrupt it
desert oar
it's usually a good habit to work out the bugs in your code on a small sample of data before running on your full data
azure crystal
Yes but everything worked and I just noticed this, when I looked at my data
I still have an accuracy of 90% but I think with some slight bug fixes I can improve that
 brave sand
so I bought this drone, and it's able to recognize people and track them. how is that possible? it's tracking me but it's never seen a picture of my before. and it claims that it's only camera based which I don't believe
any thoughts?
azure crystal
I think that it is connected with a trained model
brave sand
azure crystal
I think that it is connected with a trained model
like a coco dataset?
that doesn’t make sense though because I grouped up with other people and it still follows me
I ran one way and a friend ran the other, and it still followed me. how?
azure crystal
The drone is probably only taking the footage and then your phone or wherever you are seeing the footage is doing the rest
azure crystal
brave sand
I ran one way and a friend ran the other, and it still followed me. how?
Maybe because it tracks your phone or something like that but if the drone has never seen you it cant follow you
brave sand
I am seeing the footage in my phone in real time
It isn’t following my phone
the phone is connected to a controller which i didn't have on me when I ran away
yet it still followed me
brave sand
azure crystal
Maybe because it tracks your phone or something like that but if the drone has n...
i agree with this. that's why I asked here because I am confused
azure crystal
I dont think that it has anything to do wit hthe camera tbh even if the drone knows how you are looking, it would be really hard to difference in big groups
brave sand
https://www.skydio.com/skydio-2-plus
if you go to the autonomy section

Skydio Autonomous Drones for business, public safety and creative endeavors.
9 nn
i don't believe that
wooden sail
it doesn't need to know you are you to track you
it's no different from buying a new phone and opening the camera app, which will automatically detect faces and track them
azure crystal
But why does it follow only him and not other people
wooden sail
try it again having it detect the other person first
object tracking has been around for a long time, at any rate
the point is to track an object even if others are present
azure crystal
wooden sail
what do you get when you do np.sum(array == np.amin(array))
It returns 2 for every array
wooden sail
what size is each array
azure crystal
200x40
wooden sail
then you'd expect 2 0's in each array
on the minmax scaled array, do np.sum(array == 0)
azure crystal
between 40 and 60
wooden sail
using sklearn?
azure crystal
yes
wooden sail
i'm under the impression that one does minmax scaling per column, so one would actually expect at least 1 zero per column
azure crystal
from sklearn.preprocessing import MinMaxScaler
wooden sail
do you wanna minmax scale each column in each matrix, or treat each matrix as a single "feature"
azure crystal
each matrix as single feature
wooden sail
the former is what you're doing atm and it guarantees you have at LEAST 1 zero per column per matrix, so >= 40
azure crystal
so the whole array gets scaled
wooden sail
you could do the transformation yourself by hand, or you could reshape twice (first from matrix to vector, then from vector to matrix)
brave sand
wooden sail
try it again having it detect the other person first
it’ll detect him the whole time
wooden sail
so, same as what happened with you
it's not detecting it's "you", it's detecting that it found an object and then tracks it
azure crystal
wooden sail
you could do the transformation yourself by hand, or you could reshape twice (fi...
how could i reshape it?
wooden sail
if it's a numpy array, with array.reshape
azure crystal
because the 3d array containing the scaled arrays is over 100k in size
azure crystal
wooden sail
if it's a numpy array, with array.reshape
how should I reshape it so it scales the whole array
wooden sail
how's the original array shaped
brave sand
wooden sail
it's not detecting it's "you", it's detecting that it found an object and then t...
so it’s not as fancy as I thought it was
azure crystal
so the complete size is 150000x200x40
wooden sail
then array = array.reshape(150_000, 200*40)
scale that, and reshape back to the original shape
wooden sail
do array = array.reshape(150_000, 200*40, order='F') to be sure
to guarantee this is done columnwise
desert oar
wooden sail
do array = array.reshape(150_000, 200*40, order='F') to be sure
note that order= in np.reshape does not reorder the data in memory. for that you need np.asfortranarray. not sure if that's what you intended.
azure crystal
@wooden sail ```py
size = len(x_train)
x_train = scaler.fit_transform(np.array(x_train).reshape(size, 200*40, order='F'))
x_train = x_train.reshape(size, 200, 40, order='F')
just to be sureit is, i only intended the array to be addressed columnwise as in matlab, not make a new copy in a different order in memory
unless mika prefers fortran order for everything
wooden sail
azure crystal
<@467435887236612106> ```py
size = len(x_train)
x_train = scaler.fit_transform(n...
looks ok
desert oar
funny this came up today. i spent forever trying to construct and debug arbitrary length indexers to work with a specific library, and then i gave up and decided to just flatten the array to 2d and then un-flatten it afterwards, exactly like what you described above.
wooden sail
it's like a "tried and true" solution 😛 there's usually a more clever and efficient way, but sometimes one can't be bothered
azure crystal
my code now runs twice as fast haha
thx
but I think the scaling of the big array will take longer now
wooden sail
i can't be bothered to check the docs for sklearn again right now, so i couldn't say
it'll broadcast something or another based on some axis of the data
it might be that it's still missing a transpose, i forget whether it scales by row or col
azure crystal
I would guess by column since I had one 0 and one 1 per column
wooden sail
double check that you get the expected effect in the arrays
azure crystal
it scales by column
but now I have the porblem the the range between my data is too big
for example 11000 and 300
desert oar
azure crystal
but now I have the porblem the the range between my data is too big
if the minimum value is > 0, then log transformation can help spread out the data more evenly
azure crystal
And for example these are open, high, low, close values and somehow is the close value the biggest
0.00003,0.00002,0.00003,0.00003
desert oar
import numpy as np
from sklearn.ensemble import RandomForestClassifier
from sklearn.pipeline import make_pipeline
from sklearn.preprocessing import (
    FunctionTransformer,
    MinMaxScaler,
)

log_trans = FunctionTransformer(
    func=np.log,
    inverse_func=np.exp,
)

scaler_trans = MinMaxScaler()

classifier = RandomForestClassifier()

pipeline = make_pipeline(
    log_trans,
    scaler_trans,
    classifier,
)
logarithms are cool because they encode "orders of magnitude"
 cinder schooner
Greetings, so I have a pdf file, I need to extract some information from it and then restructure it semantically to make the work of analysts easier. I need to extract some key indicators and some snippets associated with defined keywords. Any ideas from where I can start ? any help would be appreciated.
serene scaffold
cinder schooner
Greetings, so I have a pdf file, I need to extract some information from it and ...
extracting text from PDFs sucks. did you finish that step?
beyond that, sounds like you you'll want to look into information extraction techniques, but that's about all I can suggest without knowing exactly what you're trying to do.
does "350pdf" mean "a pdf with 350 pages" or "350 pdfs"?
You can probably use spaCy to recognize numbers that are amounts, and what they're amounts of.
 copper mica
hey can someone correct me if im not understanding this correctly?
So if i have an rgb image, and a conv2d with 15 output channels, each filter will be applied 3 times(1 for every channel in the image)
and then the result of this goes to hte next layer?
azure crystal
Thanks 👍
rugged comet
@serene scaffold Hello. Have you had a chance to look at the confusion matrices I got for my multi-label text classification problem?
serene scaffold
rugged comet
<@253696366952316929> I have 5 confusion matrices because I have 5 labels an thi...
Hello, sorry for the delay. This was sent at midnight in my timezone, and I had forgotten by the time I was completely awake.
Do you know how to make one big confusion matrix? Because some instances are possibly being labeled as instances of a different class, and we want to see that information as well.
looks like what I have in mind is this: https://scikit-learn.org/stable/modules/generated/sklearn.metrics.confusion_matrix.html#sklearn.metrics.confusion_matrix
scikit-learn
Examples using sklearn.metrics.confusion_matrix: Visualizations with Display Objects Visualizations with Display Objects Label Propagation digits active learning Label Propagation digits active lea...
not sure why the one that makes a separate matrix for each one is the "multilabel" one
>>> y_true = ["cat", "ant", "cat", "cat", "ant", "bird"]
>>> y_pred = ["ant", "ant", "cat", "cat", "ant", "cat"]
>>> confusion_matrix(y_true, y_pred, labels=["ant", "bird", "cat"])
array([[2, 0, 0],
       [0, 0, 1],
       [1, 0, 2]])
I'll try this out.
labels = ["W", "U", "B", "R", "G"]
cm = confusion_matrix(actual, predicted, labels=labels)
Traceback (most recent call last):
  File "c:\Users\urkch\AppData\Local\Programs\Python\Python_Projects\MtG ML\model_predict.py", line 70, in <module>
    cm = confusion_matrix(actual, predicted, labels=labels)
  File "C:\Users\urkch\miniconda3\envs\MtGML\lib\site-packages\sklearn\metrics\_classification.py", line 309, in confusion_matrix
    raise ValueError("%s is not supported" % y_type)
ValueError: multilabel-indicator is not supported
Unless I'm doing something wrong, I don't think this method works for multiple labels.
serene scaffold
the example I pulled is from the docs
are actual and predicted both flat lists of strings?
rugged comet
serene scaffold
the example I pulled is from the docs
Recall that in my problem, one instance can have multiple labels. I think the example you showed is multiclass.
serene scaffold
right, I forgot that. sorry
I've never done multilabel classification before.
hmmmmmmmmmm
what is the overarching problem? document classification?
rugged comet
serene scaffold
what is the overarching problem? document classification?
The overarching problem is taking the text from a playing card and classifying it by it's color. The card called Divination is blue denoted by the blue water drop in the top right. The text of the blue card is "Draw two cards.". Some cards have more than one color. The card called Lightning Helix is both Red and White denoted by the red fireball and white sun in the top right. The text of the Red White card is "Lightning Helix deals 3 damage to target creature or player and you gain 3 life.".

 serene scaffold
using machine learning to classify Magic cards. this channel has reached peak nerd.
rugged comet
Haha!
serene scaffold
instead of making your own word embeddings, have you looked for any that were pre-trained on fantasy literature?
rugged comet
serene scaffold
instead of making your own word embeddings, have you looked for any that were pr...
I hadn't thought of that. I'm not sure how well that would work. I think that the rules text on cards are different enough from sentences you might find in a book that the results might be worse than making my own embeddings.
I'm reading this article now.
https://towardsdatascience.com/artificial-intelligence-in-magic-the-gathering-4367e88aee11
serene scaffold
rugged comet
I hadn't thought of that. I'm not sure how well that would work. I think that th...
I wouldn't expect magic cards to have enough text to train embeddings. you might also consider taking existing embeddings and continuing to train them on just the magic cards.
rugged comet
This section seems relevant to the current conversation.
"NLP Deep Learning model. For the Deep Learning models I tokenized the oracle text as mentioned before, padded the token sequences to the max length, created an embedding layer with 100 dimensions, processed them through a Bidirectional LSTM layer and then through some hidden layers of fully connected neurons, using Dropout to avoid too much overfitting. The model was trained for 100 epochs using early stopping with patience 3 if the test set accuracy did not improve."
Also, to give you an idea of how much text there is, I'm training on about 20,000 cards and each card can have up to 126 tokens. I don't know the average card length. This seems pretty good to me. But you have a lot more experience than me.
 serene scaffold
I'll have to look at this more tomorrow
rugged comet
Okay. Thanks for your help.
azure crystal
How can I improve my models testing data accuracy? Currently I have a training accuracy of 96%, but when I am evaluating on my test data I only get 84%-86%. I already built in multiple Dropouts. Is there anything else I can do?
desert oar
rugged comet
The overarching problem is taking the text from a playing card and classifying i...
you're trying to predict card color from its text? i actually think you might be able to do well at this
if you include total mana cost (not color obviously, that's literally cheating) and power/toughness as features on creature cards, i suspect that you can get pretty good separation with the right feature engineering and model design
think about it: "draw cards" is a feature, with a kind of "modifier" in the number of cards to draw
 desert parcel
Hi, I have a quick question. The data I have says that 0 = the person is not diabetic. 1 = the person is diabetic. My question is, is it necessary to encode it? Considering it already is encoded.
rugged comet
desert oar
you're trying to predict card color from its text? i actually think you might be...
Yes, exactly.
I used to include total mana cost as a feature but I took it out because I didn't think it would have that much predictive power.
As for power and toughness, not all cards have this feature so I didn't know how to handle the missing data.
desert oar
i'm not sure about that either. one straightforward option is to have another feature that indicates whether it's a creature or not, and just fill power and toughness with 0 if it's not a creature.
mathematically that's related to something called an "interaction" in traditional statistics:
is_creature = 1 if creature, 0 otherwise
power       = is_creature * power
toughness   = is_creature * toughness
this would hopefully give the model enough information to distinguish between "a 0/0 creature" and "not a creature" in a big enough dataset like yours
 gaunt anvil
@hasty mountain if i'm gathering data for tacotron2, can the wav files i supply have long periods of silence (1-2 seconds) between different lines? Also how long should each file be?
i.e. smth like this

also can i have multiple sentences in a single file or should I split them all up
rugged comet
desert oar
i'm not sure about that either. one straightforward option is to have another fe...
That's awesome. I didn't think it was possible to distinguish 0 power creatures from non-creatures like that.
Time to get to work!
desert oar
rugged comet
That's awesome. I didn't think it was possible to distinguish 0 power creatures ...
no guarantees 😛 it's just one idea
rugged comet
Creatures with * power... lol now things are getting tricky.
 desert oar
i wonder if this would be an easier or harder task if you focused only on older cards with fewer mechanics
rugged comet
Pro: fewer mechanics, simpler cards
Con: less data
lapis sequoia
can i apply functions to groups
lapis sequoia
lapis sequoia
can i apply functions to groups
do you have an example? you should be able to map a function to collection of objects, depending
rugged comet
@desert oar Using the tensorflow functional API, do I need to have a keras.Input for each feature that I want to train on? What if there are hundreds of features? Currently, I do it like this:
        type_inputs = keras.Input(shape=(5, 1), name="type_input")
        converted_mana_cost_inputs = keras.Input(shape=1, name="converted_mana_cost_input")
        text_inputs = keras.Input(shape=(126, 64), name="text_input")
I don't think it makes sense to have a different input layer for each feature. But I don't know how to do it any other way.
lapis sequoia
lapis sequoia
do you have an example? you should be able to map a function to collection of ob...
I have a df and based on what value a specific column has, I want to generate values for the entries of that group for a new column
here you can see method

Each group will have a unique method
I wanna do some statistics on that group and add a new column to it based on the method
for example I want 100 to be value for the new column for all groups having method pct_rank
and 1 to be value for all groups having method "none"
I think groupby.apply can handle that. I did some experimentation
desert oar
i don't know anything about the tf functional api, but normally you just concatenate all your input features into one long vector. i know there are architectures that are "branched", where you have multiple sets of inputs with their own features, but i don't know if that's what you're going for here
rugged comet
desert oar
i don't know anything about the tf functional api, but normally you just concate...
Yeah the tf functional API is for when you have multiple inputs or even outputs. I'm using it because some inputs should be treated differently from other inputs in my opinion. For example, I think that converted mana cost should be normalized via a Normalization layer. But my text or card type inputs don't need to be normalized.
lapis sequoia
how can I make fields as columnand value as their values

Kind of from long to wide format in pandas
pd.pivot found it
 obsidian peak
Hi everyone, Since 2 weeks I have been working on this project...And its finally done! Its a device that detects license plate in frame and gets U all details of the vehicle! New Ideas Welcome . Sharing the GitHub repo for code and documentation -> https://github.com/YashIndane/platefetcher


GitHub
Scan the number plate and get all the details of the vehicle! 🚘 - GitHub - YashIndane/platefetcher: Scan the number plate and get all the details of the vehicle! 🚘
 grand minnow
Hey all, if anyone is interested in taking on some free data science courses access for 21 days, click here: https://365datascience.com/r/2b075784bfe0e3317abe900a4350d5
(It's a referral link and both of us can get 1 month free access 😉 )
lapis sequoia
grand minnow
Hey all, if anyone is interested in taking on some free data science courses acc...
!rule 6 please:'(
grand minnow
lapis sequoia
!rule 6 please:'(
Hmm... Advertising would mean I'm trying to sell a product/service. But I'm not making any commission out of it. Instead, both myself and the referral gets free access at the service provider expense.
Am I wrong?
 prime oak
what's the differene between the two violin plots?
 grand minnow
prime oak
what's the differene between the two violin plots?
grand minnow
prime oak
what's the differene between the two violin plots?
Topic 8 doesn't look like violins. More like candlesticks
prime oak
grand minnow
Topic 8 doesn't look like violins. More like candlesticks
both were generated using violin plots though, can you tell me what the topic 8 means?
grand minnow
prime oak
both were generated using violin plots though, can you tell me what the topic 8 ...
Hard to say without context. Something about word counts and domain score but I don't know what it's referring to
I also don't know how to read violin plots.
prime oak
I see. Thank you anyway.
 torn hull
Hey guys so I was working on this project where i was asked to
Score a resume on the basis of some keywords
Basically I was doing it by filtering and making tokens of the data from the resume
But how can I use a ml/dl model like Bert for this task
 worthy echo
I have a Django app which uses a 3 GB ml model trained on GPU, how do i go about deploying the ml model in a cloud gpu so that it becomes scalable? I have no idea in this respect
torn hull
So I have a list of token and a dictionary can I use bert model to compare these two and give a score to the list of tokens based on its similarity with the dictionary
cinder schooner
torn hull
Hey guys so I was working on this project where i was asked to
Score a resume o...
take a look at this https://github.com/MaartenGr/KeyBERT

GitHub
Minimal keyword extraction with BERT. Contribute to MaartenGr/KeyBERT development by creating an account on GitHub.
dense lagoon
Anyone know good online augmenters for a dataset? like if I wanna make a copy of all my images that are like reversed, and etc
cinder schooner
dense lagoon
Anyone know good online augmenters for a dataset? like if I wanna make a copy of...
I tried to write one in python once, you can try it. It's not as efficient since its written in numpy but it can be a good starting point if you want to try this and make your own data augmentation library. https://github.com/ahmedbelgacem/TunAugmentor

GitHub
A Python library for image augmentation. Contribute to ahmedbelgacem/TunAugmentor development by creating an account on GitHub.
wooden sail
prime oak
both were generated using violin plots though, can you tell me what the topic 8 ...
these are both box plots, but the one on top also shows the count of each point on the box plot. the one below might not show the count either because it doesn't fit or because some flag was set
torn hull
cinder schooner
take a look at this https://github.com/MaartenGr/KeyBERT
thanks mate checking
torn hull
hey @cinder schooner so I checked keybert and it was actually extracting the keywords from the text. What i was searching was that I have another list of words and compare the similarity of that list of words with the text
cinder schooner
torn hull
hey <@347868773694439425> so I checked keybert and it was actually extracting t...
you can yes, I was answering the first text on keywords for the resume.
cinder schooner
torn hull
hey <@347868773694439425> so I checked keybert and it was actually extracting t...
to compare semantic similarity you can use https://www.sbert.net/ check the semantic text similarity and the semantic search. The idea is to make an embedding of the text and then use cosine similarity
torn hull
okay @cinder schooner what I understood is it's converting/embedding my text and keywords in vector array and we can compare these two by cosine similarity.
am i right 🙂
?
cinder schooner
yes
eternal zephyr
ok figured out my Jupyter issue. Python 3.10 was somehow being used over 11 when I needed to uninstall it
torn hull
cinder schooner
yes
okay cool thanks buddy
abstract apex
guys does this seem right to you? i would have expected numpy arrays to be faster than lists when calculating dot products...
the funcs do the exact same thing, dot product of 10 element list/array
 mighty patio
abstract apex
guys does this seem right to you? i would have expected numpy arrays to be faste...
mighty patio
abstract apex
guys does this seem right to you? i would have expected numpy arrays to be faste...
can you put the code on https://paste.pythondiscord.com/ ?
abstract apex
sure
 tidal bough
In [1]: import numpy as np

In [2]: arr = np.random.random(10)

In [3]: %timeit arr@arr
2.85 µs ± 238 ns per loop (mean ± std. dev. of 7 runs, 100,000 loops each)

In [5]: lst = list(arr)

In [6]: %timeit sum(x*x for x in arr)
6.92 µs ± 1.03 µs per loop (mean ± std. dev. of 7 runs, 100,000 loops each)
don't see anything like that. (and the difference is way worse for bigger arrays)
Ah, so you're not actually using any numpy functions, but python loops everywhere. That should make the performance roughly equal since you're measuring a lot of stuff other than the actual dot products. Strange that you get arrays to be slower, though.
ah, you're using np.dot at least
abstract apex
np.dot vs sum([A[n]*B[n] for n in range(len(A))]) was what i was trying to compare
but didnt realise loops had such an issue
tidal bough
abstract apex
but didnt realise loops had such an issue
There's more issues than that. For one, I suspect what takes the most time in your timings is actually generating the random arrays and lists.
abstract apex
right..
so maybe if i used predefined lists and arrays it would be a better representation of performance?
tidal bough
don't make them predefined, just generate them before timing the dots
also, uhh, what's x from for x in range (1000000,11000000,100000): actually used for? it looks to me like it's not.
abstract apex
x axis?
if you print x it just spits out every increment of the loop which allows for charting i guess
mighty patio
I believe you want to have arrays_performance = timeit.timeit(f'arrays_gen_dp_efficiency({x})', globals=globals(), number=z)
i.e. you should use x instead of hard-coding 10
tidal bough
yeah, but why have the loop at all?
import numpy as np
def test_arrs(X_arrs,Y_arrs):
    for x,y in zip(X_arrs, Y_arrs):
        np.dot(x,y)

def test_lists(X_lsts, Y_lsts):
    for x,y in zip(X_lsts, Y_lsts):
        sum(a*b for a,b in zip(x,y))

def test(n,N):
    n = 10
    N = 1000
    X_arrs = np.random.random((N,n))
    Y_arrs = np.random.random((N,n))
    X_lsts = X_arrs.tolist()
    Y_lsts = Y_arrs.tolist()

    print("Testing arrs")
    %timeit test_arrs(X_arrs,Y_arrs)
    print("Testing lists")
    %timeit test_lists(X_lsts,Y_lsts)

test(10,1000)
Testing arrs
4.32 ms ± 1.13 ms per loop (mean ± std. dev. of 7 runs, 100 loops each)
Testing lists
4.15 ms ± 948 µs per loop (mean ± std. dev. of 7 runs, 100 loops each)
getting this on a more similar implementation
the difference is within 1 std, so doesn't say much, but maybe lists are slightly faster, maybe due to slicing being faster or something. increasing n to even 30 makes arrays way faster, though.
abstract apex
mighty patio
I believe you want to have `arrays_performance = timeit.timeit(f'arrays_gen_dp_e...
would this boost performance?
abstract apex
tidal bough
the difference is within 1 std, so doesn't say much, but maybe lists are slightl...
yeah i was gonna look into the big-o behind it if possible, its probably just randomness
mighty patio
abstract apex
would this boost performance?
no, but if you hard-code 10, you are always comparing matrixes of length 10
Did you not intend to compare with different length of the matrix?
tidal bough
abstract apex
yeah i was gonna look into the big-o behind it if possible, its probably just ra...
The big-O would be O(n N) for both of course - it's just array multiplication, you can't get a better complexity than that and you'd need to make some horrible mistake to do worse
abstract apex
interesting, im actually just learning about big-O stuff so trying to figure out every basic operation behind functions is a bit daunting,
mighty patio
most likely, the random number-generation is the limiting factor of speed here, and this is most likely the same for both versions
abstract apex
got it, ill test that out a little bit, thanks for your time guys
tidal bough
import numpy as np
import perfplot
import matplotlib.pyplot as plt

def generate(n):
    a, b = [np.random.random(n) for _ in range(2)]
    return a, b, a.tolist(), b.tolist()

out = perfplot.bench(
    setup=generate,
    kernels=[
        lambda a, b, _1, _2: np.dot(a, b),
        lambda _1, _2, a, b: sum(x * y for x, y in zip(a, b)),
    ],
    labels=["array dot", "list sum of zip"],
    n_range=[1, 2, 5, 10, 20, 50, 100, 200, 500, 1000, 5000, 10000, 20000, 50000, 100000],
    xlabel="len",
    target_time_per_measurement=2.0,
)
out.show(
    logx=True,
    logy=True
)
Here's a benchmark for a variety of ns using the perfplot package

note the log scaling - for len of 100000, the numpy one is a hundred times faster
 lean topaz
Can anyone tell me why the accuracy is 0.000%?
 serene scaffold
lean topaz
Can anyone tell me why the accuracy is 0.000%?
serene scaffold
lean topaz
Can anyone tell me why the accuracy is 0.000%?
there's no way to know without knowing what your training data is and what the model is.
keep in mind that we have no idea what you're doing unless you tell us. you wouldn't open a help channel and say "Can anyone tell me why my code got an error?" and expect an answer.
lean topaz
I have a set of images of oxen and a file with their weights. I'm creating a model that makes the prediction of oxen weights.
image of the ox seen from above.
 tidal bough
Are the weights floating-point or integer?
lean topaz
 dense lagoon
Why a , ?
lean topaz
xlsx with the weights of each ox present in the images
tidal bough
Generally speaking, a regression (rather than classification) model (EDIT: actually, more generally any continuous rather than discrete output) isn't judged on accuracy - when you're predicting a continuous value, it's very improbable to get the prediction exactly accurate down to float precision. Your model could be predicting 447.500000001 and it'll be considered a failure due to not being equal to 447.5. So your loss is dropping but accuracy is exactly 0.
lean topaz
tidal bough
Are the weights floating-point or integer?
floating-point
 visual garden
Hey, for a data science assignment I have to program a PageRank algorithm, and a Random Surfer algorithm.
Using Networkx page rank I compared my first 10 pages and I get this .
Is this huge difference normal? Or Have I done goofed somewhere ?

Aka: Shall I expect such a huge discrepancy?
fossil ivy
holas people
I use 29 years (1992-2021) of hindcast data to model a markov chain. It seems to work reasonably well. I just created a candlelight graph, it looks like this:
Should I remove the outliers from the data? Or do you reckon it is fine to leave them in

 frank condor
hi
im new here, do you guys know any version of something like gpt which occupies less space?
I've heard of gpt-neo, but it is 10 gigs and i dont have that much space
mighty patio
fossil ivy
holas people
Either you have describe to your audience what the outliers are
Alternatively you remove them, and then you have to tell your audience why you removed them
Which option you choose depends on the message you are trying to communicate
fossil ivy
mighty patio
Either you have describe to your audience what the outliers are
Alternatively yo...
so I model seasonal weather in the North Sea to quantify its implications on offshore wind farm decommissioning performance. Basically the outliers most likely represent some sort of storms or really high waves. The more outliers, I would say, the more subject that month is to extreme weather conditions which I reckon I should be capturing given my research goal
In that case, I should most likely leave them in isnt it?
mighty patio
sounds like they will be important to your audience, so yes
fossil ivy
mighty patio
sounds like they will be important to your audience, so yes
agreed, thank you
 bitter ivy
Hello, can I ask how do I change colors also for the legend here:
plt.subplot(1,3,1)
sns.scatterplot(data=temp_data,x="accX",y="accY",hue="Class",alpha=0.7, palette=['red','blue'])
plt.legend(labels=['Hell Yeh', 'Nah Bruh'])
The problem is that I defined colors in scatterplot with ['red','blue], but in legend I get both dots red colors .
Thanks
sly lake
Hey guys! How do I deploy a keras model (.h5) file to Heroku or something so that I can make API calls to it from my Android app?
 hasty mountain
gaunt anvil
also can i have multiple sentences in a single file or should I split them all u...
hasty mountain
gaunt anvil
also can i have multiple sentences in a single file or should I split them all u...
I think it would be better if you split them all. If you let long periods of silence between sentences, the model might output sentences with silence randomly inserted between words
In audio models, silence is usually done for padding, when the input has been finished, so you using silence before the input has actually been finished might be troublesome...
sly lake
Like I was following this tutorial and I have the finally trained model with an H5 extension. But now where do I load it and stuff to get output?
 gaunt anvil
hasty mountain
I think it would be better if you split them all. If you let long periods of sil...
gaunt anvil
hasty mountain
I think it would be better if you split them all. If you let long periods of sil...
alr ty 👍
 brisk cedar
Hi, i am starting the study to do this.....how are you comming in that?
azure crystal
How can I improve my models testing data accuracy? Currently I have a training accuracy of 96%, but when I am evaluating on my test data I only get 84%-86%. I already built in multiple Dropouts. Is there anything else I can do?
serene scaffold
azure crystal
How can I improve my models testing data accuracy? Currently I have a training a...
every time you want help improving your model, you must say what kind of model it is, what it's intended to do, and what your training data is. There are no one-size-fits-all solutions to improving models.
Please keep this in mind, because if you're going to ask for the attention of our question answerers, it's important that you ask questions substantive enough to be worth peoples' time.
azure crystal
serene scaffold
every time you want help improving your model, you *must* say what kind of model...
Sorry, I forgot. I have a model with a binary output:
es_callback = EarlyStopping(monitor='val_loss', patience=3)
# --Creating model--
model = Sequential()
model.add(Dense(2048, input_shape=x_train[0].shape, activation='relu'))
model.add(Flatten())
model.add(Dropout(.25))
model.add(Dense(units=1024, activation='relu'))
model.add(Dropout(.25))
model.add(Dense(units=512, activation='relu'))
model.add(Dense(units=256, activation='relu'))
model.add(Dropout(.25))
model.add(Dense(units=128, activation='relu'))
model.add(Dropout(.25))
model.add(Dense(units=64, activation='relu'))
model.add(Dense(units=32, activation='relu'))
model.add(Dense(units=1, activation='sigmoid'))
# --Model finishes--
# Compiling model
model.compile(optimizer='adam', loss='binary_crossentropy', metrics=['accuracy'])
model.fit(x_train, y_train, epochs=40, batch_size=512, callbacks=[es_callback], validation_data=(x_test, y_test))```
x_train: 200000x56x100
And the data is already scaled novel python
guys, I want to create a variety of models giving different weights to 6 points in order to test the difference from a 7th. I wanted to create all possible combinations, from [100% 0% 0% 0% 0% 0%] to a random sequence, such as [0% 27% 3% 17% 8% 45%]
currently, I'm trying to do that with for loops, but I feel like it is not efficient at all. Is there any other way to do that/
serene scaffold
novel python
currently, I'm trying to do that with for loops, but I feel like it is not effic...
please show the code you're referring to
novel python
serene scaffold
please show the code you're referring to
this is the dataframe I'm trying to transform (and clearly the code is wrong because it's creating models which the percentages do not sum to 100%):

    for b in range(0, 101):
        for c in range(0, 101):
            test_df[f'Model {a}% {b}% {c}% Prediction'] = test_df[test_df.columns[6]]*(0 + a/100) + test_df[test_df.columns[5]]*(0 + b/100 - a/100) + test_df[test_df.columns[4]]*(1 - c/100 - a/100 - b/100)
test_df[f'Model {a}% {b}% {c}% Difference'] = test_df[f'Model {a}% {b}% {c}% Prediction'] - test_df[test_df.columns[7]]```and this is the code I'm currently trying to fix
serene scaffold
novel python
```for a in range(0, 101):
for b in range(0, 101):
for c in range(0,...
I won't look at screenshots of dataframes. but you could calculate all this more quickly with numpy arrays and broadcasting
 steady basalt
its that time of the year to pick kaggle back up again and relearn data science i forgot about
 ripe sapphire
Hi everyone! I am new to AI, and I want to learn as much as possible from my seniors and mentors, although I don,t anything But I am quite interested in Ml
Hope you all will help
bitter ivy
Hello, can I ask how do I change colors also for the legend here:
plt.subplot(1,3,1)
sns.scatterplot(data=temp_data,x="accX",y="accY",hue="Class",alpha=0.7, palette=['red','blue'])
plt.legend(labels=['Hell Yeh', 'Nah Bruh'])
The problem is that I defined colors in scatterplot with ['red','blue], but in legend I get both dots red colors .
 compact star
not sure if this is a more relevant place to ask about this
I am trying to create a convolutional layer from scratch in python, I understand that there are libaries for this but it is for a project so I have to do it myself. I have seen that other people are able to specify how many filters they have for each convolutional 2d layer but I am not quite sure how I would do that for my implementation.
class ConvolutionalLayer(Layer):
    def __init__(self, input_shape, kernel_size, depth):
        self.input_depth, self.input_height, self.input_width = input_shape
        self.depth = depth
        self.input_shape = input_shape

        self.output_shape = (depth, self.input_height - kernel_size + 1, self.input_width - kernel_size + 1)
        self.kernel_shape = (depth, kernel_size, kernel_size)
        self.kernels = np.random.randn(*kernels_shape)
        self.biases = np.random.randn(*self.output_shape)
The filters are the kernels
I am also aware that I will have to stack 4 frames on top of each other so that movement can be seen, how would I do that if I have a list of pygame surfaces?
hasty mountain
compact star
The filters are the kernels
I am also aware that I will have to stack 4 frames o...
np.stack(frames, axis)?
hasty mountain
compact star
not sure if this is a more relevant place to ask about this
I am trying to crea...
I've tried implementing one Conv2D from scratch, too. I only got stuck in the backpropagation.
Perhaps you could try something like this:
def Conv2D(input, kernel, bias, padding=0, strides=1):
    kernel = np.flipud(np.fliplr(kernel)) # Cross-correlation
    xi, yi = input.shape[1], input.shape[2] # Keep in mind that input.shape[0] = BATCH_SIZE
    xk, yk = kernel.shape[0], kernel.shape[1]

    xout = (xi - xk + 2*padding)/strides + 1.0
    xout = int(xout)

    yout = (yi - yk + 2*padding)/strides + 1.0
    yout = int(yout)

    output = np.zeros((xout, yout))

    # Remember: A TransposedConv is simply a very padded input + normal Conv

    if padding != 0:
        input = np.pad(input, [(0,0), (padding, padding), (padding, padding)]) # Applying padding only to Height and Width, not batch neither channels.
        xi, yi = input.shape[1], input.shape[2]

    for y in range(yi):
        if y > yi-yk:
            break
        if y % strides == 0:
            for x in range(xi):
                if x > xi-xk:
                    break

                try:
                    if x % strides == 0:
                        output[x,y] = (kernel * input[x:x+xk, y:y+yk]).sum() + bias

                except:
                    break

    return output
Oh yes...I remember that there might be some problem with that bias sum. Apart from that, this function should run smoothly.
 strong sedge
compact star
not sure if this is a more relevant place to ask about this
I am trying to crea...
strong sedge
compact star
not sure if this is a more relevant place to ask about this
I am trying to crea...
Depth would be a part of input shape, you would take in num filters as a seperate parameters
The output shape will be dependent on input size, filter size and num filters
compact star
strong sedge
Depth would be a part of input shape, you would take in num filters as a seperat...
If I take in num_filters as a parameter how would I use it to create multiple filters and calculate output shape, say if each frame was 250x100 pixels and there were 4 frames, for example
 hard nest
Hello guys , I have a Question There's an excellent API to help me with this or how to solve this problem.

Using Python TensorFlow
 misty flint
random friday night data science
discover weekly from spotify is one of the best recsys algos out there
that is all

 tidal frigate
any one good at non linear fiting...?
 bold pumice
compact star
not sure if this is a more relevant place to ask about this
I am trying to crea...
bold pumice
compact star
not sure if this is a more relevant place to ask about this
I am trying to crea...
I've implemented the forward and backward pass of Convolutions from scratch. Check it out at: https://github.com/pranftw/neograd/blob/main/neograd/autograd/ops/conv.py

GitHub
A deep learning framework created from scratch with Python and NumPy - neograd/conv.py at main · pranftw/neograd
dense lagoon
anything I can do similiar to this https://blog.roboflow.com/isolate-objects/ ? I want to isolate a object that has text in my AI so I can OCR it easier

Roboflow Blog
You can now export the bounding boxes from your object detection dataset as cropped images usable with classification models. This update will enable easily prototyping two-pass models for use-cases like OCR and object tracking. Isolate Objects is now available as a preprocessing step.To try it out, simply enable the
 wise pelican
I'm trying to import a CSV file with numpy, where the first row is the column titles (in this case they are "timestamp" and "value")
Thing is that the timestamp column consists of values in the form of YYYY-MM-DD_HH:MM:SS:MS, which causes numpy to freak out that the format is not correct and thus can't be parsed
Been trying to find ways to parse this properly as a datetime64 dtype but the error Cannot create a NumPy datetime other than NaT with generic units keeps happening
Is there something I need to fix with this format? How would I parse the data as string beforehand to put it into a proper format that numpy will accept it as a datetime64 dtype?
mighty patio
wise pelican
I'm trying to import a CSV file with numpy, where the first row is the column ti...
The easiest solution is probably to write your own parser for that line.
If the file is not too big it should be unproblematic to write a parser for the rest of the file as well, otherwise you can pass the open file to numpy
import numpy as np
with open("data.csv") as data:
    first_line = data.readline()
    rest_of_table = np.loadtxt(data)
The above code snippet separates out the first line of the file(for you to parse manually) and reads the rest as a numpy array
fossil ivy
would someone be willing to discuss some conceptual question that I have about my simulation? Would be much appreciated
rugged comet
You can just ask your question.
fossil ivy
I have coded a logistics simulation to replicate day-to-day logistics of offshore wind farm decommissioning.
In my research, I investigate the impact of weather seasonality on project performance and the role of vessel fleet composition
My code in a nutshell works like this:
for i in range(20)    #20 Full runs of the simulation to average values
  for j in days       # Starting the project on each day of the year separately
    for v in vessels  # And for each day, simulate for the vessels input into the model
I use a Markov Chain to model the weather conditions and I am wondering which is the right approach
Before today, I have essentially generated new weather conditions as the simulation progressed, they are reset for each v. However, that means that for one vessel the weather would be different than for another, as well as for different days j (correct me if I am wrong)
So what I have done now is that I simulate a full sequence of weather for 10 years for each ì, which is used in each j and v
In that way, the weather per simulation i is identical every time, and the timestamp accessed in the simulated weather will be different for j, would you suggest this is the right approach?
I have never done something like this, nor come from a math-heavy or statistics/ data science background
If my explanation is unclear I can provide code snippets to illustrate the difference in modeling
cinder schooner
fossil ivy
My code in a nutshell works like this:
```py
for i in range(20) #20 Full runs...
can you explain a little more? its still unclear
fossil ivy
cinder schooner
can you explain a little more? its still unclear
sure, what is unclear? 🙂
cinder schooner
im not seeing the difference in modeling, its what vs what and where is the question?
fossil ivy
okay so my objective is to research the impact of weather seasonality on decommissioning project performance. I do that by changing the starting date of the project to subject it to different weather conditions
The way I modelled before:
Date = 01.01.
Vessel = JUV
Wave height at 01.07., 2pm: 3m
Wave height at 01.07., 3pm: 3.5m

Date = 01.01.
Vessel = WTIV
Wave height at 01.07, 2pm: 2.5m
Wave height at 01.07., 3pm: 3m

Date 05.01.
Vessel = JUV
Wave height at 01.07, 2pm: 4.5m
Wave height at 01.07., 3pm: 5m

Date 05.01.
Vessel = WTIV
Wave height at 01.07, 2pm: 1.5m
Wave height at 01.07., 3pm: 1.25m
That's the result of how I modeled before (sorry was called just now)
The way I model it now:
Date = 01.01.
Vessel = JUV
Wave height at 01.07., 2pm: 3m
Wave height at 01.07., 3pm: 3.5m

Date = 01.01.
Vessel = WTIV
Wave height at 01.07, 2pm: 3m
Wave height at 01.07., 3pm: 3.5m

Date 05.01.
Vessel = JUV
Wave height at 01.07, 2pm: 3m
Wave height at 01.07., 3pm: 3.5m

Date 05.01.
Vessel = WTIV
Wave height at 01.07, 2pm: 3m
Wave height at 01.07., 3pm: 3.5m
So before I was basically generating new values for each vessel and date
Now I create those values for 10 years and just access the element of the resulting list depending on the clock of the simulation
That way, regardless of date or vessel, one timestamp will always have the same weather condition
Do you reckon the way I approach it now is better?
 sweet lark
**Challenge: **
- NoSQL database with many-to-many relationships among people/project/organization entities.
- Every relationship match needs the ability to attribute one or multiple data sources and descriptive timestamps.
Attempted Solution:
STRUCTURE
"sources" collection - raw data source documents
"relations" collection- source <> entity relation document (one per entity)
"entities" collection - final entity documents
DATABASES
mongodb atlas & firestore
FUNCTIONS
Google Cloud functions (Python) for keeping denormalized data in sync
Asks:
- Does my current solution seem correct & efficient? (is a "relations" collection best to keep track of data sources?)
- Any recommended low/no-code ETL tools? (keboola seems promising but expensive at scale)
Any suggestions or advice very welcome (Will get to 1M+ entities this month so want to do it correctly haha)
 obtuse talon
Hey guys please help when I'm calculating recall and precision with sklearn it gives me different answer than calculating it manually
accuracy = (lst.count("TP") + lst.count("TN")) / (lst.count("FP") + lst.count("TN") +lst.count("FN") +  lst.count("TP"))
print(accuracy)
-output 0.6313725490196078
precision = lst.count("TP") / (lst.count("TP") + lst.count("FP"))
print(precision)
-output 0.8896103896103896
recall = lst.count("TP") / (lst.count("TP") + lst.count("FN"))
print(recall)
-output 0.6401869158878505
f1score = (2*precision*recall) / (precision + recall)
print(f1score)
-output 0.7445652173913044

Expect from the accuracy, I get diffrenet outputs when calculatin using sklearn
 candid quarry
Guys, on a whim I felt like coding an discrete cosine transform from scratch as one of those terrible old school style neutral nets you got in the 80s that never worked very well. Meh, bored.
Anyway, I'm taking the dot product between n-d vectors and I obviously want to normalise them first. So I merrily typed np.normalize(my_vec) and there's no such function... Eh? I looked through the numpy docs and can't see it? Where is the vector normalize function hiding? I just want a unit vector obviously.
I looked under my desk, under the cushions on my sofa but no luck. Please don't tell me I have to code bliming pythagoras by hand... What's the world coming to?
wooden sail
you can do it by hand by computing the norm and dividing by it 😛
candid quarry
@wooden sail Poor me! I'll have to code round div by zero too... I demand violins. I can't believe numpy doesn't have such a basic thing...
That's it, I'm writing my own Vector class. I'm boycotting numpy. It's either that or stand outside their offices holding a placard.
wooden sail
have fun writing your LAPACK wrapper
candid quarry
Hehe, thanks buddy! This 40 year out of date NN isn't going to write itself! 🙂
wooden sail
there IS a normalize function in scikit learn btw, but this anyway isn't too difficult. as you say, consider a case where the norm is 0, and otherwise divide by the numpy.linalg.norm
candid quarry
Yeah, it's no biggy. No exactly advanced maths. I'll make my own data class, it'll make the rest easier anyway.
sly lake
Hi there
Can I host an ML model in Heroku and make API calls to it? Like I know it is possible but can someone point to a resource so that I can actually try it?
I have a Keras model (.h5) and a python script that loads and runs the model and gets the predictions
candid quarry
@sly lake Yup. Just go to their website and spool up a free dyno. You can migrate from github / docker I believe. Not used it myself though.
Deploying applications to Heroku, and supporting multiple application environments.
candid quarry
You need a framework for that. You'll have to dig up a tutorial, like I say, I've not used it myself.
misty flint
i recommend this open source library i heard about on a podcast https://github.com/impira/docquery

GitHub
An easy way to extract information from documents. Contribute to impira/docquery development by creating an account on GitHub.
made a small poc after hearing about it to test it. its based on impira's version of LayoutLM for document question-answering
works well with other documents like invoices/contracts/etc. too
serene scaffold
misty flint
i recommend this open source library i heard about on a podcast https://github.c...
.bm
 strange elbowBOT
Click the button to be sent your very own bookmark to [this message](#data-science-and-ml message).
 slate elbow
suppose I have a trained ml model, after predicting can I send the results to the front-end UI? like some graphs, analysis, and the prediction results to the front end...
can someone please give me a crude idea or resource on how its done
compact star
if I have an input to a convolutional2d layer with input of (x, y, depth1) with a n kernels of size of (a, b, depth2) how do I calculate the output shape in the form (x, y, depth)?
I think it should work like this but I am not sure?

I will be using a stride of 1 so that won't matter
tidal bough
The docs for it describe the output shape in excruciating detail I believe
for a stride of 1, though, I think it's as simple as (x-a+1, y-b+1, depth2)
compact star
could u link the docs, if not could u also include how the stride changes it, also if possible how would forward and back prop work with a different stride value work, any help on this would be appreciated, if it helps this is what I currently have
class ConvolutionalLayer(Layer):
    def __init__(self, input_shape, kernel_size, depth):
        self.input_depth, self.input_height, self.input_width = input_shape
        self.depth = depth
        self.input_shape = input_shape

        self.output_shape = (depth, self.input_height - kernel_size + 1, self.input_width - kernel_size + 1)
        self.kernel_shape = (depth, kernel_size, kernel_size)
        self.kernels = np.random.randn(*kernels_shape)
        self.biases = np.random.randn(*self.output_shape)

    def forward_propogation(self, a):
        self.input = a
        self.output = np.copy(self.biases)

        for i in range(self.depth):
            for j in range(self.input_depth):
                    self.output[i] += signal.correlate2d(self.input[j], self.kernels[i, j], "valid")

    def backward_propogation(self, output_gradient, learning_rate):
        kernels_gradient = np.zeros(self.kernel_shape)
        input_gradient = np.zeros(self.input_shape)

        for i in range(self.depth):
            for j in range(self.input_depth):
                 kernels_gradient[i, j] = signal.correlate2d(self.input[j], output_gradient[i], "valid")
                 input_gradient[j] += signal.convolve2d(output_gradient[i], self.kernels[i, j], "full")

        self.kernels -= learning_rate * kernels_gradient
        self.biases -= learning_rate * output_gradient

return input_gradient```https://pytorch.org/docs/stable/generated/torch.nn.Conv2d.html
"Shape" part there
desert oar
 idle urchin
https://www.reddit.com/r/learnprogramming/comments/yn95jy/getting_returned_nan_f...
idle urchin
https://www.reddit.com/r/learnprogramming/comments/yn95jy/getting_returned_nan_f...
is this even valid python syntax?
A['User'] = np.where(A['Mail'].str.find("@)>0,A['Mail'].str.slice(0,A['Mail'].str.find("@)),'NA')
i copied and pasted that from your post
idle urchin
desert oar
is this even valid python syntax?
so like what I'm trying to do is have it return from the 0th element to right before the"@" symbol
desert oar
idle urchin
so like what I'm trying to do is have it return from the 0th element to right be...
and what is going wrong? you are getting missing values in A['User'] where you aren't expecting any?
idle urchin
using np.where
desert oar
it sounds like maybe you want to be using regex here
this code is completely garbled. it's not valid python syntax.
can you post your actual code?
idle urchin
desert oar
and what is going wrong? you are getting missing values in `A['User']` where you...
I'm getting "nan"
idle urchin
desert oar
can you post your actual code?
that is the code
desert oar
idle urchin
that is the code
this is not valid python code:
A['User'] = np.where(A['Mail'].str.find("@)>0,A['Mail'].str.slice(0,A['Mail'].str.find("@)),'NA')
note that the syntax highlighting is messed up as an indication that it's not valid
i assume you left out a " somewhere
A['User'] = np.where(A['Mail'].str.find("@")>0,A['Mail'].str.slice(0,A['Mail'].str.find("@")),'NA')
is this what you meant to write?
desert oar
this is how i would format it for readability:
A['User'] = np.where(
    A['Mail'].str.find('@') > 0,
    A['Mail'].str.slice(0, A['Mail'].str.find('@')),
    'NA',
)
ok thanks but do you know why it can be returning nan
desert oar
idle urchin
ok thanks but do you know why it can be returning nan
i'm actually not sure. it could be a bad interaction with numpy not understanding pandas data types or vice versa
are there any missing values in A['Mail']?
idle urchin
no
idle urchin
like there's some empty spaces
but like
say after the the condition I just put
A['Mail'].str.find('@')
it will return the number
desert oar
!d pandas.Series.str.slice
arctic wedgeBOT
Series.str.slice(start=None, stop=None, step=None)```
Slice substrings from each element in the Series or Index.but when I put it inside slice it doesn't work
desert oar
i think it's because slice is not "vectorized" over the start and stop values
the docs say int, normally if it was vectorized it would say "array-like"
this code is convoluted and inefficient anyway
idle urchin
really np.where is fast though
idle urchin
but it's different strings on each row
idle urchin
desert oar
np.where is not magic speed pixie dust
yeah but it's faster then just looping or using iterrows
desert oar
of course, but there are many other ways to do this
idle urchin
desert oar
of course, but there are many other ways to do this
what other ways do you suggest
desert oar
one option
def email_extract_local(email):
    parts = email.split('@', maxsplit=1)
    if len(parts) == 0:
        return None
    else:
        return parts[0]

A['User'] = A['Mail'].apply(email_extract_local)
another option
A.loc[A['Mail'] == '', 'Mail'] = None

A['User'] = (
    A['Mail'].str.split('@', n=1)
    .map(itemgetter(0), na_action='ignore')
)
and of course you can replace the nulls with NA later using .fillna
A['User'] = A['User'].fillna('NA')
although frankly i don't think you want that
idle urchin
but np.where is faster then using apply
desert oar
that isn't the slow part of your code
the slow part is the repeated .finds
how big is this data anyway? performance of .apply doesn't really start to matter until you have millions of rows, and even then it's very rarely the bottleneck
usually the function inside the .apply is the slow part
idle urchin
about a million rows
desert oar
both versions of my code will run almost instantly on that data
moreover i suggest using the "string" dtype when working with text
it will be more efficient and it helps you avoid errors
idle urchin
but I saw a video one time that said using .where is always better then apply
desert oar
idle urchin
but I saw a video one time that said using .where is always better then apply
that video is wrong
np.where(x, a, b) is always faster than x.apply(lambda v: a if v else b)
but that's not the issue here, and that's not what i'm recommending
np.where also in this case isn't good because it computes the b value even on values where you don't want it
instead you should use a boolean mask if you want pre-filtering
or .map(..., na_action='ignore') if you are specifically filtering NAs
idle urchin
but do you know why in my code when I put find inside of slice it won't work
desert oar
i told you, because str.slice apparently is not vectorized over the start and stop position
meaning, it doesn't accept an array of stop positions
idle urchin
desert oar
meaning, it doesn't accept an array of stop positions
what do you mean by an array of stop positions
desert oar
idle urchin
what do you mean by an array of stop positions
look at your code. you are passing A['Mail'].str.find, a Series ("array-like") to the .str.slice
desert oar
yes
idle urchin
appreciate the help
desert oar
here's yet another way to write it, which is more similar to your np.where code, and using regex instead of .str.find:
is_valid_email = A['Mail'].str.contains('@', regex=False)

A['Mail'] = 'NA'
A.loc[is_valid_email, 'Mail'] = (
    A['Mail'].str.extract('^(.*)@').str.get(0)
)
actually you can use the default behavior of str.get more effectively:
A['Mail'] = (
    A['Mail'].str.extract('^(.*)@').str.get(0)
)
A.loc[A['Mail'].str.len() == 0, 'Mail'] = 'NA'
!d pandas.Series.str.get
arctic wedgeBOT
Series.str.get(i)```
Extract element from each component at specified position or with specified key.

Extract element from lists, tuples, dict, or strings in each element in the Series/Index.so this is faster then .apply
desert oar
idle urchin
so this is faster then .apply
don't worry about faster
it's good to not do completely wasteful things like scan each string 3 times, but it's also not worth obsessing over whether numpy or pandas or python implemented loops more efficiently
let's say you have a loop that takes 10 ns per iteration vs. 100 ns per iteration. over 1 million iterations, that's 1 second vs. 10 seconds. when you have 1 billion iterations then you might care about the difference.
idle urchin
but 1 second to 10 second is still a big difference
desert oar
even so, the other parts of your code will make more of a difference
at minimum you should be using .find once and saving the results to a variable
idle urchin
desert oar
one option
```python
def email_extract_local(email):
parts = email.split('@'...
are u sure this top code is correct
desert oar
how can you be worried about speed when you are literally doing the same computation over and over?
desert oar
idle urchin
are u sure this top code is correct
no. i am a random person on the internet posting untested code. always review and test other people's code.
candid quarry
compact star
could u link the docs, if not could u also include how the stride changes it, al...
Aw, that's gorgeous code. I know you're not doing anything particularly fancy but still, hats off to you. Proper PEP 8 and some. Tip of the cap.
 eternal hare
I have a trained yolov7 onnx, how do I load it for real time inference
rugged comet
Is there something like pandas.dataframe.pop but for multiple columns at once?
Like
labels = df.pop_many(["W", "U", "B", "R", "G"])
So I guess there's no function that combines those steps? Thank you anyway.
rugged comet
Does it make sense to normalize binary features?
For example, I have a continuous numerical feature that goes from 0 to 16 or so. I also have a binary feature that can be 0 or 1 (obviously). I first concatenate them and then pass it through a Normalization layer. So my question is, does it make sense to concatenate these features before passing them through a Normalization layer?
Here's what is currently being done. convertedManaCost is the continuous feature and is_creature is the binary feature.
 compact star
candid quarry
Aw, that's gorgeous code. I know you're not doing anything particularly fancy bu...
compact star
candid quarry
Aw, that's gorgeous code. I know you're not doing anything particularly fancy bu...
thank you
cinder schooner
Greetings, I'm looking to extract some text information from a pdf. I need first to parse that pdf and extract the tables. I need to everytime that I find some particular expression in the document to extract the table that comes just after it. How can I do this?
 uneven mango
I am working on a voice assistant and want it to add number but voice recognizer outputs numbers like this
Is there any way to execute this example
Input = two thousand plus twenty
Output = 2020
 upbeat dagger
Hey guys!
Does anyone have a tool that they like to programmatically identify categorical vs continuous features in pandas?
serene scaffold
upbeat dagger
Hey guys!
Does anyone have a tool that they like to programmatically identify c...
You don't really need a tool for that.
Well, if you do, then you probably don't know enough about data science to make good decisions about how to use the data.
upbeat dagger
Let's pretend that I'm in the second bucket 😅 .
serene scaffold
That's okay. If you have some data to share, we can talk about what kind of feature each column is. After I make coffee
upbeat dagger
Thanks! So, I'm working with the spaceship titanic dataset from kaggle (https://www.kaggle.com/competitions/spaceship-titanic).
Identifying the column types manually is a cinch. I haven't documented my thoughts, so I don't have a table to share yet.
But as I'm working on imputing data into the null cells I'm realizing that a lot of this data can probably be reliably predicted from other fields.
 devout solstice
hi guys, so i'm working and also practice on a dataset and there is quite a lot of nan values on 1 feature and i decide to use .fillna() but its not all the missing values got filled, lets says the missing value is 1000 and when i use fillna there its become 500 not full, do you guys know why?
serene scaffold
upbeat dagger
Thanks! So, I'm working with the spaceship titanic dataset from kaggle (https:/...
PassengerId - A unique Id for each passenger. Each Id takes the form gggg_pp where gggg indicates a group the passenger is travelling with and pp is their number within the group. People in a group are often family members, but not always.
HomePlanet - The planet the passenger departed from, typically their planet of permanent residence.
CryoSleep - Indicates whether the passenger elected to be put into suspended animation for the duration of the voyage. Passengers in cryosleep are confined to their cabins.
Cabin - The cabin number where the passenger is staying. Takes the form deck/num/side, where side can be either P for Port or S for Starboard.
Destination - The planet the passenger will be debarking to.
Age - The age of the passenger.
VIP - Whether the passenger has paid for special VIP service during the voyage.
RoomService, FoodCourt, ShoppingMall, Spa, VRDeck - Amount the passenger has billed at each of the Spaceship Titanic's many luxury amenities.
Name - The first and last names of the passenger.
Transported - Whether the passenger was transported to another dimension. This is the target, the column you are trying to predict.
What type of feature is PassengerId and why? Just answer as best you can.
upbeat dagger
upbeat dagger
Thanks! So, I'm working with the spaceship titanic dataset from kaggle (https:/...
So want I want to do is write an imputer that is essentially a bunch of ML models that predict on the null values of each column. Most of the models that I want to use want categorical data to be encoded... but I would like for what I write to be useful for more than just this dataset.
My thinking is that if I can programmatically identify the type of data meant to be in a column, then I can automatically select a model that makes sense for that data. (classifiers for categorical, regressors for continuous)
serene scaffold
by the way, categorical and continuous aren't the only types of features.
upbeat dagger
serene scaffold
```
PassengerId - A unique Id for each passenger. Each Id takes the form gggg_pp...
IMO PassengerId is actually two features.
Group - I want to say is an ordinal categorical feature, because it is discretely limited by the number of rooms available on the ship and correlates linearly with the passenger's room number.
Number within group - Continuous.. theoretically you can have infinite people in the same group.
copper mica
how do researchers come up with new models?
like
do they study a previous model, look at deficiencies and improve upon it
come up with a wild application that no model addresses or start from mathematical abstractions
upbeat dagger
devout solstice
hi guys, so i'm working and also practice on a dataset and there is quite a lot ...
Hey Tenn. If you want to ping me in one of available help channels (eg. #help-burrito ) I am sure I can help you troubleshoot
serene scaffold
upbeat dagger
IMO PassengerId is actually two features.
**Group** - I want to say is an ordin...
That makes enough sense. Though the PassengerId feature isn't actually useful for ML, just for data management. What about CryoSleep?
upbeat dagger
Binary categorical
serene scaffold
What about HomePlanet and Destination?
upbeat dagger
Nominal categorical
serene scaffold
What about {RoomService, FoodCourt, ShoppingMall, Spa, VRDeck}?
devout solstice
upbeat dagger
Hey Tenn. If you want to ping me in one of available help channels (eg. <#69688...
thank you for your offer Crux i appreciate it, btw i decide to fill the rest of the missing value with fillna but with method parameter
upbeat dagger
serene scaffold
What about {RoomService, FoodCourt, ShoppingMall, Spa, VRDeck}?
All I know about them is that they are continuous. I'm not sure if there are further descriptors for continuous variables.
 formal lava
Hi, I got an error that module is not found, even tho 'gym' is part of stable_baselines3 module which I have installed. I tried installing/reinstalling modules, nothing works. Can anyone help me?```
ModuleNotFoundError Traceback (most recent call last)
Cell In [23], line 2
1 import os
----> 2 import gym
3 from stable_baselines3 import PPO
4 from stable_baselines3.common.vec_env import DummyVecEnv
ModuleNotFoundError: No module named 'gym'```
serene scaffold
upbeat dagger
All I know about them is that they are continuous. I'm not sure if there are fu...
seems like you know all this 
upbeat dagger
formal lava
Hi, I got an error that module is not found, even tho 'gym' is part of stable_ba...
You've tried pip install gym?
formal lava
upbeat dagger
You've tried `pip install gym`?
yup
upbeat dagger
Might be worth restarting your IDE entirely. I know with VScode it sometimes doesn't recognize that i've made a change to my environment. Also.. worth double checking that your IDE is using the correct environemnt.
serene scaffold
upbeat dagger
Might be worth restarting your IDE entirely. I know with VScode it sometimes do...
they're using a notebook. and restarting ones IDE won't solve any runtime errors. it would only solve issues with code completion and such.
upbeat dagger
serene scaffold
seems like you know all this <:bing_shrug:583791581497393162>
Yeah. Sorry if I was misleading earlier.. I guess I still feel a bit of imposter syndrome.
serene scaffold
formal lava
Hi, I got an error that module is not found, even tho 'gym' is part of stable_ba...
is gym a pypi package or what?
formal lava
serene scaffold
is gym a pypi package or what?
It is used for rl and part of openai
idk if I answered your question
serene scaffold
formal lava
It is used for rl and part of openai
!pypi gym
arctic wedgeBOT

Gym: A universal API for reinforcement learning environments
serene scaffold
okay, I guess that's it. so make a new notebook cell and do
!pip install gym
you need the !
formal lava
serene scaffold
okay, I guess that's it. so make a new notebook cell and do
`!pip install gym`
y...
Requirement already satisfied
serene scaffold
formal lava
Requirement already satisfied
okay, try restarting the kernel, and then make a cell that only has import gym, and run it
formal lava
serene scaffold
okay, try restarting the kernel, and then make a cell that only has `import gym`...
hmm
it fixed the no found error, but there is a new one
serene scaffold
tfw
formal lava
serene scaffold
tfw
nvm I was trying to connect to vsc
I didnt get any errors, psure everything is clean
thank you so much
serene scaffold

 hollow cloud
Hi everyone, I am new to this server and also new to programming and python in general. I have a question regarding Pandas module, how much math statistics is necessary to be able to use and understand any outcome ?
wooden sail
that's a difficult question to answer, cuz you can use pandas to do stuff all the way from intro to stats in school to phd
so, as much as you need to understand what you're working on. pandas is just a tool. what the data means depends on your domain expertise, and what you want to do with it is math. pandas is a tool to get there.
hollow cloud
Thanks Edd
 wheat snow
Hi there
this is a small piece of a df i have
i want to create a combobox (tkinter) that has every DAY of that
but rn, im not quite sure what the idea is to do this
im not looking for a solution
more like a little bit of starthelp
Start Time datetime64[ns, Europe/Berlin]

thats the current data type
lapis sequoia
don't really know if it's for this channel, but does anyone know how I can sort a list of objects based on one of the objects attributes? this needs to be done without using sort() or sorted()
wheat snow
lapis sequoia
don't really know if it's for this channel, but does anyone know how I can sort ...
Stack Overflow
I need to sort a list using python 3. There might be strings, integers, floats, or tuples, etc.
I am currently trying to make correct use of the sort function using the key parameter like this:
...
maybe this helps
oh wait
did i understand it wrong?
lapis sequoia
all of those solutions use either sort or sorted()
wheat snow
well, maybe u can use numpy?
lapis sequoia
my solution using sorted
 lapis sequoia
wheat snow
well, maybe u can use numpy?
lapis sequoia
wheat snow
well, maybe u can use numpy?
haven't really used numpy, I'll look into it
wheat snow
k
serene scaffold
lapis sequoia
my solution using sorted
any reason you're using a static method? even though they exist in Python, no one really uses them. the creator of the language even regrets adding them.
and it looks like the annotation for products and the return value should be list[Product], not list or list[object]
serene scaffold
wheat snow
well, maybe u can use numpy?
it looks like they're not actually doing data science
wheat snow
serene scaffold
it looks like they're not actually doing data science <:bing_shrug:5837915814973...
ik that for sure
@serene scaffold i like dat cat in ur banner
upbeat dagger
Hey. You guys know when you are deciding if a feature is categorical, discrete, or continuous.... Does that process have a name?
I thought it would be "feature classification".. but googling that just seems to take me to everywhere but that process.
Yep.. googling "Feature typing" took me to articles on the process
wooden sail
you might find it as an early topic in "data wrangling", perhaps
 odd meteor
upbeat dagger
Hey. You guys know when you are deciding if a feature is categorical, discrete,...
odd meteor
upbeat dagger
Hey. You guys know when you are deciding if a feature is categorical, discrete,...
Data Preprocessing?
lapis sequoia
serene scaffold
it looks like they're not actually doing data science <:bing_shrug:5837915814973...
data science is apart of my cyber security course in college, along with programming.
serene scaffold
lapis sequoia
data science is apart of my cyber security course in college, along with program...
sure, but just sorting a list of Python objects is not data science. if you wanted to sort an array or a dataframe, that would be data science.
lapis sequoia
couldn't find another channel where my problem would fit better
serene scaffold
lapis sequoia
couldn't find another channel where my problem would fit better
a general help channel ( #❓|how-to-get-help )
lapis sequoia
anyways I just realised I could use a normal sorting algorithm and compare the attributes there
 young granite
better ways to iterate rows in a df than using .iterrows?
serene scaffold
young granite
better ways to iterate rows in a df than using .iterrows?
what are you actually trying to do? because there are built-in methods for almost everything you'd want to do anyway that don't involve Python iteration.
young granite
serene scaffold
what are you actually trying to do? because there are built-in methods for almos...
summing up col values of certain rows
serene scaffold
young granite
summing up col values of certain rows
so you'd use a boolean indexer with .loc to pick the rows of interest, and then use the .sum method on that.
young granite
serene scaffold
so you'd use a boolean indexer with `.loc` to pick the rows of interest, and the...
df.append(df.sum(numeric_only=True), ignore_index=True) this should work also?
serene scaffold
young granite
```df.append(df.sum(numeric_only=True), ignore_index=True)``` this should work a...
df.append is deprecated. and it's outrageously inefficient to use in a loop.
can you do print(df.head().to_dict('list')) and put it in the chat as text?
young granite
its just a 200x42 df i want to add sum of each row as 43 col
serene scaffold
And everything is a number? And the names of each column are just 0, 1, 2, ...?
serene scaffold
does df_loc already exist?
young granite
serene scaffold
does `df_loc` already exist?
ye
serene scaffold
young granite
ye
so you just need to do df_loc["sum"] = df.sum(axis=1) to get the row-wise sums
whereas df.sum() would be column-wise
if there are rows you want to omit from the calculation, you'd have to say how you know which rows you want to omit.
young granite
serene scaffold
if there are rows you want to omit from the calculation, you'd have to say how y...
by .loc u mean?
serene scaffold
if you want to select only certain rows, you need a boolean condition that you can pass to loc, yes. but it's sounding like you actually wanted to include every row.
young granite
serene scaffold
if you want to select only certain rows, you need a boolean condition that you c...
yep i do
thank u
what is the "new" solution instead of .sum(), if sum is deprecated
serene scaffold
I never said that sum is deprecated--append is.
young granite
can you show the code that caused this error warning?
young granite
df = combined.loc[(combined["iteration"] == 1) & (combined["treatment"] == 0)]
df_loc = df.loc[:, 1: 42]
df_loc["sum"] = df.sum(axis=1)
df_loc```oh i see
🗿
its late im stupid
hahaha
serene scaffold
night night
young granite
🧠
 neon vessel
Guys, do i need knowledge of linear algebra to start with machine learning?
serene scaffold
neon vessel
Guys, do i need knowledge of linear algebra to start with machine learning?
Yep
And calculus
I usually use an IPython repl for that. but notebooks are fine for doing disposable stuff like that.
sly lake
Hey guys! A quick question:
Is it possible to enhance an MRI image using Image processing techniques?
serene scaffold
are they using tmux, at least?
.randomcase at least their fingers stay on the keyboard
strange elbowBOT
aT lEaSt THEiR fiNGERs stAY on THe kEYBOArD
serene scaffold
anyway, you can do python -m IPython --matplotlib, and if you make a plot, a window will pop up with that plot. unless you're SSHed
 fading crane
Hi guys, Im a software dev. I learned programming by doing a lot of exercises and self projects. Mostly interactive learning. Can the same be done for deep learning?
Or will I need to learn a lot of underlying theory
I mean I don't mind learning the theory, it's just hard to stay engaged by going through lectures or textbooks and taking notes. I'd like to actually apply them.
upbeat dagger
In my opinion... somewhere in between
fading crane
I do enjoy reading research papers though
serene scaffold
fading crane
Hi guys, Im a software dev. I learned programming by doing a lot of exercises an...
Not exactly. It can be helpful and motivating to create models that apply what you're learning, but deep learning libraries abstract away a lot of the theory that you need to understand to be able to make meaningful decisions.
fading crane
I'm mostly interested in signal processing
iron basalt
@serene scaffold May I recommend a resource for the question just asked that does cost money, but I am not sponsored?
fading crane
In particular images. (Not stable diffusion)
serene scaffold
iron basalt
<@253696366952316929> May I recommend a resource for the question just asked tha...
yes. we even have paid resources on our resources page.
fading crane
things i'm interested in are upscaling resolutions from old shows, frame interpolation, etc.
iron basalt
I recommend brilliant.org
serene scaffold
inb4 Squiggle is secretly the CEO of brilliant.org
iron basalt
It's interactive. So you may find it much less boring. It's also a very efficient way of learning the concepts. But know that nothing will beat the hard way of reading books for most in depth knowledge.
fading crane
Yeah like it's just insufferably boring going through a textbook and taking notes
What other resources were you guys going to recommend?
upbeat dagger
I might recommend doing some of the beginner kaggle competitions.
serene scaffold
!resources data science
arctic wedgeBOT
Resources
The Resources page on our website contains a list of hand-selected learning resources that we regularly recommend to both beginners and experts.
fading crane
iron basalt
It's interactive. So you may find it much less boring. It's also a very efficien...
I mean i don't mind reading books, i like reading
what i don't want to do is just have to read an entire textbook before i get to work on the stuff i am interested in
which i got the impression some people recommended to do
iron basalt
fading crane
which i got the impression some people recommended to do
If you are going through some statistics book, I recommend trying to mess around with a dataset while doing so. Apply whatever new ideas you just got from it.
serene scaffold
fading crane
what i don't want to do is just have to read an entire textbook before i get to ...
I mean, people study for years to do this kind of thing. but all the time spent building up to what you currently want to do doesn't have to be a joyless experience.
iron basalt
If you are going through a linear algebra book, solving problems with linear algebra such as recreational math problems or other applications can be done.
Which is pretty fun.
fading crane
i mean i've done linear algebra and calculus before
years ago, i'm not really worried about that stuff
iron basalt
But have you ever written programs that use it?
fading crane
kind of.
iron basalt
Do you have a "feel" for it?
fossil ivy
I could need help with the code for a graph I need for my research
serene scaffold
fossil ivy
I could need help with the code for a graph I need for my research
okay, go ahead and explain what the problem is. Though keep in mind that in data science/CS, "graph" is nodes and edges, and data visualizations are "plots".
fossil ivy
plots 😄
So for validation purposes, I want to compare the range of results in my simulation model with those found it extant literature. Because of a lack of data in my field there is no real other way to validate at the moment
I've tried box and whisker plots but that's not really the right approach, scouted the seaborn and pyplot gallery but couldn't find anything that seemed right. I basically want like "Flying boxplots" if you know what i mean.
I resorted to just using a seaborn boxplot, doing as follows:
import matplotlib.pyplot as plt
import seaborn as sns
import pandas as pd

def create_box_whisker(data):

    sns.barplot(x="Paper", y="Value", data=data, color="grey")
    plt.xlabel("Starting Month")
    plt.ylabel("Project Duration")
    plt.title(f"Decommissioning duration spread per month, Runs: 10")
    plt.xticks(rotation=45)

    plt.show()


if __name__ == "__main__":
    data = [["Model", 0.7],
            ["Model", 1.9],
            ["Topham & McMillan (2017)", 0.67],
            ["Topham & McMillan (2017)", 1.37],
            ["McAuliffe et al. (2019)", 0.34],
            ["McAuliffe et al. (2019)", 2.6],
            ["Adedipe & Shafiee (2021)", 1.0866]
            ]

    datadf = pd.DataFrame(data, columns=["Paper", "Value"])

    print(datadf)

    create_box_whisker(datadf)
Gives this plot, but I can't get the xlabels to be fully shown
 iron basalt
fading crane
kind of.
iron basalt
fading crane
kind of.
If you are ok with probability and statistics as well then I recommend trying to implement various ML/statistics algorithms from scratch, starting very simple. And a ML specific book, such as Bishop's Pattern Recognition and Machine Learning. And also for neural networks specifically, brilliant's course on it.
gaunt anvil
I've been looking at https://github.com/jaywalnut310/glow-tts to do speech synth
Is there any way to use a pretrained model and train on top of that?
upbeat dagger
Just to confirm. You are calling this a boxplot.. did you mean barplot?
Also, is your concern with how the data is represented.. or the prettiness of the labels?
fossil ivy
my bad
 atomic palm
ARIMA model prediction is linear
 fossil ivy
I indeed meant a barplot. My concern is both, I am (1) wondering if there is a better way to visualize this, because I could not find any examples that were suitable and I don't have too much knowledge, and (2) wondering how to get the xlabel to be fully shown. I have tried several things but they didn't work
atomic palm
what could be the reason?
upbeat dagger
fossil ivy
I indeed meant a barplot. My concern is both, I am (1) wondering if there is a b...
I struggle with making labels pretty in seaborn/matplotlib as well. The easiest thing I've found to do is use plt.figure(figsize=[x,y]) before I generate the plot.. where x and y are numbers represnting the width and height respectively.
For showing the range of values.. I feel like a boxplot, boxenplot, or violinplot might be your best bet.
fossil ivy
upbeat dagger
I struggle with making labels pretty in seaborn/matplotlib as well. The easiest...
is there a way of making the boxplots having an upper and lower bound? Instead of being filled completely from the x axis
upbeat dagger
fossil ivy
is there a way of making the boxplots having an upper and lower bound? Instead o...
not sure I understand. Can you show me what it's doing?
fossil ivy
but with boxplots I have the whiskers, I do not need them, I need the two values to represent the absolute upper and lower limit
like the area filled for an x tick
fossil ivy
upbeat dagger
not sure I understand. Can you show me what it's doing?
my bad.. is there a way of making the barplots having an upper and lower bound? Instead of being filled completely from the x axis
upbeat dagger
Not to my knowledge.
fossil ivy
okay
upbeat dagger
Try this
sns.barplot(x="Paper", y="Value", data=data, color="grey", showfliers=False, whis=False )
Yes but I want to visualize the absolute range which is two values, per paper
like the duration per megawatt found in the model of this paper is 0.8 days/MW to 1.7 days/MW
To position my model in the ranges of other papers
upbeat dagger
Would something like this work for you?
https://swdevnotes.com/python/2020/display-line-chart-range/
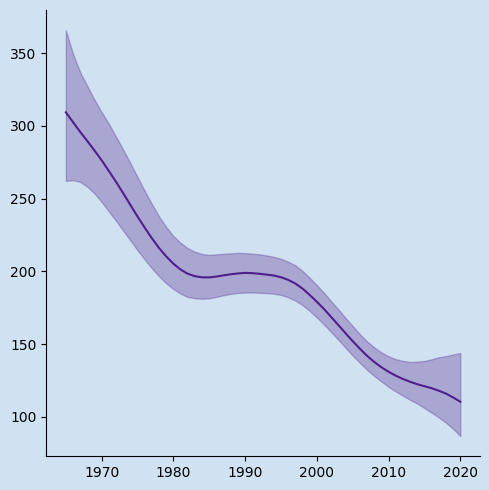
How to display a line chart in Matplotlib with a range
idle urchin
is there a way I can write this code faster like looping through it is too slow when I have like 500k rows and I feel like the code is too complicated for vectorization or using apply ```
row_index = 0
while row_index<len(Animals.index)-2:
current_animal = Animals.iat[row_index,20]
 while current_animal == Animals.iat[row_index,20]:
    row_index+=1
does anyone have any ideas
serene scaffold
idle urchin
is there a way I can write this code faster like looping through it is too slow ...
what is this supposed to tell you?
wheat snow
heyo
strong sedge
idle urchin
is there a way I can write this code faster like looping through it is too slow ...
ummm, if you just wanna do some computation, try using for instead of while
for loops are faster than while loops
try using numpy somehow
try numba (jit compilation library for python)
serene scaffold
strong sedge
ummm, if you just wanna do some computation, try using for instead of while
for...
for loops aren't faster than while loops.
wheat snow
df_vd= pd.read_csv('....')
#print(pd.isnull(df_vd))
#                     Time zones adjusting and datatype adjusting

df_vd['Start Time'] = pd.to_datetime(df_vd['Start Time'], utc=True)
df_vd = df_vd.set_index('Start Time')
df_vd.index = df_vd.index.tz_convert('Europe/Berlin')
df_vd= df_vd.reset_index()

df_vd['Dates'] = pd.to_datetime(df['Start Time']).dt.date
df_vd['Time'] = pd.to_datetime(df['Start Time']).dt.time
print(df_vd.head())
im gettin a lil errormessage here....
df_vd['Dates'] = pd.to_datetime(df['Start Time']).dt.date
NameError: name 'df' is not defined
``` they are the 2 lines with DATES and TIMEi wanted to create new columns
idle urchin
serene scaffold
what is this supposed to tell you?
it's related to my code because how I move through the dataframe changes based on a condition
wheat snow
or more specificly, i wanted to split the datetime into DATE and TIME
strong sedge
serene scaffold
for loops aren't faster than while loops.
data science, machine learning aside,
in python
for loops are faster than while
serene scaffold
strong sedge
data science, machine learning aside,
in python
for loops are faster than while
sorry, but this is just blatant misinformation.
strong sedge
I forgot by how much, but its significant enough
strong sedge
serene scaffold
sorry, but this is just blatant misinformation.
test it lmao
wheat snow
C faster than python either way...
idle urchin
strong sedge
ummm, if you just wanna do some computation, try using for instead of while
for...
how do I use a for loop if the index is changing inside the code
and how would I use numpy there to make it faster
cause the thing is even for loops will make it slow
strong sedge
idle urchin
how do I use a for loop if the index is changing inside the code
for your problem, ill actually suggest to take a look at numba