#data-science-and-ml
1 messages · Page 26 of 1
 desert oar
you can't rely on your domain knowledge, you have to rely entirely on your exploratory data analysis skills
 weary crown
😦
weary crown
Traceback (most recent call last):
  File "C:\Users\josmo\PycharmProjects\FraudDetection\venv\lib\site-packages\sklearn\base.py", line 377, in _check_n_features
    n_features = _num_features(X)
  File "C:\Users\josmo\PycharmProjects\FraudDetection\venv\lib\site-packages\sklearn\utils\validation.py", line 291, in _num_features
    raise TypeError(message)
TypeError: Unable to find the number of features from X of type pandas.core.series.Series with shape (56962,)

The above exception was the direct cause of the following exception:

Traceback (most recent call last):
  File "C:\Users\josmo\PycharmProjects\FraudDetection\main.py", line 27, in <module>
    pred = pipeline.predict(y_test)
  File "C:\Users\josmo\PycharmProjects\FraudDetection\venv\lib\site-packages\sklearn\pipeline.py", line 457, in predict
    Xt = transform.transform(Xt)
  File "C:\Users\josmo\PycharmProjects\FraudDetection\venv\lib\site-packages\sklearn\compose\_column_transformer.py", line 761, in transform
    self._check_n_features(X, reset=False)
  File "C:\Users\josmo\PycharmProjects\FraudDetection\venv\lib\site-packages\sklearn\base.py", line 380, in _check_n_features
    raise ValueError(
ValueError: X does not contain any features, but ColumnTransformer is expecting 30 features```import pandas as pd
from sklearn.compose import ColumnTransformer
from sklearn.pipeline import make_pipeline
from sklearn.preprocessing import MinMaxScaler
from sklearn.tree import DecisionTreeRegressor
from sklearn.model_selection import train_test_split
from math import sqrt
from sklearn.metrics import mean_squared_error
from sklearn.model_selection import cross_val_score
import pickle
data = pd.read_csv(r"C:\Users\josmo\Downloads\creditcard.csv")
target = data.pop('Class')
scaler = MinMaxScaler(feature_range=(-1, 1))
scaler_columnwise = ColumnTransformer([], remainder=scaler)
tree_reg = DecisionTreeRegressor()
pipeline = make_pipeline(scaler_columnwise, tree_reg)
x_train, x_test, y_train, y_test = train_test_split(
data, target, test_size=0.2, random_state=42
)
pipeline.fit(x_train, y_train)
# Testing
pred = pipeline.predict(y_test)
# RMSE evaluation
lin_mse = sqrt(mean_squared_error(y_test, pred))
print(f"Loss: {lin_mse}")
# Cross Validation
scores = cross_val_score(tree_reg, x_train, x_test, scoring="neg_mean_squared_error", cv=10)
tree_rmse_scores = sqrt(-scores)
# Display Cross Validation results
def display_scores(scores):
print(f"Scores: {scores}\nMean: {scores.mean()}\nStandard Deviation: {scores.std()}")
filename = 'model.pkl'
pickle.dump(pipeline, open(filename, 'wb'))```HOWWWWWW
weary crown
@desert oar what did i mess up this time... 😦
 storm kelp
@weary crown have you read the traceback?
TypeError: Unable to find the number of features from X of type pandas.core.series.Series with shape (56962,)
weary crown
storm kelp
`TypeError: Unable to find the number of features from X of type pandas.core.ser...
yeah but ive nveer gotten thta error and idk what it means
how can it not find number of features??
 mortal dove
Well, you're trying to predict your y values.
pred = pipeline.predict(y_test) should be pred = pipeline.predict(x_test)
mortal dove
weary crown
how can it not find number of features??
Not finding any features since you're passing a single column of data
weary crown
mortal dove
Well, you're trying to predict your y values.
`pred = pipeline.predict(y_test)` ...
shit im stupid
changed the variable names and got confused
storm kelp
weary crown
how can it not find number of features??
These are the questions you need to ask yourself if you want to start figuring out errors for yourself
weary crown
okie my model works after fixing a couple more stupid errors
i hate refactoring variables and forgetting to change them in other places but using ctrl f to replace them often messes up other stufff
storm kelp
weary crown
i hate refactoring variables and forgetting to change them in other places but u...
This is why ideally you wrap stuff up into functions. That way you won't have to keep track of dozens of intermediate variables/dfs
(I say whilst knowing I don't create functions nearly enough myself)

 young granite
 graceful glacier
!e
import pandas as pd
df = pd.DataFrame({'day': ['1', '1',
'2', '3'],
'kwh': [2.8, 3.2, 6.4, 8.4]})
df.info()``` arctic wedgeBOT
@young granite :white_check_mark: Your 3.11 eval job has completed with return code 0.
001 | <class 'pandas.core.frame.DataFrame'>
002 | RangeIndex: 4 entries, 0 to 3
003 | Data columns (total 2 columns):
004 |  #   Column  Non-Null Count  Dtype
005 | ---  ------  --------------  -----
006 |  0   day     4 non-null      object
007 |  1   kwh     4 non-null      float64
008 | dtypes: float64(1), object(1)
009 | memory usage: 192.0+ bytes
right but can i print out just the column name and col dtype out as a table?
young granite

Stack Overflow
How can I print a pandas dataframe as a nice text-based table, like the following?
+------------+---------+-------------+
| column_one | col_two | column_3 |
+------------+---------+-----------...
google it 🗿
young granite
but u dont get it to work?
graceful glacier
just need to now find out how to turn the df.dtypes command into a table
young granite
it would be better if u post ur code then next time so we can directly help
graceful glacier
sure
young granite
i did not use tabulate myself but it seems u can just give inputs therefore u can simply give dtype as a col
Stack Overflow
I would like to print NumPy tabular array data, so that it looks nice. R and database consoles seem to demonstrate good abilities to do this. However, NumPy's built-in printing of tabular arrays lo...
arctic wedgeBOT
Hey @graceful glacier!
You either uploaded a .txt file or entered a message that was too long. Please use our paste bin instead.
graceful glacier
young granite
thats not code thats data
 bold timber
Hello guys, where we can start to run fine-tune the model (model that leverages pretreined model)? the best score of epochs or the last epochs from the previous model?
 simple fossil
Hello. Any idea how to vectorize the cosine similarity function applied to the pandas dataset? Each row of the dataset is the tensor representation of an image.
Here is the function that I'm currently using, but it's pretty slow to apply to the entire dataset.
def findCosineDistance(source_representation, test_representation):
    a = np.matmul(np.transpose(source_representation), test_representation)
    b = np.sum(np.multiply(source_representation, source_representation))
    c = np.sum(np.multiply(test_representation, test_representation))
return 1 - (a / (np.sqrt(b) * np.sqrt(c)))```This is how I use it.
# Calculate distance
representations["distance"] = representations.apply(
lambda row: findCosineDistance(row["representation"], target_representation),
axis=1)``` tidal bough
so it's basically
def findCosineDistance(source_representation, test_representation):
    a = source_representation.T @ test_representation
    b = (source_representation*source_representation).sum() # maybe np.linalg.norm(source_representation,"sqeuclidean") is a bit faster, but probably not
    c = (test_representation*test_representation).sum()
    return 1 - (a / (np.sqrt(b) * np.sqrt(c)))
? that does seem vectorizable
actually, you know what, there's already a function for that, https://docs.scipy.org/doc/scipy/reference/generated/scipy.spatial.distance.cosine.html. Make sure it produces the same results as yours, and if so, try using it instead for some speedup.
as for a vectorized solution, hmm
tidal bough
tidal bough
as for a vectorized solution, hmm
def cosine_distance_vect(first,second):
    # first is (N,n), second is (N,n), return is (N,)
    N,n = first.shape
    assert N,n == second.shape
    As = first[:,None,1] @ second[:,:,None] # (N,1,n)@(N,n,1) produces (N,1,1)
    Bs = (first*first).sum(axis=1) # (N,)
    Cs = (second*second).sum(axis=1) # (N,)
    return 1 - (As.reshape(-1) / (np.sqrt(Bs) * np.sqrt(Cs)))
should work I think
 karmic valley
Hi, I am new to stats. I have 3 groups - each group consists of people who had a a different procedure technique. I want to compare each group in terms of outcomes such as survival, heart attack and pain. I'm not sure what tests to use?
 pseudo basin
karmic valley
Hi, I am new to stats. I have 3 groups - each group consists of people who had a...
pseudo basin
karmic valley
Hi, I am new to stats. I have 3 groups - each group consists of people who had a...
compare? you mean how far from the mean ?
karmic valley
pseudo basin
compare? you mean how far from the mean ?
So to explain better, let's say group 1 who had procedure type 1 had a mean of 5 heart attacks. And group 2 who had procedure type 2 had 3 heart attacks. And group 3 who had procedure 3 had 7 heart attacks. So I wanted to compare the groups and show if there is a statistical difference in number of heart attacks between groups with p value
pseudo basin
karmic valley
So to explain better, let's say group 1 who had procedure type 1 had a mean of 5...
I'm still a master student but from what I can do is that I'd plot the 3 gaussian in one figure. And compare the mean and how spread-out it is
karmic valley
pseudo basin
I'm still a master student but from what I can do is that I'd plot the 3 gaussia...
What statistical test should I do to compare mean. Like one way ANOVA or some post hoc test or some some ones
 wooden sail
how about something like a t-test or modified t-test to check whether two samples have the same mean?
though for more than 2 samples at the same time, i do seem to recall anova being used
karmic valley
wooden sail
though for more than 2 samples at the same time, i do seem to recall anova being...
Ah okay yeah potentially ANOVA then. When I read scientific papers they always write about special models and special analyses being done thats why I get confused
Is odds ratio used to compare samples or is that something completely different
wooden sail
i think that's for independence between events, but don't take my word for it
karmic valley
Ah okay yeah so confusing stats
young granite
@desert oar thanks
 neon vessel
Guys, which framework do you use for machine learning keras, tensorflow or pytorch?
 serene scaffold
neon vessel
Guys, which framework do you use for machine learning keras, tensorflow or pytor...
serene scaffold
neon vessel
Guys, which framework do you use for machine learning keras, tensorflow or pytor...
pytorch
 cedar sky
Hey, I have been trying to get a pose estimation model like posenet or video classifier like movinet into a raspberry device. Which is the cheapest device that allows this?
And is there a way to connect a wireless camera to raspberry pi?
 eternal hare
So i have a torch.nn model that I originally used for image classification
and I want to use it for a school project for object detection
But imma be honest, I don't know what to do with the outputs
Do I have like one output for each pixel?
serene scaffold
what classes does the image classifier classify?
eternal hare
it was for FER2013
serene scaffold
idk what that is
serene scaffold
I see. what objects do you want to detect?
serene scaffold
I don't think there's any way you could use a facial expression classifier for that.
eternal hare
just the plates themselves
the main thing im confused about
is
i guess for an object detection model of any form
what do i have it outpute
Like for my object detection, I had 7 outputs for seven classes, and the prediction was the most activated output
So for an object classification model, would I have one output for every pixel
and take the 4 most activated outputs?
I'm fairly new to machine learning so im kinda just banging rocks together
 hasty mountain
eternal hare
I'm fairly new to machine learning so im kinda just banging rocks together
hasty mountain
eternal hare
I'm fairly new to machine learning so im kinda just banging rocks together
Try taking a look at U-Net. It tries to classify each pixel in a given image.
And at concepts like image segmentation, pixel segmentation and instance segmentation
You'll probably have to create masks for those images. There are some websites that can help you. Maybe NVidia's MONAI can also help with that.
Thresholding can also help, which can be done with OpenCV and Scikit-image
simple fossil
tidal bough
actually, you know what, there's already a function for that, <https://docs.scip...
I've used that function, and the speed increased from 70 seconds to 38 seconds which is really great. I've also tried to use your custom function, but I couldn't make it work. I get an error AttributeError: 'list' object has no attribute 'shape', and when I try to convert target and row tensor into numpy array, I got the following error ValueError: not enough values to unpack (expected 2, got 1). I guess the input to the function should be tensors instead of the list, but I don't know how to convert it. Thank you for your help.
Any ideas on how can I broadcast the list of floats to each row in the pandas dataset? I would like to store the list for each row but I keep getting an error ValueError: Length of values (2622) does not match length of index (2040)
 odd meteor
neon vessel
Guys, which framework do you use for machine learning keras, tensorflow or pytor...
odd meteor
neon vessel
Guys, which framework do you use for machine learning keras, tensorflow or pytor...
TensorFlow. I'm learning PyTorch currently
serene scaffold
simple fossil
I've used that function, and the speed increased from 70 seconds to 38 seconds w...
looks like you're using a (python) list instead of an array or a tensor.
and when I try to convert target and row tensor into numpy array
this shouldn't be necessary. arrays and tensors are pretty much the same.
if you have a list, it should be as easy as torch.Tensor(your_list).
simple fossil
serene scaffold
looks like you're using a (python) list instead of an array or a tensor.
Yeah, the target representation is a python list same as a row representation.
serene scaffold
simple fossil
Yeah, the target representation is a python list same as a row representation.
why do you want it as a python list?
simple fossil
I load them from a pickle file, and those values are stored as a python list.
I found this code which works py representations.insert( len(representations.columns), "target_representation", [target_representation * 1] * len(representations), ) but now I have an error with np.matmul function that shows this error TypeError: can't multiply sequence by non-int of type 'list'
serene scaffold
What is target representation
simple fossil
python list of floats [0.0003780281404033303, 0.0003849821223411709, 0.0003820279671344906, ...]
serene scaffold
What is * 1 intended to do to that
simple fossil
Sorry, that shouldn't be there. It should be py representations.insert( len(representations.columns), "target_representation", [target_representation] * len(representations), ) that's just a copy-paste error.
serene scaffold
@simple fossil I'd have to see the whole traceback to guess what the problem is
!traceback
arctic wedgeBOT
Please provide the full traceback for your exception in order to help us identify your issue.
While the last line of the error message tells us what kind of error you got,
the full traceback will tell us which line, and other critical information to solve your problem.
Please avoid screenshots so we can copy and paste parts of the message.
A full traceback could look like:
Traceback (most recent call last):
  File "my_file.py", line 5, in <module>
    add_three("6")
  File "my_file.py", line 2, in add_three
    a = num + 3
TypeError: can only concatenate str (not "int") to str
If the traceback is long, use our pastebin.
simple fossil
Traceback (most recent call last):
  File "D:\AI\website\api\vectorize.py", line 117, in <module>
    calculate_distance_vectorize(target_rep, representations)
  File "D:\AI\website\api\vectorize.py", line 68, in calculate_distance_vectorize
    representations["a"] = np.matmul(
  File "C:\Users\Martin\python\py-version\python-3.10\lib\site-packages\pandas\core\generic.py", line 2112, in __array_ufunc__
    return arraylike.array_ufunc(self, ufunc, method, *inputs, **kwargs)
  File "C:\Users\Martin\python\py-version\python-3.10\lib\site-packages\pandas\core\arraylike.py", line 266, in array_ufunc
    result = maybe_dispatch_ufunc_to_dunder_op(self, ufunc, method, *inputs, **kwargs)
  File "pandas\_libs\ops_dispatch.pyx", line 107, in pandas._libs.ops_dispatch.maybe_dispatch_ufunc_to_dunder_op
  File "C:\Users\Martin\python\py-version\python-3.10\lib\site-packages\pandas\core\series.py", line 3038, in __matmul__
    return self.dot(other)
  File "C:\Users\Martin\python\py-version\python-3.10\lib\site-packages\pandas\core\series.py", line 3028, in dot
    return np.dot(lvals, rvals)
  File "<__array_function__ internals>", line 180, in dot
TypeError: can't multiply sequence by non-int of type 'list'```This is the code ```py
inert target_representation into dataframe to each row
representations.insert(
    len(representations.columns),
    "target_representation",
    [target_representation] * len(representations),
)

# transpose source_representation
representations["source_representation_transpose"] = np.transpose(
    representations["VGG-Face_representation"]
)

# matmul source_representation_transpose and target_representation (this line causes the error)
representations["a"] = np.matmul(
    representations["source_representation_transpose"],
    representations["target_representation"],
)```
instead of last line I've tried to do this py representations["a"] = np.matmul( representations["source_representation_transpose"].to_list(), representations["target_representation"].to_list(), )
but then I have this error py Traceback (most recent call last): File "D:\AI\website\api\vectorize.py", line 117, in <module> calculate_distance_vectorize(target_rep, representations) File "D:\AI\website\api\vectorize.py", line 68, in calculate_distance_vectorize representations["a"] = np.matmul( ValueError: matmul: Input operand 1 has a mismatch in its core dimension 0, with gufunc signature (n?,k),(k,m?)->(n?,m?) (size 2040 is different from 2622)
serene scaffold
@simple fossil this means that the error was caused by code that you hadn't shown before I asked for the traceback.
Do you understand what the rules are for matrix multiplication?
also, is representations a DataFrame, or a dict?
simple fossil
@serene scaffold Yeah, sorry. I should make it more clear. I did the matrix multiplications before. The representations are pandas Dataframe loaded from a pickle file. ```py
f = pd.read_pickle(f"datasets/representations.pkl")
representations = pd.DataFrame(f, columns=["identity", "VGG-Face_representation"])
@serene scaffold Thanks for your help. I'm probably just trying to optimize something that is already optimized anyway. I don't think I can make it faster by doing those numpy functions separately. I think that the best solution is the one suggested by @tidal bough using scipy function.
 digital folio
Best resource used to find AI -Datascience trends and apps
 solar yew
Maybe not the right place to ask, but does anyone have advice on my NLP project? Eager to see what people think cause I'm largely self-taught and would be very grateful for some feedback. Built an amazon fake review classifier
GitHub
Contribute to CSomers3/unmasking_amazon_reviews development by creating an account on GitHub.
 blazing viper
this is a very broad question but is it possible for an artificial neural network to change its own amount of neurons & hidden layers
simple fossil
@blazing viper I was thinking about the same thing for a while. It would be interesting (if possible) to change the number of neurons and layers, but I don't think that it would be possible with the backpropagation method. You can decrease the number of neurons during training by using dropout, but that's not the same.
blazing viper
I’m asking this under the assumption that some neurons can be useless or near useless, or even harming the effectiveness of a network
This seems viable
Especially in a genetic algorithm, which is what I’d be using
How would you determine the effectiveness of each neuron though?
simple fossil
There is a great youtube video that I watched recently which explains this process in detail https://www.youtube.com/watch?v=q8SA3rM6ckI
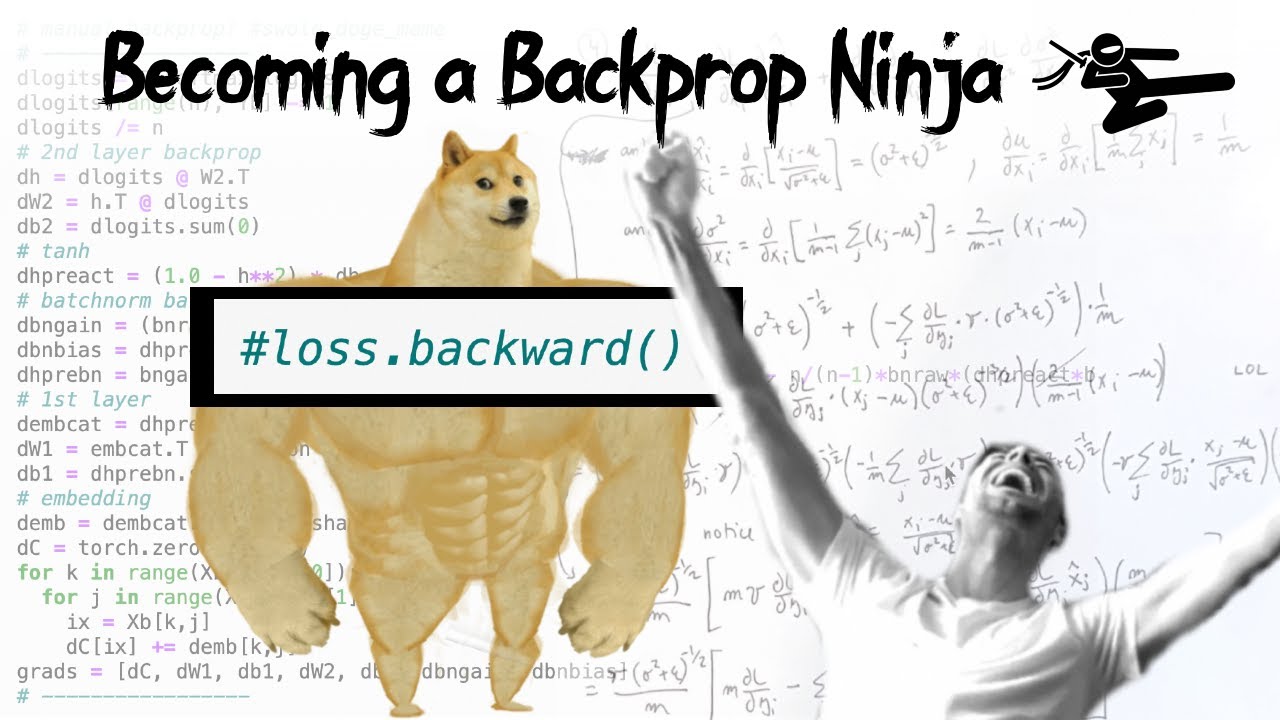
We take the 2-layer MLP (with BatchNorm) from the previous video and backpropagate through it manually without using PyTorch autograd's loss.backward(): through the cross entropy loss, 2nd linear layer, tanh, batchnorm, 1st linear layer, and the embedding table. Along the way, we get a strong intuitive understanding about how gradients flow back...
I would recommend watching all of his videos. It's an amazing resource.
blazing viper
Alright, thanks, although I’m using a genetic algorithm for my current project
The parameters and complexity of the actual network is going to be pretty big, meaning it’s gonna require a lot of processing power
Hence my search for optimization
Or, self-optimization in this case
desert oar
karmic valley
Is odds ratio used to compare samples or is that something completely different
in general, an odds ratio is a succinct way to describe a relative difference in probabilities. it's just a ratio between two odds. it's not necessarily some thing you would want to use all the time, but it comes up naturally in the context of logistic regression and categorical data analysis
 dense lagoon
can i pick someones brain about a AI im training
 austere swift
sure just ask your questions here
serene scaffold
dense lagoon
can i pick someones brain about a AI im training
be sure to always ask a complete question in your first message. people don't want to interview you before they have enough information to start helping--they want an answerable question to be right there when they glance at this channel.
dense lagoon
its more something like id wanna have a conversation about in VC
 plain drift
still should be more specific
serene scaffold
dense lagoon
its more something like id wanna have a conversation about in VC
you're not likely to get any takers. I would encourage you to be as detailed as you can in one paragraph.
dense lagoon
Its okay I got it handled now, someone is helping me
 sand flume
Hi, could anyone help me with some pointers towards the right scipy functions please? I'm needing to find the minima of a black-box function. The problem I have is that all the algorithms I can see are looking for one minimum, and returning this. I need to return a list of several minima of this function within a given range - i.e. the list of local minima encountered. I was presuming there would be some option somewhere to enable this behaviour, but I'm struggling to see one, and don't think I should fall back to trying to evaluate things manually. Can anyone point me towards what I might be missing please? Thanks
 rugged comet
Traceback (most recent call last):
  File "c:\Users\urkch\AppData\Local\Programs\Python\Python_Projects\MtG ML\main.py", line 146, in <module>
    history = model.fit(x_train,
  File "C:\Users\urkch\miniconda3\envs\tf\lib\site-packages\keras\utils\traceback_utils.py", line 70, in error_handler
    raise e.with_traceback(filtered_tb) from None
  File "C:\Users\urkch\miniconda3\envs\tf\lib\site-packages\tensorflow\python\framework\constant_op.py", line 102, in convert_to_eager_tensor
    return ops.EagerTensor(value, ctx.device_name, dtype)
ValueError: Failed to convert a NumPy array to a Tensor (Unsupported object type float).
Is this usually a sign that something is wrong with my input data? I thought the inputs were supposed to be floats.
 past prawn
So I have a dataset with 100,000 entries but there are a few extreme values in some of the cells. How would I visualize that? I tried a histogram, but the extreme values are invisible
 rugged comet
 last peak
see type of all parameters to model.fit(param1,param2,...)
last peak
see type of all parameters to model.fit(param1,param2,...)
I figured it was because I didn't vectorize the test text data.
x_test_text = text_vectorizer(np.asarray(x_test_text))
This seems to be an issue in itself though.
Traceback (most recent call last):
  File "c:\Users\urkch\AppData\Local\Programs\Python\Python_Projects\MtG ML\main.py", line 55, in <module>
    x_test_text = text_vectorizer(np.asarray(x_test_text))
  File "C:\Users\urkch\miniconda3\envs\tf\lib\site-packages\keras\utils\traceback_utils.py", line 70, in error_handler
    raise e.with_traceback(filtered_tb) from None
  File "C:\Users\urkch\miniconda3\envs\tf\lib\site-packages\tensorflow\python\framework\constant_op.py", line 102, in convert_to_eager_tensor
    return ops.EagerTensor(value, ctx.device_name, dtype)
ValueError: Failed to convert a NumPy array to a Tensor (Unsupported object type float).
I'm very confused about why it works for the train data though.
x_train_text = text_vectorizer(np.asarray(x_train_text))
Do I need to create separate tf.keras.layers.TextVectorization layers for both the train data and the test data? I wouldn't think so.
 nimble laurel
So, I'm doing a weird project where I have a folder with 9,700 images, the image file names are used to sort them, and I have to count the sortings (how many have a 1 in the [0] place, a 2? A 25 in the [3] place? and so on)
I've been told I'll be using Groupby for this....
last peak
x_train_text = text_vectorizer(np.asarray(x_train_text).astype('float32'))
what if you try that
rugged comet
    x_test_text = text_vectorizer(np.asarray(x_test_text).astype("float32"))
ValueError: could not convert string to float: 'Destroy all creatures with converted mana cost 3 or less.'
Yeah that doesn't work. Thanks for the suggestion. I was under the impression that tf.keras.layers.TextVectorization was supposed to take strings such as this.
last peak
What is the type of this :
type(text_vectorizer(np.asarray(x_test_text)))
how about turning that into float32 after it creates numbers out of your text
text_vectorizer(np.asarray(x_test_text)).astype('float32')
will work if its a numpy array type
rugged comet
print(type(text_vectorizer(np.asarray(x_test_text))))
Traceback (most recent call last):
  File "c:\Users\urkch\AppData\Local\Programs\Python\Python_Projects\MtG ML\main.py", line 55, in <module>
    print(type(text_vectorizer(np.asarray(x_test_text))))
  File "C:\Users\urkch\miniconda3\envs\tf\lib\site-packages\keras\utils\traceback_utils.py", line 70, in error_handler
    raise e.with_traceback(filtered_tb) from None
  File "C:\Users\urkch\miniconda3\envs\tf\lib\site-packages\tensorflow\python\framework\constant_op.py", line 102, in convert_to_eager_tensor
    return ops.EagerTensor(value, ctx.device_name, dtype)
ValueError: Failed to convert a NumPy array to a Tensor (Unsupported object type float).
Same issue. text_vectorizer doesn't like its argument np.asarray(x_test_text). We can't even print the type of what it returns because that line itself causes the error.
last peak
hmm okay lets go step by step here
text_vec_input = np.asarray(x_test_text)
print(type(text_vec_input))
print(text_vec_input.dtypes)
text_vectorizer(np.asarray(text_vec_input))
can you also tell me what is this text_vectorizer object type
is it tf.keras.layers.TextVectorization(...)
rugged comet
last peak
is it tf.keras.layers.TextVectorization(...)
text_vectorizer = layers.TextVectorization()
print(type(text_vectorizer))
<class 'keras.layers.preprocessing.text_vectorization.TextVectorization'>
print(type(text_vec_input))
print(text_vec_input.dtypes)
print(type(text_vectorizer(text_vec_input)))
Traceback (most recent call last):
  File "c:\Users\urkch\AppData\Local\Programs\Python\Python_Projects\MtG ML\main.py", line 58, in <module>
    print(text_vec_input.dtypes)
AttributeError: 'numpy.ndarray' object has no attribute 'dtypes'
.dtype maybe?
last peak
yes
rugged comet
print(text_vec_input.dtype)
object
I think it says object because it's an array of strings.
last peak
so its just 1,n strings
rugged comet
last peak
so its just 1,n strings
print(text_vec_input.shape)
(6143,)
print(text_vectorizer(text_vec_input))
rugged comet
last peak
print(text_vectorizer(text_vec_input))
print(text_vectorizer(text_vec_input))
Traceback (most recent call last):
  File "c:\Users\urkch\AppData\Local\Programs\Python\Python_Projects\MtG ML\main.py", line 56, in <module>
    print(text_vectorizer(text_vec_input))
  File "C:\Users\urkch\miniconda3\envs\tf\lib\site-packages\keras\utils\traceback_utils.py", line 70, in error_handler
    raise e.with_traceback(filtered_tb) from None
  File "C:\Users\urkch\miniconda3\envs\tf\lib\site-packages\tensorflow\python\framework\constant_op.py", line 102, in convert_to_eager_tensor
    return ops.EagerTensor(value, ctx.device_name, dtype)
ValueError: Failed to convert a NumPy array to a Tensor (Unsupported object type float).
Does its shape give you any indication that something is wrong with its shape?
last peak
well no, id think this function should be able to take numpy array
if you think so you can explicilty make it (6143,1)
.reshape(,1) i think
rugged comet
last peak
.reshape(,1) i think
Not quite the right syntax. I'm also looking up what it is.
last peak
you always have the option of writing your own vectorizer function as another resort
you just want every one of those words to be a number right
rugged comet
Yeah. But I really can't figure out why it worked for the training data but not the test data.
I'm going to see if I need to make a new vectorizer for the test data.
last peak
ah okay
rugged comet
test_text_vectorizer = layers.TextVectorization()
test_text_vectorizer.adapt(np.asarray(x_test_text))
Traceback (most recent call last):
  File "c:\Users\urkch\AppData\Local\Programs\Python\Python_Projects\MtG ML\main.py", line 57, in <module>
    test_text_vectorizer.adapt(np.asarray(x_test_text))
...
ValueError: Failed to convert a NumPy array to a Tensor (Unsupported object type float).
I can't even adapt the text vectorization layer to the test data.
last peak
instead of trying to convert, what if you juts add that as a layer
and do model.fit directly on the numpy array
rugged comet
last peak
instead of trying to convert, what if you juts add that as a layer
I could try that. They do mention in the docs that it's better done outside of the model though.
https://www.tensorflow.org/guide/keras/preprocessing_layers#preprocessing_data_before_the_model_or_inside_the_model
Like I put my Normalization in the model but the text vectorization outside the model.
last peak
text_dataset = tf.data.Dataset.from_tensor_slices(x_test_text) how about this as input instead of the numpy array then
is it possible to make a keras tensor out of strings only
tf.tensor(['asdasd','asda','asdasd'])
tf.Tensor([b'Gray wolf' b'Quick brown fox' b'Lazy dog'], shape=(3,), dtype=string)
how about that...
so take your text_data
tf.Tensor([b'..' b'..' ], shape = (len(text_data), dtype=string)
rugged comet
Looks like I have three new options to try.
- Vectorize the text within the model.
- Use tf.data.Dataset
- Convert numpy array into tensor
I'll try option 3 first.
rugged comet
last peak
how about that...
so take your text_data
tf.Tensor([b'..' b'..' ], shape = (len(...
Looks like the args are a bit different.
 last peak
import numpy as np
def my_func(arg):
arg = tf.convert_to_tensor(arg, dtype=tf.float32)
return arg
The following calls are equivalent.
value_1 = my_func(tf.constant([[1.0, 2.0], [3.0, 4.0]]))
print(value_1)
value_2 = my_func([[1.0, 2.0], [3.0, 4.0]])
print(value_2)
value_3 = my_func(np.array([[1.0, 2.0], [3.0, 4.0]], dtype=np.float32))
print(value_3)
they got this on their documentation, maybe you can pass string lists too
rugged comet
I'll try.
last peak
If you have three string tensors of different lengths, this is OK.
tensor_of_strings = tf.constant(["Gray wolf",
"Quick brown fox",
"Lazy dog"])
Note that the shape is (3,). The string length is not included.
print(tensor_of_strings)
oh this one looks simplest
rugged comet
last peak
they got this on their documentation, maybe you can pass string lists too
x_test_text = tf.convert_to_tensor(x_test_text, dtype=tf.string)
Traceback (most recent call last):
  File "c:\Users\urkch\AppData\Local\Programs\Python\Python_Projects\MtG ML\main.py", line 55, in <module>
    x_test_text = tf.convert_to_tensor(x_test_text, dtype=tf.string)
  File "C:\Users\urkch\miniconda3\envs\tf\lib\site-packages\tensorflow\python\util\traceback_utils.py", line 153, in error_handler
    raise e.with_traceback(filtered_tb) from None
  File "C:\Users\urkch\miniconda3\envs\tf\lib\site-packages\tensorflow\python\framework\constant_op.py", line 102, in convert_to_eager_tensor
    return ops.EagerTensor(value, ctx.device_name, dtype)
ValueError: Failed to convert a NumPy array to a Tensor (Unsupported object type float).
Same issue as before lol.
rugged comet
last peak
# If you have three string tensors of different lengths, this is OK.
tensor_of_s...
I'll try this too.
x_test_text = tf.constant(x_test_text)
Traceback (most recent call last):
  File "c:\Users\urkch\AppData\Local\Programs\Python\Python_Projects\MtG ML\main.py", line 55, in <module>
    x_test_text = tf.constant(x_test_text)
...
ValueError: Failed to convert a NumPy array to a Tensor (Unsupported object type float).
Still the same thing.
rugged comet
last peak
what the heck is type of x_test_text
print(type(x_test_text))
<class 'pandas.core.series.Series'>
tf.constant(list(x_test_text.values))
rugged comet
x_test_text = tf.constant(list(x_test_text.values))
Traceback (most recent call last):
  File "c:\Users\urkch\AppData\Local\Programs\Python\Python_Projects\MtG ML\main.py", line 55, in <module>
    x_test_text = tf.constant(list(x_test_text.values))
...
    return ops.EagerTensor(value, ctx.device_name, dtype)
ValueError: Can't convert Python sequence with mixed types to Tensor.
Now we're getting somewhere.
last peak
do:
tf.constant([str(i) for i in list(x_test_text.values)])
rugged comet
for x in list(x_test_text.values):
    if type(x) != str:
        print(type(x))
Gonna see if I have something weird in the data first.
Interesting...
it's almost all strings but there's like 30 or so floats. Gonna see what they are.
last peak
ahh
rugged comet
I wonder how those got in my data...
last peak
such is real world data
rugged comet
I will get to the bottom of this. Thank you for your help!
last peak
np!
rugged comet
What can I infer about my model from these graphs?

 wooden sail
the accuracy seems worse than just guessing randomly 😛 but there appears to be no overfitting. maybe you're making a systematic error (using the wrong model or treating the data incorrectly)
 lapis sequoia
Hm your loss is increasing by time, are you using correct loss func and how are you exactly getting this accuracy?
tidal bough
simple fossil
I've used that function, and the speed increased from 70 seconds to 38 seconds w...
I'm guessing you're getting that on N,n = first.shape, which'd mean that you're passing 1d arrays instead of 2d ones. Basically, the old way you were doing was applying a function that works on two (n,)-shaped one-dimensional vectors at a time to N such pairs of vectors, one pair at a time. cosine_distance_vect is meant to be passed all N such vectors at once - so, two 2d arrays of shapes (N,n) each
 fervent hatch
Bruh can anyone help with my task on the mushroom classification im just a beginner in machine learning
serene scaffold
fervent hatch
Bruh can anyone help with my task on the mushroom classification im just a begin...
is this classification from images? what have you tried so far?
fervent hatch
Nah it's for predicting whether it's poisonous or edible
I just started with the data preprocessing
serene scaffold
fervent hatch
Nah it's for predicting whether it's poisonous or edible
so what is the data?
is it a spreadsheet or images?
fervent hatch
here's the dataset that im using
https://www.kaggle.com/datasets/uciml/mushroom-classification

Safe to eat or deadly poison?
 plucky condor
Hi, I have a question relating pytorch.
I have a 2D numpy array. I want to create the tensor directly on the GPU. I found the following torch.from_numpy(data, device=device). However I get the error _VariableFunctionsClass.from_numpy() takes no keyword arguments.
If someone knows a solution feel free to let me know 🙂
 clear ibex
Hello,
Why do I get different results when trying to display np array in PyCharm Jupyter notebook:
# Excercise 2
table = np.full(shape= [10, 15],
                fill_value = 99)

display("table", sp.sympify(table))
print(table)
Output:
 desert oar
clear ibex
Hello,
Why do I get different results when trying to display np array in PyChar...
desert oar
clear ibex
Hello,
Why do I get different results when trying to display np array in PyChar...
purely cosmetic. same underlying data.
the upper version resembles how it would be written in mathematics
the lower version is how it's written in numpy syntax
sympy is a symbolic math package, so it makes sense that their display output is more "mathematical"
clear ibex
desert oar
purely cosmetic. same underlying data.
hey @desert oar , thanks for the response.
I totally get that. Please take a look at first values of the both output:
display - prints out 9 as a first value
print - prints out 99 (which is the correct value)
desert oar
clear ibex
hey <@389497659087650836> , thanks for the response.
I totally get that. Please ...
i see, that might possibly be a bug in sympy
clear ibex
Thanks,
I'll open the issue on their github
serene scaffold
Please do not ask people to read screenshots of text. Please paste actual text.
!code
arctic wedgeBOT
Here's how to format Python code on Discord:
```py
print('Hello world!')
```
These are backticks, not quotes. Check this out if you can't find the backtick key.
 fringe anvil
for this example. the max we have to iterate is 2n .. dropping the constant, we can conclude bigO(n) ?
def number_in_two_arrays(A, B, num):
  arr_len = len(A)
  for i in range(arr_len):
    if A[i] == num:
      return True
  for i in range(arr_len):
    if B[i] == num:
      return True
  return False
looks like this is an #algos-and-data-structs question, but yes, the time complexity for the worst case is O(n).
fringe anvil
serene scaffold
looks like this is an <#650401909852864553> question, but yes, the time complexi...
oh sorry, i thought data science was the right place
serene scaffold
fringe anvil
oh sorry, i thought data science was the right place
no problem--now you know. by the way, keep in mind that python lists are not arrays. lists are lists.
fringe anvil
serene scaffold
no problem--now you know. by the way, keep in mind that python lists are not arr...
yeah im aware of that
serene scaffold
@peak salmon I'm leaving in about 20 minutes, but if you give the code and the error message as text, as well as print(Raw_house.head().to_dict('list')) as text, I can help you solve your problem until I leave.
 peak salmon
serene scaffold
<@403149266589188096> I'm leaving in about 20 minutes, but if you give the code ...
peak salmon
serene scaffold
<@403149266589188096> I'm leaving in about 20 minutes, but if you give the code ...
for i in Raw_house['Condition of the House'].unique():
    Raw_house['No of Floors'][Raw_house['Condition of the House'] == str(i)] = Raw_house['Sale Price'][Raw_house['No of Floors']  == str(i)].mean()


plt.figure( dpi=100)
plt.bar(Raw_house['Condition of the House'].unique(), Raw_house['Overall Grade'].unique())
plt.xlabel("Condition of the House")
plt.ylabel('Mean Sale Price')
plt.show() ```yeah this is the code i used
serene scaffold
please ping me when you've shown the other two parts I asked for
peak salmon
A value is trying to be set on a copy of a slice from a DataFrame

See the caveats in the documentation: https://pandas.pydata.org/pandas-docs/stable/user_guide/indexing.html#returning-a-view-versus-a-copy
Raw_house['No of Floors'][Raw_house['Condition of the House'] == str(i)] = Raw_house['Sale Price'][Raw_house['No of Floors'] == str(i)].mean()```this is the error message i got
@serene scaffold is this fine now^
serene scaffold
No, you still haven't given me the third part.
peak salmon
{'ID': [7129300520, 6414100192, 5631500400, 2487200875, 1954400510], 'Date House was Sold': ['14 October 2017', '14 December 2017', '15 February 2016', '14 December 2017', '15 February 2016'], 'Sale Price': [0, 0, 0, 0, 0], 'No of Bedrooms': [3, 3, 2, 4, 3], 'No of Bathrooms': [1.0, 2.25, 1.0, 3.0, 2.0], 'Flat Area (in Sqft)': [1180.0, 2570.0, 770.0, 1960.0, 1680.0], 'Lot Area (in Sqft)': [5650.0, 7242.0, 10000.0, 5000.0, 8080.0], 'No of Floors': [1.0, 2.0, 1.0, 1.0, 1.0], 'Waterfront View': ['No', 'No', 'No', 'No', 'No'], 'No of Times Visited': ['None', 'None', 'None', 'None', 'None'], 'Condition of the House': [0, 0, 0, 0, 0], 'Overall Grade': [7, 7, 6, 7, 8], 'Area of the House from Basement (in Sqft)': [1180.0, 2170.0, 770.0, 1050.0, 1680.0], 'Basement Area (in Sqft)': [0, 400, 0, 910, 0], 'Age of House (in Years)': [63, 67, 85, 53, 31], 'Renovated Year': [0, 1991, 0, 0, 0], 'Zipcode': [98178.0, 98125.0, 98028.0, 98136.0, 98074.0], 'Latitude': [47.5112, 47.721, 47.7379, 47.5208, 47.6168], 'Longitude': [-122.257, -122.319, -122.233, -122.393, -122.045], 'Living Area after Renovation (in Sqft)': [1340.0, 1690.0, 2720.0, 1360.0, 1800.0], 'Lot Area after Renovation (in Sqft)': [5650, 7639, 8062, 5000, 7503]}
serene scaffold
Thank you. Can you explain with words (no code) what your for loop is intended to do?
peak salmon
i am trynna make a graph
peak salmon
peak salmon
```C:\Users\joshu\AppData\Local\Temp\ipykernel_17216\1824088684.py:4: SettingWit...
a bar graph but whenever i put the mentioned code it shows this error
serene scaffold
Please explain what the for loop is intended to do. The for loop does not create the graph.
The reason you're getting an error is that you're not supposed to stack lookup operations on dataframes. anything that looks like Raw_house[ ][ ] is wrong
peak salmon
ohh
serene scaffold
so, I can explain how to do what you're trying to do, but you have to tell me what that is.
peak salmon
i was trynna take the mean and then make a graph of that
serene scaffold
the mean of what?
peak salmon
sale price
serene scaffold
that's just going to be one number, so you can't really plot that. Are you trying to get the mean of certain groups?
serene scaffold
What groups?
serene scaffold
peak salmon
the sale price and the condition of the house
Delete the for loop from your code, and then run this. but replace df with the name of your dataframe.
df.groupby(['Condition of the House', 'No of Floors'])['Sale Price'].mean()
so do i have to write it after for i in Raw_house["Sale Price"].unique():
serene scaffold
peak salmon
so do i have to write it after ```for i in Raw_house["Sale Price"].unique():```
No. delete the for loop.
serene scaffold
that's why I said "replace df with the name of your dataframe"
I'm happy to help, but I feel like we aren't communicating effectively.
peak salmon
ok i understood what you said
serene scaffold
great. did you see what df.groupby(['Condition of the House', 'No of Floors'])['Sale Price'].mean() does?
peak salmon
i saw but it says like df is not defined
serene scaffold
you have to replace df with the name of your DataFrame
anyway, I am out of time. good luck!
peak salmon
ok
 copper mica
On the pytorch site i see that it shows Java here... Is this a mistake?
 desert oar
copper mica
On the pytorch site i see that it shows Java here... Is this a mistake?
desert oar
copper mica
On the pytorch site i see that it shows Java here... Is this a mistake?
you can select Python instead. the core of Pytorch is a library called "libtorch", that can be used in multiple language runtimes, including Java
chances are you should select Pip or Conda instead of Libtorch
copper mica
desert oar
you can select Python instead. the core of Pytorch is a library called "libtorch...
i kinda wanted to try out libtorch with java
for fun. But the docs look incomplete and i feel like it will be miserable
 mint palm
when calculating AUC, should i prefer giving test data with relatively equal number of both types of classes(say i am doing binary classification)
desert oar
copper mica
i kinda wanted to try out libtorch with java
i found this repo if it helps https://github.com/pytorch/java-demo

GitHub
Contribute to pytorch/java-demo development by creating an account on GitHub.
tidal bough
libtorch is quite a pain, tried it in Rust
the docs are almost nonexistent, I had to read python docs and guess how that translates to libtorch (the docs for libtorch have the function names but almost nothing else)
copper mica
tidal bough
libtorch is quite a pain, tried it in Rust
you literally described
my experience with it as well lol
mint palm
is roc affected by class imbalance?
desert oar
mint palm
when calculating AUC, should i prefer giving test data with relatively equal num...
in principle it should help, but it's good to consider specifically the reasons why. when you compute an ROC curve, you are constructing estimates of TPR and FPR. so you need to be able to construct good representative estimates of both TPR and FPR. so your test set ideally should contain representative samples of "0" cases and "1" cases
 sacred tartan
Do i need to learn pytorch
desert oar
sacred tartan
Do i need to learn pytorch
nobody needs to do anything
mint palm
ROC analysis does not have any bias toward models that perform well on the minority class at the expense of the majority class—a property that is quite attractive when dealing with imbalanced data.
I dont get this very much.
Actually my real issue is i tried a data with positive:negative = 1:10 and then tried same dataset but removed some negative example to have 1:5 split, my auc became 0.53 from 63%
desert oar
mint palm
is roc affected by class imbalance?
in some cases. see here https://stats.stackexchange.com/a/360040 as well as do a search for the auc tag on that site. many many high quality answers there

Cross Validated
I have an algorithm which gives an AUC (area under the receiver operating curve) of 0.94.
I mean, this is amazing, but... probably too amazing, considering the difficulty of the task I am working ...
peak salmon
ok i have a doubt
 grand quarry
Hey guys, I'm having problem where network finds local minima after going through about 20% of the data in first batch. i decreased batch size to 16 and optimiser adam has learning rate of 0.00001. Should I lower the learning rate even more?
peak salmon
df['Condition of the House'][df['Condition of the House'] == 'Okay'] = '4'
df['Condition of the House'][df['Condition of the House'] == 'Bad'] = '3'
df['Condition of the House'][df['Condition of the House'] == 'Good'] = '0'
df['Condition of the House'][df['Condition of the House'] == 'Excellent'] = '2'
df['Condition of the House'][df['Condition of the House'].unique()]``` whenever i add this code i get this message "None of [Index(['1', '4', '3', '0', '2'], dtype='object')] are in the [index]"
desert oar
@mint palm see also https://stats.stackexchange.com/a/260237/36229
Cross Validated
I just start to learn the Area under the ROC curve (AUC). I am told that AUC is not reflected by data imbalance. I think it means that AUC is insensitive to imbalance in test data, rather than imba...
desert oar
grand quarry
Hey guys, I'm having problem where network finds local minima after going throug...
are you shuffling data before training?
peak salmon
peak salmon
``` df['Condition of the House'][df['Condition of the House'] == 'Fair'] = '1'
d...
i am not getting an array
grand quarry
desert oar
are you shuffling data before training?
I need a generator so I shuffle each file that contains 1/35th of the data
peak salmon
rather it says the numbers arent even in the columns and i am like huh
desert oar
peak salmon
``` df['Condition of the House'][df['Condition of the House'] == 'Fair'] = '1'
d...
what did you expect that last line to do?
peak salmon
desert oar
what did you expect that last line to do?
i had expected to get like a array between 1 3 5
desert oar
grand quarry
I need a generator so I shuffle each file that contains 1/35th of the data
can you also shuffle the file order perhaps?
peak salmon
i am currently using jupyter notebook
so umm is there a different type of code for it
desert oar
peak salmon
i had expected to get like a array between 1 3 5
of the unique values? give a specific example if you can
grand quarry
desert oar
can you also shuffle the file order perhaps?
I can, but the problem seems to be in the first batch anyway
desert oar
peak salmon
so umm is there a different type of code for it
no. read the error message!
peak salmon
desert oar
no. read the error message!
i read the error message and the numbers are there in the index
i dont get which index is it talkin about
desert oar
peak salmon
i read the error message and the numbers are there in the index
the number 1 is not the same as the string "1"
desert oar
peak salmon
i dont get which index is it talkin about
the "index" refers to the dataframe row labels
peak salmon
desert oar
the number 1 is not the same as the string `"1"`
oh so basically a single apstrophe is not the same as a double
so do i have to put the string "1" instead of '1'
desert oar
peak salmon
oh so basically a single apstrophe is not the same as a double
No, they are exactly the same. But a string is never the same as a number
it would help if you provided a small example data set that someone can copy and paste to reproduce this problem
As well as an example of the desired output
It's unusual to be subsetting rows of a data frame with the unique values of a column in that data frame. I suspect that you might be misusing some features here
peak salmon
desert oar
it would help if you provided a small example data set that someone can copy and...
can i put the csv file over ehre
from which i am extracting data
desert oar
peak salmon
can i put the csv file over ehre
!paste use our paste site
arctic wedgeBOT
Pasting large amounts of code
If your code is too long to fit in a codeblock in Discord, you can paste your code here:
https://paste.pythondiscord.com/
After pasting your code, save it by clicking the floppy disk icon in the top right, or by typing ctrl + S. After doing that, the URL should change. Copy the URL and post it here so others can see it.
desert oar
peak salmon
https://paste.pythondiscord.com/tizayepawu
df['Condition of the House'][df['Condition of the House'].unique()]
i was trying to understand your intentions with this particular line of code
peak salmon
desert oar
```py
df['Condition of the House'][df['Condition of the House'].unique()]
```
i ...
oh i was trynna get the array out of the data i was using unique instead of show()
the problem is i dont know how to output the data
without having errors
i wanna know is there a better way than writing this
desert oar
peak salmon
oh i was trynna get the array out of the data i was using unique instead of show...
what array? be specific
peak salmon
desert oar
what array? be specific
array for rating of the houses
like 1 0 3
like if a house is good its a 3 if its bad its 0 if its okay its 1
i wanna know one more thing what does unique() do
 thick quest
someone knows a little bit about sat solver ? (pysat) i have questions about fct pysat.card()
desert oar
peak salmon
i wanna know one more thing what does unique() do
It's not a good idea to use functions that you don't understand!
Otherwise you end up with unexpected results that don't make sense, like this one
desert oar
peak salmon
array for rating of the houses
Do you want all of the values? Some of them? A random sample? Or something else?
peak salmon
desert oar
Do you want all of the values? Some of them? A random sample? Or something else?
all the values
 urban knoll
I'm trying to learn how conv2d module works in pyTorch.
how does the in channel out channel thing work? like if you have an input of 3 x 64 x 64, this is 64 by 64 3 channel(rgb)
and spit out 64 x 32 x 32
output, so 64 channels? in rgb format or like what exaclty? how dones the Neural network choose how to arrange channels?
Or how to make them I guess?
hasty mountain
urban knoll
Or how to make them I guess?
You simply repeat the conv operation 64 times, so you'll get 64 feature maps with sizes 32x32
A single convolution generates a single feature map using a single input. If you use the same input but repeats the operation 64 times, you'll have 64 feature maps(so 64 channels) from that single input
Oh, I mean... Probably it doesn't really simply "repeat" the convolution. It probably creates new weights matrices for each convolution, considering how the params size increase with the number of output channels.
urban knoll
oh okay makes sense. Yeah it doesn't, each 32x32 feature map you create is goteen by using different kernels(of same size but different values, these kernels are the "weights")
 misty tulip
anyone ever seen this before when training GANs?
urban knoll
seen what?
misty tulip

generations that look like this

repetitive patterns of a few pixels arranged in a square
then that square is repeated to make the image
it seems that the graininess of the image is related to the kernel size
the first was (2, 2)
the bottom was (5, 5)
urban knoll
just learning GANS so i dont think i ca help lol
urban knoll
does anyone have good links to understand deconvolution?
misty tulip
urban knoll
does anyone have good links to understand deconvolution?
deconvolution is convolution in reverse
instead of taking a 2d tensor and returning a scalar, it takes a scalar and returns a 2d
copper mica
Is there a curated list of non trivial CNN projects I can take a look at?
serene scaffold
copper mica
Is there a curated list of non trivial CNN projects I can take a look at?
Image classification would be a good one to start with
I know that's not what you asked for though
copper mica
do you have any repos you can link me to that are well developed and follow good coding practices etc?
serene scaffold
copper mica
do you have any repos you can link me to that are well developed and follow good...
Repos that use pytorch and CNNs?
copper mica
yeah i'm looking for examples that are not trivial, everything i've seen is just annoyingly simple
im guessing most of this is proprietary but surely there exists a few good examples. I'm a software dev(use scala at work) wanting to get in to this field and one thing i've noticed in the repos that i've llooked at is they were all horribly entangled lumps of code
i'm just trying to find good examples to read from
copper mica
serene scaffold
Repos that use pytorch and CNNs?
forgot to @
https://github.com/baowenbo/DAIN/blob/master/MegaDepth/pytorch_DIW_scratch.py
like when i first saw this i wanted to cry
serene scaffold
copper mica
im guessing most of this is proprietary but surely there exists a few good examp...
The python code used to train models often are horrible tangled lumps of shit. Data scientists are in my experience the most stylistically depraved people in the python ecosystem. But part of that is data science being the Python domain that requires the most non-programming knowledge.
copper mica
so the example i gave above is a common encounter?
serene scaffold
No. That actually isn't so bad. Though I've never seen anyone define a model that deep before 🤣
I wonder if it could be made more terse with functions, or something
copper mica
yeah lol
i was trying to refactor it and i went insane
The area of AI i'd like to get into is mainly related to art, computer graphics, animation... etc
serene scaffold
Like I said, it's not that bad. Like there's nothing about that code that's unclear
copper mica
serene scaffold
I wonder if it could be made more terse with functions, or something
there's a lot of duplicated fragments that can be factored out
i guess the one trouble i had when doing it myself is labeling good names
I guess i should just educate myself on data science first
serene scaffold
copper mica
there's a lot of duplicated fragments that can be factored out
Verbose code is like the least bad problem that data science code often has. I've read papers and looked up the reference implementations on GitHub, and there is often quite literally no way to figure out how it works unless you know the content of files that are only on their computer, whose paths are hard coded into the program
serene scaffold
copper mica
I guess i should just educate myself on data science first
Yes. Learn-by-doing doesn't really work for data science the way it does for other programming domains. Unless you want to re-implement everything that libraries like pytorch do for you
copper mica
serene scaffold
Verbose code is like the least bad problem that data science code often has. I'v...
that sounds like sheer misery
do you have any recommended(up to date) books or whatnot?
ideally i'd like something that has exercises and is challenging
serene scaffold
copper mica
do you have any recommended(up to date) books or whatnot?
"data science from scratch", but only the second edition
I don't remember if it has exercises or not. Remind me to check tomorrow for you.
Are you a current student or professional?
 iron basalt
serene scaffold
Verbose code is like the least bad problem that data science code often has. I'v...
iron basalt
serene scaffold
Verbose code is like the least bad problem that data science code often has. I'v...
Reproducible "science". Also another fun thing is when the reference implementation for something does not match the paper. They actually altered it because the description in the paper does not actually work.
copper mica
im working as a software developer
copper mica
serene scaffold
Are you a current student or professional?
i use scala professionally
serene scaffold
copper mica
im working as a software developer
You might see if your company has OReilly online as a benefit. In which case you can read basically every data science book
copper mica
are there any in particular that you would recommend?
i personally just need exercises
to learn better
serene scaffold
copper mica
are there any in particular that you would recommend?
The one I mentioned earlier. I'm also working through "Deep learning in pytorch"
copper mica
alright thank you!
copper mica
serene scaffold
The one I mentioned earlier. I'm also working through "Deep learning in pytorch"
does this one have exercises
 gaunt anvil
Does anyone know how I can deal with a lack of data when trying to train a ML Model?
I want to train a deepfake tts with the voice of zhongli, but I can only reasonably find like ~2-3 hours of his voice lines. I was looking at models like tacotron/tacotron2 but I think those require ~10 hours of data to have a good output. I also looked at the possibility of using pre-trained models but i'm not sure if they'd help or be harmful.
serene scaffold
gaunt anvil
Does anyone know how I can deal with a lack of data when trying to train a ML Mo...
You can't overcome a lack of quality training data for that. You would just have to accept the worse results.
Though I don't think tacotron 2 requires ten hours
For this Zhonhli person, how much audio do you have that's totally clean?
serene scaffold
The audio needs to be just the speech with nothing in the background
copper mica
i imagine you could extract all the audio from the game
but that's not going to 10 hours
copper mica
serene scaffold
The audio needs to be just the speech with nothing in the background
some of it will probably have bgm
maybe you can find the voice actor doing other roles?
serene scaffold
It would also be difficult if the person's tone isn't consistent
Those models are often developed only with neutral speech
desert oar
peak salmon
all the values
df['Condition of the House'] should be sufficient. i suggest re-reading the User Guide and Tutorial documentation to make sure you understand these fundamental usage concepts
gaunt anvil
serene scaffold
For this Zhonhli person, how much audio do you have that's totally clean?
2-3 hours totally clean
gaunt anvil
copper mica
some of it will probably have bgm
you can just mine the game for files but there are compilations online with just pure audio
gaunt anvil
copper mica
https://www.youtube.com/watch?v=4oBpaBEMBIM&ab_channel=GenshinImpact
genshin yes ;>
the best couple i've found were:
https://youtu.be/tBHxgi4CDWk
https://www.youtube.com/watch?v=2pBZr0zSCz0
https://genshin-impact.fandom.com/wiki/Zhongli/Voice-Overs
gaunt anvil
serene scaffold
You can't overcome a lack of quality training data for that. You would just have...
will pretrained models on other audio help?
oh interesting i did some extra research and found: https://google.github.io/tacotron/publications/semisupervised/index.html
seems like 2h would do pretty decently
urban knoll
I'm trying to understand GANS right now(with pyTorch) and I don't know how the corss entropy works when dealing with the fake images the generaotr makes. If the images are created with no labels then how are the labels created when the fake images are passed through the discriminator? In this link below, the labels are created with torch.ones and torch.zero.why is that used?
def train_discriminator(real_images, opt_d):
    # Clear discriminator gradients
    opt_d.zero_grad()

    # Pass real images through discriminator
    real_preds = discriminator(real_images)
    real_targets = torch.ones(real_images.size(0), 1, device=device)
    real_loss = F.binary_cross_entropy(real_preds, real_targets)
    real_score = torch.mean(real_preds).item()

    # Generate fake images
    latent = torch.randn(batch_size, latent_size, 1, 1, device=device)
    fake_images = generator(latent)

    # Pass fake images through discriminator
    fake_targets = torch.zeros(fake_images.size(0), 1, device=device)
    fake_preds = discriminator(fake_images)
    fake_loss = F.binary_cross_entropy(fake_preds, fake_targets)
    fake_score = torch.mean(fake_preds).item()

    # Update discriminator weights
    loss = real_loss + fake_loss
    loss.backward()
    opt_d.step()
    return loss.item(), real_score, fake_score
def train_generator(opt_g):
    # Clear generator gradients
    opt_g.zero_grad()

    # Generate fake images
    latent = torch.randn(batch_size, latent_size, 1, 1, device=device)
    fake_images = generator(latent)

    # Try to fool the discriminator
    preds = discriminator(fake_images)
    targets = torch.ones(batch_size, 1, device=device)
    loss = F.binary_cross_entropy(preds, targets)

    # Update generator weights
    loss.backward()
    opt_g.step()

    return loss.item()
Good to know that someone in the area has the same problem
I've tried studying OpenAI's Guided Diffusion and NVidia's Tacotron 2 codes
On each one, I've spent an entire week trying to decipher what they were doing and why they create functions that was already available in pytorch...I gave up after that week, and ever since I don't try to mimetize their codes, I just try to apply based on what I read in the papers or try to get inspired by what they relate in their papers
When I tried implementing a progressive growing GAN the exact way NVidia does in their ProGrow paper, it failed miserably. When I simply used the idea of growing GAN and adapted it to a DCGAN, without using their crazy functions and normalization techniques, it worked almost perfectly.
hasty mountain
gaunt anvil
will pretrained models on other audio help?
It will. Use a pretrained model, let Tacotron train on your audio data for a couple of hours and it should be fine. If you let it train for enough time, it'll replace the voice from LJSpeech and use Zhongli's voice.
I used a pretrained tacotron 2 and my audio data had, like... half an hour? And it worked quite well...
Just keep in mind that, perhaps, you might need a SuperResolution Model in order to have a proper audio quality.
I'd recommend SRGAN
urban knoll
hasty mountain
It will. Use a pretrained model, let Tacotron train on your audio data for a cou...
Since you seem to know about GANS, if you have the time could you help me with the question I asked? Perhaps I did not explain it properly?
hasty mountain
urban knoll
Since you seem to know about GANS, if you have the time could you help me with t...
Oh, sorry, I didn't see that. I'll take a look.
hasty mountain
urban knoll
I'm trying to understand GANS right now(with pyTorch) and I don't know how the c...
The labels are used just so the discriminator can classify images between real and false, so they just have to have the same length as the images batch and have values 1(real) or 0(fake)
(Though it's actually recommended using 0 for fake and 0.9 or 0.85 for real images...label smoothing)
preds = discriminator(fake_images)
targets = torch.ones(batch_size, 1, device=device)
Here, preds have size (Batch, 3, 64, 64), so targets should just have size (batch, 1), as it only requires 1 value per image
urban knoll
okay so I can see why torch.zero would be used forvbinary cross entropy when dealing with the discriminator
but for generator I'm tryong to figure out why torch.omes is used
hasty mountain
It's because you're actually not using it with the generator, you're using those labels with the discriminator.
urban knoll
oh waitno I'm dumb, It hink I get wahts happening
hasty mountain
But this code is slightly confusing... GANs are confusing enough
Did you try checking out this tutorial: https://pytorch.org/tutorials/beginner/dcgan_faces_tutorial.html ?
The code is full of comments explaining each step
urban knoll
yeah torch.zero is used for train discrimator to see if the discriminator can actually correctly predict the falseness if the image. And torch.one is used in train generatorto see if the fake images actually fool the discriminator into believing they are real. They kinda do the same thing I guess. Could torch.one and torch.zero be switched? How would that change things?
I'll check out that link. The issue I've been having was getting something that actually works for my python 3.6, I tried different tutorials and kept getting errors(for compatability reasons I suppose?)
I actually run this current one and it works
hasty mountain
urban knoll
yeah torch.zero is used for `train discrimator` to see if the discriminator can ...
In the first part, you use torch.ones and torch.zeros just to train the discriminator the same way you would do with any discriminator.
In the second part, when you deal with the generator, you consider all the generated images as real and pass the fake images and the real labels to the discriminator. If the discriminator predicts that those images are fake, he's "incorrectly" predicting the labels, which generates a loss. And this loss is, in the GAN code, considered the generator loss.
urban knoll
hmm okay
I've also been trying to understand deconvolution in depth, I found a paper but didn't understadn what it was telling me
hasty mountain
And this happens because, when you generate the fake images, torch's autograd will already backpropagate through the generator. When you pass those fake images into the discriminator and thorugh the Binary Entropy function, torch's autograd (in loss.backward()) will backpropagate through the discriminator and the generator.
urban knoll
I understand the general overview
hasty mountain
But, since you'll apply optimization (optimizer.step()) only in the generator and then zero the discriminator's grads, you'll only be backpropagating through the gen
hasty mountain
urban knoll
I understand the general overview
Oh, this I can't quite explain. The only thing I've seen is that...Transposed Convolutions aren't exactly deconvolutions...they're actually normal Convolutions with so many padding that it generates an output with higher dimensions than the input
urban knoll
ah okay, the padding would make sense
hasty mountain
Though pytorch allows for padding in convolutions and in transposed convolutions(this one also allows for output padding)
urban knoll
why the transpose part though?
hasty mountain
Maybe because convolutions usually generates outputs with smaller dimensions...
People don't tend to use convolutions with paddings higher than 2, 3...
urban knoll
I'm not quite sure how this explains the transpose step
rugged comet
lapis sequoia
Hm your loss is increasing by time, are you using correct loss func and how are ...
I'm using categorical crossentropy for the loss function. This is a multi-label classification problem where one instance can have 0-5 labels.
rugged comet
wooden sail
the accuracy seems worse than just guessing randomly 😛 but there appears to be ...
I don't think it's worse than guessing randomly considering it has to predict 0-5 labels for each instance. I'm using the tensorflow functional api for my model. Here's its design.
 desert oar
rugged comet
I don't think it's worse than guessing randomly considering it has to predict 0-...
desert oar
rugged comet
I don't think it's worse than guessing randomly considering it has to predict 0-...
is this the multi-label classification problem? what loss function are you using, and how are you measuring overall accuracy?
rugged comet
desert oar
is this the multi-label classification problem? what loss function are you using...
Yeah.
I'm using categorical crossentropy.
I'm measuring accuracy like this I suppose.
    model.compile(
        loss=tf.keras.losses.CategoricalCrossentropy(from_logits=True),
        optimizer=tf.keras.optimizers.Adam(),
        metrics=["acc"]
    )
That might not be what you meant though.
desert oar
rugged comet
Yeah.
I'm using categorical crossentropy.
I'm measuring accuracy like this I s...
i am not sure about how to specify this with Keras, but mathematically you need to specify separate binary cross-entropy losses for each label, and take their sum
it looks like binary_crossentropy should "just work"
rugged comet
Oh like each output node gets a binary crossentropy?
desert oar
your learning curves are wacky because your model is mathematically missspecified
rugged comet
I suppose that makes sense.
desert oar
rugged comet
Oh like each output node gets a binary crossentropy?
yes, recall that multi-label classification works by treating each label as a separate binary classification problem
rugged comet
Let's see what happens.
desert oar
https://stackoverflow.com/a/44165755/2954547 for a basic example
Stack Overflow
I am unsure how to interpret the default behavior of Keras in the following situation:
My Y (ground truth) was set up using scikit-learn's MultilabelBinarizer().
Therefore, to give a random examp...
rugged comet
Very neat

 rugged comet
Validation metrics seem to plateau over a great number of epochs. At least there's only slight overfitting from what I can tell.


Does it make sense to use an Embedding layer after a TextVectorization layer if "multi_hot" is used as the output_mode for TextVectorization?
desert oar
rugged comet
Validation metrics seem to plateau over a great number of epochs. At least there...
plateau is typical
rugged comet
Certainly more typical than having wildly erratic loss and accuracy.
Do you have any opinion on whether it makes sense to use multihot before an embedding layer?
odd meteor
rugged comet
I'm using categorical crossentropy for the loss function. This is a multi-label ...
If you're dealing with Multi-label classification problem, you're to use binary-cross-entropy as your loss function not categorical-cross-entropy.
Categorical Cross entropy loss function is used on multi-class classification problem.
rugged comet
odd meteor
If you're dealing with Multi-label classification problem, you're to use binary...
Thank you for letting me know.
hasty mountain
odd meteor
If you're dealing with Multi-label classification problem, you're to use binary...
What's the difference?
Nevermind, I think I understand now... Multi-class is like... 1 input ----> 1 label from N possible labels.
Multi-label is like 1 input -----> many labels at once, right? So X can be "dog" or "not dog" and also "poodle" or "not poodle"?
 sacred wedge
how can i do to display a webcam window with opencv where i will be able to see myself on mac? like this :
 dense lagoon
bad?
 sacred wedge
is it possible to display buttons on open CV window to stop/program or to do things?
 timid kiln
Wasn't sure if this question should go in this channel or #databases. Is there an "easy" way to convert a query between two database tables to a pandas dataframe type setup? Because I'm more comfortable with database queries I'm creating a SQLite database file on the fly, creating a few tables, and running queries against that to create the dataframe table I need. I'm just thinking this all could be done without creating the extra files and so forth. I don't use the SQLite db after the code runs; it's created on the fly.
timid kiln
dense lagoon
bad?
idk what you did there but if you're doing some kind of data smoothing I really like that output. How did you do that?
odd meteor
hasty mountain
Nevermind, I think I understand now... Multi-class is like... 1 input ----> 1 la...
Both Multi-class and Multi-label classification deal with predicting classes, but in Multi-label classification, a single input can be assigned to more than one class.
**Example **
We could use a Multi-label classification to tag a TV-series genre by its plot summary.
Nine noble families fight for the control over the mythical land of Westeros, while an ancient enemy returns after being dormant for thousands of years
From the above plot summary we can easily classify the genre of the TV-series as thus:
Game of Thrones ==> Action, Adventure, Drama
So essentially, what we have here is a single input (a TV-series called Game of Thrones) belonging to more than one class (i.e Action, Adventure, Drama)
If it were a multiclass classification, there will be more than 2 classes in your data set and a single input will belong to only one class.
I hope you understand it now. ✌️
timid kiln
timid kiln
Wasn't sure if this question should go in this channel or <#342318764227821568>....
@serene scaffold tagging you because you are my hero 😄
serene scaffold
timid kiln
Wasn't sure if this question should go in this channel or <#342318764227821568>....
!docs pandas.read_sql
arctic wedgeBOT
pandas.read_sql(sql, con, index_col=None, coerce_float=True, params=None, parse_dates=None, columns=None, chunksize=None)```
Read SQL query or database table into a DataFrame.

This function is a convenience wrapper around `read_sql_table` and `read_sql_query` (for backward compatibility). It will delegate to the specific function depending on the provided input. A SQL query will be routed to `read_sql_query`, while a database table name will be routed to `read_sql_table`. Note that the delegated function might have more specific notes about their functionality not listed here.and then there's this: https://pandas.pydata.org/docs/reference/api/pandas.DataFrame.to_sql.html
forgive me if none of that is news to you. I actually mostly work with non-tabular databases.
timid kiln
serene scaffold
!docs pandas.read_sql
I thought that was just for database tables?
timid kiln
serene scaffold
forgive me if none of that is news to you. I actually mostly work with non-tabul...
I gotta ask about these non-tabular databases someday.
Getting off the train brb
lapis sequoia
Hello, iam learning about ANN little bit, what is good way to teach ANN by generations?
for example if i want to make snake AI
timid kiln
serene scaffold
forgive me if none of that is news to you. I actually mostly work with non-tabul...
So if I understand what I'm reading correctly, this is going in the opposite direction. I want to learn how to take dataframes with unique records and combine them via queries as I would a SQL database. Perhaps I haven't spent enough time reading on the Internet but all I've seen is join and merge and it seems rather convoluted to me. But I probably misunderstand quite a bit.
 fading jungle
hey guys im working on my first ml program and im trying to do linear regression but im finding some problems
arctic wedgeBOT
Hey @fading jungle!
It looks like you tried to attach a Python file - please use a code-pasting service such as https://paste.pythondiscord.com
fading jungle
one problem is that the append function is somehow turning the the values into negative
and the other is that the cost function is nowhere reeaching0
im very new to ml and proper python coding , so apologies
serene scaffold
timid kiln
So if I understand what I'm reading correctly, this is going in the opposite dir...
sorry, guess I misunderstood what you meant. in pandas, both join and merge refer to SQL-style joins. but pandas joins are only SQL joins on the primary key, whereas pandas merges are SQL joins in general.
in fact, I think pandas join just calls pandas merge 😛
desert oar
rugged comet
Certainly more typical than having wildly erratic loss and accuracy.
Do you hav...
https://keras.io/api/layers/preprocessing_layers/core_preprocessing_layers/text_vectorization/ i don't see multi_hot as an option, got a doc link?
 serene scaffold
as for why pandas doesn't just use the word "join" exactly the same way SQL does, I think "merge" is a relic of R data.frame, which inspired pandas.
desert oar
consider that even assigning a new column to a dataframe, invoking "series-series" methods like +, and using pd.concat are also sql-style joins
 unborn temple
If you are free, i need some advice on one thing
small thing
based on AI
@serene scaffold
serene scaffold
unborn temple
If you are free, i need some advice on one thing
I won't commit to answering a question that hasn't been asked.
unborn temple
okay then,
I am doing a research paper on Future opportunities and effects of Artificial intelligence on Management systems of an organization for college, I would like to know, what are some interesting new technologies(according to you) that belong to this category?
serene scaffold
unborn temple
I am doing a research paper on Future opportunities and effects of Artificial in...
what course is this for?
unborn temple
this is a course in Degree for AI and Data science, the course belongs to Managment
unborn temple
serene scaffold
what course is this for?
.
timid kiln
serene scaffold
in fact, I think pandas join just calls pandas merge 😛
So for anything other than simple SELECT type queries, probably should stick with a database eh?
serene scaffold
timid kiln
So for anything other than simple SELECT type queries, probably should stick wit...
if you already have the DataFrame in memory and want to do some SQL-style joins before writing it to disk or whatever, using pd.merge shouldn't give you any problems. let me know if you need help with that.
serene scaffold
unborn temple
I am doing a research paper on Future opportunities and effects of Artificial in...
Sorry, but I haven't worked on any technologies that are intended to help with management systems.
timid kiln
serene scaffold
if you already have the DataFrame in memory and want to do some SQL-style joins ...
Appreciated. I'll take a closer look at it; it's very likely I simply haven't put the effort into it to understand it fully.
unborn temple
serene scaffold
Sorry, but I haven't worked on any technologies that are intended to help with m...
oh okay thanks for the time
gaunt anvil

GitHub
Tacotron 2 - PyTorch implementation with faster-than-realtime inference - GitHub - NVIDIA/tacotron2: Tacotron 2 - PyTorch implementation with faster-than-realtime inference
this repo only has text -> mel generation right
we have to get another network like wavenet to decode mels?
hasty mountain
odd meteor
So essentially, what we have here is a single input (a TV-series called Game of ...
Interesting...now I'm beginning to understand how Dall-E works in a nutshell...

hasty mountain
gaunt anvil
we have to get another network like wavenet to decode mels?
Yep
gaunt anvil
hmm i see
i assume the SuperResolution Model you said last night is in between these steps? to upscale the mels so wavenet can decode more accurately?
or do we also scale the mels from the training data up as well?
hasty mountain
No. You generate a mel from text using tacotron, then generate a waveform(audio .wav format) from mel (tacotron uses waveglow automatically) and, after that, you pass that waveform into a SuperResolution Model
hasty mountain
You actually can, but the audio is a bit noisy and meh
gaunt anvil
ah
hasty mountain
Audio data has too much information, and networks tend to generate outputs a bit meh when dealing with too much information
This is why models that generate images usually deal with 64x64 images
I don't know why this happens, perhaps someone in the area might have an explanation. But, from my experience, images with a resolution higher than 100x100x3 tend to get too noisy
(Yes, I've tested a model that decomposed and recomposed a RGB image to check this out)
Now, consider that an audio with 2 seconds has, like, 80.000 points of information in total
 unique flame
unborn temple
I am doing a research paper on Future opportunities and effects of Artificial in...
unique flame
unborn temple
I am doing a research paper on Future opportunities and effects of Artificial in...
Pretty sure you can find a review paper on that topic. I can think of "progress monitoring" at the top of my head and that's part of some management courses.
 brave cairn
Why does my Jupyter LaTeX look different compared to the conventional/curlier one?


I think it ha to do with MathJax and LaTeX
 dense walrus
Traceback (most recent call last):
File "D:\face_recognize.py", line 33, in <module>
model = cv2.face.LBPHFaceRecognizer_create()
AttributeError: module 'cv2' has no attribute 'face'
any idea why?
serene scaffold
dense walrus
Traceback (most recent call last):
File "D:\face_recognize.py", line 33, in <m...
remember to also show a representative sample of the code that caused the error. but it looks like cv2 is the module/library itself, whereas you probably thought it was an instance of some kind.
dense walrus
my b, kept reinstalling opencv contrib without restarting the pc
 rare socket
My neural network trains itself by making the agents compete against each other. The "losers" get deleted and replaced by new agents. I'm trying to manually change the model for first place to try and optimize it but as soon as the "modify_weights" function is activated, the entire training process fails. (It worked fine before without it, I'm just trying to make it more accurate)

This is the modify_weights function
 serene scaffold
rare socket
This is the modify_weights function
serene scaffold
rare socket
This is the modify_weights function
!code
arctic wedgeBOT
Here's how to format Python code on Discord:
```py
print('Hello world!')
```
These are backticks, not quotes. Check this out if you can't find the backtick key.
serene scaffold
Please do not post screenshots of text whenever possible.
 abstract apex
def efficiency_comparison():
    z = 1000
    for x in range (1000000,11000000,1000000):
        lists_func_efficiency = timeit.timeit('lists_gen_dp_efficiency(10)', globals=globals(), number=z)
        plt.plot(x, lists_func_efficiency)
        print("x =",x, ", y =",lists_func_efficiency, ", Average =", lists_func_efficiency/z)
        array_func_efficiency = timeit.timeit('arrays_gen_dp_efficiency(10)', globals=globals(), number=z)
        plt.plot(x, array_func_efficiency)
        print("x =",x, ", y =",array_func_efficiency, ", Average =", array_func_efficiency/z)
    plt.show()
efficiency_comparison()
plt.plot() showing a blank graph
tidal bough
try a plt.figure() before the loop
abstract apex

 trail fractal
anyone using ta-lib? doesnt seem to play nice after python3.11 upgrade
 restive python
Hi guys! Anyone know how to export a vertex ai single label image classification model?
dense lagoon
is more epochs better?
 agile cobalt
dense lagoon
is more epochs better?
agile cobalt
dense lagoon
is more epochs better?
more epochs = more training = fits the training data better
if you train too little, it may underfit
if you train too much, it may overfit
serene scaffold
dense lagoon
is more epochs better?
you'll eventually have diminishing returns, and like etrotta said, you might overfit.
agile cobalt
there's a lot more factors to it than just the number of epochs though, many of which [important factors] are generally covered in detail by courses
serene scaffold
@agile cobalt which do you think is more likely to cause overfitting, having lots of epochs, or lots of redundant features?
dense lagoon
overfit is better than underfit usually right?
serene scaffold
not necessarily.
dense lagoon
Hmm, sorry im new to trainign models
Runnign batch 32, epoch 140 rn
for multiclass bounding boxes
serene scaffold
dense lagoon
Runnign batch 32, epoch 140 rn
you might retain the loss for each epoch and plot it after the fact, to see at what point the change in loss between epochs became negligible
dense lagoon
oh okay, so then test again if 140 was to much, lower it a little
and see when it peaks?
agile cobalt
serene scaffold
<@256442550683041793> which do you think is more likely to cause overfitting, ha...
probably task / model dependent? hard to say on an 'absolute' scale / universally
I've checked out a bunch of theory about ML so far, but haven't really used it much in practice yet
dense lagoon
 serene scaffold
dense lagoon
and see when it peaks?
serene scaffold
dense lagoon
and see when it peaks?
it shouldn't peak. it would look more like this
 dense lagoon
okay nice
serene scaffold
dense lagoon
I don't look at screenshots of text, sorry.
dense lagoon
wow my map50 is way higher today than last night,
last night i maxed at 0.45, already at 0.63 map50 🙂
can batch size affect ur preciison and map50? is it cause i went from 16 batch to 32 maybe im getting bettter results faster?
agile cobalt
dense lagoon
overfit is better than underfit usually right?
arguably even worse, specially if it's for an important task
an underfit model is more likely to perform poorly all around, and that's harder to hide
someone inexperienced or malicious may present an overfit model as extremely well performing, but it may do poorly in practice with real data
not to mention how they deal with potential biases in the data
dense lagoon
agile cobalt
arguably even worse, specially if it's for an important task
an underfit model i...
Oh okay thanks for lmk
Jesus Also i forgot i fixed one of my boundign boxes that was a little off and now my preicison is already at 0.34 from a cap of 0.17 last night lmao
rare socket
def modify_weights(self):
        with torch.no_grad():
            self.linear1.weight[random.randint(0, 2), random.randint(0, 4)] = random.uniform(-1,1)
            self.linear2.weight[random.randint(0, 2), random.randint(0, 2)] = random.uniform(-1,1)
Would anyone know why accessing and changing weights in the model this way make the rest of the agents not work? As soon as I access and modify the neural network my entire training doesnt work anymore
agent1.model = firstPlace.model
        agent2.model = firstPlace.model
        agent2.model.modify_weights()

        del agent3
        del agent4
        del agent5

        agent3 = Agent()
        agent4 = Agent()
        agent5 = Agent()
These agents compete against each other and the "losers" are discarded. The second agent turns into the first place agent but is then modified slightly. If I get rid of the modify_weights() function the entire thing works fine. I'm not sure what's going on
dense lagoon
hows this looking guys?
 dense lagoon
does --workers 2 make trainign faster?
rugged comet
desert oar
https://keras.io/api/layers/preprocessing_layers/core_preprocessing_layers/text_...
https://www.tensorflow.org/api_docs/python/tf/keras/layers/TextVectorization
Scroll down to the args table. It's an output_mode.
TensorFlow
A preprocessing layer which maps text features to integer sequences.
 rain zephyr
I’m not sure how to tell if there is overfitting or not

For the second example, the score is .888888 every time so I don’t know what that means as far as overfitting goes
young granite
rain zephyr
I’m not sure how to tell if there is overfitting or not
so if i see correctly u are 0.9/0.1 split, high train data often results in over-fitting which means its only good for predictions with same structure as traindata.
rain zephyr
omg why didn’t I think of that thank you
young granite
no worries 😄
rugged comet
dense lagoon
does --workers 2 make trainign faster?
Try it out and see what happens.
dense lagoon
anmyone have problems with labelimg annotaiutosn randomly moving?
 weak forge
rare socket
My neural network trains itself by making the agents compete against each other....
weak forge
rare socket
My neural network trains itself by making the agents compete against each other....
does anyone know what this method is called?
dense lagoon
 unique flame
weak forge
does anyone know what this method is called?
unique flame
weak forge
does anyone know what this method is called?
I don't know the method, but the field is Reinforcement learning. So you could check out there.
weak forge
unique flame
I don't know the method, but the field is *Reinforcement learning*. So you could...
alr, thank you 🙏
dense lagoon
WARNING: Retrying (Retry(total=4, connect=None, read=None, redirect=None, status=None)) after connection broken by 'SSLError("Can't connect to HTTPS URL because the SSL module is not available.")': /simple/numpy/
WARNING: Retrying (Retry(total=3, connect=None, read=None, redirect=None, status=None)) after connection broken by 'SSLError("Can't connect to HTTPS URL because the SSL module is not available.")': /simple/numpy/
WARNING: Retrying (Retry(total=2, connect=None, read=None, redirect=None, status=None)) after connection broken by 'SSLError("Can't connect to HTTPS URL because the SSL module is not available.")': /simple/numpy/
WARNING: Retrying (Retry(total=1, connect=None, read=None, redirect=None, status=None)) after connection broken by 'SSLError("Can't connect to HTTPS URL because the SSL module is not available.")': /simple/numpy/
WARNING: Retrying (Retry(total=0, connect=None, read=None, redirect=None, status=None)) after connection broken by 'SSLError("Can't connect to HTTPS URL because the SSL module is not available.")': /simple/numpy/
ERROR: Could not find a version that satisfies the requirement numpy>=1.18.5 (from versions: none)
ERROR: No matching distribution found for numpy>=1.18.5
WARNING: pip is configured with locations that require TLS/SSL, however the ssl module in Python is not available.```Hey,
I'm trying to multiply polynomials using SymPy library.
Why do I get different results for these two:
!e
# imports
import numpy as np
import sympy as sp
from sympy import latex
from IPython.display import display, Math

sp.init_printing()

def dp_math(*args):
    for arg in args:
        display(Math(arg))

def dp_expr(*args):
    for expr in args:
        dp_math(latex(expr))

# Multiply Polynomials

p1 = sp.Poly(4 * x**2 - 2*x)
p1 = sp.Poly(x**3 - 1)

p3 = p1 * p2
dp_expr(p3)

p3 = 4 * x**2 - 2*x * x**3 - 1
dp_expr(p3)
 lapis sequoia
should i learn plotly or matplotlib for data science
 lusty light
lapis sequoia
should i learn plotly or matplotlib for data science
lusty light
lapis sequoia
should i learn plotly or matplotlib for data science
for sure
lusty light
lapis sequoia
already did pandas and numpy
it is a good start, matplot and seaborn will help you to turn your data more visible
weak forge
unique flame
I don't know the method, but the field is *Reinforcement learning*. So you could...
seems to be called neuroevolution, just thought I'd let you know 😁
clear ibex
clear ibex
Hey,
I'm trying to multiply polynomials using SymPy library.
Why do I get diff...
is it a wrong place to ask about this?
serene scaffold
clear ibex
is it a wrong place to ask about this?
this is the place to ask about sympy
 hazy bobcat
What's a good way to display tables? It would be nice to make them into images that look nice, that I can automatically post somewhere
wooden sail
clear ibex
Hey,
I'm trying to multiply polynomials using SymPy library.
Why do I get diff...
you forgot to use parentheses in the second expression, so you only multiplied 2x by x^3 instead of multiplying the two polynomials
something seems wrong with the first result as well, since the product of two binomials should have 4 terms
clear ibex
wooden sail
you forgot to use parentheses in the second expression, so you only multiplied 2...
Totally missed that, thanks.
 azure crystal
Does someone know why I keep getting a Out of Memory (OOM) error when trying to train my AI? I am training with a very large dataset and already tried some things like reducing the batch size. Does someone know how I can fix this issue?
austere swift
you might have to shrink the model if shrinking the batch size didn't work
it depends where you get the error
does the error happen during the model initialization or during the training loop?
 astral pollen
Since I am impatient, I quite often use enumerate to print a counter for data processing jobs, so that I can see the progress. I always assumed that it slowed things down. Today I decided to check with a basic minimal bit of code. It is 25x slower!! 
%%time
for i in range(1,100000):
    i = 1/23
print('\n')
This one was 8.47 ms.
%%time
for c,i in enumerate(range(1,100000)):
    i = 1/23
    print('\r' + str(c), end = '')
print('\n')
And this one was 213 ms.
wooden sail
astral pollen
Since I am impatient, I quite often use `enumerate` to print a counter for data ...
printing is very slow, yes
astral pollen
wooden sail
printing is very slow, yes
ah, so it's the printing which is worse
wooden sail
yeah. try removing the print and time them again
azure crystal
austere swift
does the error happen during the model initialization or during the training loo...
during the initialization
austere swift
azure crystal
during the initialization
then you need to shrink the model
azure crystal
austere swift
then you need to shrink the model
By reducing the layers and units?
austere swift
azure crystal
By reducing the layers and units?
yes
azure crystal
alright thx
austere swift
there are also some other tricks which may help, such as using mixed precision or parameter offloading
parameter offloading will reduce memory but also slow it down, and mixed precision will reduce memory and make it faster but may reduce the accuracy a little bit (mixed precision is a pretty good thing in general, since the accuracy decrease is not that much)
fervent hatch
is having an R2 of 1 good?
agile cobalt
fervent hatch
is having an R2 of 1 good?
1 is the maximum possible score, i.e. perfectly fit the data
if you got 1, you're almost definitely overfitting to the data
fervent hatch
so is it bad or good?
agile cobalt
way too good = there's a high chance that something is wrong
azure crystal
fervent hatch
so is it bad or good?
Split the data into training and test data and then test the model on the test data aswell. Also add some dropouts to your model. You probably have a small dataset for the model to reach 1.
fervent hatch
i did that and used the compare_models function in pycaret and got like 3 models with r2 of 1
azure crystal
How big is your training data?
fervent hatch
im using the mushroom classification dataset
azure crystal
Whats the shape of it?
fervent hatch
(4874, 22) for my training data
azure crystal
Do you ahve some dropouts in your model?
azure crystal
fervent hatch
(4874, 22) for my training data
Thats not really big but should also not result in 100%
fervent hatch
im probably doing something wrong lol
azure crystal
If it predicts everything right there is no problem but 1 is very unlikely
fervent hatch
also can i know like what's the difference between label and one hot encoding
azure crystal
Are you using pytorch?
fervent hatch
nope im using sklearn
 plucky holly
developed a basic gradient descent function to make my linear regression prject, but the error graph is in creasing for some weird reason

y is error, x is iterations
my sme function, dont think this is the problem tho
def error (m, x, c, t):
    N = x.size
    e = sum(((m*x+c)-t)**2)
return e*1/(2*N)```assuming that you're plotting it on the test data, that is possible - after it reaches the peak, it starts to overfit to the noise in the training data
you probably should use (...).sum() instead of sum(...) though
plucky holly
agile cobalt
assuming that you're plotting it on the test data, that is possible - after it r...
so reduce iterations?
agile cobalt
first I'd plot what it looks like on the training data to double check
plucky holly
similar
wait no thats train data graph only, mb
Line seems to be fitting just right, error graph is the one that is weird
 azure crystal
Someone knows why my 3090 (physical) is training faster than for example 8xTesla V100 (Cloud)?
 steady basalt
Do u guys build ur models as classes?
 bronze prism
is there a way to delete data according to the number of data?
For the example in the picture, the minimum number of 180 (Yerden Isıtma, Klima, Soba....)
 steady basalt
Or do u normally tackle a task and drop it so no need
azure crystal
steady basalt
Do u guys build ur models as classes?
At first I am creating my models in a jupyter notebook, because I often need to edit variables etc during the process. And when I have a first stable version I am converting the whole file into a class
azure crystal
bronze prism
is there a way to delete data according to the number of data?
For the example ...
Of an array?
bronze prism
data from csv file pandas.read_csv
azure crystal
df.drop(index=df[df['Column_name'] < 180].index, inplace=True)
bronze prism
azure crystal
you can just convert it
Is there a way to convert the word "kombi" to integer?
bronze prism
It is not the data that is the number, quantity of the data.
Df.value_counts()
Data on the left, number of data on the right
bronze prism
azure crystal
how big is your dataframe
10 rows 2000 line
azure crystal
Can you send a sample @bronze prism
 wicked shadow
I'm a noob so this question might sound stupid, but being a pure python implementation, doesn't that involve compromising on efficiency. From what I understand PyTorch and TensorFlow are fast because they're built with C/C++ thus with efficiency in mind? Anyway, I've still given it a star, I'm always open to checking out what cool things other devs are building.
P.S. please ping me when replying so that I don't miss your reply.
bronze prism
There are 15 data in the example, there are 13 Kombi, 1 Merkezi (Pay Ölçer) and 1 Klima in the "IsinmaTipi" column.
I'm looking for a way to discard data that is less than 2 according to the number of data
@azure crystal
I don't want to do these in the form of discarding the "Merkezi (Pay Ölçer)" and the "Klima" because there are close to 10 columns and each column has different data. i need a way to delete by data quantity
could i explain my problem? @azure crystal
 bold pumice
wicked shadow
I'm a noob so this question might sound stupid, but being a pure python implemen...
bold pumice
wicked shadow
I'm a noob so this question might sound stupid, but being a pure python implemen...
@wicked shadow I agree that it's great for efficiency, but it's not good for people to understand how it works under the hood. neograd https://github.com/pranftw/neograd was built intentionally for educational purposes so that it's easy for people to go through the code and get an idea of how everything works. C/C++ code can be quite messy and is not as readable as Python

GitHub
A deep learning framework created from scratch with Python and NumPy - GitHub - pranftw/neograd: A deep learning framework created from scratch with Python and NumPy
 bronze kelp
Can someone explain to me why we use np.meshgrid when doing a contour plot rather than just entering the x and y arrays into said function to get the z coordinate and plotting that directly?
lapis sequoia
Hello, i wanna graph something using plotly or matplotlib, doesn't really matter but plotly is preferred
i have
x = [1, 2, 3, 4, 5, 6, 7, 8, 9, 10, 11, 12, 13, 14, 15, 16, 17, 18, 19, 20, 21, 22, 23, 24, 25, 26, 27, 28, 29, 30, 31, 32]
and
y = [1, 2, 3, 5, 8, 13, 21, 34, 55, 89, 144, 233, 377, 610, 987, 1597, 2584, 4181, 6765, 10946, 17711, 28657, 46368, 75025, 121393, 196418, 317811, 514229, 832040, 1346269, 2178309, 3524578]
how to convert this into a dataframe so that i can plot this
azure crystal
@bronze prism When which number goes below 2?
lapis sequoia
lapis sequoia
Hello, i wanna graph something using plotly or matplotlib, doesn't really matter...
can anybody help, no one has helped so far...
i am so lost
great
azure crystal
lapis sequoia
Hello, i wanna graph something using plotly or matplotlib, doesn't really matter...
df = pd.DataFrame(np.array([x, y]))
arctic wedgeBOT
Missing required argument
code
lapis sequoia
i need to specify the columns?
azure crystal
you dont have to but then it is not easy to work wit hthem
do you need a dataframe or an array?
lapis sequoia
dataframe
azure crystal
#data-science-and-ml message @lapis sequoia do it like this
lapis sequoia
ValueError: Value of 'x' is not the name of a column in 'data_frame'. Expected one of ['Result', 'Number'] but received: x
what does this mean
lapis sequoia
azure crystal
https://discord.com/channels/267624335836053506/366673247892275221/1037085944328...
ok
 plush jungle
I'm coding an ai to eat food in pacman
and I'm giving it info on where the food is to decide where to move next, but it gets stuck when it reaches the midpoint between food pellets
I wonder if I should make it move towards the nearest food instead of the best average food position
although wait
that would still do the same thing
if it's in between two foods of equal distance
azure crystal
plush jungle
I wonder if I should make it move towards the nearest food instead of the best a...
yes if it always just goes to the average it will never reach food
plush jungle
so how can I overcome that?
lapis sequoia
my problem is solved. i used a different library.
plush jungle
what should it do if both food pellets are of equal distance
azure crystal
plush jungle
so how can I overcome that?
But why exactly do you need an ai for that, that is a task a normal program can do
plush jungle
azure crystal
But why exactly do you need an ai for that, that is a task a normal program can ...
it's for a school project
I'd ask the professor but office hours are scarce
azure crystal
plush jungle
what should it do if both food pellets are of equal distance
you should not do anything, the ai has to decide to which food it goes based on other conditions like obstacles
plush jungle
azure crystal
you should not do anything, the ai has to decide to which food it goes based on ...
but not doing anything would make it stand still
which is what it's doing now
which is why it's losing
azure crystal
the ai should get some data like obstacles, food distance, etc.. and then output a value which indicates in which direction it should go
and then you code a that after the output the character goes in that direction
lapis sequoia
matplotlib - what's causing this
 plush jungle
azure crystal
the ai should get some data like obstacles, food distance, etc.. and then output...
plush jungle
azure crystal
the ai should get some data like obstacles, food distance, etc.. and then output...
it has five actions it can take (up, down, left, right, stop)
my function evaluates the value of each action, but when it is in a position equidistant from two food pellets, stop is the highest value
so how do I get it to move towards one of them instead of just stopping
 boreal gale
lapis sequoia
matplotlib - what's causing this
boreal gale
lapis sequoia
matplotlib - what's causing this
did you forget to add a ; at the end of the cell?
by default it's showing you the last return value of the cell
azure crystal
plush jungle
it has five actions it can take (up, down, left, right, stop)
my function evalua...
Is it even connected to a model atm?
plush jungle
azure crystal
Is it even connected to a model atm?
the point of the project is to implement minimax, alpha beta pruning, and expectimax, but the first part is just to make a reactive algorithm that wins regularly in a simple environment
so I'm not on the ai part quite yet, I'm just supposed to make the policy function that causes it to avoid the ghost and eat all the food
I've just been doing
value = 1/average_squared_distance_from_food - 1/squared_distance_from_ghost```but when it's equidistant from the food then not moving becomes the highest value, which causes it to get stuck
tidal bough
well, do something like -min_distance_from_food then
plush jungle
tidal bough
well, do something like -min_distance_from_food then
you mean only consider the food pellet that is the closest?
tidal bough
Yeah. It has obvious issues, but so do most naive strategies.
 sweet crypt
Hi is this a good place to ask for MCTS related question?
plush jungle
tidal bough
Yeah. It has obvious issues, but so do most naive strategies.
wait how is that different from what I'm already doing
tidal bough
Being equidistant to two pieces of food is no longer a local equilibrium - it's profitable to go towards either (doesn't matter which) of the pieces.
plush jungle
what is min_distance_from_food
there are two food pellets of equal distance
which one would be considered minimum
azure crystal
@plush jungle I still dont really understand what this has to do with machine learning
plush jungle
azure crystal
<@433856634192789504> I still dont really understand what this has to do with ma...
it doesn't
azure crystal
or ai
plush jungle
the class is about AI, which is a superset of machine learning
the next project is to do the same thing with a neural net
azure crystal
plush jungle
I'm coding an ai to eat food in pacman
.
plush jungle
the point is to compare naive method with tree based method with machine learning methods
plush jungle
yeah I have a simple type of game where there are no walls, and only one ghost. I have the coordinates of the ghost and the food pellets
I have to take each possible move (left, right, up, down, stop) and give it a value
azure crystal
can you send one example coordinate?
azure crystal
alright I just had to know the format
plush jungle
oh i see
if I do it like this
value = 1/average_squared_distance_from_food - 1/squared_distance_from_ghost```then it avoids the ghost and goes towards the food really well, right up until it finds itself between two food pellets
then it freezes forever
azure crystal
tahts because the steps will get infinitly smaller
you have to set a min step size like @tidal bough said
plush jungle
what do you mean by step
azure crystal
I think he meant this by min distance from food
tidal bough
plush jungle
which one would be considered minimum
Uh, doesn't matter? The min distance is just a number. Either way, a move in either direction will decrease the min distance.
azure crystal
but you can say that each movement cant be lower than for example 1 coordinate
plush jungle
like this?
value = 1/average_squared_distance_from_food - 1/squared_distance_from_ghost + min(food_distances)```then you will just jump right to the nearest food
plush jungle
yeah I don't really understand what either of you are saying. can you explain it like i'm 5?
tidal bough
- min(food_distances) would make it run away from nearest food, you want - 😛
tidal bough
plush jungle
yeah I don't really understand what either of you are saying. can you explain i...
being close to food good, being close to ghost bad, so value = -min(food_distances) + ghost_distance would be a basic strategy, optionally with some coefficients
azure crystal
or you will be moving on just one axis
bronze prism
azure crystal
<@411985781624799237> When which number goes below 2?
In the example I send, when you do df.IsinmaTipi.value_counts(), you will see that there are 3 types of data and they are 13-1-1 in number. I want to delete the ones whose numbers are below 2.
plush jungle
tidal bough
being close to food good, being close to ghost bad, so `value = -min(food_distan...
ok that can't be right though, since it's right next to a food pellet and it refuses to eat it even though the ghost is on the other side
I check the distance between every food pellet and pac man
tidal bough
ah, makes sense, because eating the pellet would make a different one closest and so increase the min distance
so you want a term for number of pellets eaten, too, and it has to be big enough to be worth the change in distance.
plush jungle
if the next move would consume a pellet, then distance would be 0 for that pellet
but if there is a pellet directly to the left and right of pacman what should it do
tidal bough
well, then moving to the left and moving to the right are equally good moves
plush jungle
plush jungle
if I do it like this
```py
value = 1/average_squared_distance_from_food - 1/squa...
this has gotten me the best result so far
how do I modify this to avoid getting stuck
 shadow halo
Hello guys, I wanna educate myself on Time Series and saw so much books treating the subject. Does anyone have recommendations?
 elfin venture
best way to remove/replace obviously bad data like this?
 desert oar
rugged comet
https://www.tensorflow.org/api_docs/python/tf/keras/layers/TextVectorization
Scr...
desert oar
rugged comet
https://www.tensorflow.org/api_docs/python/tf/keras/layers/TextVectorization
Scr...
i see, yeah you should be able to pass that to an embedding layer without a problem
this isn't dumb! but yes it is simple and usually works well in practice
elfin venture
I guess I was overthinking it lol, never even crossed my mind to do that... typical
desert oar
elfin venture
I guess I was overthinking it lol, never even crossed my mind to do that... typi...
another common practice is to look at a rolling mean or median of the data and flag data points that are greater than some number of standard deviations or median absolute deviations from the mean/median
trivia: the "mean and standard deviation" cutoff is the 1-d special case of mahalanobis distance https://en.wikipedia.org/wiki/Mahalanobis_distance
The Mahalanobis distance is a measure of the distance between a point P and a distribution D, introduced by P. C. Mahalanobis in 1936. Mahalanobis's definition was prompted by the problem of identifying the similarities of skulls based on measurements in 1927.It is a multi-dimensional generalization of the idea of measuring how many standard dev...
it's also interesting to read about median absolute deviation in its own right: https://en.wikipedia.org/wiki/Median_absolute_deviation#MAD_using_geometric_median
In statistics, the median absolute deviation (MAD) is a robust measure of the variability of a univariate sample of quantitative data. It can also refer to the population parameter that is estimated by the MAD calculated from a sample.
For a univariate data set X1, X2, ..., Xn, the MAD is defined as the median of the absolute deviations from the...
 tidal magnet
Good night guys.
Are those the best channels to learn PySpark for work with AWS Glue?
serene scaffold
tidal magnet
Good night guys.
Are those the best channels to learn PySpark for work with AWS...
this is the channel to ask about PySpark. idk what AWS Glue is.
If you have a question, please ask your whole question all at once, so that no one has to interview you to figure out if they can help you.
desert oar
tidal magnet
Good night guys.
Are those the best channels to learn PySpark for work with AWS...
i would start by just learning some pyspark basics. aws glue appears to have its own interface that "wraps" some functionality from pyspark, but it will be best if you understand pyspark itself first.
this DynamicFrame thing looks unique to Glue, but again: it won't make sense unless you understand pyspark first
tidal magnet
serene scaffold
If you have a question, please ask your whole question all at once, so that no o...
Ok, I understand! Thanks
tidal magnet
desert oar
i would start by just learning some pyspark basics. aws glue appears to have its...
I know the basics fundaments of PySpark, in my work, we use AWS Glue with PySpark.
But, i`m struggling with the DynamicFrame hahaha
desert oar
tidal magnet
I know the basics fundaments of PySpark, in my work, we use AWS Glue with PySpar...
if you have a specific question about it, go ahead and ask. otherwise this falls into "don't ask to ask" territory.
(i don't think we have many or any serious Glue users here though)
(but i am pretty good at reading docs so i can try to advise)
tidal magnet
desert oar
if you have a specific question about it, go ahead and ask. otherwise this falls...
Ohh okay, thanks for help.
mint palm
my AUC is varying way too much like 0.6 to 0.7 to 0.5, without seeding.
I first thought maybe it is the data shuffling that this is happening, so I pre shuffled the data and ran it 3 times, so that batch produced is same. but still the AUC is varying too much.
What can be the issue? also does this mean the initialisation of weight and bias are the ONLY thing that is causing this fluctuation, as it seems all other things are not random?
 rose loom
hello friends🙃 how can i find min and max value in 20 iterations with genetic algorithm? i want to writing simple code. can you help me?
rugged comet
desert oar
i see, yeah you should be able to pass that to an embedding layer without a prob...
Thanks for the reply. My question wasn't really whether I could do it, it was more like 'is it logical to do it'. The reason I'm hung up on this is because the Embedding layer turns positive integers (indexes) into dense vectors of fixed size. This is fine however, multi-hot text vectorization doesn't return the indexes of the words.
Now that I write it out, it's sounding more like it doesn't make sense to do it this way.
desert oar
rugged comet
Thanks for the reply. My question wasn't really whether I could do it, it was mo...
ah, i see. i agree that doesn't make a lot of sense. now that i am reading it again, it looks like you should just use Dense with multi_hot
Embedding creates a separate vector for each word, that's why it needs indexes
whereas multi_hot is more like one vector for each document (or one vector aggregated together for all the documents in the batch)
wooden sail
technically nothing stops you from embedding the multihot output though
rugged comet
wooden sail
technically nothing stops you from embedding the multihot output though
That's right.
wooden sail
whether it makes sense for the task is a different question 😛
desert oar
that's what i thought, but now that i'm looking at the docs more, it seems like it won't give sensible results
rugged comet
wooden sail
whether it makes sense for the task is a different question 😛
Haha yeah that's what I was trying to get at.
wooden sail
why wouldn't it be sensible? it detects specific combinations of tokens, quantity notwithstanding
what is the task you're working on?
desert oar
unless i misunderstand, tensorflow's multi-hot doesn't produce a sequence of tokens, it produces a bag of words
so the input to Embedding will just be [1, 0, 0, 0, 1, 0, 0, 0, ...], and the order thereof will be meaningless
wooden sail
not quite like bag of words though. from what i saw in the docs rn, it does not keep the count
wooden sail
still, combinations of words that occur together will likely form a low dimensional vector space, and so embedding makes sense
rugged comet
wooden sail
what is the task you're working on?
Specifically, I'm trying to preprocess some text data for a keras model. I thought I could first vectorize the text and then use an embedding layer to reduce the sparseness. The reason I went with multihot for my TextVectorization layer is because I needed a way to pad my sequences to be all the same length.
There might be another way to do that.
desert oar
wooden sail
still, combinations of words that occur together will likely form a low dimensio...
that's what i was thinking with my original response. but tf Embedding won't do that properly from what i'm reading here
wooden sail
my best answer would be to try both and see. depending on what it is you want from the text, it may or may not work
it entirely depends on how the text structure you're interested in depends on multiplicity
desert oar
but won't it think that there are just 2 words in the doc? with indexes 0 and 1
rugged comet
pad_to_max_tokens doesn't work with the regular output mode for TextVectorization so I went with multihot.
wooden sail
desert oar
but won't it think that there are just 2 words in the doc? with indexes 0 and 1
why?
desert oar
because that's what it says multi_hot returns
"multi_hot": Outputs a single int array per batch, of either
vocab_sizeormax_tokenssize, containing 1s in all elements where the token mapped to that index exists at least once in the batch item.
am i totally misunderstanding this?
wooden sail
multihot just detects whether tokens appear. what those tokens are depends on how you make your vectorization
it could be all words in the text, or splitting into syllables, or whatever you like
in something like detecting whether the reader is being cursed at, multiplicity wouldn't matter, but combinations of words occurring together would. then this would make sense, for example
wooden sail
desert oar
> "multi_hot": Outputs a single int array per batch, of either `vocab_size` or `...
i think so, its 0 or 1 per token, whatever your tokens are
desert oar
right, so that would produce a binary array [1,0,0,1,...] in arbitrary order
wooden sail
well, in whatever order your token dict is in
desert oar
right. and as far as i can tell, Embedding isn't equipped to produce sensible results from that, and it will treat 1 and 0 as the word indexes
wooden sail
no
what embedding does is take a vector of ints and project to a lower dimensional vector space
desert oar
yes, but the ints are specifically treated as indexes into the vocabulary
wooden sail
that has nothing to do with words or tokens or anything else
ah, i see what you mean regarding the meaning of the ints in the vector, but that can anyway be modified by you
still, the embedding would make sense though. you're assigning it extra meaning yourself
desert oar
yeah, you can post-process it back into a stream of indexes. but i'd still be worried that Embedding will "learn" from that order, when the order has no meaning
desert oar
well sure, in the same way that C casting doesn't care what the underlying bytes mean
oh, Embedding doesn't care about sequence order?
wooden sail
you can think of embedding as a dense layer, if it helps you
if you change the order of the vector, the weights of a dense layer move around, sure, but that's inconsequential
desert oar
i'm talking about the order of the tokens provided in the input
wooden sail
it's just a rectangular matrix. you can shuffle the elements of the vectors as you like and modify the matrix accordingly
desert oar
are you sure that Embedding specifically works that way? i thought it looked at surrounding words, like skip-gram word2vec
i am probably wrong on this
wooden sail
i'm certain 🙂 embedding is just a projection matrix
desert oar
i see, there's actually skip-gram tutorial in here and they implement all the skip-gram stuff as pre-processing
wooden sail
now, whether keras' implementation works nicely with multihot by default is also a separate matter, since as we said above we might have to pre process
desert oar
hm... wait. that's their data generating script
ah, i see. yeah, they're using that to generate a "label" for each window

TensorFlow
wooden sail
so one thing to be done, for example, is to take the multihot output and use that as a fancy indexing to make a vector of ints for the words, and pad them to some length. then embed this.
though again, whether this will work for you depends entirely on what you're looking for in the text. this ignores order and multiplicity, and just looks and words occurring together
wooden sail
desert oar
ah, i see. yeah, they're using that to generate a "label" for each window
right, it looks at groups of words and yields some sort of identifying vector for them
rugged comet
After using my new TextVectorization, the train data and the test data have different shapes.
    assert x_train_text.shape[1] == x_test_text.shape[1]
AssertionError
This is why I wanted to 'pad_to_max_tokens'. I tried looking at using tf.pad to potentially get them to the same shape (not including the batch dimension). However, I can't understand how the paddings arg relates to the output.
https://www.tensorflow.org/api_docs/python/tf/pad
wooden sail
maybe the keras padder is more intuitive? https://www.tensorflow.org/api_docs/python/tf/keras/utils/pad_sequences
desert oar
@wooden sail this helped me understand what Embedding does, if you ever need to explain it to someone else: https://stackoverflow.com/a/53101566/2954547
it's an optimized version of what you'd get if you used TextVectorization(output_mode='multi_hot') directly with Dense after it
Stack Overflow
Keras documentation isn't clear what this actually is. I understand we can use this to compress the input feature space into a smaller one. But how is this done from a neural design perspective? Is...
rugged comet
wooden sail
maybe the keras padder is more intuitive? https://www.tensorflow.org/api_docs/py...
Thank you. I understand how to use this better.
Can you think of how pre-padding or post-padding might have different results? How could I decide which one to use?
wooden sail
i wouldn't think it matters much, but try both
the embedding will take that into account
wooden sail
desert oar
<@467435887236612106> this helped me understand what `Embedding` does, if you ev...
as i said 😛 but yeah, i'll look for better explanations. i tend to think of the stuff in linear algebra, not code functions
which admittedly may not be as intuitive
desert oar
wooden sail
as i said 😛 but yeah, i'll look for better explanations. i tend to think of the...
my confusion was that i didn't realize it was just a matrix multiplication. you said it was a projection, but i wasn't sure of what or onto what.
desert oar
no, i mentioned that earlier
wooden sail
wooden sail
it's just a rectangular matrix. you can shuffle the elements of the vectors as y...
hmm
wooden sail
wooden sail
you can think of embedding as a dense layer, if it helps you

i'm just being annoying though 😛 sorry for the bad explanation
desert oar
no, i was very confused. not your fault!
wooden sail
the implementation part is also important btw. i call it "just a matrix", but as you see from that SO post, it's not done like that in code cuz that would be super wasteful
that's always a pain point. the math is nice on paper, but you would never wanna do it like that in code
desert oar
what i was hung up on was how the "it's an index lookup to a bunch of vectors" actually translated back into the math
is this right?
the input for each document is a matrix of len(doc) × len(vocab), where each row has exactly one 1 in it and all 0s elsewhere.
the weights are a matrix of len(vocab) × embedding_dim
wooden sail
yeah
desert oar
makes perfect sense now
wooden sail
the way i would think of it is like a change of basis (i.e. a matrix mult with an invertible matrix) followed by a matrix mult that may not be (and is usually not) invertible
but that's neither here nor there
linear algebra is good for your soul
rugged comet
I might be misunderstanding how this works. But why does the Embedding layer make the shape different from the input? Like why does it go from (None, 126) to (None, 126, 64)? I would expect it to output (None, 64) instead.
 wooden sail
right, so, what the embedding layer will do is take each entry of your input and map it to a vector
that's where the conversion from multihot to index set is needed
otherwise you could instead directly work with the multihot output by connecting it directly to a dense layer if you like
embedding is powerful when working with sparse arrays, but many of them at the same time
not with a single one
so either you do some preprocessing there, or you consider several sentences/texts at the same time
rugged comet
To be clear, I'm not using mutli-hot anymore. I'm using int mode for the TextVectorization followed by the Embedding layer. By the way, you don't see the TextVectorization layer in the model diagram because it's done outside the model.
Can I show you my code?
wooden sail
i don't have time to check code rn. at any rate, it looks to me like int mode is very similar to one hot, so everything i said applied directly
each token is assigned an int, yeah? so it vectorizes text into a sequence of ints that are like keys to a dictionary of tokens
you'd still have to consider several strings simultaneously to get an advantage from using embeddings, and this advantage would be as compared to 1 hot. the result will be bigger than the int mode output
actually scratch that, i misremembered again what is being encoded
rugged comet
wooden sail
each token is assigned an int, yeah? so it vectorizes text into a sequence of in...
[[  48    3   61 ...    0    0    0]
 [ 487   66    5 ...    0    0    0]
 [2788   59    3 ...    0    0    0]
 ...
 [  36    5    2 ...    0    0    0]
 [   4   76  147 ...    0    0    0]
 [  73    9   78 ...    0    0    0]]
Yeah. I think I understand that part.
wooden sail
you'd still get an advantage vs int mode
right, so that's like a collection of texts
the idea is to embed the texts into vectors whose length is smaller than the length they have at the moment
but to do that, you need to find a good embedding for all of the texts together
rugged comet
wooden sail
the idea is to embed the texts into vectors whose length is smaller than the len...
Yes, this is what I wanted to try.
rugged comet
wooden sail
but to do that, you need to find a good embedding for all of the texts together
Is this possible?
wooden sail
that's how it should be done, yes
but then the input is the whole matrix you shared above, not just one text
wooden sail
rugged comet
```
[[ 48 3 61 ... 0 0 0]
[ 487 66 5 ... 0 0 0]
[...
this whole mat
rugged comet
My first instinct is to move the Embedding layer outside the model like I did with the TextVectorization. This way allows me to find an embedding for all of the data at once. The way I understand it, if the Embedding layer is in the model, it will only find embeddings for the current batch it's working with.
wooden sail
yeah
rugged comet
It's kind of odd to me that one would use layers outside of a model.
wooden sail
it'd be called "preprocessing"
and the whole idea of "layer" is made up
as we discussed above, it's essentially a matrix multiplication. standard preprocessing stuff
on the other hand btw, you can learn the embedding layer outside ONCE on a set of training data, then keep it fixed and constant INSIDE your model
you know, like when you use max pooling or flattening layers (flattening is closer to it)
rugged comet
wooden sail
on the other hand btw, you can learn the embedding layer outside ONCE on a set o...
Would this be like Layer.adpat(all_data) and then somehow pass the learned layer to the model builder function?
wooden sail
i don't remember the keras syntax so i can't say
rugged comet
Layer.adapt is also used for Normalization layers to find the mean and variance of all the data.
rugged comet
wooden sail
i don't remember the keras syntax so i can't say
Syntax aside, I think that's the general idea you were trying to tell me.
 celest vine
Hey
rugged comet
Hello
celest vine
I wanted to create a program that takes a image (face portrait) as input and then give as output Anime version of the face portrait.
Can this be done?
rugged comet
Yes.
celest vine
What libraries do I need to use for that?
rugged comet
I don't know. I just know that it can be done because it's been done before.
celest vine
Can it be done using GAN?
rugged comet
Try it out and see if it can be done.
celest vine
Okayy
 fossil ivy
Hey everyone. I have data with 1,000,000 entries of this structure. I am interested in creating a Markov Chain from the significant wave height (Hs). For this purpose, I need to create wave height bins of 0.25m. So a value of 0.13 should be assigned to 0.25, a value of 0.12 should be assigned 0. Has anyone done something similar and could hint me in the right direction?
 rugged comet
fossil ivy
Hey everyone. I have data with 1,000,000 entries of this structure. I am interes...
fossil ivy
rugged comet
fossil ivy
Hey everyone. I have data with 1,000,000 entries of this structure. I am interes...
fossil ivy
eh.. I see what it does but Ive never worked with TensorFlow, is it a package to be imported in python?
Or do I need to access it via API
rugged comet
fossil ivy
eh.. I see what it does but Ive never worked with TensorFlow, is it a package to...
Yeah, you import it.
https://www.tensorflow.org/probability
TensorFlow
A library to combine probabilistic models and deep learning on modern hardware (TPU, GPU) for data scientists, statisticians, ML researchers, and practitioners.
fossil ivy
Alright, thanks alot for the recommendation! i will look into it then
rugged comet
You're welcome.
fossil ivy
(Would've said no to an API tbh, tried alot to use APIs to get weather data but it always f'd with me(
lapis sequoia
What are some examples of beginner AI projects based on the concepts given below? Preferably a full-stack/GUI application.
Uninformed and Informed Search, Heuristic functions, Local Search, Genetic Algorithms, Game Playing, Minimax and Alpha Beta Pruning, CSP, Planning (Propositional logic,POP,and planning graphs) (ping when replying)
 supple wyvern
I'm thinking of making this ai model which would predict my future pay based on my past pays and it differs every day. If I make data for that, how can I lay it out?
It should have pay and date, I think there should be more but I forgot
Actually
I'm being dumb
idk what i'm saying -_- nvm
dense lagoon
NotImplementedError                       Traceback (most recent call last)
File C:\TCCHistly\yolov5\train.py:630
    628 if __name__ == "__main__":
    629     opt = parse_opt()
--> 630     main(opt)

File C:\TCCHistly\yolov5\train.py:524, in main(opt, callbacks)
    522 # Train
    523 if not opt.evolve:
--> 524     train(opt.hyp, opt, device, callbacks)
    526 # Evolve hyperparameters (optional)
    527 else:
    528     # Hyperparameter evolution metadata (mutation scale 0-1, lower_limit, upper_limit)
    529     meta = {
    530         'lr0': (1, 1e-5, 1e-1),  # initial learning rate (SGD=1E-2, Adam=1E-3)
    531         'lrf': (1, 0.01, 1.0),  # final OneCycleLR learning rate (lr0 * lrf)
   (...)
    557         'mixup': (1, 0.0, 1.0),  # image mixup (probability)
    558         'copy_paste': (1, 0.0, 1.0)}  # segment copy-paste (probability)

File C:\TCCHistly\yolov5\train.py:348, in train(hyp, opt, device, callbacks)
    346 final_epoch = (epoch + 1 == epochs) or stopper.possible_stop
    347 if not noval or final_epoch:  # Calculate mAP
--> 348     results, maps, _ = validate.run(data_dict,
...
FuncTorchGradWrapper: registered at C:\actions-runner\_work\pytorch\pytorch\builder\windows\pytorch\aten\src\ATen\functorch\TensorWrapper.cpp:189 [backend fallback]
PythonTLSSnapshot: registered at C:\actions-runner\_work\pytorch\pytorch\builder\windows\pytorch\aten\src\ATen\core\PythonFallbackKernel.cpp:148 [backend fallback]
FuncTorchDynamicLayerFrontMode: registered at C:\actions-runner\_work\pytorch\pytorch\builder\windows\pytorch\aten\src\ATen\functorch\DynamicLayer.cpp:484 [backend fallback]
PythonDispatcher: registered at C:\actions-runner\_work\pytorch\pytorch\builder\windows\pytorch\aten\src\ATen\core\PythonFallbackKernel.cpp:144 [backend fallback]``` any reason why this randomly happened? 184 # Trainloader
--> 185 train_loader, dataset = create_dataloader(train_path,
...
--> 183 main_mod_name = getattr(main_module.__spec__, "name", None)
184 if main_mod_name is not None:
185 d['init_main_from_name'] = main_mod_name
AttributeError: module '__main__' has no attribute '__spec__'```Re ran my training and now it says this, i tried to delete all and restart, it runs for a epoch, then errors, I run again and gives that error, keeps repeating, idk how to fix 😦
 umbral raptor
Working on a personal task for product taxonomy. I want to map products based on attributes and tags. At first I only have the title of the product but I am planning also exploit product description. Is there any pretrained model (to be finetuned later) that will extra tags and attributes from text? I have read about GPT-3, available also in Hugging Face, but I don't know much about that. Any recommendations ?
 keen notch
hey how can i get my plot command to calculate the ratio.
arctic wedgeBOT
Hey @keen notch!
You either uploaded a .txt file or entered a message that was too long. Please use our paste bin instead.
Hey @keen notch!
You either uploaded a .txt file or entered a message that was too long. Please use our paste bin instead.
keen notch
 wooden sail
share the link to the hastebin instead
 mystic crater
Hi. I'm working on a Tensorflow project with a Coral TPU USB. I was wondering if there is any way to reduce down the inference time on an image classification program without having to write my own library for invoking the Interpreter (as silly as that sounds, I have no idea what else to do).
I'm not really trying to perfect an ML model, it's more of trying to probe into the hardware to understand how it works.
keen notch
dw I think I fixed it, thank you:)
 heavy crow
I'm having a problem with my custom training function using tensorflow:
with tf.GradientTape() as tape:
    # forward pass
    batch = tf.concat([x, y], axis=0)
    # get features
    features = projector(backbone(batch))

    tf.print(features)

    # split into x and y
    a, b = tf.split(features, 2, axis=0)

    loss = nt_xent_loss(a, b)

    # backward pass
    gradients = tape.gradient(loss, projector.trainable_variables)
    optimizer.apply_gradients(zip(gradients, projector.trainable_variables))
the first time the function gets called everything works fine, but after that features becomes a tensor filled with nan
i believe it has something to do with the backward pass, if i comment it features doesnt collapse to nan
any idea why this is happening? am I missing something?
batch contains reasonable values even after the fist step
ok. its the apply_gradients step that causes the nan values to appear.
azure crystal
Does someone know why is the accuracy reducing during every epoch? For example: At the beginning of the epoch the accuracy is 0.755 and at the end of the epoch the accuracy is 0.750 and at the start of the next epoch it is high again
wooden sail
depends entirely on the data. you're training on data with random noise, and so all the gradients have some amount of error in them
azure crystal
Is there anything I can change in the model to prevent this? Because with every epoch the accuracy is getting higher only during the epoch it is getting lower
 merry pike
azure crystal
Does someone know why is the accuracy reducing during every epoch? For example: ...
merry pike
azure crystal
Does someone know why is the accuracy reducing during every epoch? For example: ...
is the random you can percise the random_state at an number for example 0
azure crystal
merry pike
is the random you can percise the random_state at an number for example 0
I am using random_state=1 for the train_test_split
merry pike
try to use it in model for example model = sklearn.linear_model.PassiveAggressiveClassifier(random_state=0)
merry pike
yeah google it HHHHHHHHHHHH
azure crystal
Yes with keras you have to transform the data
but I am using the train test split from sklearn
and it has random state aswell
merry pike
i geuss the problem in model not in split of data