#data-science-and-ml
1 messages · Page 25 of 1
 velvet turtle
 desert oar
velvet turtle
I am using .pivot_table function but in the output its not showing the column an...
desert oar
velvet turtle
I am using .pivot_table function but in the output its not showing the column an...
in order to get help with anything data-related, provide a sample of your data and show the exact code you are using that reproduces the error or problem w/ that sample. also clarify if you're using a notebook or some other interface.
velvet turtle
ok
 fringe anvil
Order ID that repeats means there was multiple items in 1 order. so i got
 desert oar
fringe anvil
Order ID that repeats means there was multiple items in 1 order. so i got
desert oar
fringe anvil
Order ID that repeats means there was multiple items in 1 order. so i got
conceptually, like this?
product_pairs = {}
product_pairs.setdefault(0)

for order in orders:
    product_pairs = itertools.combinations(order.products, 2)
    for p1, p2 in product_pairs:
        product_pairs[(p1, p2)] = +=1
(you might want to ensure that p1 and p2 are sorted in some unambiguous way, so that you don't accidentally treat p2,p1 as distinct from p1,p2)
fringe anvil
the 2 in combinations means what?
 arctic wedgeBOT
itertools.combinations(iterable, r)```
Return *r* length subsequences of elements from the input *iterable*.

The combination tuples are emitted in lexicographic ordering according to the order of the input *iterable*. So, if the input *iterable* is sorted, the combination tuples will be produced in sorted order.

Elements are treated as unique based on their position, not on their value. So if the input elements are unique, there will be no repeat values in each combination.

Roughly equivalent to:ah, thanks
desert oar
it's also nice because it already sorts each combination
velvet turtle
this is the problem that im facing @desert oar
 desert oar
@fringe anvil
import itertools
import pandas as pd

df: pd.DataFrame = ...  # your data here

product_pair_counts = {}
product_pair_counts.setdefault(0)
for order_id, group in df.groupby('Order ID', sort=False):
    product_ids = group['Product ID'].to_list()
    for pair in itertools.combinations(product_ids, 2):
        product_pair_counts[pair] += 1
this is how i'd write it probably
it's parallelizable too, by chunking up the groups, dispatching each group to a different process, and then combining the resulting dicts (by summing) at the end. although that's of course more advanced and probably not necessary for your bootcamp course (or a good use of your time at this point)
desert oar
velvet turtle
this is the problem that im facing <@389497659087650836>
sorry, it's really hard to read code and error messages in screenshots. can you use a code block?
velvet turtle
ok
observations = pd.pivot_table(observations,index='PATIENT',values='VALUE',columns='DESCRIPTION')

observations.head()
 fringe anvil
velvet turtle
ok
fringe anvil
velvet turtle
ok
 desert oar
velvet turtle
```py
observations = pd.pivot_table(observations,index='PATIENT',values='VALUE',...
desert oar
velvet turtle
```py
observations = pd.pivot_table(observations,index='PATIENT',values='VALUE',...
do you have some data that can reproduce this? maybe take the first 50 rows of the table and upload them to our paste site, if this isn't private/confidential data
e.g. you can do
print(observations.head(50).to_csv())
then copy-paste the output to https://paste.pythondiscord.com/
velvet turtle
ok
fringe anvil
desert oar
it's parallelizable too, by chunking up the groups, dispatching each group to a ...
hmm, also for loops and double for loops are kinda slow compared to default pandas methods. we had a lecture about not using them, if we could. i fixed the code a bit to reflect my data and got
orders = df[df['Order ID'].duplicated(keep=False)]
product_pair_counts = {}
product_pair_counts.setdefault(0)
for order_id, group in df.groupby("Order ID", sort=False):
    product_ids = group["Product"].to_list()
    for pair in combinations(product_ids, 2):
        product_pair_counts[pair] += 1
 desert oar
fringe anvil
hmm, also for loops and double for loops are kinda slow compared to default pand...
desert oar
fringe anvil
hmm, also for loops and double for loops are kinda slow compared to default pand...
maybe i didn't use setdefault right
!e ```python
x = {}
x.setdefault(0)
x[('a','b')] += 1
print(x)
@desert oar :x: Your 3.11 eval job has completed with return code 1.
001 | Traceback (most recent call last):
002 |   File "<string>", line 3, in <module>
003 | KeyError: ('a', 'b')
setdefault(key[, default])```
If *key* is in the dictionary, return its value. If not, insert *key* with a value of *default* and return *default*. *default* defaults to `None`.oh, that's just not how setdefault works
lol my mistake
from collections import defaultdict

orders = df[df['Order ID'].duplicated(keep=False)]

product_pair_counts = defaultdict(int)
for order_id, group in df.groupby("Order ID", sort=False):
    product_ids = group["Product"].to_list()
    for pair in combinations(product_ids, 2):
        product_pair_counts[pair] += 1
product_pair_counts = dict(product_pair_counts)
try that
 serene scaffold
desert oar
conceptually, like this?
```python
product_pairs = {}
product_pairs.setdefault(0...
serene scaffold
desert oar
conceptually, like this?
```python
product_pairs = {}
product_pairs.setdefault(0...
couldn't that be
product_pairs = sum((Counter(combinations(order.products, 2)) for order in orders), Counter())
btw @fringe anvil
orders = df.drop_duplicates(subset=['Order ID']))
this would work too. but you do not at all want to drop duplicate order ids here!!! then you'd only be getting 1 product per order, which makes no sense for this task
desert oar
serene scaffold
couldn't that be
```py
product_pairs = sum((Counter(combinations(order.products,...
you'd still need to groupby but sure
you'd need to map the inner counter over the groupby
fringe anvil
its getting complicated lol
desert oar
wait... + works on counters?? TIL
velvet turtle
desert oar
do you have some data that can reproduce this? maybe take the first 50 rows of t...
its from the synthea dataset
desert oar
velvet turtle
its from the synthea dataset
i have no idea what that is, sorry
desert oar
serene scaffold
couldn't that be
```py
product_pairs = sum((Counter(combinations(order.products,...
i think it'd be something like this:
sum(
    (
        Counter(combinations(products, 2))
        for _, products
        in df.groupby('Order ID', sort=False)['Product']
    ),
    Counter()
)
lol, ignore all this map stuff
velvet turtle
desert oar
e.g. you can do
```python
print(observations.head(50).to_csv())
```
then copy-pa...
i have uploaded the data on the link
desert oar
velvet turtle
i have uploaded the data on the link
copy and paste the url of the page
desert oar
fringe anvil
its getting complicated lol
it's actually simpler than you had, don't drop duplicates. that's what grouping is for.
velvet turtle
fringe anvil
desert oar
it's actually _simpler_ than you had, don't drop duplicates. that's what groupin...
alright. let me look at it
desert oar
velvet turtle
https://paste.pythondiscord.com/igimozipal
In [4]: data.head()
Out[4]:
                                PATIENT                                        DESCRIPTION  VALUE
0  034e9e3b-2def-4559-bb2a-7850888ae060                                        Body Height  193.3
1  034e9e3b-2def-4559-bb2a-7850888ae060  Pain severity - 0-10 verbal numeric rating [Sc...    2.0
2  034e9e3b-2def-4559-bb2a-7850888ae060                                        Body Weight   87.8
3  034e9e3b-2def-4559-bb2a-7850888ae060                                    Body Mass Index   23.5
4  034e9e3b-2def-4559-bb2a-7850888ae060                           Diastolic Blood Pressure   82.0
does this look right?
what are you trying to calculate here?
https://synthetichealth.github.io/synthea/ is this the source of the data?
Synthea is a Synthetic Patient Population Simulator that is used to generate the synthetic patients within SyntheticMass. Synthea outputs synthetic, realistic but not real patient data and associated health records in a variety of formats. Read our wiki for more information.
fringe anvil
hmm what method do i call on that Counter to return only the highest value? looks like it's the second one
velvet turtle
ya
desert oar
fringe anvil
hmm what method do i call on that Counter to return only the highest value? look...
i don't recommend using that Counter code lol
however you can replace the inner for loop with a Counter if you prefer
however i think it's simpler to just update the "main" dict all at once, instead of first constructing a big list of Counters and summing them
desert oar
fringe anvil
hmm what method do i call on that Counter to return only the highest value? look...
!d collections.Counter
arctic wedgeBOT
class collections.Counter([iterable-or-mapping])```
A [`Counter`](https://docs.python.org/3/library/collections.html#collections.Counter "collections.Counter") is a [`dict`](https://docs.python.org/3/library/stdtypes.html#dict "dict") subclass for counting hashable objects. It is a collection where elements are stored as dictionary keys and their counts are stored as dictionary values. Counts are allowed to be any integer value including zero or negative counts. The [`Counter`](https://docs.python.org/3/library/collections.html#collections.Counter "collections.Counter") class is similar to bags or multisets in other languages.

Elements are counted from an *iterable* or initialized from another *mapping* (or counter):

```py
>>> c = Counter()                           # a new, empty counter
>>> c = Counter('gallahad')                 # a new counter from an iterable
>>> c = Counter({'red': 4, 'blue': 2})      # a new counter from a mapping
>>> c = Counter(cats=4, dogs=8)             # a new counter from keyword args
i think it has a method to compute the maximum value, check the docs. otherwise you can do it with something like max(counter.items(), key=lambda pair: pair[1])[0]
 desert oar
.most_common(1)
fringe anvil

yeah i ended up trying it
alright. ill try to simplify it into easy to read lines, for my own understanding. thanks a lot salt. you're always coming in clutch 🙂
desert oar
fringe anvil
alright. ill try to simplify it into easy to read lines, for my own understandin...
counts = pd.Series(counts, name='count')
counts.index = pd.MultiIndex.from_tuples(counts.index, names=['product1', 'product2'])
counts = counts.to_frame()
i wanted to call the variable cccombo_breaker .. but it was too long and im sure the instructor wouldnt get the reference lol
desert oar
i would also strongly encourage using product ids instead of names whenever possible. names are more likely to change or be misspelled
if you do the code above and convert it to a dataframe, then you can easily .join in the names and other metadata later if you need it
fringe anvil
desert oar
i would also strongly encourage using product _ids_ instead of _names_ whenever ...
hmm, i dont think the data comes in with product id
desert oar
ah, that's too bad then
these product names look pretty "clean" and it's just for the exercise anyway
but something to keep in mind when working with real data
fringe anvil
yeah its some amazon sales from 2019 csv that was provided in a zip when i forked the github repo of the course
fringe anvil
desert oar
but something to keep in mind when working with real data
definitely
 fresh tiger
Hi! I had a question related to gradient descent, in particular with the formula in the first screenshot.
Im currently just tryna test my knowledge in terms of drawing a graph on how different sizes of the learnign rate, alpha, can impact computation time.
The solution is in screenshot2. What I am not understanding is how the graph would have lower computation times for very large values of alpha.. My take on the answer is in screenshot 3. Wouldnt we have potentially an infinite amount of computation time if we keep over shooting the minima in gradient descent due to very large values of alpha?


 silk axle
There's definitely still some funkiness going on... although it could be the data ig
 fringe anvil
fresh tiger
Hi! I had a question related to gradient descent, in particular with the formula...
fringe anvil
fresh tiger
Hi! I had a question related to gradient descent, in particular with the formula...
bigO(log n)?
like opening a dictionnary in the middle, then your word is in the first half. so you open the first half in the middle, and your word is the the 2nd half of that half... etc until you find your word
fresh tiger
but doesnt a divergence happen at larger values of alpha? https://cs.stackexchange.com/questions/54541/gradient-descent-overshoot-why-does-it-diverge


Computer Science Stack Exchange
I'm thinking about gradient descent, but I don't get it.
I understand that it can overshoot the minimum when the learning rate is too large. But I can't understand why it would diverge.
Let's say w...
fringe anvil
fresh tiger
but doesnt a divergence happen at larger values of alpha? https://cs.stackexchan...
yeah thats too advanced for me sorry. i thought i could help. thats a question for the pros
 fading wigeon
I have nothing to contribute other than I love all these handwritten drawings
fresh tiger
fading wigeon
I have nothing to contribute other than I love all these handwritten drawings
 fading wigeon
The head engineer at my company calls those "picassos" whenever I scribble something out for him, lol
 frozen summit
hey! I was wondering if anyone knew where I could get started on machine learning? specificially on creating a prediction system using python
 young granite
frozen summit
hey! I was wondering if anyone knew where I could get started on machine learnin...
young granite
frozen summit
hey! I was wondering if anyone knew where I could get started on machine learnin...
sklearn?
frozen summit
young granite
sklearn?
I have no idea, I have zero background on machine learning tbh
young granite
what u want to achive using it?
frozen summit
I want to predict the winner of the world cup tournament
young granite
🗿
frozen summit
I have a dataset I just dont really know what to do with it
and I found some projects on github but they are all for single matches not entire tournament brackets
young granite
i dont know the user name anymore but he posted a week ago his github with a tournament bracket so i think its ok to repost it:
https://github.com/asadiceccarelli/Football-Outcome-Predictions

GitHub
My forth and final project for AiCore. Building a machine learning model to make predictions for future games. This could be used to help set odds for betting companies to maximise profit. - GitHub...
frozen summit
young granite
i dont know the user name anymore but he posted a week ago his github with a tou...
thank you so much
young granite
i dont earn credit for that 😄
@frozen summit but if u are completely new to ML i suggest starting with simpler things
frozen summit
young granite
<@771785838320549918> but if u are completely new to ML i suggest starting with ...
any suggestions?
young granite
well if its ur first time check kaggle iris dataset for example
just to get in touch with pandas commands
frozen summit
Im really rusty on python too should I go back to the basics before kaggle
@young granite btw wheres the tournament bracket side of things? i cant find it
young granite
frozen summit
<@385750261420916736> btw wheres the tournament bracket side of things? i cant f...
i dunno i didnt check the project yet
i just bookmarked it
 bright sundial
Hi guys, I currently studying engineering and I have a important question.
Is it possible or real to be able to solve questions or exercises on advanced mathematics such as calculus, algebra, physics, thermodynamics, among others, in a university degree?
Only using data science libraries, like pandas, numpy, matplotlib, pytorch, etc?
For example: Can I solve complex multivariable calculus exercises just using numpy or any python library?
young granite
bright sundial
Hi guys, I currently studying engineering and I have a important question.
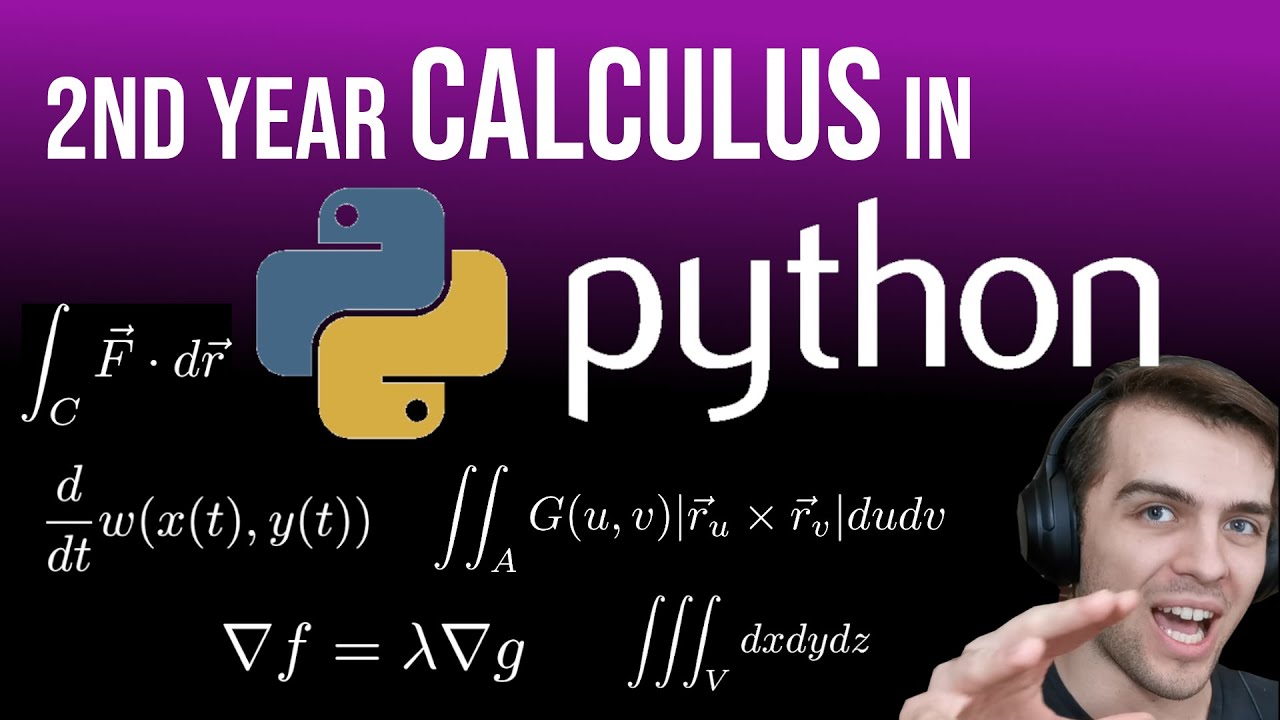
In this video I go through all the formulas in 2nd year calculus and how to evaluate them symbolically in python with no pencil or paper required
First year calculus:
https://youtu.be/-SdIZHPuW9o
Link to code:
https://github.com/lukepolson/youtube_channel/blob/main/Python Tutorial Series/math2.ipynb
DISCORD SERVER:
https://discord.gg/hTBz...
bright sundial
young granite
https://www.youtube.com/watch?v=Teb28OFMVFc&ab_channel=Mr.PSolver
?
Thank you
 sand parrot
Hi when I have 2 cvs files which has vid both.
Vio(description, risk_category, vid)
and want to combine csv. what kind of join should I perform ?
I want it to be (iid, description, risk_category, vid)
 coral cradle
when normalizing data, should I normalize the prediction and the predictors?
does the test set also get normalized?
 hasty mountain
coral cradle
when normalizing data, should I normalize the prediction and the predictors?
do...
hasty mountain
coral cradle
when normalizing data, should I normalize the prediction and the predictors?
do...
You can normalize the predictors only.
And you should normalize both train and test set
coral cradle
hasty mountain
You can normalize the predictors only.
And you should normalize both train and t...
ty
 rugged comet
When using the functional API, I have three input layers. I'm trying to create the next layer for one of the inputs which is a Normalization layer. I don't understand why I would call normalization.adapt on the raw training data instead of on the input layer.
converted_mana_cost_inputs = keras.Input(shape=x_train_converted_mana_cost_input_shape)

# Normalize the converted mana costs
normalization = layers.Normalization()
normalization.adapt(converted_mana_cost_inputs)
I get this error
https://pastebin.com/qv7pL8s9
Pastebin
Pastebin.com is the number one paste tool since 2002. Pastebin is a website where you can store text online for a set period of time.
 verbal venture
hey guys, is running a tf project locally just installing tf in a python ide? or is there a specific setup to it
rugged comet
There's a specific setup to it.
verbal venture
rugged comet
There's a specific setup to it.
sorry, are you able to link it?
rugged comet

TensorFlow
verbal venture
rugged comet
https://www.tensorflow.org/install/pip#step-by-step_instructions
ty!
 cerulean glacier
I know that there is a cost function that neural networks attempt to "optimize." But I was wondering what it means to optimize the function. Do you try to reduce it to zero? Or get it as high/low as possible?
fading wigeon
Minimize, I believe
serene scaffold
Yes, minimize.
The cost is the difference between the actual and desired output. So if the actual output is the desired output, the cost is zero
fading wigeon
Hey so I'm working on some variable transforms and since some transforms require positive numbers, I was considering just adding an offset. Here's the problem, I can add an offset to my data that I'm working off of, but I'll still probably get negative values greater than that. Is there a danger to overshooting that offset? Say my data ranges from -10 to 10 in my dataset but future data may go beyond that. Should I make 10 an offset? 11? 20? 100????
Like, let's choose something simple like sqrt as an example
verbal venture
rugged comet
There's a specific setup to it.
but it's just running tensorflow in an ide
essentially
rugged comet
Sure but you need all that extra software.
cerulean glacier
serene scaffold
The cost is the difference between the actual and desired output. So if the actu...
Is this always true? Because cross-entropy doesn't seem like the difference between the actual and desired output.
rugged comet
cerulean glacier
Is this always true? Because cross-entropy doesn't seem like the difference betw...
What does it seem like?
 turbid arch
Hello, I have a question: can ML use a voice module known as pyttsx3? If not then could you reply other working voice modules?
desert oar
fading wigeon
Hey so I'm working on some variable transforms and since some transforms require...
are you talking about log transform specifically? use inverse hyperbolic sine instead, it isn't as easy to interpret but it does a similar job, and it's "tunable" analogous to the box-cox transform
aka "asinh"
fading wigeon
desert oar
are you talking about log transform specifically? use inverse hyperbolic sine in...
So, I'm actually working on software to analyze thousands of variables and apply whatever transform best normalizes each one. So I run through many transforms and analyze the results, all the ones mentioned are included. I just don't want to exclude a specific transform if it could perform well with a simple offset
desert oar
fading wigeon
So, I'm actually working on software to analyze thousands of variables and apply...
the offset doesn't really make sense in a lot of cases, unless you know that the minimum in the data is a true lower bound
fading wigeon
desert oar
the offset doesn't really make sense in a lot of cases, unless you _know_ that t...
YEah, and that's the crux of it, in most cases I don't know the true lower bound. I guess I just ignore the transforms that require positive values in those cases
desert oar
fading wigeon
YEah, and that's the crux of it, in most cases I don't know the true lower bound...
you might want to try to detect bounded features though
but that's a separate problem
fading wigeon
Another problem I'm working on is sometimes I have to analyze a group of let's say 50 variables, where some perform better with one transform and some with another, but I have to choose which transform to uniformly apply to the whole group. I'm still not sure how I'm going to solve that.
desert oar
fwiw things like gradient boosting and neural networks are supposed to free us from having to worry about getting the precisely optimal feature transformations
why do you need to apply the same transformation to all of them?
anyway box-cox / power and asinh are both good ones to have in your automated feature engineering toolbox
fading wigeon
I'm not 100% sure, lol. I was asked to by an industry expert so I just went along with it.
desert oar
if they're all kind of "the same" feature then i think it has intuitive appeal
fading wigeon
Oh, on a similar note.... what should I call this toolbox/function/feature? I'm so bad at naming things
desert oar
it's a kind of ad-hoc regularization to avoid overfitting
i have no idea what the feature is 😆
fading wigeon
desert oar
if they're all kind of "the same" feature then i think it has intuitive appeal
Yeah, they're related features
desert oar
is this some automated feature engineering thing for linear models?
you might want to try a GAM instead of doing all this
fading wigeon
Ah hah, perhaps so. But I'm working with old school people who don't touch ML and I have to use these distributions downstream to Z-score against different databases.
desert oar
wait what
what are these z-scores for? you're trying to hammer a huge number of features into a gaussian-ish distribution so you can compute differences in z-scores?
fading wigeon
The Z scores will go into a multivariate and will also be used in clustering to explore the dataset.
K-means
This will all eventually be something similar to 23 and me except for neuroscience so people can compare their brain's overall health/functioning to people in their age group, across all age groups, etc
desert oar
yeesh
sounds really ad-hoc
probably will work okay but k-means seems weird here
if this is your goal then you definitely want/need to look into the box-cox and yeo-johnson transformations https://en.wikipedia.org/wiki/Power_transform#Yeo–Johnson_transformation as well as asinh
In statistics, a power transform is a family of functions applied to create a monotonic transformation of data using power functions. It is a data transformation technique used to stabilize variance, make the data more normal distribution-like, improve the validity of measures of association (such as the Pearson correlation between variables), a...
fading wigeon
I started reading a 40 page paper on box cox today, lol
Apparently there have been a lot of developments since it was pioneered but also a lot of contention on how to extend it
I'm not familiar with yeo-johnson, I'll look into it
Yeo–Johnson transformation looks really promising! Hopefully there are python implementations to solve for lambda, I'm not sure how I'd go about doing that on my own
 lapis sequoia
Can someone help me to understand these two graphs? Both are comparison of built models, but one uses MAE and the other uses RMSE. I can't figure out why the difference between the models when I use MAE is much greater than when I use RMSE.


 trail rune
lapis sequoia
Can someone help me to understand these two graphs? Both are comparison of built...
trail rune
lapis sequoia
Can someone help me to understand these two graphs? Both are comparison of built...
Check out this article
https://medium.com/human-in-a-machine-world/mae-and-rmse-which-metric-is-better-e60ac3bde13d
 lapis sequoia
trail rune
Check out this article
https://medium.com/human-in-a-machine-world/mae-and-rmse-...
lapis sequoia
trail rune
Check out this article
https://medium.com/human-in-a-machine-world/mae-and-rmse-...
Thank you for your reply @trail rune !
Do you believe then that one of the reasons for this difference would be because RMSE penalizes outlier errors more strongly than MAE?
That is, when analyzing with MAE I get the idea that the error frequency of some models is much higher than that of others. However, when analyzing using RMSE, I realize that although some models err more frequently( conclusion drawn using MAE), the magnitude of the error, when looking with RMSE, is similar across all models.
Does this interpretation make any sense?
 mint palm
i am making a "video" anomaly detection algorithm, which can identify anomaly at segment level rather than video level( i mean it is able to categorise portions of video as anomalous rather than categorise whole video as anomalous)
I trained my autoencoder of normal video(no portion is anomalous).
i am getting following results:
-
When test set has normal videos(no portion is anomalous) + anomalous video(some portion is anomalous with some portions non-anomalous too),
Model has AUC = 0.63 ish -
When test set has only anomalous video(some portion is anomalous with some portions non-anomalous too)
Model has AUC = 0.51 ish (pathetic)
What can be the reason?
trail rune
lapis sequoia
Thank you for your reply <@882299738022641734> !
Do you believe then that one o...
Yes, it does make sense.
At least that's what I'd say.
You could plot the distribution of the errors of each model to gain more insight.
 wooden sail
lapis sequoia
Thank you for your reply <@882299738022641734> !
Do you believe then that one o...
wooden sail
lapis sequoia
Thank you for your reply <@882299738022641734> !
Do you believe then that one o...
another way to look at it is to think of how the distance is being measured. in essence, the RMSE uses the 2-norm or euclidean distance, while the MAE uses the 1-norm or manhattan distance. as you say, this translates into things like: the RMSE ignores small errors and amplifies large ones, while the MAE doesn't do this, and so small errors have a larger weight
serene scaffold
Hmm, what does norm mean in this context?
wooden sail
vector norm
p-norm, in particular


that illustration of norm balls in 2d (and also in 3d) gives an intuitive visualization of how distance is measured. the 2-norm is what you normally think of as "distance". with the 1-norm, you see that moving diagonally is kinda "further away"
 bold timber
Hello guys, whether we need to preprocess with scaling the image first if we want to make a predictions by EfficientNetB0 model?
lapis sequoia
wooden sail
another way to look at it is to think of how the distance is being measured. in ...
Thanks for the comments, @wooden sail . So, if I were to draw a final conclusion, you think I should consider the contribution of the RMSE more than the MAE, right?
 supple wyvern
URGHHH tensorflow not working on 3.11
 dire falcon
Hello does anyone know any good learning resources for getting into this field?
I currently have a module on data science in my course however I am really struggling to keep up with the lecturers pace.
I'm looking for something like a youtube series/ free online course thats easy to follow.
supple wyvern
Firstly, which one? data science or AI?
dire falcon
well both but best start learning about data science no?
I am planning to do a machine learning based application for my final year project this year
supple wyvern
Well, I kinda only know things for AI
supple wyvern
dire falcon
I am planning to do a machine learning based application for my final year proje...
Do you have any AI frameworks in mind?
dire falcon
But I'm quite dissapointed in the lecturers teaching method, the way she conveys the lectures is near impossible to understand, and her lab tutorials consist of copying code off her and she gets mad at you for not understanding it, not that she describes anything about it at all
dire falcon
supple wyvern
Do you have any AI frameworks in mind?
well ive just started learning about tensor flow
dire falcon
i kind of got trapped in a tough situation by my thesis supervisor however, he suggested a project idea that well i cant really do so i need a new topic to do as well
supple wyvern
A youtube video that I'd recommend is 7hr tensorflow tutorial from freecodecamp
I'll get you the link
dire falcon

Learn how to use TensorFlow 2.0 in this full tutorial course for beginners. This course is designed for Python programmers looking to enhance their knowledge and skills in machine learning and artificial intelligence.
Throughout the 8 modules in this course you will learn about fundamental concepts and methods in ML & AI like core learning alg...
this one?
supple wyvern
yep
Sometimes things are hard to understand so you might have to watch that part a few times
dire falcon
ah yeah a course mate got me that, I was hoping to get something similar on the basics of data analytics.
supple wyvern
dire falcon
I am planning to do a machine learning based application for my final year proje...
Maybe try doing a classification project, in my opinion, that's the easiest...
dire falcon
yeah i was considering doing chord classification for music?
since the project idea my supervisor proposed was to predict when a musician would reach a plateau in their mechanical skill but 💀 how do I get that data, couldnt find anything to really work with
supple wyvern
Have you heard of teachable machine?

Train a computer to recognize your own images, sounds, & poses.
A fast, easy way to create machine learning models for your sites, apps, and more – no expertise or coding required.
dire falcon
supple wyvern
Have you heard of teachable machine?
i have not
supple wyvern
Ithink this will help a lot with your project if you don't want to create a model yourself
One of its functions is audio classification
I actually contributed to the image classification keras code snippet 😁
dire falcon
one sec i have to meet with my supervisor i'll mention this haha
supple wyvern
Literally takes like 10 minutes to generate a model and you can test it before exporting the model, and I think it'll be good if you want to test out before actually making the model yourself.
dire falcon
supple wyvern
Ithink this will help a lot with your project if you don't want to create a mode...
I'll have to make a model to be realistic
i need enough content to write a 100 page thesis so 💀
supple wyvern
oh
supple wyvern
supple wyvern
Literally takes like 10 minutes to generate a model and you can test it before e...
Maybe do this then
just for testing out your training data
supple wyvern
Also if you're doing tensorflow, https://discord.gg/KNm5Epj
It's an unofficial server tho
but really quickly growing
 azure fern
Is there one for yolo?
supple wyvern
wdym yolo?
wooden sail
lapis sequoia
Thanks for the comments, <@467435887236612106> . So, if I were to draw a final c...
sadly that depends entirely on your application :p
 narrow flare
im looking to create a bot for a game. the game is 3d and u can walk around with the arrow keys.
the aim of the bot is to complete "tasks" in the game, which involve:
- reading off what the task is (writing detection)
- walk to where the task is telling you to go (with arrow keys)
Step 2 would involve some computer vision scheme so that the bot can see where it needs to go, and then I'd algorithmically tell the bot which arrows to press depending on where it sees the target location. So it detects the location via computer vision, but does the movement without any AI.
What im wondering is, what technologies would I need to learn to be able to do this? I already know basic tensorflow.
 winged mason

Stack Overflow
#pytorch imports
import torch
import torch.nn as nn
import torch.nn.functional as F
import torch.optim as optim
import torch.utils.data as data
from torchvision import transforms, datasets
#other i...
Can anyone help me with this pytorch issue?
dire falcon
supple wyvern
Also if you're doing tensorflow, https://discord.gg/KNm5Epj
ty im going to join it
btw supervisor said chord classification is fine to go with so 
can start working on a prototype
supple wyvern
dire falcon
btw supervisor said chord classification is fine to go with so <:thumbsup:977993...
Nice
So I'd suggest once you get all your training data, train a prototype with teachable machine (You can save your progress) and when it works well, after changing epochs and all, train it properly with tf 🙂
 boreal cape
hey does anyone known anything about topic modelling
 merry ridge
Can anyone suggest a good resource on parallelization for databricks? My Google searches are getting clogged with a ton of low quality medium/towards data science posts that don't explain enough.
narrow flare
we dont know what the assistant does though xD
what does it do @lapis sequoia
lol
weird question but how old are u?
did you hard code all the responses of the robot lol
arctic wedgeBOT
Hey @lapis sequoia!
It looks like you tried to attach a Python file - please use a code-pasting service such as https://paste.pythondiscord.com
 rapid cedar
should i start with sklearn/matplotib/thinker
 wicked wing
anyone here good with jupyter and matplotlib? getting a weird importlib error
---------------------------------------------------------------------------
ModuleNotFoundError                       Traceback (most recent call last)
Cell In [1], line 1
----> 1 get_ipython().run_line_magic('matplotlib', 'widget')
      3 import matplotlib.pyplot as plt

File ~/.cache/pypoetry/virtualenvs/U26YDnIW-py3.10/lib/python3.10/site-packages/IPython/core/interactiveshell.py:2309, in InteractiveShell.run_line_magic(self, magic_name, line, _stack_depth)
   2308 with self.builtin_trap:
-> 2309     result = fn(*args, **kwargs)
   2310 return result

File ~/.cache/pypoetry/virtualenvs/U26YDnIW-py3.10/lib/python3.10/site-packages/IPython/core/magics/pylab.py:99, in PylabMagics.matplotlib(self, line)
---> 99     gui, backend = self.shell.enable_matplotlib(args.gui.lower() if isinstance(args.gui, str) else args.gui)

File ~/.cache/pypoetry/virtualenvs/U26YDnIW-py3.10/lib/python3.10/site-packages/IPython/core/interactiveshell.py:3473, in InteractiveShell.enable_matplotlib(self, gui)
-> 3473 pt.activate_matplotlib(backend)
   3474 configure_inline_support(self, backend)

File ~/.cache/pypoetry/virtualenvs/U26YDnIW-py3.10/lib/python3.10/site-packages/IPython/core/pylabtools.py:359, in activate_matplotlib(backend)
    357 from matplotlib import pyplot as plt
--> 359 plt.switch_backend(backend)
    361 plt.show._needmain = False

File ~/.cache/pypoetry/virtualenvs/U26YDnIW-py3.10/lib/python3.10/site-packages/matplotlib/pyplot.py:265, in switch_backend(newbackend)
--> 265 backend_mod = importlib.import_module(
    266     cbook._backend_module_name(newbackend))

File /usr/lib/python3.10/importlib/__init__.py:126, in import_module(name, package)
    124             break
    125         level += 1
--> 126 return _bootstrap._gcd_import(name[level:], package, level)

(...)

File <frozen importlib._bootstrap>:1004, in _find_and_load_unlocked(name, import_)

ModuleNotFoundError: No module named 'ipympl'
I'm running jupyter from inside a poetry virtual environment
for some reason it looks like importlib is escaping the virtual environment
desert oar
wicked wing
anyone here good with jupyter and matplotlib? getting a weird importlib error
what kernel are you running in the notebook? is it the same as the python env that's running jupyter?
 hushed kraken
Use a generic method from statistics that is independent of the timeseries to remove outliers in the data
mean = data.belpex.mean()
std = data.belpex.std()
n_std = 5
data['belpex'][(data.belpex >= mean + n_std*std)] = mean + n_std*std
data['belpex'][(data.belpex <= mean - n_std*std)] = mean + n_std*std
Does anyone know what the name of this method is? Would like to learn more about it
 torn elm
Hello.. my code is not working specifically for values 2.53 and 2.51
I am using Spyder( Python 3.9)
Can anyone please help
def changeMarker(value):
if value >= 0 and value <= 5:
amount = int(value*100)
two_pound = amount//200
   one_pound = amount % 200//100
   p50       = amount % 200% 100 // 50
   p20 =  amount % 200% 100 % 50 // 20
   p10 = amount % 200 % 100 % 50 % 20// 10
   p5 = amount % 200% 100 % 50 % 20 % 10//5
   p2 = amount % 200 % 100 % 50 % 20 % 10 % 5 // 2
   p1 = amount % 200 % 100 % 50 % 20 % 10 % 5 % 2 // 1


else :

   two_pound= -1
   one_pound= -1
   p50 = -1
   p20 = -1
   p10 = -1
   p5 = -1
   p2 = -1
   p1 = -1

return  two_pound, one_pound, p50, p20, p10, p5, p2,p1
value = 2.53
output = changeMarker(value)
print("output = {0}".format(output))
wicked wing
desert oar
what kernel are you running in the notebook? is it the same as the python env th...
fixed it! for some reason ipympl isn't included as part of the jupyter metapackage on pypi
desert oar
wicked wing
fixed it! for some reason `ipympl` isn't included as part of the `jupyter` metap...
i had to step away for a meeting, sorry. yes, ipympl needs to be installed separately
you might also want to install ipywidgets
desert oar
you intend to use the project's python venv to run jupyter, right?
wicked wing
yes exactly, everything's installed to the venv
desert oar
it's actually possible to have a single "central" jupyter installation that runs "kernels" from various envs/projects. but if you aren't doing that setup, i didn't want to complicate things
okay, in that case yes. you just need to install ipympl and i suggest ipywidgets as well
wicked wing
gotcha, thanks!
young granite
is there an automated method in pandas to drop cols/rows which got outliers ?
young granite
young granite
is there an automated method in pandas to drop cols/rows which got outliers ?
           1         2         3          4          5         6         7  \
0    29740.0   69277.0  189645.0  1321527.0   112478.0   19536.0    5413.0
1    57228.0   37776.0  148611.0        0.0    81654.0       0.0       0.0
2    21263.0   55671.0   51399.0        0.0   123019.0   57952.0   23970.0
3    71677.0   65626.0   49598.0  1017098.0   128965.0   42908.0   21552.0
4    41682.0   67693.0   34373.0        0.0   175257.0   82372.0   46864.0
5   123677.0   89131.0   41563.0   909706.0   229204.0   71436.0   42461.0
6    73058.0  225785.0       0.0  1327173.0   817648.0  165429.0  125564.0
7    23898.0   90253.0       0.0   610598.0   558249.0  102117.0   99471.0
8    86272.0  286587.0   23501.0   989984.0  1693514.0       0.0  166103.0
9   114224.0  167569.0  251141.0   463315.0   836308.0       0.0  115151.0
10       0.0    4029.0    6826.0   108047.0   101546.0       0.0    1879.0
11 0.0 47296.0 1487.0 200398.0 671665.0 0.0 39387.0 ```i wanted to remove the cols where the violin chart indicates outliers
 desert oar
young granite
is there an automated method in pandas to drop cols/rows which got outliers ?
desert oar
young granite
is there an automated method in pandas to drop cols/rows which got outliers ?
no, and rightly so. the meaning of "outlier" is very specific to your task. many people come in here thinking that they have outliers, when in fact they just have a skewed distribution
desert oar
young granite
i wanted to remove the cols where the violin chart indicates outliers
great example: what do these features mean? what kinds of outliers are these? are they "bad" data points that should be removed from analysis? or are they legitimate extreme values?
young granite
first of u are 100% right on the definition of outlier, however i can say that those are outliers due to the measurement method
desert oar
young granite
first of u are 100% right on the definition of outlier, however i can say that t...
ok, so how do you define an outlier then?
the definition of an outlier is entirely specific to your task. therefore pandas cannot possibly have a method for it.
young granite
i was thinking of (df-df.mean())<= df.std()
desert oar
young granite
i was thinking of (df-df.mean())<= df.std()
def standardize(y):
    return (y - y.mean()) / y.std()
df_std = df.apply(standardize)
drop_mask = (df_std >= 1).any(axis=1)

df = df.loc[drop_mask].copy()
like that?
in general, the technique is to construct some kind of equivalent drop_mask, which is a boolean Series with True corresponding to the rows to be dropped
if your df .index is set up intelligently, then you can also do
def standardize(y):
    return (y - y.mean()) / y.std()
df_std = df.apply(standardize)
drop_mask = (df_std >= 1).any(axis=1)

df.drop(df.index[drop_mask], inplace=True)
and of course there are many variations thereof
young granite
desert oar
if your df `.index` is set up intelligently, then you can also do
```python
def ...
my indexes are always smart 🗿
desert oar
note the use of .copy to avoid the "setting on a slice" warning, if you intend to do further data manipulations
as always, think before copying and pasting. the usual caveats about untested code written by strangers apply.
actually i think you can just call standardize on the entire dataframe
df_std = standardize(df)
drop_mask = (df_std >= 1).any(axis=1)
nah i would need to allow it only for a range of cols
atm i got my input variables in there aswell
desert oar
young granite
nah i would need to allow it only for a range of cols
so select them with [], but you can still call standardize on the resulting dataframe
cols = [ ... ]
df_std = standardize(df[cols])
let me try that real quick
desert oar
note also the use of .loc to select rows. i never use "plain" [] for selecting rows. too easy to make typos and get a weird result
young granite
makes sense
by that u would mean like this ?
df_7d.loc[:, 1: 42]
import plotly.graph_objects as go
from plotly.subplots import make_subplots


def standardize(y):
    return (y - y.mean()) / y.std()

df_std = standardize(df_7d.loc[:, 1: 42])
drop_mask = (df_std >= 3).any(axis=1)
df_std.drop(df_std.index[drop_mask], inplace=True)

fig = go.Figure()


trace = np.arange(0,43).astype("str")

for i in np.arange(1,43):

    fig.add_trace(go.Violin(
        name=trace[i],
        y=df_std[i],
        box_visible=True,
        meanline_visible=True
        ),
        )
fig.show()```well >=3 and still a mess 🗿
what did i just measure there 🐸
i guess i will only delete outliers manually, where i know that the values are faulty and leave everything else untouched and proceed with em
desert oar
young granite
by that u would mean like this ?
```df_7d.loc[:, 1: 42]```
no, i meant as in my example
you would use iloc to select columns by number
...unless your column names are actually numbers
young granite
desert oar
...unless your column names are actually numbers
they are numbers 🗿
indeed 😄
azure fern
Hello, who can help me run yolov7 locally on CPU in real time?
 strong sedge
sorry for asking a math heavy question, but this has been bugging me for days
'''
lets take a single neuron

the output of this neuron is

y = wx + b

how do we go from this to updating the weight and bias by
dw = dy * x
db = dy
and how does the error backpropagate as
dx = dy * w
'''
when you take the partial derivative of y = wx + b
you get
dy = dw * x + dx * w + db
how does one go from this to what was written above ?
(Note the location of dy and dw, dx)
wooden sail
are you asking for the total derivative as a differential form?
 mossy haven
Where do I start with reinforcement learning?
strong sedge
wooden sail
are you asking for the total derivative as a differential form?
umm, I am asking how the formula for updating the weight and bias was made/discovered
wooden sail
not that way, i would say
strong sedge
wooden sail
not that way, i would say
how ?
can you explain it to me using my example of y = wx + b (1 input, 1 weight, 1 bias, 1 output)
or give me some resource to read, I dont mind
wooden sail
if you want a full derivation of gradient descent, a bunch of stuff is needed
have you done any convex optimization?
strong sedge
wooden sail
if you want a full derivation of gradient descent, a bunch of stuff is needed
ummm, take a look at this
https://github.com/sivansh11/machine-learning-explained/blob/main/gradient_decent.ipynb
this is my understanding of gradient decent
GitHub
Contribute to sivansh11/machine-learning-explained development by creating an account on GitHub.
strong sedge
wooden sail
have you done any convex optimization?
what do you mean by "convex" optimisation ?
wooden sail
hmm that's pretty far removed from the question you asked
strong sedge
I am hearing the term convex optimisation for the first time
I thought that machine learning is just multi variate calculus 🥲
wooden sail
that's what you'd have to read about
strong sedge
wooden sail
that's what you'd have to read about
Alright
Thanks for the pointer ☺️
 vast stirrup
anyone know if you're able to submit transparent png cutouts for images to be recognized in pyautogui?
strong sedge
mossy haven
Where do I start with reinforcement learning?
There is a course on Coursera for reinforced learning, it's really high quality
But i would suggest learning supervised / unsupervised learning first as it's more utilised in the industry (as I have been told)
strong sedge
vast stirrup
anyone know if you're able to submit transparent png cutouts for images to be re...
I think this question belongs to #user-interfaces
But i may be wrong
Also, I have no idea so mb for tagging
vast stirrup
strong sedge
I think this question belongs to <#338993628049571840>
But i may be wrong
Also,...
utilizing opencv I just figured it would possibly be here sorry
strong sedge
opencv is ai related so its all good :D
wooden sail
i wonder...
aha, it actually let me send it
this is a notebook i compiled for the students in our lab. it's an intro to gradient descent, maybe you'll find it useful
most of the stuff is explained there, except for one detail involving taylor's theorem
strong sedge
wooden sail
this is a notebook i compiled for the students in our lab. it's an intro to grad...
thanks for the pdf :D
wooden sail
also some details regarding wirtinger calculus are just taken at face value. i don't recall if i provide a reference to that, but it should be fairly easy to find it in google under "wirtinger calculus" or "C-R calculus"
important to keep in mind when dealing with complex-valued functions but only requiring them to be real-differentiable
and the books by boyd are great for convex optimization. i think i referenced those extensively there
strong sedge
wooden sail
also some details regarding wirtinger calculus are just taken at face value. i d...
I dont understand what this means here, but Ill keep a note 👍
wooden sail
well, the short answer is that you need linear algebra and multivariable calculus to show how and when gradient descent works
and later on statistics to show how it works in machine learning with stochastic gradients (not covered in the pdf)
 merry pike
Hello community, can you see this project and give me your feedback

GitHub
Predict who will win the FIFA World Cup 2022 . Contribute to Omaraitbenhaddi/ODC-World-Cup-2022-Predictions development by creating an account on GitHub.
mossy haven
strong sedge
There is a course on Coursera for reinforced learning, it's really high quality
...
Gonna be honest, I really just wanna learn reinforced learning to automate games to destroy my friends in pong or whatever game we're playing in school. That is what reinforced is for, right? (Or at least included in, no?)
strong sedge
wooden sail
well, the short answer is that you need linear algebra and multivariable calculu...
I consider myself above average in algebra and calculus, but I am really lacking in stats (cause am lazy lmao)
strong sedge
mossy haven
Gonna be honest, I really just wanna learn reinforced learning to automate games...
in that case,
take a look at qlearning (or deep qlearning)
that to me looks like the best learning algo for pong
but you could always just hardcode the algorithm for something as simple as pong
mossy haven
strong sedge
in that case,
take a look at qlearning (or deep qlearning)
that to me looks like...
right, but it's possible to automate browser games with reinforced as well, right? (not only pong)
strong sedge
mossy haven
right, but it's possible to automate browser games with reinforced as well, righ...
yes in theory
mossy haven
strong sedge
yes in theory
alright, well ty : )
strong sedge
np :D
young granite
can i get input/output correlations with sklearn aswell or is that more DL with TF or PT?
or in other words i struggle a bit to approach my datasets
i got 4 datasets each containing 12rows*42cols and 9 input values for each of the 4 datasets
 storm kelp
What is the appropriate way to use spark.cache? do I need to uncache?
serene scaffold
storm kelp
What is the appropriate way to use spark.cache? do I need to uncache?
are you using pyspark? because people are going to see df and assume you're using pandas.
storm kelp
serene scaffold
are you using pyspark? because people are going to see `df` and assume you're us...
yes pyspark
verbal venture
hey, what's the risk of having your training data accuracy to 1.0 but not your test data
serene scaffold
verbal venture
hey, what's the risk of having your training data accuracy to 1.0 but not your t...
what kind of model, for what task?
strong sedge
verbal venture
hey, what's the risk of having your training data accuracy to 1.0 but not your t...
Overfitting
Ur model cant generalize
merry pike
verbal venture
hey, what's the risk of having your training data accuracy to 1.0 but not your t...
it's depends to metrics Appropriate to your model but the risk is he can give you false picture in your model or overfitting
 past prawn
So I'm pre-processing my data for machine learning training. I can't figure out if I should take care of the outliers in the dataset first or the missing data. I googled it and there were mixed opinions. I think it would make sense to remove the outliers first as that would mean the imputed data would be unaffected by the outliers. Any thoughts?
(I'm a beginner so don't know a whole lot)
storm kelp
Depends entirely on why you're considering them outliers. Are those data points likely errors or just extreme values?
verbal venture
how do you sum a specific row in numpy? or do I need to use pandas for it?
nvm got it, thanks
past prawn
storm kelp
Depends entirely on why you're considering them outliers. Are those data points ...
there's both so for example i have ages upto 8698 and salary upto 24198060. The age would probable be an error and the salary is probably an "extreme value" right?
 willow hedge
Global AI Summit, AI
The Global AI summit gathers the most prominent policymakers, world’s leading investors, policy thought leaders and innovators working to deploy AI by exploring the state of AI, investment cases, commitments and governance to bring AI solutions at a global scale
narrow flare
hey guys im trying to learn openCV for python, but most of the tutorials i can find for it use non-ML computer vision algorithms
can someone direct me to a resource which explains how to use ML models for opencv
like suppose i already have the model, i just wanna use it in openCV
i understand that this is mainly a matter of syntax but i cant find any good resources
oh i didnt realise i need to be looking for tutorials for the DNN module
 novel python
guys, I have a dataframe witih around 15k rows, and I wanted to run a linear regression for every row, is there an "easy" way to do it?
novel python
I'm trying to run it through the whole dataset row by row using the following code:
    grid_model.fit(X_train.iloc[i], y_train[i])
    y_pred = grid_model.predict(X_test.iloc[i])
    predictions.append(y_pred)
    rmse_errors.append(mean_squared_error(y_test[i], y_pred, squared=False))
print(i)```but I'm getting "TypeError: Singleton array 0.389 cannot be considered a valid collection."
that's the value of the first y_train, not sure why I'm getting this error, already looked up on google
lapis sequoia
im not sure im new to this stuff
rugged comet
When using the tensorflow functional API, I have three input layers. I'm trying to create the next layer for one of the inputs which is a Normalization layer. I don't understand why I would call normalization.adapt on the raw training data instead of on the input layer.
converted_mana_cost_inputs = keras.Input(shape=x_train_converted_mana_cost_input_shape)

# Normalize the converted mana costs
normalization = layers.Normalization()
normalization.adapt(converted_mana_cost_inputs)
I get this error
https://pastebin.com/qv7pL8s9
when calling adapt on the input layer.
Pastebin
Pastebin.com is the number one paste tool since 2002. Pastebin is a website where you can store text online for a set period of time.
turbid arch
turbid arch
Hello, I have a question: can ML use a voice module known as pyttsx3? If not the...
Anyone?
verbal venture
can z and t tests only be used if the underlying distribution is normal?
 pine yoke
is there a specific model that would lend itself to getting bboxes and classes for this dataset?
each square = 1 input image

i thought about yolov5 but it seems overkill, wonder if there's any general ideas
 night sequoia
Hey guys check out this dataset I uploaded which gives a sense of the crime committed during the past two decades . Hope you find some interesting insights using this dataset . Do upvote it if you find it useful , Thank You .
https://www.kaggle.com/datasets/supreeth888/nypd-data

All the crimes committed from 2004-2021 in New York .
strong sedge
strong sedge
sorry for asking a math heavy question, but this has been bugging me for days
``...
this was so wrong, thanks edd for the pointer 😅
 hazy cosmos
Hi everyone, my name is Gladin, from Kerala, India. I am a Data Scientist. I am at the moment seeking a new job opportunity. Excited to learn more and grow. Kindly add me on LinkedIn everyone, I am open to endorsing everyone's skills on LinkedIn. Let's network: https://www.linkedin.com/in/gladin/
 cinder schooner
hello, would anyone recommend a good book to start reinforcement learning?
 hybrid plaza
Hello! Basic Pandas question.. How do I access a column (Series) by index (rather than by name)?
strong sedge
hybrid plaza
Hello! Basic Pandas question.. How do I access a column (`Series`) by index (rat...
.iloc
You can also check .at
hybrid plaza
.iloc accesses a row. I'm trying to access a column.
df['a'] works, df[0] does not.
My current workaround is series = [serie for _name, serie in data.items()], then series[0], but it feels like there ought to be a better way.
 main fox
hybrid plaza
`.iloc` accesses a _row_. I'm trying to access a column.
main fox
hybrid plaza
`.iloc` accesses a _row_. I'm trying to access a column.
.iloc[:, column_index]
hybrid plaza
Thank you!

 minor coral
hi
does anybody knows how mnist dataset works?
Im currently trying to create cgan but with my own dataset, but I dont know how to implement it
https://github.com/arturml/mnist-cgan/blob/master/mnist-cgan.ipynb, like I want to use this code and try to use the dataset here: https://www.kaggle.com/datasets/jamesnogra/baybayn-baybayin-handwritten-images?select=a.uVWU-James.jpg
and display an image generated based on the letter/script label

Baybayín is a ore-colonial script used by Filipinos.
serene scaffold
minor coral
does anybody knows how mnist dataset works?
the dataset itself doesn't "work". it's just there. it's the model that actually does something with the dataset.
you can use MNIST to make a character recognition model, and you can get good results doing that with just a basic (feed forward) neural network. The code for doing it should be basically the same even if you're using a dataset where the only difference is the letter/number system
minor coral
Can I create a dataset that matches the format of the mnist?
Our professor requires us to use cgan specifically for this
serene scaffold
minor coral
Can I create a dataset that matches the format of the mnist?
yes, but that would be a ton of work. what is cgan?
minor coral
Like I want to use the cgan for generating the image
conditional generative adversarial network
GitHub
Python/Bash scripts for creating custom Neural Net Training Data -- this repo is for the MNIST format - GitHub - gskielian/JPG-PNG-to-MNIST-NN-Format: Python/Bash scripts for creating custom Neural...
i saw thi code but I dont know how to do the "sudo" something
serene scaffold
"sudo" is a linux command. it's not really relevant to what you're trying to do, conceptually speaking.
desert oar
not only is it completely irrelevant, but it's likely that you will break your system if you run "sudo" commands without understanding them
minor coral
I mean, is there any counterpart to windows os for this?
desert oar
it's the Linux equivalent of messing around in C:\Windows with administrator access turned on
minor coral
minor coral
https://github.com/gskielian/JPG-PNG-to-MNIST-NN-Format
this*
desert oar
verbal venture
can z and t tests only be used if the underlying distribution is normal?
yes, but be careful about what you mean by the "underlying distribution".
any hypothesis test requires the test statistic to follow a particular probability distribution when the null hypothesis is true.
for example, consider the "welch's T test" for differences in means in independent samples. the data itself does not need to be normally distributed, because there is a more general set of conditions under which the test statistic follows the T distribution.
in particular, you only need the sample mean to be normally distributed, which is always the case in samples that are "big enough", as per the central limit theorem
if you have not yet wrapped your head around the concept of a sample mean being a random variable with its own probability distribution, spend the time to do so
 tiny wadi
Anyone know a fast way of changing list like [1,2,4,1] into representation in the form [[1,2,3,4]]?
Output like this:
[[1,0,0,1],[0,1,0,0],[0,0,0,0],[0,0,1,0]]?
tiny wadi
tiny wadi
Anyone know a fast way of changing list like [1,2,4,1] into representation in th...
np.multiply(array==i,1) is the answer
serene scaffold
tiny wadi
Anyone know a fast way of changing list like [1,2,4,1] into representation in th...
I don't get it. are you trying to reshape a (4,) shape array to (1, 4), or is there some realtionship between [1, 2, 4, 1] and [[1,0,0,1],[0,1,0,0],[0,0,0,0],[0,0,1,0]]?
tiny wadi
serene scaffold
I don't get it. are you trying to reshape a (4,) shape array to (1, 4), or is th...
There is relationship between those two, each one in the nested list represents a number (1 to 4)
serene scaffold
can you give the actual input that is intended to produce [[1,0,0,1],[0,1,0,0],[0,0,0,0],[0,0,1,0]]?
sorry, misread
one moment
seems like the relationship is arbitrary?
why does 1 become [1,0,0,1] in the first element, and then [0,0,1,0] for the last one?
tiny wadi
list = [1,2,4,1]
split_list = []
for i in range(4):
split_list .append(np.multiply(list==i,1)
its like a dictionary, {1:[1,0,0,1],2:[0,1,0,0],3:[0,0,0,0],4:[0,0,1,0]}
serene scaffold
ah, I see now
!e @tiny wadi this would be the idiomatic way to do it
import numpy as np
arr = np.array([1, 2, 4, 1])
index = np.arange(1, 5)
result = (arr[None, :] == index[:, None]).astype(int)
print(result)
@serene scaffold :white_check_mark: Your 3.11 eval job has completed with return code 0.
001 | [[1 0 0 1]
002 |  [0 1 0 0]
003 |  [0 0 0 0]
004 |  [0 0 1 0]]
I think its faster too because no loops, so thanks 🙂
serene scaffold
tiny wadi
I think its faster too because no loops, so thanks 🙂
no problem! the trick is broadcasting.
minor coral
hii, is there any way to make the dataset ( above) to be the same format with the dataset below?
 serene scaffold
minor coral
hii, is there any way to make the dataset ( above) to be the same format with th...
serene scaffold
minor coral
hii, is there any way to make the dataset ( above) to be the same format with th...
Please do not ask people to read screenshots of text.
!code
arctic wedgeBOT
Here's how to format Python code on Discord:
```py
print('Hello world!')
```
These are backticks, not quotes. Check this out if you can't find the backtick key.
minor coral
serene scaffold
Please do not ask people to read screenshots of text.
my bad
young granite
@serene scaffold may i ask u what kind of sklearn algo. would suit in ur opinion for a dataset of 12*42 with inputvalues from 0-3
serene scaffold
young granite
<@253696366952316929> may i ask u what kind of sklearn algo. would suit in ur op...
idk what you mean. your dataset is a (12, 42)-shape array, and each element is an integer {0, 1, 2, 3}? if you only have 12 data points to work with, you probably won't be able to learn anything.
young granite
serene scaffold
idk what you mean. your dataset is a (12, 42)-shape array, and each element is a...
those are my thoughts aswell i do got more points however i would to dilute the lables then aswell
serene scaffold
it would also be helpful to know what the data represents.
young granite
integrated areas in this form:
           1        2         3          4         5        6       7       8  \
0    29740.0  69277.0  189645.0  1321527.0  112478.0  19536.0  5413.0  1423.0
1        0.0      0.0    2555.0    54682.0    6512.0      0.0   547.0     0.0
2        0.0   1352.0    4098.0    40962.0    1275.0      0.0     0.0     0.0
3        0.0      0.0    1776.0    36531.0    1509.0      0.0   787.0     0.0
4        0.0      0.0     759.0    28094.0    1905.0      0.0   386.0     0.0
..       ...      ...       ...        ...       ...      ...     ...     ...
325      0.0      0.0    3388.0    21471.0    1115.0      0.0     0.0     0.0
326      0.0      0.0    2897.0    23324.0       0.0      0.0   820.0     0.0
327      0.0      0.0       0.0    23832.0     852.0      0.0     0.0     0.0
328      0.0      0.0       0.0    21121.0       0.0      0.0     0.0     0.0
329      0.0      0.0       0.0    21031.0       0.0      0.0     0.0     0.0
as u can see in this full dataset the area values drop after certain time thats why i reduced it to:
          1         2          3          4          5         6         7   \
56    21263.0   55671.0    51399.0        0.0   123019.0   57952.0   23970.0
21   112953.0   39277.0   454261.0   442966.0    79459.0       0.0    7731.0
42    16039.0  681685.0   119236.0  1595052.0   196827.0       0.0  109792.0
267   81984.0  117635.0     3743.0   564249.0  1004721.0       0.0  127240.0
225  114224.0  167569.0   251141.0   463315.0   836308.0       0.0  115151.0
87    35274.0       0.0  7149357.0  1106840.0   158358.0   69680.0   24107.0
112  123677.0   89131.0    41563.0   909706.0   229204.0   71436.0   42461.0
309       0.0       0.0     1603.0   230084.0   781602.0       0.0       0.0
99    53284.0   72158.0    31252.0  1341475.0   347423.0   77789.0   33366.0
..       ...      ...       ...        ...       ...      ...     ...     ...
211   24247.0  120011.0        0.0   860222.0   781548.0  117812.0  107597.0
204   91321.0   90479.0        0.0   774805.0   595667.0  112264.0   79113.0
35    38419.0       0.0  7992028.0        0.0    86738.0       0.0       0.0
75    57301.0   68681.0    96929.0  1190922.0   159876.0   62375.0   24785.0
232   86978.0  403606.0     2730.0  1539340.0  2215212.0       0.0  361130.0
7     57228.0   37776.0   148611.0        0.0    81654.0       0.0       0.0
302       0.0    1647.0     1304.0   115092.0    96582.0       0.0    2265.0
140   78284.0       0.0  5966734.0  1125559.0   263598.0  116030.0   64898.0
14    23068.0   98709.0    58554.0  1329078.0   118384.0   19615.0   15860.0
...
190   88009.0   896297.0   2147.0      0.0      0.0       0.0
260  266873.0   646077.0  25561.0      0.0  48154.0       0.0

[38 rows x 42 columns]```you can't answer the question of "what algo/model do i use" before you can answer "what does my data represent" and "what am i trying to achieve"
moreover, asking the question of "which algo in scikit-learn do i use" generally suggests that you don't actually know what the various algorithms do and how they work. that's not a good way to do things.
bold timber
Hello guys, Does anyone clearly understands about efficientnetb0 model?
 noble grove
Looking for a way to extract some keys and values from a dictionary then replacing the values. Also concatenating two other key values. The dictionary also has a nested dictionary inside. Any tutorial I can go through? Thanks for the help.
storm kelp
I have a dataframe with columns a, b, and c. I want to group by a and b, and then find and keep the row with the minimum value for c.
I have a solution that kinda works but it isn't able to break ties. If there is a tie I'm not bothered I just want it to take the first occurrence of the minimum value. I'm stuck trying to figure this out though.
Is there a way to group by a and b, then order by c and then just retain the top row for each grouping?
 noble tusk
Can you send what the DataFrame looks like after you do those operations? When there's a tie
Cos you might be able to just use iloc but I wanna make sure
storm kelp
noble tusk
Can you send what the DataFrame looks like after you do those operations? When t...
On my work laptop so I'll take a picture

Will iloc work after running a group_by().orderly().? @noble tusk
If so that would actually be much more simple than my current method lol
I'm working within PySpark if that matters
noble tusk
storm kelp
Will iloc work after running a group_by().orderly().? <@385807530913169426>
It should return a new DataFrame, so yes, I'm pretty sure
I know group_by() does at least
You may also need to use .reset_index() to reset the indices to start from 0, then do .iloc(0)
storm kelp
noble tusk
You may also need to use `.reset_index()` to reset the indices to start from 0, ...
Ok very good. I'll give that a try tomorrow when I'm back at work
Hopefully it runs within PySpark
young granite
desert oar
moreover, asking the question of "which algo in scikit-learn do i use" generally...
i was asking for something like this more like a best practice approach i do now some, but not all, algorithms
 noble tusk
storm kelp
Ok very good. I'll give that a try tomorrow when I'm back at work
noble tusk
storm kelp
Ok very good. I'll give that a try tomorrow when I'm back at work
Let me know how it goes! I can't imagine PySpark would have a massive effect on things, but then I've never really used it, so I couldn't be sure
storm kelp
noble tusk
Let me know how it goes! I can't imagine PySpark would have a massive effect on ...
Just doubled checked and PySpark has documentation for iloc so it should be ok. Just hopefully it realises I want the top value from each grouping
noble tusk
If you pass 0 it should be the 0th row. If that doesn't work it's probably one-indexed so pass 1 instead
 dusty valve
young granite
i was asking for something like this more like a best practice approach i do now...
dusty valve
young granite
i was asking for something like this more like a best practice approach i do now...
.bm scikit
 wispy coyote
young granite
i was asking for something like this more like a best practice approach i do now...
wispy coyote
young granite
i was asking for something like this more like a best practice approach i do now...
All of these algorithms do very very different things. It highly depends on what you want the data to do for you. Do you want to take that information and make a decisions about what do do next? Classification is great. Do you want to take a point you're really interested in, and find points you might also be interested in? Clustering might be a way to go. Does the data change over time and do you want to know what some of it will be in a few time stamps? Regression is helpful. Do you have a bunch of data, much of which could be summarized into a smaller group, and then do analysis on that? Dimensional reduction is helpful at.
All of my prompts are just a subset of the ways you can use those four groups, but they all allude to the fact that you need to want to do something with the data before you start asking about algorithms to achieve that something. You have a bunch of something, but you need to want to do something with it. Otherwise it's just noise. There's lot of signals, but which signal do you want?
desert oar
young granite
i was asking for something like this more like a best practice approach i do now...
sure, but look at the nodes in the flow chart: they require you to answer questions about your data and the problem you are solving.
i also think that particular flow chart is not the most useful. some of the choices seem arbitrary, as if they were just picking and choosing from whatever happened to be implemented in sklearn at the time
young granite
@wispy coyote @desert oar well first of all thanks that u took the time and explained it in more depth to me.
Im new to the field of DS and therefore appreciate it even more!
So u got any sources other then https://scikit-learn.org/stable/user_guide.html
to get more in touch with the procedure?
THANKS

scikit-learn
User Guide: Supervised learning- Linear Models- Ordinary Least Squares, Ridge regression and classification, Lasso, Multi-task Lasso, Elastic-Net, Multi-task Elastic-Net, Least Angle Regression, LA...
 dense lagoon
anyone here good with using annotated images to find location of data that you want to grab from a image based on the label?
serene scaffold
dense lagoon
anyone here good with using annotated images to find location of data that you w...
What have you tried? Have you identified a name for this task?
 weary goblet
Hey there,
Wanted to ask, when do i branch off away from python to learn Data science?
as in is there a milestone or a specific topic?
storm kelp
weary goblet
Hey there,
Wanted to ask, when do i branch off away from python to learn Data s...
how do you mean branch away? As in learn another language?
serene scaffold
weary goblet
Hey there,
Wanted to ask, when do i branch off away from python to learn Data s...
if you want to be a data scientist/AI developer, learning Python itself is the easiest part. you can start learning the actual theory at any time, because that's mostly theoretical math, not programming.
dense lagoon
do you guys think keras would be best and fast enough to process the year and mint of a coin?
serene scaffold
dense lagoon
do you guys think keras would be best and fast enough to process the year and mi...
The library you use isn't that important for how fast your model will train. Having a GPU is way more important.
Though I would suggest that you use pytorch.
I'm assuming this is image classification?
dense lagoon
yea and I wanted pytorch also, but my buddy is suggesting keras
serene scaffold
dense lagoon
yea and I wanted pytorch also, but my buddy is suggesting keras
More people these days are using pytorch
dense lagoon
Yea even tesla I believe
if my datasets are fairly small, no more than 10k, keras should be perfectly fine yea?
weary goblet
storm kelp
how do you mean branch away? As in learn another language?
As in learn the modules that are linked to data science like Pandas and Etc.
weary goblet
serene scaffold
if you want to be a data scientist/AI developer, learning Python itself is the e...
So your suggesting i start learning the theory simultaneously?
serene scaffold
The size of the dataset is irrelevant for deciding which neural network library to use. They both let you train neural networks.
storm kelp
weary goblet
As in learn the modules that are linked to data science like Pandas and Etc.
I'd start learning modules like numpy and pandas straight away
serene scaffold
weary goblet
So your suggesting i start learning the theory simultaneously?
sure, as long as you recognize how learning about data science and AI is largely a separate activity from learning about programming. Economists also write programs to help them do economic analysis, but they still mainly need to understand economics.
 lean hawk
Hey, Do i have to learn something before learn data science (I mean when you already know how to program)?
Like machine learning or something like that?
serene scaffold
lean hawk
Hey, Do i have to learn something before learn data science (I mean when you alr...
data science and machine learning are not mutually exclusive. but learning about different kinds of data (which I guess falls under "data science") might be an easier place to start.
weary goblet
serene scaffold
sure, as long as you recognize how learning about data science and AI is largely...
Oh wow!
im guessing Youtube is the way to go?
serene scaffold
weary goblet
Oh wow!
im guessing Youtube is the way to go?
Sure. You'll need a degree if you want to get an AI job, though.
lean hawk
serene scaffold
data science and machine learning are not mutually exclusive. but learning about...
ahh ok
weary goblet
Dayum, that hopefully should be in the works.
Well thank you, i now know what to look out for!
dense lagoon
serene scaffold
The size of the dataset is irrelevant for deciding which neural network library ...
yea just realized that, ima go with pytorch
better processing and predictions too
serene scaffold
dense lagoon
better processing and predictions too
the library you use won't affect what the predictions are.
dense lagoon
really? i heard many stories of keras being annoying to deal with when it comes tot hat
serene scaffold
being annoying for the programmer to use has nothing to do with what the weights of the model are, or what the outputs are for the same input.
lean hawk
serene scaffold
data science and machine learning are not mutually exclusive. but learning about...
So what should i learn first?
serene scaffold
lean hawk
So what should i learn first?
!resources data science
arctic wedgeBOT
Resources
The Resources page on our website contains a list of hand-selected learning resources that we regularly recommend to both beginners and experts.
dense lagoon
serene scaffold
being annoying for the programmer to use has nothing to do with what the weights...
hm okay nice
serene scaffold
lean hawk
Because there are a lot of fields
try "data science from scratch"
lean hawk
serene scaffold
try "data science from scratch"
ok, i'mma read that
torn elm
Hello
I am trying to solve a multiple linear regression model and I am getting R square as 1
The actual y and predicted y are same
Could anyone help me understand what happens or in which scenario this happens
storm kelp
noble tusk
You may also need to use `.reset_index()` to reset the indices to start from 0, ...
After the orderby() I'm guessing?
lapis sequoia
noble tusk
I know group_by() does at least
df groupby returns a DataFrameGroupBy object not a df.
storm kelp
lapis sequoia
df groupby returns a `DataFrameGroupBy` object not a df.
will it still work for what I want?
lapis sequoia
storm kelp
will it still work for what I want?
What do you want? I have not read chat, I just saw their message and found it was wrong.
storm kelp
storm kelp
I have a dataframe with columns a, b, and c. I want to group by a and b, and the...
@lapis sequoia
lapis sequoia
Lemme read.
lapis sequoia
storm kelp
<@456226577798135808>
Okay question, whats the need of group by here? You want unique rows having a and b and minimum c(having first occurance)
and lemme think about it.
storm kelp
lapis sequoia
Okay question, whats the need of group by here? You want unique rows having a an...
Yes. For each A + B column I want the row with the minimum value of C.
So I was suggested df.groupby('A', 'B').orderby('C').iloc[0]
I can understand the logic of why that would do what I want, I'm just not sure if Python will actually work with that logic
lapis sequoia
storm kelp
So I was suggested df.groupby('A', 'B').orderby('C').iloc[0]
Hm should work probably, did you check?
lapis sequoia
storm kelp
I can understand the logic of why that would do what I want, I'm just not sure i...
sometimes simplest way is to check? Take a small df and check.
storm kelp
Haven't tried it yet - need to wait till tomorrow when I'm back on my work computer
 dull fern
Hey, I have multiple neural networks that solve the same problem, I would like to know if their predictions could be combined to improve the overall performance. How would you do that ? Any specific plot that could give me a good insight ?
lapis sequoia
Also may be you could do better than orderby. Orderby is kinda sorting, finding min is O(n) and sorting is O(nlogn)
 strong cairn
hello guys
about A.I does anyone have any experience?
storm kelp
lapis sequoia
Also may be you could do better than orderby. Orderby is kinda sorting, finding ...
Not sure what you mean
arctic wedgeBOT
@lapis sequoia :white_check_mark: Your 3.11 eval job has completed with return code 0.
001 |         Max Speed  d
002 | Animal
003 | Falcon      370.0  1
004 | Parrot       24.0  4
say I have 10 values, how'd you give me minimum? by first sorting and then giving minimum or by just giving minimum.
lapis sequoia
storm kelp
https://spark.apache.org/docs/3.2.0/api/python/reference/pyspark.pandas/api/pysp...
neverused pyspark.
lapis sequoia
strong cairn
hello guys
about A.I does anyone have any experience?
Its a big field what are you looking for exactly?
storm kelp
lapis sequoia
say I have 10 values, how'd you give me minimum? by first sorting and then givin...
fair - but I thought giving the minimum might result in ties where there are two rows with the same minimum value in C
strong cairn
lapis sequoia
Its a big field what are you looking for exactly?
voice assistants to be more specific
and how they could interact with a web interface
lapis sequoia
storm kelp
fair - but I thought giving the minimum might result in ties where there are two...
Also I think I found solN. gimmi a sec.
strong cairn
strong cairn
and how they could interact with a web interface
I am looking for customizable ones
In terms of performance skills and overall functionality
lapis sequoia
!e
import pandas as pd
df = pd.DataFrame({'Animal': ['Falcon', 'Falcon', 'Falcon',
                              'Parrot', 'Parrot'],
                   'Max Speed': [380., 370., 370., 24., 26.],
                   'd': [1,2,3,4,5]})
print(df)
print('-'*20)
print(df.loc[df.groupby('Animal')['Max Speed'].idxmin()].reset_index(drop=True))
perfect.
arctic wedgeBOT
@lapis sequoia :white_check_mark: Your 3.11 eval job has completed with return code 0.
001 |    Animal  Max Speed  d
002 | 0  Falcon      380.0  1
003 | 1  Falcon      370.0  2
004 | 2  Falcon      370.0  3
005 | 3  Parrot       24.0  4
006 | 4  Parrot       26.0  5
007 | --------------------
008 |    Animal  Max Speed  d
009 | 0  Falcon      370.0  2
010 | 1  Parrot       24.0  4
@storm kelp seems good enough?
df.groupby('Animal') # you'll group by 2 cols here
df.groupby('Animal')['Max Speed'].idxmin() # finding row index of each df having max speed minimum, (we find each row index since there may be more fields)

df.loc[df.groupby('Animal')['Max Speed'].idxmin()]
# just taking those rows from original df

and at the end resetting index.
Looks good. What's the purpose of the .reset_index(drop=True)?
Is it just the result df will have strange indexes?
lapis sequoia
storm kelp
Looks good. What's the purpose of the` .reset_index(drop=True)`?
If you dont reset index, it would give original index of df, so in above case index would be 1 and 3.
about drop=True, if you dont give it, it creates this new column for id.
!e
import pandas as pd
df = pd.DataFrame({'Animal': ['Falcon', 'Falcon', 'Falcon',
                              'Parrot', 'Parrot'],
                   'Max Speed': [380., 370., 370., 24., 26.],
                   'd': [1,2,3,4,5]})
print(df)
print('-'*20)
print(df.loc[df.groupby('Animal')['Max Speed'].idxmin()].reset_index())
@lapis sequoia :white_check_mark: Your 3.11 eval job has completed with return code 0.
001 |    Animal  Max Speed  d
002 | 0  Falcon      380.0  1
003 | 1  Falcon      370.0  2
004 | 2  Falcon      370.0  3
005 | 3  Parrot       24.0  4
006 | 4  Parrot       26.0  5
007 | --------------------
008 |    index  Animal  Max Speed  d
009 | 0      1  Falcon      370.0  2
010 | 1      3  Parrot       24.0  4
ah ok
lapis sequoia
see, now you have extra column for index, if drop not provided.
storm kelp
Thanks for your help - I'll let you know tomorrow if it works in pyspark in the same way effectively
lapis sequoia
storm kelp
Thanks for your help - I'll let you know tomorrow if it works in pyspark in the ...
Sure!
storm kelp
lapis sequoia
Sure!
somewhat ironic - the 'solution' I found after trawling through stackoverflow was needlessly complicated and didn't actually work if there were rows tied. This solution seems much simpler and less computationally intensive
discord + documentation > stackoverflow
haha
lapis sequoia
storm kelp
somewhat ironic - the 'solution' I found after trawling through stackoverflow wa...
Honestly its about how we google a lot of times, I would be lieing if I say I did not stackoverflow, tahts the link
P.s. Now I know how to tackle this since I read whole thing and put the example here.
Stack Overflow
I have a DataFrame with columns A, B, and C. For each value of A, I would like to select the row with the minimum value in column B.
That is, from this:
df = pd.DataFrame({'A': [1, 1, 1, 2, 2, 2],
...
storm kelp
lapis sequoia
Honestly its about how we google a lot of times, I would be lieing if I say I di...
Fair enough. I guess sometimes the solution there isn't the best way though
 quaint plover
I have a somewhat datascience related question on help-coconut on intersection of sets if anyone has 5 min
novel python
what's the easiest way to count how many times a column has a minimum value when compared to 9 other columns in a dataframe?
serene scaffold
novel python
what's the easiest way to count how many times a column has a minimum value when...
what do you mean by "a minimum value"? do you want, for each column, the frequency of that column's minimum?
hasty mountain
Hey guys, which neural network structure tends to be more stable? A model that outputs floats between -1 and 1, or a model that outputs integers(an index to a list)?
PS: the list can have an index like 1500
serene scaffold
hasty mountain
Hey guys, which neural network structure tends to be more stable? A model that o...
what does the model in question do?
hasty mountain
serene scaffold
what does the model in question do?
Model 1: Outputs a number which will be used to get a key in a dictionary to return a proper response(since it's a RL model, it returns a command for a game)
Model 2: Outputs a number which will serve as an index to get a string in a list with the proper response(the command in question)
serene scaffold
hasty mountain
Model 1: Outputs a number which will be used to get a key in a dictionary to ret...
if each model has over 1500 possible options, I don't think you have enough training data to accomplish this.
hasty mountain
serene scaffold
if each model has over 1500 possible options, I don't think you have enough trai...
Why?
serene scaffold
hasty mountain
Why?
you'd need like millions of training instances
hasty mountain
Hm... I see...
I'm actually thinking about making the model play and create the data as it plays.
It'll receive a frame from the game as input, generate a random output, and them get a reward for that.
If the reward is good, that frame+action will become the dataset for a supervised learning
serene scaffold
anyway, normalizing the range for the output (which is what you were getting at with the -1, 1 thing) is often good, but you can't do that if you're treating each option as discrete
and if the output is a dict key, that is discrete.
hasty mountain
Oh, I see...
I always used a normalized range for my output, so I don't know for sure the consequences of not doing so.
serene scaffold
that's fine for things that are continuous
hasty mountain
And I'm doing this model based on NLP...and in NLP, the output isn't normalized, at least as far as I've seen
hasty mountain
serene scaffold
that's fine for things that are continuous
Like RGB images?
serene scaffold
hasty mountain
Like RGB images?
yes, RGB values are continuous, because a pixel can have any amount of each color from 0 to 1. and 0.880000000001 is meaningfully different from 0.89
hasty mountain
Oh, I see
turbid arch
turbid arch
Hello, I have a question: can ML use a voice module known as pyttsx3? If not the...
Ahem I will say for the third time: ANYONE???
serene scaffold
turbid arch
Hello, I have a question: can ML use a voice module known as pyttsx3? If not the...
I guess no one knows what that is.
hasty mountain
serene scaffold
yes, RGB values are continuous, because a pixel can have any amount of each colo...
What if I use KNN to make an output 0.88 be compatible with my dict with value 0.89?
I'm doing this, actually. It's helpful, but I don't know if this affects the performance
serene scaffold
hasty mountain
What if I use KNN to make an output 0.88 be compatible with my dict with value 0...
nope. dict keys have to be totally exact.
again, continuous vs discrete.
hasty mountain
I see...but why? if the model outputs 0.88, which is closer to 0.89 than to 0.71, then it wouldn't be a problem to consider it a 0.89, right?
serene scaffold
hasty mountain
I see...but why? if the model outputs 0.88, which is closer to 0.89 than to 0.7...
sure, but then you'd have to do a binary search every time to find the closest defined value.
hasty mountain
serene scaffold
sure, but then you'd have to do a binary search every time to find the closest d...
Yes, but it's quite fast. After fitting the KNN to the dictionary, making the KNN work with the output is ok.
The only problem is fitting the KNN to big dictionaries...that take quite a long time
serene scaffold
I'd be really surprised if you can get good performance doing that.
hasty mountain
serene scaffold
I'd be really surprised if you can get good performance doing that.
What do you expect from this? The gradients getting crazy?
serene scaffold
pretty much
hasty mountain
Hm... Good to know. Then I'll double check my testing process...
hasty mountain
serene scaffold
pretty much
Also...tell me something... What is the difference between using an Embedding layer with...let's say...a matrix of size 10 and output of size 1, and using a fully conected layer which receives 10 features and outputs 1 feature?
For this model, I was thinking about using embedding layers, but I don't see how much this would benefit the model in relation to a dense layer
serene scaffold
hasty mountain
Also...tell me something... What is the difference between using an Embedding la...
not sure tbh. I still have a lot to learn.
hasty mountain
serene scaffold
not sure tbh. I still have a lot to learn.
Oh, ok...
So...why are they used in the beginning of the model, rather than the ending?
Or in the middle...
novel python
serene scaffold
what do you mean by "a minimum value"? do you want, for each column, the frequen...
im testing a variety of models against a label column, so I want to know how many times each of the models got the minimum value per row (every row is a different client usage of mobile data)
hasty mountain
But never in the ending
serene scaffold
is "embedding layer" a keras-specific term? because that would explain why I haven't heard of it.
are you using keras @hasty mountain?
hasty mountain
Uh...it's used for keras and for pytorch
I'm actually using Pytorch
Perhaps you might know it as embedding matrix
serene scaffold
what kind of neural network is this?
hasty mountain
Mine? Or the embedding?
serene scaffold
the network that you're making
hasty mountain
It gets a frame from a game, decomposes it through convolutions and, in the end, it passes through a linear layer to get an output value which corresponds to an action to be perfomed in the game
A Reinforcement Learning algorithm
serene scaffold
how many linear layers do you have?
hasty mountain
Just one
serene scaffold
that's probably not going to be enough
hasty mountain
Why?
serene scaffold
more layers means more memory capacity for the model, and more opportunity to learn subtle relationships between inputs
serene scaffold
sure, but aren't convolutions and maxpools just "distilling" the image? if you only have one linear layer, you're still saying that once the image is "distilled", the relationship between it and what you're trying to learn can be learned with one transformation.
hasty mountain
Hm... Well, the convolutions and maxpools serve as feature extractors
At least in VGG, they use convs + maxpools as feature extractors and, then, 2 linear layers if I'm not mistaken
I'm just using fewer convs and a single linear layer
So, the model will extract features from the image, and, based on the most relevant features, will generate an output...which can be a value from a dictionary, or, as I'm considering now, a value that will be converted to an integer and then be used as a list index
 weary crown
import pandas as pd
import numpy as np
from numpy import sqrt
from sklearn.preprocessing import MinMaxScaler
from sklearn.tree import DecisionTreeRegressor
from sklearn.metrics import mean_squared_error
from sklearn.model_selection import train_test_split
from sklearn.model_selection import cross_val_score
from nptyping import NDArray, Int, Shape
import pickle

# read in csv into dataframe
df = pd.read_csv(r"C:\Users\josmo\Downloads\creditcard.csv")

target = df['Class']
df.pop('Class')

scaler = MinMaxScaler(feature_range=(-1, 1))

# feature scale each column
for column in df.columns:
    scaler.fit(df[column].values.reshape(-1, 1))
    df[column] = scaler.transform(df[column].values.reshape(-1, 1) + 1e-4)

data_train, data_test, target_train, target_test = train_test_split(
    df, target, test_size=0.2, random_state=42)

tree_reg = DecisionTreeRegressor()
tree_reg.fit(data_train, target_train)

# Testing
housing_predictions = tree_reg.predict(pd.concat([data_test, target_test]))

# RMSE evaluation
lin_mse = sqrt(mean_squared_error(target_test, housing_predictions))
print(f"Loss: {lin_mse}")

# Cross Validation
scores = cross_val_score(tree_reg, target_train, target_test, scoring="neg_mean_squared_error", cv=10)
tree_rmse_scores = sqrt(-scores)

# Display Cross Validation results
def display_scores(scores):
print(f"Scores: {scores}\nMean: {scores.mean()}\nStandard Deviation: {scores.std()}")```so um
C:\Users\josmo\PycharmProjects\FraudDetection\venv\lib\site-packages\sklearn\utils\validation.py:1858: FutureWarning: Feature names only support names that are all strings. Got feature names with dtypes: ['int', 'str']. An error will be raised in 1.2.
  warnings.warn(
C:\Users\josmo\PycharmProjects\FraudDetection\venv\lib\site-packages\sklearn\base.py:450: UserWarning: X does not have valid feature names, but DecisionTreeRegressor was fitted with feature names
  warnings.warn(
Traceback (most recent call last):
  File "C:\Users\josmo\PycharmProjects\FraudDetection\main.py", line 32, in <module>
    housing_predictions = tree_reg.predict(pd.concat([data_test, target_test]))

ValueError: Input X contains NaN.
DecisionTreeRegressor does not accept missing values encoded as NaN natively. For supervised learning, you might want to consider sklearn.ensemble.HistGradientBoostingClassifier and Regressor which accept missing values encoded as NaNs natively. Alternatively, it is possible to preprocess the data, for instance by using an imputer transformer in a pipeline or drop samples with missing values. See https://scikit-learn.org/stable/modules/impute.html You can find a list of all estimators that handle NaN values at the following page: https://scikit-learn.org/stable/modules/impute.html#estimators-that-handle-nan-values```it would be better to have an output layer with as many values as there are options. and if the maximum is the nth element, then the result is whatever n represents.
weary crown
I somehow have NaN values but I used df.dropna() - but it didnt work and i still dont know where i get nan values from??
df.isnull().sum().sum()``` used this to count NaN values in the df but it printed 0... so where the error is from??But why? I don't want to use categorical cross entropy, since I'll have more than 1000 options. Can't I output a single value and use MSE or MAE?
serene scaffold
weary crown
```py
import pandas as pd
import numpy as np
from numpy import sqrt
from sklearn...
looks like you're using the same MinMaxScaler for every feature. but each feature needs its own one of those, and you need to keep them. every time you re-fit the same MinMaxScaler, you reset it.
serene scaffold
hasty mountain
But why? I don't want to use categorical cross entropy, since I'll have more tha...
only if whichever values are 0.005 apart are actually 0.005 different in some way.
weary crown
serene scaffold
looks like you're using the same MinMaxScaler for every feature. but each featur...
shouldnt it reset because I fit a new one each for loop pass?
scaler.fit(df[column].values.reshape(-1, 1))```also, what does that have to do with naN values?
serene scaffold
weary crown
shouldnt it reset because I fit a new one each for loop pass?
```py
scaler.fit(d...
you don't want to keep resetting it. you need to be able to re-encode a given feature the same way.
hasty mountain
serene scaffold
only if whichever values are 0.005 apart are actually 0.005 different in some wa...
Uuuuh...well...that 0.005 difference can mean a click in window coordinates(100, 100) and a click in (100, 101), does it count?
(Also, when using tensor.long, Pytorch rounds 1.0005 to 1...and 0.0095 to 0)
serene scaffold
hasty mountain
(Also, when using `tensor.long`, Pytorch rounds 1.0005 to 1...and 0.0095 to 0)
I'm just making a point.
weary crown
serene scaffold
you don't want to keep resetting it. you need to be able to re-encode a given fe...
ooh okay
serene scaffold
hasty mountain
Uuuuh...well...that 0.005 difference can mean a click in window coordinates(100,...
that might work. what were you referring to earlier about looking up strings for responses?
!paste
arctic wedgeBOT
Pasting large amounts of code
If your code is too long to fit in a codeblock in Discord, you can paste your code here:
https://paste.pythondiscord.com/
After pasting your code, save it by clicking the floppy disk icon in the top right, or by typing ctrl + S. After doing that, the URL should change. Copy the URL and post it here so others can see it.
weary crown
so i fit it on the first column only?
 chrome lake
Can't post my code.
serene scaffold
weary crown
so i fit it on the first column only?
you need a different encoder for each feature. MinMaxScaler is an encoder.
chrome lake
It's not a code related isue anyways
serene scaffold
chrome lake
Can't post my code.
well, no one wants to help over DMs until they know for sure what the question is. because people don't want to get DMs that they have to read before finding out if they can do anything with it.
weary crown
serene scaffold
you need a different encoder for each feature. MinMaxScaler is an encoder.
ooh so min max shouldnt be for more than one feature? One problem tho
i have 10 feature s- are three 10 different encoder methods??
serene scaffold
weary crown
i have 10 feature s- are three 10 different encoder methods??
are you sure that every feature should be min-max encoded? but yes, you'd need ten separate encoders.
hasty mountain
serene scaffold
that might work. what were you referring to earlier about looking up strings for...
Oh, well, I was saying about a dictionary with values. So you could have something like:
input_map = {'click_(100, 100)': 0.0095, 'click_(100, 101)': 1.0005}
So, if the model output is, like, 0.0097, KNN would convert it to 0.0095, and then the command would be to click on coordinates 100,100. If the output is 1.003, KNN converts to 1.005, then, click on 100,101
weary crown
serene scaffold
are you sure that every feature should be min-max encoded? but yes, you'd need t...
This dataset is about fraud detection and the creator of the dataset refused to release what the features actually are so he named them V1 V2...
Min maxing everything should be okay
i just need to fix the Nan error which isnt caused by min maxing
this dataset is large so heavily reduced sampling noise so i have leeway
this is my first real ml project sorta thingy 😐
serene scaffold
weary crown
This dataset is about fraud detection and the creator of the dataset refused to ...
that's fine if you don't know what they represent, but the MinMaxScaler depends on the minimum and maximum value that it sees when you fit it. and then after you fit it, it scales everything to be between those two numbers
so each feature, which has its own min and max, needs its own minmaxscaler.
hasty mountain
hasty mountain
Oh, well, I was saying about a dictionary with values. So you could have somethi...
Uh...on second thought, perhaps converting floats like 1.999999 to 1 like Pytorch does might actually affect the model a little badly...so, integers would be best with softmax.
serene scaffold
weary crown
so thats what im doing by resetting each column right
you need separate instances of MinMaxScaler
weary crown
serene scaffold
you need separate instances of MinMaxScaler
# feature scale each column
for column in df.columns:
    scaler = MinMaxScaler(feature_range=(-1, 1))
    scaler.fit(df[column].values.reshape(-1, 1))
df[column] = scaler.transform(df[column].values.reshape(-1, 1) + 1e-4)``` like this? The NaN error is still there... :((you need to save the scaler for each one. in a dict, or something.
anyway, I'd have to see the data and do it myself to figure out what's happening. also don't put the arrays in the dataframe
weary crown
serene scaffold
you need to save the `scaler` for each one. in a dict, or something.
anyway, I'...
oh ok

Anonymized credit card transactions labeled as fraudulent or genuine
 queen holly
I could use some advise on a dataset that I have to be able to slice and filter, essentially it is a collection of message types (in the hundreds of variants) each message having a different set of fields / attributes. As an example

Am I better off to keep this as a single data frame and turn into something that has every possible attribute as columns
or do I convert this into a DF of DFs and manage every message as it's own DF
serene scaffold
queen holly
or do I convert this into a DF of DFs and manage every message as it's own DF
you never want a "dataframe of dataframes". sounds like you want a dataframe with more than one level of indexing
queen holly
yeah I was investigating that too
my thought is that I'm going to be wanting to split up the attribute:data such that each attribute will be it's own column
since each message_type has it's own collection of attributes then my only option would be to create one master list of all attributes (possibly hundreds)_ as a superset of attributes across all message types...
desert oar
young granite
<@459119350851567626> <@389497659087650836> well first of all thanks that u took...
the user guide is pretty good actually. the problem with scikit-learn (i had this same exact problem when i started) is that it gives you the impression that you actually will need to know and use like 20 different kinds of models
the truth is that you really don't, at least not at first
i also want to be clear that i'm not trying to resist making a recommendation here. but i legitimately don't know enough about your problem to recommend something
i could say that in general you have a few options for doing regression on an unknown dataset of sufficient size and "density" of data: GAM, random forest, gradient boosting, shallow feedforward NN
if you're going to study up on algorithms, those are the ones to consider if you are just trying to predict something with minimal error
(by "density" i mean that you have good coverage across the range of the data within your dataset)
but "minimize prediction error according to one specific metric" is usually not a useful goal except as a study tool and/or in well-defined business automation problems
minor coral
Hello, does anyone knows how to create cgan with custom dataset?
arctic wedgeBOT
Hey @undone mirage!
It looks like you tried to attach file type(s) that we do not allow (.pdf). We currently allow the following file types: .gif, .jpg, .jpeg, .mov, .mp4, .mpg, .png, .mp3, .wav, .ogg, .webm, .webp, .flac, .m4a, .csv, .json.
Feel free to ask in #community-meta if you think this is a mistake.
lapis sequoia
Anyone have a good place to learn NLP from?
 craggy wadi
Hi everyone, I am looking for resources that explain how to implement a Binary search tree to store an object with multiple attributes in python.
rugged comet
Please explain to me what projection means in the context of the shapes of data.
young granite
desert oar
the user guide is pretty good actually. the problem with scikit-learn (i had thi...
truth is i dont really know either hahaha.
I want to prepare myself for DS with old sets of data i got, cause those are sets i do understand.
Its just that i want to do some preparation and getting in touch with DS in general.
The books I have consulted so far sometimes lack explanations from the beginning, as would be the case in a "normal" lecture.
hasty mountain
minor coral
Hello, does anyone knows how to create cgan with custom dataset?
You just have to create a CGAN...and then pass your own dataset.
Curiously, I was taking a look at exactly this:
You basically just create a GAN and then concatenates the input to your conditioner(before passing the input to both the discriminator and generator). Remember to concatenate it in your channels dimension
I don't know quite the logic behind it...but this makes me feel stupid because now I have to fix my code for an audio generator...where I concatenated in the batch dimension
minor coral
But the thing is, i dont know how to process the images i have that matches the cgan
I saw a sample code of cgan but it uses mnist dataset , and I dont know how to implement the images I have as the dataset in the model
🥲
hasty mountain
minor coral
I saw a sample code of cgan but it uses mnist dataset , and I dont know how to i...
Take a look at the first function
And ignore the audio part...specially the preprocessing
minor coral
Does the dataset there can be use here?

GitHub
A pytorch implementation of conditional GAN. Contribute to arturml/mnist-cgan development by creating an account on GitHub.
hasty mountain
Yes, it can. You'll just have to convert it from numpy to pytorch tensor
tensor_data = torch.from_numpy(numpy_data)
tensor_data = tensor_data.view(tensor_data.size(0), tensor_data.size(3), tensor_data.size(1), tensor_data.size(2))
@hasty mountain thank you so much imma try it later!
hasty mountain
Numpy(keras, tensorflow) uses dimensions (N_samples, Height, Width, Channels), while Pytorch uses (N_samples, Channels, Height, Width)
minor coral
Imma back later for questions but thank you!!
rugged comet
What do I do when I have inputs of different shapes?
ValueError: A `Concatenate` layer requires inputs with matching shapes except for the concatenation axis. Received: input_shape=[(None, 376, 16), (None, 19), (None, 2644, 128)]
I tried this
    # Get all inputs to same shape
    type_x = layers.Dense(8)(type_x)
    converted_mana_cost_x = layers.Dense(8)(converted_mana_cost_x)
    text_x = layers.Dense(8)(text_x)
But that resulted in a similar error
ValueError: A `Concatenate` layer requires inputs with matching shapes except for the concatenation axis. Received: input_shape=[(None, 376, 8), (None, 8), (None, 2644, 8)]
Apply padding with zeros so they all have the same shape as the highest shape
rugged comet
hasty mountain
Apply padding with zeros so they all have the same shape as the highest shape
I think I have to use this somehow
https://www.tensorflow.org/api_docs/python/tf/pad
But I don't know how to use it to essentially add another axis of zeroes.
TensorFlow
Returns a tensor with a length 1 axis inserted at index axis.
dense lagoon
damn you guys are all smart fr
quaint plover
I'm looking for some support into using sets to find intersections between two sets (one list of keywords and a list of strings), channel help-candy
 charred light
I think this is hilarious. I would assume most API would have a limiting factor.

 mortal dove
You would also have no idea what the underlying architecture looks like, so even if you could get enough data for a training set, you wouldn't be able to replicate it 😂
 desert parcel
The values produced by MSE, RMSE, R2 score, etc. Show loss which is how good or bad your model is at predicting.
So does that mean that loss is actually variance? Since the higher the loss the more inaccurate your predictions are and the further away from the actual values they are from the labels.
 plush glacier
charred light
I think this is hilarious. I would assume most API would have a limiting factor.
plush glacier
charred light
I think this is hilarious. I would assume most API would have a limiting factor.
For education use should it be allowed but if anyone would try they should ask first
minor coral
ValueError                                Traceback (most recent call last)
<ipython-input-18-1b5f3d095e18> in <module>
      1 batch_size = 32
      2
----> 3 data_loader = torch.utils.data.DataLoader(MNIST(root="/content/dataset",train=True,download=True,transform=transform),
      4                                           batch_size=batch_size, shuffle=True)

3 frames
/usr/local/lib/python3.7/dist-packages/torchvision/datasets/mnist.py in read_sn3_pascalvincent_tensor(path, strict)
    524     # we need to reverse the bytes before we can read them with torch.frombuffer().
    525     needs_byte_reversal = sys.byteorder == "little" and num_bytes_per_value > 1
--> 526     parsed = torch.frombuffer(bytearray(data), dtype=torch_type, offset=(4 * (nd + 1)))
    527     if needs_byte_reversal:
    528         parsed = parsed.flip(0)

ValueError: offset (16 bytes) must be non-negative and no greater than buffer length (16 bytes) minus 1
does somebody knows how to fix this error?
What I did was replace the downloaded mnist file with the file I created, but it now show this error
 dusk tide
I am working on a college project. The project is "Plant species identification " . So I have decided to do this via deep learning . But unable to find a good dataset with lots of images like around 1000s of each category. Can someone guide ??
 wind patrol
Hello there, im extremely new to ai and ml, and was just getting the dice rolling, i was working on an image scene classification thing using VGG16 from the keras import lib, i was getting an error when i was tryna get results for a run , my full traceback is as follows-
MemoryError                               Traceback (most recent call last)
c:\Users\blufl\OneDrive\Desktop\CNN shtuff\Researchpaper.ipynb Cell 8 in <cell line: 52>()
     48 labels = lb.fit_transform(labels)
     50 # perform a training and testing split, using 75% of the data for
     51 # training and 25% for evaluation
---> 52 (trainX, testX, trainY, testY) = train_test_split(np.array(data),
     53     np.array(labels), test_size=0.25)
     55 # define our Convolutional Neural Network architecture
     56 '''model = Sequential()
     57 model.add(Conv2D(8, (3, 3), padding="same", input_shape=(128, 128, 3)))
     58 model.add(Activation("relu"))
   (...)
     76 model.add(Dense(6))
     77 model.add(Activation("softmax"))'''

MemoryError: Unable to allocate 19.1 GiB for an array with shape (17034, 224, 224, 3) and data type float64```
im not sure how to fix this!paste
this is the full code for training and testing part at least
i had made another cell in jupyter, to do the exact same thing- and it gave me an entirely different error
^^^ above is the 2nd error when run on a different cell along with the code that was used
 mild dirge
wind patrol
Hello there, im extremely new to ai and ml, and was just getting the dice rollin...
mild dirge
wind patrol
Hello there, im extremely new to ai and ml, and was just getting the dice rollin...
How much memory do you have?
wind patrol
mild dirge
How much memory do you have?
i have 16gb of ram and 8gb vram on my gpu
mild dirge
So when trying to allocate 19.1 GB, that will not be enough
wind patrol
im not sure why its trying to allocate that much
mild dirge
(17034, 224, 224, 3)
This is the shape
That is basically 17 thousand RGB images of 224x224 pixels
wind patrol
the shape shud be (none,224,224,3)
mild dirge
Can't allocate that all at once, so a solution would be to do it in batches
mild dirge
wind patrol
the shape shud be (none,224,224,3)
What do you mean with the none though? iirc in keras that is a placeholder for the batch size
mild dirge
which in your case is 17k (because you are probably trying to do it all in 1 batch)
wind patrol
yep, when using the sequential base, it never gave me this issue, in total i have around 24,000 imgs which are of 32x32 each
when ran on sequential the shape used (None,128,128,3)
mild dirge
32x32 is a lot less pixels than 224x224
mild dirge
Anyways, whatever the shape is, if you don't have enough memory to load it all in at once, load it in in batches
wind patrol
checks out
 wind patrol
mild dirge
Anyways, whatever the shape is, if you don't have enough memory to load it all i...
wind patrol
mild dirge
Anyways, whatever the shape is, if you don't have enough memory to load it all i...
how shud i do that?
wind patrol
wind patrol
https://paste.pythondiscord.com/utakelafab
if i can ask something- why is it that, when the same code is ran in a diff cell, just the training part (lines 2-10) on this link here, why is it giving a value error then
mild dirge
I'm not super comfortable with keras, but this link shows an example of how to do transfer learning with vgg16, there are code snippets in there for an image generator, which takes the directory with images, and loads them in batches
 mild dirge
wind patrol
if i can ask something- why is it that, when the same code is ran in a diff cell...
mild dirge
wind patrol
if i can ask something- why is it that, when the same code is ran in a diff cell...
If the error is different, then probably something is different, when using a notebook the order in which you run cells matter, as variables "stick around" when you've ran a cell
wind patrol
mild dirge
If the error is different, then probably something is different, when using a no...
then the mem error is probably due to a seperate variable\
and i think ik why thats happening
mild dirge
The memory error is simply because you try to make an array that is too large
wind patrol
yep
now what im confused about is, when im using the same exact same test with vgg16 instead of sequential, the error comes up, however it never happened on sequential before
wind patrol
yep
its not pretrained, but its from keras only
ValueError: Input 0 of layer "vgg16" is incompatible with the layer: expected shape=(None, 224, 224, 3), found shape=(None, 128, 128, 3)
so the value error is coming cuz of the shape
mild dirge
So is your data of shape (batch size x)128x128x3?
wind patrol
ye
mild dirge
The model expects the images to be 224x224 then
wind patrol
ye
mild dirge
Which is not the same shape as your data
wind patrol
im not sure how to get around that then
wind patrol
alright one sec lemme try it
mild dirge
With resize I really mean resize and not reshape
wind patrol
mild dirge
Or use a model that expects 128x128
i kinda need it to be vgg16, cuz its for a school project
wind patrol
mild dirge
With resize I really mean *resize* and not *reshape*
yep
mild dirge
yeah resizing is the most logical option then
wind patrol
the original images are 32x32 but i resized them to 128x128 to make sequential work
mild dirge
Kind of a waste of resources and memory to have such small images and resize them to work with a larger model
Probably prone to overfitting too, the model is probably too large for the simplicity of the data and the problem
 mild dirge
Alright, well that makes a bit more sense then
So keras probably has a resize function, otherwise you can use something like opencv or something
wind patrol
ye thats what im using
mild dirge
mild dirge
So keras probably has a resize function, otherwise you can use something like op...
Oh you already resized, so you probably know how ^^
wind patrol
mhm running the test now again, lets hope it works
mild dirge
Running it in batches now, or all at once?
mild dirge
32 should be alright when you have that much memory
That is 4816896 floats, so only a few megabytes
wind patrol
it gave a mem error still
mild dirge
Could you show it?
wind patrol
so like im running it even smaller batches
wind patrol
mild dirge
Could you show it?
after it crashes again sure
mild dirge
alright haha
wind patrol
like show as in on like a vc or like just a screengrab, cuz for 128x128 images, 32 batch size worked fine
mild dirge
wind patrol
it gave a mem error still
just a screencap of this
wind patrol
my pc is lagging more lets hope its doing something :hidesthepain:
mild dirge
It should be like 38 megabytes if the shape is 32x224x224x3
So if that gives a memory problem, there might be another issue

 mild dirge
So it is still loading it all at once
mild dirge
mild dirge
https://www.learndatasci.com/tutorials/hands-on-transfer-learning-keras/
Maybe check out this link I sent, it seems like they do it in batches too
They also use vgg16, so it should be pretty simple to follow
wind patrol
leme have a look
mild dirge
This part especially
 wind patrol
ye so thats exactly how im doing it
the batch size part at least
since im using a different optimiser in adam
its still tryna run itself together
im so confused
i might try to take their approach once
 viscid flume
How do pytorch extensions work after being installed? The extension in question is:
https://github.com/siemanko/torch-unified/tree/master
(PS: I already asked in #help-cake , but got no response)

GitHub
Contribute to siemanko/torch-unified development by creating an account on GitHub.
viscid flume
Eh, anyone there?😅
viscid flume
viscid flume
How do pytorch extensions work after being installed? The extension in question ...
Actually, I think the problem is how I can get unified memory in pytorch through this.
minor coral
does anyone knows how to convert png, jpg to mnist format dataset?
I tried this code but it isnt working https://github.com/gskielian/JPG-PNG-to-MNIST-NN-Format
GitHub
Python/Bash scripts for creating custom Neural Net Training Data -- this repo is for the MNIST format - GitHub - gskielian/JPG-PNG-to-MNIST-NN-Format: Python/Bash scripts for creating custom Neural...
hasty mountain
minor coral
does anyone knows how to convert png, jpg to mnist format dataset?
Use PIL.Image
It'll open the JPG/PNG image as PIL Image object, then you can simply call np.array(image) on that
minor coral
but I also need the labels and such
hasty mountain
minor coral
but I also need the labels and such
Are the labels in the image filename?
Are the images organized like: "class1.png", where class is that image class?
hasty mountain
Oh, then it's quite easy
minor coral
hasty mountain
Oh, then it's quite easy
man, im a beginner T_T
like 5weeks

these are my classes looks like
I got the dataset from : https://www.kaggle.com/datasets/jamesnogra/baybayn-baybayin-handwritten-images?select=a.uVWU-James.jpg
and group them
Baybayín is a ore-colonial script used by Filipinos.
 hasty mountain
minor coral
man, im a beginner T_T
hasty mountain
minor coral
man, im a beginner T_T
Try something like this:
labels = []

for directory, filename, folder in os.walk(path):
            for file in folder:
                pics.append(directory+'/'+file)
                labels.append(directory)
I don't remember if this filename is indeed the filename. Usually I just use directory and folder
Path is indeed the path to your directory, like C:/User/Dataset
Inside Dataset, each folder will be directory. So, if you have Dataset/label1, label 1 will become directory.
Inside directory, each image wil be file.
So if you have C:/User/Dataset, pass it as path, then directory will be your labels, and then remove that for file in folder, as your folder will already be your images.
viscid flume
Does anyone know how to use a wrapper or something to change the memory allocator in pytorch?
minor coral
@hasty mountain https://github.com/gskielian/JPG-PNG-to-MNIST-NN-Format can you explain me how this works?
GitHub
Python/Bash scripts for creating custom Neural Net Training Data -- this repo is for the MNIST format - GitHub - gskielian/JPG-PNG-to-MNIST-NN-Format: Python/Bash scripts for creating custom Neural...
I tried this but it isnt working
hasty mountain
# Load from and save to
Names = [['./training-images','train'], ['./test-images','test']]

for name in Names:

    data_image = array('B')
    data_label = array('B')
It'll create a list of lists Name, where each element is a list with element 0 being the images path and element 1 being where you'll save the images array.
Then it'll just iterate through the images path, append each image to a new list.
This new list will be used to open each image with PIL Image, resize them as you wish, and then make some preprocess things that I don't really understand, and finally create the dataset in bytes type
Honestly, though...simply try using the way it's in the DatasetCreator I've sent...it's way easier.
If you need the image in bytes and grayscale, just add image.convert('L') in the code.
Resizing images can also be done with image.resize((height, width)) instead of iterating through each pixel
 cold saddle
How would i go about making a reccomendation system based on images AND descriptions.
I am able to use cosine similarity on the descriptions which has been working well to make reccomendations.
But now i want to suggest products that looks similar.
I am looking for something simple not state of the art.
I am using the Amazon Berkely dataset.
https://amazon-berkeley-objects.s3.amazonaws.com/index.html
Amazon Berkeley Objects Dataset
My inital thought was to keep them seperate. Reccomend similar images. Then reccomend similar descriptions and do some weighting of the two.
 copper fjord
def findPeakInterval(dag, time, kwh):

    fåForbrukMaxdf = Forbruk_Dag_Time.reset_index()
    finneForbrukMax = fåForbrukMaxdf['KWH 60 Forbruk'].max()
    filter_forbrukMax = (fåForbrukMaxdf['KWH 60 Forbruk'] == finneForbrukMax)
    filter_forbrukMax = fåForbrukMaxdf.loc[filter_forbrukMax]
    forbrukMaxDagNr = filter_forbrukMax.iloc[0]['Dag']
    forbrukMaxTimeNr = filter_forbrukMax.iloc[0]['Time']
    forbrukMaxKWh = filter_forbrukMax.iloc[0]['KWH 60 Forbruk']
    return forbrukMaxDagNr[dag], forbrukMaxTimeNr[time], forbrukMaxKWh[kwh]

findPeakInterval(1,1,1)```cant seem to assign each return variable to their own respective indexes.
 serene scaffold
copper fjord
```py
def findPeakInterval(dag, time, kwh):
fåForbrukMaxdf = Forbruk_Da...
serene scaffold
copper fjord
```py
def findPeakInterval(dag, time, kwh):
fåForbrukMaxdf = Forbruk_Da...
please do print(fåForbrukMaxdf.head().to_dict('list')), put the text (no screenshots) in the chat, and explain what you're trying to do without any code.
you can also do print(Forbruk_Dag_Time.reset_index().head().to_dict('list'))
Please ping me when you have done that.
copper fjord
serene scaffold
Please ping me when you have done that.
output:
{'Time': ['18'], 'Dag': [12], 'KWH 60 Forbruk': [7.981]}
so there's only three columns, and each one only has one value?
I need to know what the data looks like before you try doing any of this.
serene scaffold
I can't help. sorry.
copper fjord
look, what i want is to extract each columum from this mini-dataframe as their each own variable
@serene scaffold
can't be that hard right
serene scaffold
copper fjord
look, what i want is to extract each columum from this mini-dataframe as their e...
seems like a weird thing to want to do.
In [8]: pd.DataFrame({'Time': ['18'], 'Dag': [12], 'KWH 60 Forbruk': [7.981]})
Out[8]:
  Time  Dag  KWH 60 Forbruk
0   18   12           7.981

In [9]: df = _

In [10]: df.iloc[0]
Out[10]:
Time                 18
Dag                  12
KWH 60 Forbruk    7.981
Name: 0, dtype: object

In [11]: list(df.iloc[0])
Out[11]: ['18', 12, 7.981]
you can just return list(df.iloc[0]), and if there's three variables to "catch" the result, it will be what you want.
serene scaffold
copper fjord
how do i extract them to their own variable
a, b, c = df.iloc[0]
thanks
serene scaffold
trying to end this channel for everyone? 
copper fjord
wait
😭
def findPeakInterval(x,y,z):

    fåForbrukMaxdf = Forbruk_Dag_Time.reset_index()
    finneForbrukMax = fåForbrukMaxdf['KWH 60 Forbruk'].max()
    filter_forbrukMax = (fåForbrukMaxdf['KWH 60 Forbruk'] == finneForbrukMax)
    filter_forbrukMax = fåForbrukMaxdf.loc[filter_forbrukMax]
    forbrukMaxDagNr, forbrukMaxTimeNr, forbrukMaxKWh = filter_forbrukMax.iloc[0]
    x,y,z = forbrukMaxDagNr, forbrukMaxTimeNr, forbrukMaxKWh
    return forbrukMaxDagNr[x], forbrukMaxTimeNr[y], forbrukMaxKWh[z]


findPeakInterval(x)```today is not my day man
still error
serene scaffold
forbrukMaxDagNr, forbrukMaxTimeNr, forbrukMaxKWh isn't similar to what I said
you showed me a dataframe with one row. where is that?
copper fjord
it is
filter_forbrukMax```and you just want to return the three values that are in it, right?
serene scaffold
so return filter_forbrukMax.iloc[0]
if you do list(filter_forbrukMax.iloc[0]), you get the three values in a list. they aren't keys for looking up the values, like you seemed to assume when you wrote return forbrukMaxDagNr[x], forbrukMaxTimeNr[y], forbrukMaxKWh[z]
copper fjord
serene scaffold
if you do `list(filter_forbrukMax.iloc[0])`, you get the three values in a list....
one last thing, is there any way i can use these three variables outside of the function?

do i have to set each variable as
global```
?I will not look at screenshots of text
!code
arctic wedgeBOT
Here's how to format Python code on Discord:
```py
print('Hello world!')
```
These are backticks, not quotes. Check this out if you can't find the backtick key.
serene scaffold
But generally speaking, the global keyword is only for if you want to overwrite the variable for the whole module. you can always read module-level variables.
 vale prawn
print('hello world!')
def findPeakInterval():
    global
    fåForbrukMaxdf = Forbruk_Dag_Time.reset_index()
    finneForbrukMax = fåForbrukMaxdf['KWH 60 Forbruk'].max()
    filter_forbrukMax = (fåForbrukMaxdf['KWH 60 Forbruk'] == finneForbrukMax)
    filter_forbrukMax = fåForbrukMaxdf.loc[filter_forbrukMax]
    x = list(filter_forbrukMax.iloc[0])
    forbrukMaxDagNr,forbrukMaxTimeNr,forbrukMaxKWh = x[0], x[1], x[2]
    return forbrukMaxDagNr, forbrukMaxTimeNr, forbrukMaxKWh

findPeakInterval()```Hello, @vale prawn!
copper fjord
now i can't use these return values outside the function
serene scaffold
copper fjord
```py
def findPeakInterval():
global
fåForbrukMaxdf = Forbruk_Dag_Time.r...
I'm not sure that you're paying attention to what I'm saying. That, or you're giving me incorrect answers to my questions. If filter_forbrukMax is the DataFrame with the three values you want to return, all you need to do is return filter_forbrukMax.iloc[0]. If filter_forbrukMax is not the DataFrame with the three values you want to return, then you gave me wrong info.
def findPeakInterval():
    fåForbrukMaxdf = Forbruk_Dag_Time.reset_index()
    finneForbrukMax = fåForbrukMaxdf['KWH 60 Forbruk'].max()
    filter_forbrukMax = (fåForbrukMaxdf['KWH 60 Forbruk'] == finneForbrukMax)
    filter_forbrukMax = fåForbrukMaxdf.loc[filter_forbrukMax]
    return filter_forbrukMax.iloc[0]

a, b, c = findPeakInterval()
 quiet seal
Hi I'm using plotly.express to generate a radar chart with px.line_polar(df, r='Score', theta='Section', line_close=True, range_r=[0,5]) and I want to plot two series
since this doesn't support r=[r1, r2, ...] I'm doing this with plotly.graph_objects, but I can't figure out the equivalent of line_close and range_r. I tried fig.update_traces(marker_colorbar_tickformatstops=dict(dtickrange=[0,5]), selector=dict(type='scatterplot')) and a few other things, no luck
Any suggestions on how to get this thing to close the line and set the range of r?
oh huh. setting the range was in the example I read, I missed it somehow for the past 2 hours. Closing the line is not 😐
 brave sand
what is the oracle in RL?
storm kelp
@lapis sequoia@noble tusk
Unfortunately I couldn't use the solutions you guys suggested because many of those functions are not available for PySpark Dataframes. I ended up coming up with this somewhat grotesque method which appears to be working but I still need to do more QC on the results to confirm.
df.select("*",F.row_number().over(Window.partitionBy("A", "B").orderBy("C")).alias("rn")).filter("rn" == 1)
noble tusk
Yikes, that's pretty rough
Looking up PySpark, it seems to be a wrapper for Apache Spark. I don't really know a lot about that, so I might be wrong here, but could you instead use Apache Arrow tables, or even Polars, which is based on Arrow?
storm kelp
noble tusk
Looking up PySpark, it seems to be a wrapper for Apache Spark. I don't really kn...
The thing is most of the code my team has written is in PySpark sql dataframes. So it makes sense to keep using it - especially with the volume of data we process
It's just getting used to it I guess. Does seem crazy complicated for something as simple as grouping a df and finding the smallest value
noble tusk
Yeah. I feel like there much be a better way but I've never used PySpark so idk
If it's SQL DataFrames you're using, and then using SQL is the only requirement, you could get away with using Pandas. But that would be dependent on organisation's situation itself
I might try and trawl through the docs see if I can find anything on PySpark that would work better for you
@storm kelp Looking at the docs, something like this might work ```py
df.groupby(["a", "b"]).min("c").collect()
Oof, well I'm used to pandas so can't really suggest anything out of it.
storm kelp
noble tusk
<@780320537255608330> Looking at the docs, something like this might work ```py
...
That works, but there is no built in way to retain columns except from A, B, and C lol. One solution is to use that df in the right-side of a left semi-join and then drop any duplicates with identical A, B, and C. It's still excessively complicated for something that should be trivial to do
storm kelp
noble tusk
If it's SQL DataFrames you're using, and then using SQL is the only requirement,...
Yeah I'm not sure Pandas is computationally efficient enough, even within pyspark using pandas-on-spark
noble tusk
storm kelp
Yeah I'm not sure Pandas is computationally efficient enough, even within pyspar...
If PySpark isn't necessary I'd try Polars. It's the fastest DataFrame lib out there, for pretty much any language
If it is necessary then idk enough about PySpark to be able to help that much more unfortunately
Here's some benchmark data

I've not used Polars that much, but the syntax looks pretty similar to what I'm seeing from PySpark
Those benchmarks are actually run on groupby() as well lmao
desert oar
young granite
truth is i dont really know either hahaha.
I want to prepare myself for DS with ...
my strong recommendation is:
-
stay focused on practical problems. treat the math and programming as a means to an end.
-
stay focused on learning one thing at a time. know that there is rarely one best or correct answer. start with the basics and learn them well. by the time you feel ready to move on to more advanced tools, you will have a better foundation of knowledge.
 serene plume
Is it possible to add an axis to a numpy array but only when there is a single one?
!e
import numpy as np

def expand(arr):
    if arr.ndim == 1:
        return np.expand_dims(arr, axis=0)
    return arr

a = np.array([10, 20])
b = np.array([[10, 20], [10, 20]])

print(a.shape)
print(b.shape)
print()

a = expand(a)
b = expand(b)

print(a.shape)
print(b.shape)
@serene plume :white_check_mark: Your 3.11 eval job has completed with return code 0.
001 | (2,)
002 | (2, 2)
003 |
004 | (1, 2)
005 | (2, 2)
Does numpy not have something that works like this expand?
desert oar
serene plume
Does `numpy` not have something that works like this `expand`?
sounds kind of like the opposite of atleast_1d?
i don't think it has that built-in
or wait, i misread your code
this is atleast_2d
!d numpy.atleast_2d
arctic wedgeBOT
numpy.atleast_2d(*arys)```
View inputs as arrays with at least two dimensions.!e ```python
import numpy as np
a = np.array([10, 20])
b = np.array([[10, 20], [10, 20]])
print(np.atleast_2d(a))
print()
print(np.atleast_2d(b))
@desert oar :white_check_mark: Your 3.11 eval job has completed with return code 0.
001 | [[10 20]]
002 |
003 | [[10 20]
004 |  [10 20]]
@serene scaffold would u mind helping me with my code again 🙂
desert oar
storm kelp
<@456226577798135808><@385807530913169426>
Unfortunately I couldn't use the sol...
it's best to think of the pyspark dataframe api as being more like sql than like pandas. there is however the "koalas" library which offers an interface that's more like pandas, and might correspond better to what you want
weary crown
import pandas as pd
import numpy as np
from numpy import sqrt
from sklearn.preprocessing import MinMaxScaler
from sklearn.tree import DecisionTreeRegressor
from sklearn.metrics import mean_squared_error
from sklearn.model_selection import train_test_split
from sklearn.model_selection import cross_val_score
from nptyping import NDArray, Int, Shape
import pickle

# read in csv into dataframe
df = pd.read_csv(r"C:\Users\josmo\Downloads\creditcard.csv")

target = df['Class']
df.pop('Class')


# feature scale each column
for column in df.columns:
    scaler = MinMaxScaler(feature_range=(-1, 1))
    scaler.fit(df[column].values.reshape(-1, 1))
    df[column] = scaler.transform(df[column].values.reshape(-1, 1) + 1e-4)

data_train, data_test, target_train, target_test = train_test_split(
    df, target, test_size=0.2, random_state=42)

tree_reg = DecisionTreeRegressor()
tree_reg.fit(data_train, target_train)

# Testing
housing_predictions = tree_reg.predict(pd.concat([data_test, target_test]))

# RMSE evaluation
lin_mse = sqrt(mean_squared_error(target_test, housing_predictions))
print(f"Loss: {lin_mse}")

# Cross Validation
scores = cross_val_score(tree_reg, target_train, target_test, scoring="neg_mean_squared_error", cv=10)
tree_rmse_scores = sqrt(-scores)

# Display Cross Validation results
def display_scores(scores):
print(f"Scores: {scores}\nMean: {scores.mean()}\nStandard Deviation: {scores.std()}")```When I train my dataset I get NaN value error - but I counted the number of NaN values in the DF and it said 0...
so like what happened-
serene plume
desert oar
!e ```python
import numpy as np
a = np.array([10, 20])
b = np.array([[10, 20], ...
This is what I want, thanks!
desert oar
@weary crown show the full exception?
or at least say what line the exception occurs on
storm kelp
desert oar
it's best to think of the pyspark dataframe api as being more like sql than like...
Yeah, I was just worried using the pandas API for spark would kill it's performance
desert oar
storm kelp
Yeah, I was just worried using the pandas API for spark would kill it's performa...
if it makes you feel better, this "row number over" pattern is a very common idiom in sql
weary crown
desert oar
or at least say what line the exception occurs on
Hastebin is a free web-based pastebin service for storing and sharing text and code snippets with anyone. Get started now.
the except is too large to fit in 1 message
idk what hist gradient boosting classifier is
desert oar
weary crown
https://hastebin.com/aciroxokim.sql
the error message says that the problem is at tree_reg.predict(pd.concat([data_test, target_test])), so the NaNs are introduced somewhere before that
you are sure that after applying the min-max scaler, data_test.isnull().any().any() is false?
weary crown
desert oar
you are sure that _after_ applying the min-max scaler, `data_test.isnull().any()...
lemme test that
desert oar
note that :
1) you can apply the scaler to the entire dataframe at once as an array nvm you are scaling each column individually
2) .values is deprecated
3) you are messing with columns that have non-string names, which might break things (as per the warning messages in the output you showed)
weary crown
desert oar
you are sure that _after_ applying the min-max scaler, `data_test.isnull().any()...
yup
weary crown
desert oar
note that :
~~1) you can apply the scaler to the entire dataframe at once as an ...
what should i replace .values with?
desert oar
weary crown
what should i replace .values with?
.to_numpy()
also, scaling min-max on both train and test sets is inadvisable. it's basically cheating, using test data in training
weary crown
desert oar
`.to_numpy()`
okie
weary crown
desert oar
also, scaling min-max on both train and test sets is inadvisable. it's basically...
aww
weary crown
desert oar
note that :
~~1) you can apply the scaler to the entire dataframe at once as an ...
how to fix point 3?
desert oar
weary crown
how to fix point 3?
can you share the first 5-10 lines of the csv file? use the paste site if you need to
weary crown
ok
desert oar
you might also want to use a Pipeline for this, which takes care of the bookkeeping related to having one scaler per column that you need to store and re-apply on the test set
@weary crown does this work? any errors?
import pandas as pd
from sklearn.compose import ColumnTransformer
from sklearn.pipeline import make_pipeline
from sklearn.preprocessing import MinMaxScaler
from sklearn.tree import DecisionTreeRegressor

data = pd.read_csv(r"C:\Users\josmo\Downloads\creditcard.csv")
target = data.pop('Class')

scaler = MinMaxScaler(feature_range=(-1, 1))
scaler_columnwise = ColumnTransformer([], remainder=scaler)
tree_reg = DecisionTreeRegressor()
pipeline = make_pipeline(scaler_columnwise, tree_reg)

data_train, data_test, target_train, target_test = train_test_split(
    data, target, test_size=0.2, random_state=42
)

pipeline.fit(data_train, target_train)
i didnt understand those 😦
desert oar
weary crown
i didnt understand those 😦
it applies a sequence of transformers, and then fits an estimator at the end
weary crown
I forgot what transformers are
desert oar
pipeline.fit(data_train, target_train)

pred_test = pipeline.predict(data_test)
it lets you write this, without having to re-apply all the fitted transformers to the test set
weary crown
well i have a vauge idea
desert oar
an "estimator" is what you might otherwise call a model
a "transformer" just transforms data
weary crown
ooh i see
desert oar
transformers have a .transform method, estimators have a .predict method. that's the main difference.
desert oar
weary crown
now how to predict with it?
you might want to re-read the scikit-learn user guide
serene scaffold
the authors of "Attention is all you need" poisoned the well for the meaning of "transformer"
desert oar
sorry, not the user guide, the tutorial
scikit-learn
Section contents: In this section, we introduce the machine learning vocabulary that we use throughout scikit-learn and give a simple learning example. Machine learning: the problem setting: In gen...
weary crown
desert oar
you might want to re-read the scikit-learn user guide
well yeah but i mean can i do it in the pipe line
desert oar
weary crown
well yeah but i mean can i do it in the pipe line
yes, the pipeline has a .predict method
weary crown
ofc i can do boring .predict
desert oar
yep that's it
weary crown
oh great!
desert oar
scikit-learn
Transformers are usually combined with classifiers, regressors or other estimators to build a composite estimator. The most common tool is a Pipeline. Pipeline is often used in combination with Fea...
and the docs for pipeline itself https://scikit-learn.org/stable/modules/generated/sklearn.pipeline.Pipeline.html#sklearn.pipeline.Pipeline
scikit-learn
Examples using sklearn.pipeline.Pipeline: Feature agglomeration vs. univariate selection Feature agglomeration vs. univariate selection Pipeline ANOVA SVM Pipeline ANOVA SVM Poisson regression and ...
pipeline is awesome. it's one of the things that got me to switch to python from r in 2015
pandas was new and really clunky at the time, but scikit-learn was already excellent
the r equivalent (caret) seemed archaic by comparison
weary crown
import pandas as pd
from sklearn.compose import ColumnTransformer
from sklearn.pipeline import make_pipeline
from sklearn.preprocessing import MinMaxScaler
from sklearn.tree import DecisionTreeRegressor
from sklearn.model_selection import train_test_split
from math import sqrt
from sklearn.metrics import mean_squared_error
from sklearn.model_selection import cross_val_score

data = pd.read_csv(r"C:\Users\josmo\Downloads\creditcard.csv")
target = data.pop('Class')

scaler = MinMaxScaler(feature_range=(-1, 1))
scaler_columnwise = ColumnTransformer([], remainder=scaler)
tree_reg = DecisionTreeRegressor()
pipeline = make_pipeline(scaler_columnwise, tree_reg)

data_train, data_test, target_train, target_test = train_test_split(
    data, target, test_size=0.2, random_state=42
)

pipeline.fit(data_train, target_train)

# Testing
pred = pipeline.predict(pd.concat([data_test, target_test]))

# RMSE evaluation
lin_mse = sqrt(mean_squared_error(target_test, pred))
print(f"Loss: {lin_mse}")

# Cross Validation
scores = cross_val_score(tree_reg, target_train, target_test, scoring="neg_mean_squared_error", cv=10)
tree_rmse_scores = sqrt(-scores)

# Display Cross Validation results
def display_scores(scores):
print(f"Scores: {scores}\nMean: {scores.mean()}\nStandard Deviation: {scores.std()}")``` still same error when i do.predict??i was 7 in 2015 hehe
desert oar
weary crown
```py
import pandas as pd
from sklearn.compose import ColumnTransformer
from skl...
pred = pipeline.predict(pd.concat([data_test, target_test]))
this line is questionable and probably wrong
just do pipeline.predict(data_test)
weary crown
ok
desert oar
what were you trying to achieve with that pd.concat?
weary crown
it fixed a previous error
C:\Users\josmo\PycharmProjects\FraudDetection\venv\Scripts\python.exe C:/Users/josmo/PycharmProjects/FraudDetection/main.py
Traceback (most recent call last):
  File "C:\Users\josmo\PycharmProjects\FraudDetection\main.py", line 33, in <module>
    scores = cross_val_score(tree_reg, target_train, target_test, scoring="neg_mean_squared_error", cv=10)
  File "C:\Users\josmo\PycharmProjects\FraudDetection\venv\lib\site-packages\sklearn\model_selection\_validation.py", line 515, in cross_val_score
    cv_results = cross_validate(
  File "C:\Users\josmo\PycharmProjects\FraudDetection\venv\lib\site-packages\sklearn\model_selection\_validation.py", line 252, in cross_validate
    X, y, groups = indexable(X, y, groups)
  File "C:\Users\josmo\PycharmProjects\FraudDetection\venv\lib\site-packages\sklearn\utils\validation.py", line 433, in indexable
    check_consistent_length(*result)
  File "C:\Users\josmo\PycharmProjects\FraudDetection\venv\lib\site-packages\sklearn\utils\validation.py", line 387, in check_consistent_length
    raise ValueError(
ValueError: Found input variables with inconsistent numbers of samples: [227845, 56962]
Loss: 0.03050319422577728```well that makes no sense, you're concatenating the labels to the data... and of course introducing many columns of NaNs in the process!
weary crown
ohh
desert oar
you shouldn't get that error with this code
the only way you'd get that error is if you mixed up train and test data in the same fit call
the error message means that your data and labels have different lengths
hopefully you can understand why that's a problem
weary crown
desert oar
the error message means that your data and labels have different lengths
gosh damn it
i hate this dataset its not applicable or anything
since im not given what the labels mean due to the creator of the dataset saying hes unwilling to disclose it
desert oar
weary crown
i hate this dataset its not applicable or anything
this shouldn't be a data quality problem. train_test_split will do the right thing, and the target came from the original df, so they should have the same lengths.
desert oar
weary crown
since im not given what the labels mean due to the creator of the dataset saying...
that's... unusual. is this a school project? a job interview? a work contract?
weary crown
no i just searched up cool datasets on kaggle and found it