#data-science-and-ml
1 messages · Page 22 of 1
 lapis sequoia
.
.
But tbh I never fixed it. Because I didn't have to 😛. I sold my silly model
 prime oak
anyone here used yolov5? What's the best performance metric to consider when training models with it?
 split drift
I have a question regarding the output in the jupyter notebook:
What function of pandas does Jupyter notebook run (When running the cell), to render the table?
Cell:
df
Output:
*some formatted table
 cold ridge
@serene scaffold .....I wanted to implement this custom date filter in excel and extract the datasets using python
 split drift
lapis sequoia
Display maybe <@463431557634457610>
split drift
lapis sequoia
Display maybe <@463431557634457610>
I want to create my customize function and to customize the default output
I will check that, thanks!
split drift
AttributeError: 'DataFrame' object has no attribute 'Display'
split drift
lapis sequoia
How to get code for a pre written function
you can press ctrl and on the name of the function
lapis sequoia
display* maybe
split drift
nope
split drift
AttributeError: 'DataFrame' object has no attribute 'display'
split drift
oh
i did df.display()
@lapis sequoia Do you know how I can customize the output for my class when running display with it?
found it
 harsh edge
Hi! I'm trying to work with multiple indexes and failing. What I have is a dataset with the monthly investor stock portfolio, and their mean close price in each month. I wan't to do some lagged operations within months (keeping the investor and the stock fixed), but I'm struggling to find how to do it. I might be able to brute force it with some for loops, but I think there should be a way to do it with groupby and shift, but I can't really get my mind on how to operate with groupby.
Here is some fake data on what I'm trying to get
data = pd.DataFrame({'Investor':[1, 1, 1, 1, 2, 2, 2, 2], 'Month': [1, 1, 2, 2, 1, 1, 2, 2], 'Stock': ['AAPL','GOOG','AAPL','GOOG','TSLA','GOOG', 'TSLA','GOOG'],
                    'Price': [10, 20, 14, 25, 3, 20, 8, 25]})


desired = pd.DataFrame({'Investor':[1, 1, 1, 1, 2, 2, 2, 2], 'Month': [1, 1, 2, 2, 1, 1, 2, 2], 'Stock': ['AAPL','GOOG','AAPL','GOOG','TSLA','GOOG', 'TSLA','GOOG'],
'Price': [10, 20, 14, 25, 1, 20, 8, 25], 'Delta':[np.nan, np.nan, 4, 5, np.nan, np.nan, 7, 5]})```is this the correct place to ask this, or is it databses?
 formal island
How can I add a cudnn 7000 compatibility version to conda navigator? I can't find any channels that include a 7000 compatibility build for win64.

 serene scaffold
harsh edge
Hi! I'm trying to work with multiple indexes and failing. What I have is a datas...
serene scaffold
harsh edge
Hi! I'm trying to work with multiple indexes and failing. What I have is a datas...
Thank you for giving all the information needed to answer your question in one message. People almost never do this. How close is this to what you want?
In [17]: data.groupby(['Stock', 'Investor'])['Price'].diff()
Out[17]:
0    NaN
1    NaN
2    4.0
3    5.0
4    NaN
5    NaN
6    5.0
7    5.0
Name: Price, dtype: float64
 inland gull
Hey all, I have a pretty simple problem I'm trying to work through and wanted to get your advice. I have data with only two relevant columns: Author & Datetime (each row represents a user action). I would like to create a time series graph with a line per user indicating the number of entries of theirs per month. I've got a decent grasp of using groupby to get my data per month and whatnot, but how do I get a series split out per Author to plot each line? Thanks!
serene scaffold
inland gull
Hey all, I have a pretty simple problem I'm trying to work through and wanted to...
If Author is a line, and the datetime is the x axis value, then you're missing a y axis value.
Sorry, I see now
inland gull
serene scaffold
If Author is a line, and the datetime is the x axis value, then you're missing a...
Ideally count (per Author), I think
serene scaffold
You'll want to use a pivot table.
Can you do print(df[['Author', 'Datetime']].sample(10).to_dict('list')) for me?
inland gull
serene scaffold
Can you do `print(df[['Author', 'Datetime']].sample(10).to_dict('list'))` for me...
{'Author': ['User#1011', 'User#3249', 'User#1011', 'User#7524', 'User#7524', 'User#5025', 'User#3249', 'User#1655', 'User#5159', 'User#7524'], 'Date': [Timestamp('2020-10-14 15:00:00'), Timestamp('2021-01-11 17:46:00'), Timestamp('2021-03-31 10:21:00'), Timestamp('2017-10-30 18:45:00'), Timestamp('2020-02-09 16:15:00'), Timestamp('2022-04-26 14:27:00'), Timestamp('2022-02-16 15:48:00'), Timestamp('2022-02-16 15:56:00'), Timestamp('2019-02-04 19:52:00'), Timestamp('2018-07-23 23:18:00')]}
serene scaffold
great, thanks
@inland gull you can make another column that rounds every timestamp to the last day of their month, and then pivot them.
In [28]: df['Month'] = df['Date'].dt.date + pd.offsets.MonthEnd(0)

In [29]: df
Out[29]:
      Author                Date      Month
0  User#1011 2020-10-14 15:00:00 2020-10-31
1  User#3249 2021-01-11 17:46:00 2021-01-31
2  User#1011 2021-03-31 10:21:00 2021-03-31
3  User#7524 2017-10-30 18:45:00 2017-10-31
4  User#7524 2020-02-09 16:15:00 2020-02-29
5  User#5025 2022-04-26 14:27:00 2022-04-30
6  User#3249 2022-02-16 15:48:00 2022-02-28
7  User#1655 2022-02-16 15:56:00 2022-02-28
8  User#5159 2019-02-04 19:52:00 2019-02-28
9  User#7524 2018-07-23 23:18:00 2018-07-31

In [31]: df.pivot_table(index='Author', columns='Month', aggfunc='count').fillna(0)
Out[31]:
                Date

Month     2017-10-31 2018-07-31 2019-02-28 2020-02-29 2020-10-31 2021-01-31 2021-03-31 2022-02-28 2022-04-30

Author

User#1011        0.0        0.0        0.0        0.0        1.0        0.0        1.0        0.0        0.0

User#1655        0.0        0.0        0.0        0.0        0.0        0.0        0.0        1.0        0.0

User#3249        0.0        0.0        0.0        0.0        0.0        1.0        0.0        1.0        0.0

User#5025        0.0        0.0        0.0        0.0        0.0        0.0        0.0        0.0        1.0

User#5159        0.0        0.0        1.0        0.0        0.0        0.0        0.0        0.0        0.0

User#7524        1.0        1.0        0.0        1.0        0.0        0.0        0.0        0.0        0.0
Got it, I'll give that a shot! Thank you!
harsh edge
Is it ok to ask here for a little code review? I did some coding that really looks like bruteforcing, and there should be a smart way to do it, but I don't know how.
 ruby depot
Hello! is there a way to get all the /.. of a page? for example:
www.uwu.com/profile/Juana
www.uwu.com/profile/Hector
www.uwu.com/profile/...
With beautiful soup
 worn stratus
ruby depot
Hello! is there a way to get all the /.. of a page? for example:
www.uwu.com/pr...
worn stratus
ruby depot
Hello! is there a way to get all the /.. of a page? for example:
www.uwu.com/pr...
If they have a sitemap, then you can parse that, otherwise no
ruby depot
Well, they have a search bar with suggestions so i think it would be possible cos the data is stored somewhere and showed to me in a way
formal island
formal island
How can I add a cudnn 7000 compatibility version to conda navigator? I can't fin...
Anyone? Or is this the wrong channel?
ruby depot
worn stratus
If they have a sitemap, then you can parse that, otherwise no
they have a list, see?


 stoic compass
Hey! I just wrote a data analysis project using Python on Jupyter Notebook and I really want someone to help me with a short review of it. Would you be up for this?
This is my first project and I want to get a second perspective from someone with more experience.
https://paste.pythondiscord.com/xuloxuliwi
@serene scaffold
worn stratus
ruby depot
they have a list, see?
It will probably be server side generated as you type. You can look for an options tag in the html, but there's probably nothing there
 hasty mountain
To whoever may think about making a tutorial about audio data processing in Machine Learning:
Please, explain the damn thing. After passing an entire week reading tutorials and articles on machine learning with audio, only now I could understand that Fourier Transform and MFCC are simply methods of feature extraction in audio, since audio has way more data than image/text datasets.
I thought they were like...Idk...just funny ways of visualizing my data. But now I see they're like a PCA
But then...I suppose that this feature extraction could also be done by a convolution layer? 
 fringe anvil
Explain why the identity matrix 𝐼 is necessarily a square matrix with only 1's on the
diagonal (hint: use the dot product from Q1)
im not quite sure what to answer there? can anone give an hint, or push me in the right direction
 desert oar
hasty mountain
To whoever may think about making a tutorial about audio data processing in Mach...
desert oar
hasty mountain
To whoever may think about making a tutorial about audio data processing in Mach...
this is why i suggest avoiding "tutorials" as a first-line learning tool
hasty mountain

desert oar
hasty mountain
I thought they were like...Idk...just funny ways of visualizing my data. But now...
they are actually more than that... https://www.3blue1brown.com/lessons/fourier-transforms
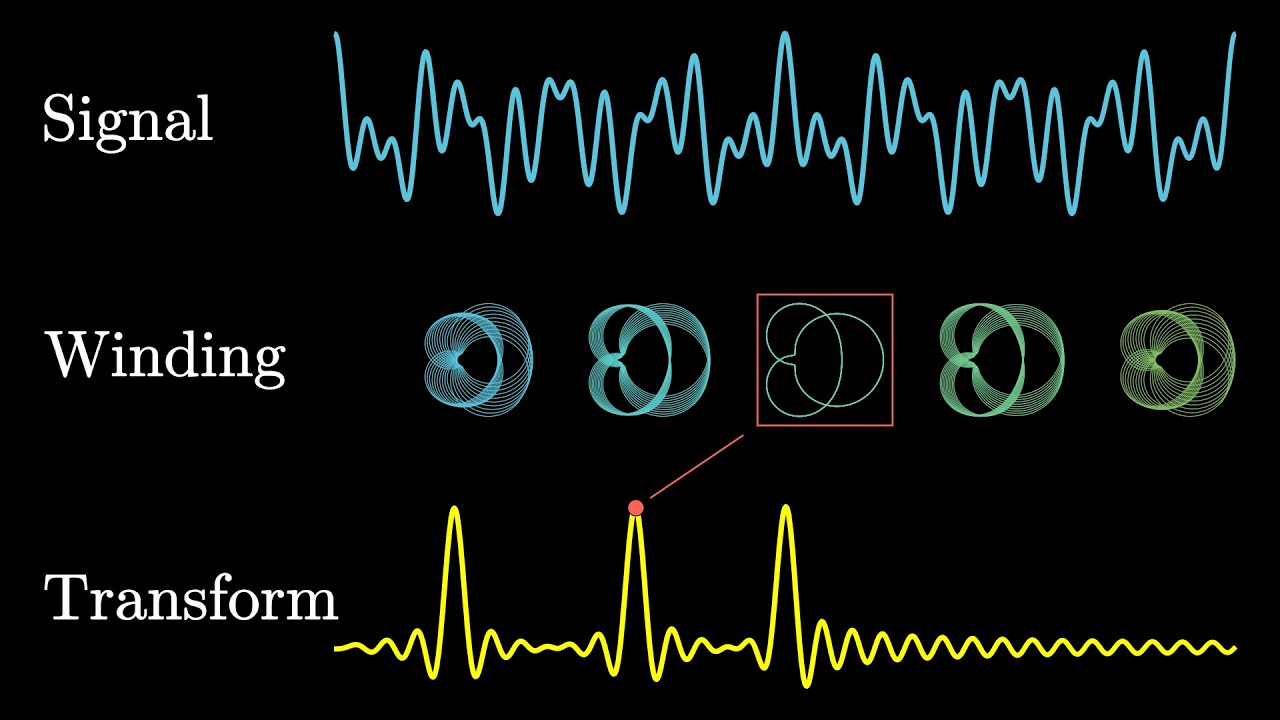
An animated introduction to the Fourier Transform, winding graphs around circles.
desert oar
fringe anvil
Explain why the identity matrix 𝐼 is necessarily a square matrix with only 1's ...
this question is testing your understanding of matrix multiplication
what is "the dot product from Q1" as referenced in the question?
fringe anvil
desert oar
what is "the dot product from Q1" as referenced in the question?
that ugly thing i made
A = [[1,2,3],
    [4,5,6]]

B = [[1,2,3],
    [4,5,6],
    [7,8,9]]

X = np.array([[1,2,3]])
Y = np.array([[1],[4],[7]])

def matrix_multiply(A,B):
    rslt = np.zeros((np.array(A).shape[0],np.array(B).shape[1]),dtype = int)

    for a,_ in enumerate(A):
        for b,_ in enumerate(B[0]):
            for c,_ in enumerate(B):
                rslt[a][b] += A[a][c] * B[c][b]

    return rslt

print(matrix_multiply(A,B))
print(np.dot(A,B))

print(matrix_multiply(X,Y))
print(np.dot(X,Y))
i take it that you found a resource along the lines of "linear algebra with python"?
i assume Q1 asked you to implement matrix multiplication in python?
fringe anvil
desert oar
i take it that you found a resource along the lines of "linear algebra with pyth...
it's a workshop from the bootcamp. deadline is the 16th
desert oar
btw you can use this to assert equality, raising an exception if they are not equal
np.testing.assert_array_almost_equal(
    matrix_multiply(A, B),
    np.dot(A, B),
)

np.testing.assert_array_almost_equal(
    matrix_multiply(X, Y),
    np.dot(Y, Y),
)
(the "almost" refers to adding in some tolerance for floating-point numerical errors)
fringe anvil
i just need to push through this math module. next module is matplotlib / seaborn
desert oar
@fringe anvil that question is asking you to look at the definition of matrix multiplication, and reason out why the identity matrix is the way it is
fringe anvil
i watched countless videos on khan academy. couldnt find anything that was useful for python. but im still taking time to look at the math. ill be doing pomodoro for linear algebra
desert oar
fringe anvil
i watched countless videos on khan academy. couldnt find anything that was usefu...
have you looked at the 3blue1brown videos? Essence of Calculus and Essence of Linear Algebra
they're excellent video lectures, not at all the shallow "tutorials" you find elsewhere. better than any math class i've ever taken.
fringe anvil
desert oar
have you looked at the 3blue1brown videos? Essence of Calculus and Essence of Li...
yeah, i like the guy, but at some point, i get lost and the videos dont make much sense.
desert oar
again, they won't teach you much in the way of mechanics, but they will teach you intuition
desert oar
fringe anvil
yeah, i like the guy, but at some point, i get lost and the videos dont make muc...
in those videos series in particular? you need to "pause and ponder" as they say. watch with a notebook and pencil and write down ideas and work through the problems following along with what he does
as for this particular question, when you are asked to explain why something must be the way it is, a good strategy is to think about why it can't be any other way
for example, they ask you to explain why the identity matrix must be a square matrix. so you should think: what if it wasn't square? what would happen? what would go wrong and prevent it from making sense?
fringe anvil
desert oar
as for this particular question, when you are asked to explain why something mus...
oh thats actually quite good. im french canadian, so sometimes reading comprehension gets the best of me. also, ive been welding for 12 years. so, ive kind of lost how it feels to be back in school lol
this is a huge change of career, im all in. ngl, im stressed lol
desert oar
understandable! this process is going to feel like an intensive brain workout.
and unfortunately (and this is part of why i don't love bootcamps in a lot of cases) a bootcamp probably isn't going to give you enough time to really study this stuff
even the 3b1b videos will take some time to work through if you aren't already familiar with the material
fringe anvil
desert oar
and unfortunately (and this is part of why i don't love bootcamps in a lot of ca...
yeah, that was my understanding. but as long as i can get a job, with the same salary (or more) ill put the time in to learn. i love learning. it's just math wasnt really my cup of tea lol
ive been 4 years in robotics. learned everything myself. optimised the programs for the welding robot and all. i know i can do this. and i know theres smarter people on the internet lol. thats why i like to reach out and exchange. thanks for being around btw 🙂
hasty mountain
desert oar
they are actually more than that... https://www.3blue1brown.com/lessons/fourier-...
I wonder, though...if I don't use Fourier Transform...what would happen to my AI performance?
I've tested a model in numpy decomposing and recomposing an audio file, and everything worked fine. Perhaps the model would take more time to converge if I use raw data?
desert oar
fringe anvil
yeah, that was my understanding. but as long as i can get a job, with the same s...
fortunately you don't really need to have the level of understanding required to solve this particular problem ("why is the identity matrix square?") in order to get a job. but yeah, you'll definitely want it in order to move past the level of "data analyst" or something like that.
do welders make good money in canada?
i also wonder if maybe you should try to stay close to the robotics field, in case you were planning on doing something completely different
i'm sure you know how "data oriented" robotics is, not to mention mathematical
fringe anvil
desert oar
do welders make good money in canada?
ive been at it for 12 years, that includes 4 years and a half in robotics. i made 30$ / hour (moose dollars)
i have a lot of hobbies. and one of my future thing i want to do is build (i have a 3d printer at home) a 5/6 axis robot. code it myself in python. and use the knowledge i have with the 3d printer to source the parts and all.
the 12 years in welding completely destroyed my knees and back tho. i need to get away from it
i think i at least understood "dot product" and matrices multiplication. im reading and doing the exercises by hand writing them on khan academy. something clicked
desert oar
i bet. since you already have robotics experience, i bet you'll be able to write programs for controlling robots pretty easily
fringe anvil
geez, i hope it's going to be hard tho. thats how i learn lol
desert oar
honestly it probably won't be nearly as hard as learning math
fringe anvil
lmao indeed
desert oar
even doing something like programming a microcontroller in C is usually pretty straightforward
loops and ifs but the code usually is not fancy at all
desert oar
fringe anvil
i think i at least understood "dot product" and matrices multiplication. im read...
you can think of matrix multiplication this way: it's the dot product of the rows of A and the columns of B
fringe anvil
desert oar
you can think of matrix multiplication this way: it's the dot product of the row...
yeah thats what i was missing. its the full row vector not just the single item of the matrix that are multiplied
desert oar
or another way, the product of matrix A and vector x, A . x, is all of the columns of A, multiplied element-wise by all the elements of x
desert oar
fringe anvil
yeah thats what i was missing. its the full row vector not just the single item ...
exactly
as for why it's that way... that's what a linear algebra course is for 🙂 i am not sure if it's in the 3b1b series, but i bet it is
fringe anvil
i converted everything as tuples on paper. made sense
desert oar
https://saxarona.github.io/post/m-multiply/ this is a good one too, i was just searching around and found it

Xavier Sánchez Díaz
Matrix multiplication is commonly taught as the output of an algorithm. Let's rethink the method and take a look at the mathematical object first, in order to understand what the ending result means.
fringe anvil
yeah so basically, if you multiply a matrix by itself to the negative, you get an identity matrix? but also you mutliply a matrix by the identity matrix, and you get the same matrix back.. it's like 1 multiplied by any of the Real numbers
desert oar
if you multiply a matrix by itself to the negative
a matrix "to the -1 power" is just shorthand for the inverse of a matrix
and i think that's the most difficult way to approach it
start at this end instead:
it's like 1 multiplied by any of the Real numbers
IA = AI = A
that's the definition of I: it's whatever matrix fulfills that property!
fringe anvil
noice, it does make sense seen like this lol
desert oar
it can be proven that there is exactly 1 unique possibility for I (depending on the shape of A of course), and that the unique I is precisely the one from your homework problem
fringe anvil
desert oar
it can be proven that there is exactly 1 unique possibility for `I` (depending o...
see now im confused, lmao
desert oar
fringe anvil
see now im confused, lmao
about what part?
desert oar
hasty mountain
I wonder, though...if I don't use Fourier Transform...what would happen to my AI...
Perhaps the model would take more time to converge if I use raw data?
at best yes. but it might also fail to learn anything at all. that is, the model might actually just not work well (even if there were no errors in the code).
desert oar
fringe anvil
i thought an identity matrix was always with ones on the diagonal
right, and that is the only possible way to construct an identity matrix
the only possible definition of I, which satisfies the property IA = AI = A, is "square with 1s on the diagonal"
and of course you need to choose the size to match the size of A
fringe anvil
ohh alright. so IA = AI = A if I has the same numbers of rows and columns as A ( lets say n x n )
or the "shape" property attribute i think it's called from numpy, returns a tuple, giving you row, columns
so I.shape == A.shape
desert oar
well A might not be square in general, but yes
the way things are constructed in math, it's not really even possible to multiply matrices of "incompatible" sizes
do you know how matrix multiplication works when matrices are not square?
fringe anvil
oh geez, i totally forgot, they dont need to be squared, lmao
yeah im not sure if what i just learned applies to non square
desert oar
it definitely helps to start with square matrices as a simplification
it does apply actually
fringe anvil
oh ok
desert oar
and in fact that's part of the content of the homework question
there's actually a quick and easy rule you can use to check if two matrices have "compatible" shapes for multiplying
i'll tell you the rule now, but i strongly strongly encourage you to sit down with a notebook and try to figure out why the rule makes sense
(hint: you don't need to do any symbolic manipulation or fancy stuff, just mess around with multiplying matrices)
fringe anvil
yeah i need to do a bunch of square multiplication to make sure i remember how to do it. but a 2x3 would throw me off for sure loll
desert oar
then you definitely should practice that
it's just the pairwise dot product of rows and columns
the resulting matrix is just the "grid" of all possible pairs
go back and look at the the nested for-loop you wrote, and convince yourself that is a valid way to think about it
fringe anvil
took me for ever to write that for loop, and i still dont get what the 2nd one does. i cant wrap my head on how the loop actually looks a columns
desert oar
fringe anvil
took me for ever to write that for loop, and i still dont get what the 2nd one d...
def matmul(A, B):
    AB = np.empty((A.shape[0], B.shape[1]))

    # for each row of A...
    for i in range(A.shape[0]):
        # for each column of B...
        for j in range(B.shape[1]):
            AB[i, j] = np.dot(A[i, :], B[:, j])
which of course requires that A[i] and B[j] are the same length, which places restrictions on the shapes of A and B (which is what i was starting to talk about before)
fringe anvil
i did this in my head, i think im getting it lol
 desert oar
good. does my sample code make sense?
fringe anvil
desert oar
```python
def matmul(A, B):
AB = np.empty((A.shape[0], B.shape[1]))
# f...
oh that makes way more sense. cause the tuple returned is (row,column)
i might have fried my brain for today tho, lmao
desert oar
fair enough. before you go, at least copy down the rule for multiplying matrices: the number of columns of A must be the same as the number of rows of B
and the reason is really straightforward: because row of A must be "dotted" with each column of B, so the rows of A must have the same length as the columns of B. and the length of a row of A is of course the number of columns of A.
fringe anvil
yeah initialize the empty matrix with the shape of A row and B column. (cause i was too lazy to use a list comprehension with triple for loop lol)
desert oar
def matmul(A, B):
    AB = np.empty((A.shape[0], B.shape[1]))
    for i in range(A.shape[0]):
        for j in range(B.shape[1]):
            AB[i, j] = np.dot(A[i, :], B[:, j])
    return AB
compare to...
def matmul(A, B):
    AB = np.empty((A.shape[0], B.shape[1]))
    assert A.shape[1] == B.shape[0]
    K = A.shape[1]
    for i in range(A.shape[0]):
        for j in range(B.shape[1]):
            AB[i, j] = 0
            for k in range(K):
                AB[i, j] += A[i, k] * B[k, j]
    return AB
the assert checks if A row == B column? if it's False, what does it do? raises an error?
"and the length of a row of A is of course the number of columns of A"
oh yeah, that actually makes sense. i never thought about it that way
i def need to work on my maths. it's actually interesting once you start getting it, rofl
 fringe marsh
hey guys can I post R-lang related questions here?
fringe anvil
fringe marsh
hey guys can I post R-lang related questions here?
try this https://discord.gg/FQp6ZNd
it's from this reddit post https://www.reddit.com/r/rprogramming/comments/f1huvw/r_discord_server/

they grew huge too, impressive, lol
 lunar swift
hm
ive heard that
you can use ssds as storage for neural networks
that must be pretty smart
cause u can simulate a simple synapsis with 1 connectino
lapis sequoia
how can i get better at machine learning and understanding the concepts of ML? im in school for data science, but i would like to expose myself to books specifically that gives a detailed overview of the subject, while still digestible to beginners.
desert oar
lapis sequoia
how can i get better at machine learning and understanding the concepts of ML? i...
imo, learn some theory. check out https://probml.github.io/pml-book/book1.html but honestly your classes will probably keep you busy
you should be learning that stuff in school
if you feel like you are lacking intuition on something specific it might be good to look for blog posts or stackexchange posts (stats.stackexchange.com and datascience.stackexchange.com)
or ask here
desert oar
fringe anvil
the assert checks if A row == B column? if it's False, what does it do? raises a...
yes exactly
desert oar
fringe anvil
i def need to work on my maths. it's actually interesting once you start getting...
yeah! once you get rolling with it, it almost becomes fun. for me it's also incredibly satisfying when a concept comes together in my head
and it really does get easier. the more you learn, the easier it is to learn. it only feels like a constant difficulty level because the sophistication is also increasing and the number of underlying concepts is growing
math and programming are similar in that respect
i imagine welding is too
 misty flint
yeah its almost like you need some "mental scaffolding" if that analogy makes sense
at least thats how my experience has been where its gotten easier over time

 granite tundra
Hey, guys, I wanted to build a free app to make it really easy to bring your python functions to the web, is there anyone who might want to test it!?
Especially for people who did not yet do a lot of front end coding.

Bring your python function to the web
 frigid solar
hey can anyone help me in a problem related to mlflow?
ruby depot
<div>
<span>0.50</span>
<span>USD</span>
</div>
Is there anyway with beautiful soup to get the span before USD so i can get the dollars? i don't have any id or smth, i found USD using search per word.
 hallow python
lapis sequoia
how can i get better at machine learning and understanding the concepts of ML? i...
hallow python
lapis sequoia
how can i get better at machine learning and understanding the concepts of ML? i...
If you think your school isn't teaching yourself enough, I recommend you to get a good course.
One course I really recommend which is beginner friendly and will teach you everything is:
"Complete Machine Learning and Data Science Bootcamp" by Zero to Mastery.
It will teach you everything you need. If you think your school is teaching you enough, don't worry to get the course.
split drift
How does pandas.DataFrame.query knows to refer to @ as variable?
and how can I implement this functionality within my function?
 gloomy anvil
Hello friends, can someone help me understand what I(1) is in the following context? English is not my first language and I just want to make sure that I understand my professor correctly before answering him:
1. usually one starts with I(1) tests to see if the variables are random walks (and thus not predictable).  So if X(t)= a +b*X(t-1) + error and b=1 every random event is always and forever carried along. "Time Series wander extensively". Please have a look at the random walk hypothesis literature (especially with respect to stock prices - the literature and its development over the last decades might help to structure your investigation.
2. if variables are I(1), VARs in Levels are not possible, but only in 1st Differences.
Does the order of I refer to stationarity? I already tested the timeseries with ADF and KPSS and used differencing and detrending accordingly if needed before passing it to the VAR. So what does the order of I refer to? Is I(1) meaning that the timeseries is nonstationary? And I(2) would be stationary or sth? stupid me can't find anything on google regarding this.
 tidal bough
gloomy anvil
Hello friends, can someone help me understand what I(1) is in the following cont...
tidal bough
gloomy anvil
Hello friends, can someone help me understand what I(1) is in the following cont...
googling a bunch, I believe it's https://en.wikipedia.org/wiki/Order_of_integration
In statistics, the order of integration, denoted I(d), of a time series is a summary statistic, which reports the minimum number of differences required to obtain a covariance-stationary series.
(I haven't heard of it myself; am not a statistician)
(The way I found it is by googling stuff like I(1) stationarity until I found a statistics stackexchange post mentioning cointegration, then googling I(1) cointegration until I found an article mentioning "all of the series must be integrated of order d (see Order of integration)")
So I(1) is a series such that np.diff(series) is stationary, I(2) is a series such that np.diff(np.diff(series)) is stationary. (and I(0) is just a stationary series)
 shrewd glen
hi guys what do i need to do to be able to understand python programming very well
gloomy anvil
tidal bough
googling a bunch, I believe it's https://en.wikipedia.org/wiki/Order_of_integrat...
Ah! That makes sense! thank you so much. That must be it and totally fits the context. Thank you again for your help!
 young granite
someone got a good book recommendation for neural networks and ml in general, to be more precise in terms of understanding?
 stray dagger
Hi, I am facing an issue with this code. can anyone identify what is wrong with this code.
 stray dagger
Hi, I am facing an issue with this code. can anyone identify what is wrong with ...
stray dagger
stray dagger
Hi, I am facing an issue with this code. can anyone identify what is wrong with ...
C:\Users\rajesh_kumar01\AppData\Local\Temp\ipykernel_11548\646535422.py:25: SettingWithCopyWarning:
A value is trying to be set on a copy of a slice from a DataFrame.
Try using .loc[row_indexer,col_indexer] = value instead
See the caveats in the documentation: https://pandas.pydata.org/pandas-docs/stable/user_guide/indexing.html#returning-a-view-versus-a-copy
dataset["MARKET_POSITION_SCORE"] = [
C:\Users\rajesh_kumar01\AppData\Local\Temp\ipykernel_11548\646535422.py:32: SettingWithCopyWarning:
A value is trying to be set on a copy of a slice from a DataFrame.
Try using .loc[row_indexer,col_indexer] = value instead
 opal garden
Hi there, If I’m starting with AI what library should I choose first?
serene scaffold
opal garden
Hi there, If I’m starting with AI what library should I choose first?
you don't become an AI person by learning a bunch of libraries. And if there's a problem you want to solve with AI, there isn't a single library that is the solution.
opal garden
serene scaffold
you don't become an AI person by learning a bunch of libraries. And if there's a...
Ah okay, thanks, but what is the most famous one?
serene scaffold
opal garden
Ah okay, thanks, but what is the most famous one?
numpy
 steady basalt
😂
 simple jacinth
Hey how do I disregard the error: ValueError: could not convert string to float: when parsing and converting data into floats? I have multiple strings that I want to force past if theyre not numbers. How do I do that without going through each one individually?
serene scaffold
simple jacinth
Hey how do I disregard the error: `ValueError: could not convert string to float...
Show code
simple jacinth
cover_headers = statements_data[0]['headers'][1]
cover_data = statements_data[0]['data']
cover_category = statements_data[1]['headers'][0][0]

cover_df = pd.DataFrame(cover_data)

cover_df.index = cover_df[0]
cover_df.index.name = cover_category
cover_df = cover_df.drop(0, axis=1)

cover_df = cover_df.replace('[\$,)]', '', regex=True)\
                     .replace('[(]', '-', regex=True)\
                     .replace('', 'Nan', regex=True)\
                     .replace('true', '1', regex=True)\
                     .replace('--09-25', 'Nan', regex=True)\
                     .replace('Cupertino', 'Nan', regex=True)\
                     .replace('Yes', 'Nan', regex=True)\
                     .replace('No', 'Nan', regex=True)\
                     .replace('Large Accelerated Filer', 'Nan', regex=True)\
                     .replace('996-1010', 'Nan', regex=True)\
                     .replace('FY', 'Nan', regex=True)

cover_df = cover_df.astype(float)

cover_df.columns = cover_headers

cover_df```your code shows that you are using pandas, but you didn't say this in your question.
!docs pandas.DataFrame.astype
 arctic wedgeBOT
DataFrame.astype(dtype, copy=True, errors='raise')```
Cast a pandas object to a specified dtype `dtype`.Note the errors= parameter.
instead of doing all this replacement stuff, I would probably use one regex to extract whatever value can be parsed as a number. and then strings that don't have a match will be converted to NaN anyway.
simple jacinth
thanks man that makes a lot of sense. How would I actually go about coding that? Do I just do ```python
DataFrame.astype(dtype, copy=True, errors='raise')
@serene scaffold
serene scaffold
simple jacinth
thanks man that makes a lot of sense. How would I actually go about coding that?...
no. DataFrame needs to be an actual dataframe (not the class itself), and dtype needs to be a type.
this is the documentation for the same method as cover_df = cover_df.astype(float)
simple jacinth
ahh okay so I would change my code to:
cover_df = cover_df.astype(float, copy=True, errors='raise')
```?copy=True, errors='raise' are the default arguments. you should click through to the doc page to see what you should change
 tiny wadi
Hey, how could I make this work?
'''
class A:
def __init__(self,second_class):
    pass
class B:
def method_1():
pass
def method_2():
pass
x = B
y = A(B)
y.method_1()
'''
arctic wedgeBOT
Hey @cerulean marsh!
It looks like you tried to attach file type(s) that we do not allow (.pdf). We currently allow the following file types: .gif, .jpg, .jpeg, .mov, .mp4, .mpg, .png, .mp3, .wav, .ogg, .webm, .webp, .flac, .m4a, .csv, .json.
Feel free to ask in #community-meta if you think this is a mistake.
 odd meteor
tiny wadi
Hey, how could I make this work?
'''
class A:
def __init__(self,second...
odd meteor
tiny wadi
Hey, how could I make this work?
'''
class A:
def __init__(self,second...
You didn't tell us the error message you were getting. So I'm allowed to assume you were trying to make class A (child class) inherit the functionality of class B (parent class)
You can do something like this
class ParentClass:
    def __init__(self, name, age):
        self.name = name
        self.age = age

    def give_accolades(self):
        print(f"Hey, {self.name}, I see you're learning class inheritance in OOP, keep it up buddy!")

    def give_advise(self):
        print("Eat, Enjoy, and Stay Jiggy")


# The empty child class now inheriting From The parent class

class ChildClass(ParentClass):
    pass
Creating an object of the child class
mike = ChildClass('Michael', 22)
mike.give_accolades()
print(mike.name)
print(mike.age)
mike.give_advise()
hey does anyone have experience in mlflow?
 summer osprey
Does anyone have advanced knowledge in webscraping with post requests and stuff?
 latent glacier
COULD ANYBODY PLEASE HELP ME
odd meteor
frigid solar
hey does anyone have experience in mlflow?
Don't ask question to ask question.
If you had mentioned what exactly in mlflow you need help or more clarity on, I'm sure you'll get to have your question answered much faster
 strong sedge
can you guys suggest good projects I can work on (from job pov)
I have 1 in mind but idk if its good enough
I am planning to make a twitter sentiment analysis bot to predict the sentiment of a particular subject (crypto, shares etc)
tiny wadi
odd meteor
You didn't tell us the error message you were getting. So I'm allowed to assume ...
Thanks for help,
With my original question, I got what I wanted by simply changing it into this:
class A:
def init(self,second_class):
    self.second_class = second_class
class B:
def method_1():
pass
def method_2():
pass
x = B
y = A(B)
y.second_class.method_1()
odd meteor
strong sedge
can you guys suggest good projects I can work on (from job pov)
I have 1 in mind...
It's a nice subject to perform sentiment analysis on. You could also do Aspect-Based Opinion Mining as well if you'd like to take your proposed project a bit further
strong sedge
odd meteor
It's a nice subject to perform sentiment analysis on. You could also do Aspect-B...
I need to research in to Aspect-Based Opinion Mining
sounds interesting
odd meteor
latent glacier
COULD ANYBODY PLEASE HELP ME
We don't know how to unless you tell us what you need help with
strong sedge
but this project as a whole is good right ?
also data, I know I can get my own data thru tweepy, but is there a labelled set of data I can use online ?
or else its gonna be a pain to manually label 1000+ tweets 🥲
 long widget
Can someone help me filtering this on the value fail from the column final_result and then showing a decreasing line or something in form of a plot?
 strong sedge
long widget
Can someone help me filtering this on the value fail from the column final_resul...
strong sedge
long widget
Can someone help me filtering this on the value fail from the column final_resul...
try
df.at[df['SomeColumn'] == 'Fail']```nvm u want a plot, idk how to do that yet
 blazing mountain
Hmmm I am getting a cryptic warning from torch on one of my image processing platforms:
python3.10/site-packages/torch/nn/modules/module.py:1130: UserWarning: operator() profile_node %2937 : int[] = prim::profile_ivalue(%2935)
does not have profile information (Triggered internally at ../torch/csrc/jit/codegen/cuda/graph_fuser.cpp:104.)
return forward_call(*input, **kwargs)
I am not sure how to troubleshoot this one, or even what it means...any ideas?
 plush jungle
how do you know what arguments to put for convolutional layers in a CNN?
 dusty valve
What's the command to install opencv2?
There are a bunch of libs
I just wanna do imag detection
plush jungle
If I've got a tensor like this [batch_size, channels, width, height], what should my arguments be in
self.conv1 = nn.Conv2d(in_channels, out_channels, size_of_kernel, stride=2, padding=1)```import cv2?
oh you said install
not import
dusty valve
Yes
plush jungle
try
python -m pip install opencv-python```Kk
dusty valve
plush jungle
try
```
python -m pip install opencv-python```
.bm opencv
 final basin
anyone any idea why my neural network spits out a binairy number

red is neural

it should try predict the blue line


and my data is the blue curve, which is value per quarter hours which I use 7 weeks as input and 1 predicted day as output (the day after the week)
n-features = [7x96, 8x96/2, 8x96/4, 96]
 storm kelp
If I want to create a new column based on conditions from other columns in PySpark, is the syntax from pandas going to work or will I need to use a PySpark specific syntax?
tiny wadi
final basin
and my data is the blue curve, which is value per quarter hours which I use 7 we...
You should have model.predict somewhere. This might be needed together with plot code to debug
 fallow frost
Anybody knows tableau by chance?
inland gull
Hey, qq: in pandas, how do you sort a groupedby count column (per grouping)?
i.e.
df.groupby(['Author', 'channel']).agg('count')['Content'] yields:
Author                     channel
User#3344                  bookclub                116
                           bot-commands             91
                           colosseum              1167
                           finance                 258
User#2867                  bookclub                  1
                           bot-commands             24
                           colosseum                 3
                           finance                   1
If I wanted to sort by that last column, per each Author, how would I do that?
serene scaffold
inland gull
Hey, qq: in pandas, how do you sort a groupedby count column (per grouping)?
i.e...
you can chain .sort_values() onto the end.
this is actually "one column" with two levels of indexing.
inland gull
serene scaffold
you can chain `.sort_values()` onto the end.
When I tack that on, it doesn’t sort by group, but rather the entire list.
serene scaffold
inland gull
When I tack that on, it doesn’t sort by group, but rather the entire list.
show output
also it's a Series, not a list.
inland gull
serene scaffold
show output
Author                     channel
User#8926                  finance                     0
User#6687                  bookclub                    0
User#6549                  bookclub                    0
User#5630                  finance                     0
df.groupby(['Author', 'channel']).agg('count')['Content'].sort_values()
serene scaffold
inland gull
```
Author channel
User#8926 fin...
try chaining sort_index() onto that.
and then show the exact line that you ran and the new output, please.
inland gull
serene scaffold
and then show the exact line that you ran and the new output, please.
Sorry, I had omitted the print/tostring
print(df.groupby(['Author', 'channel']).agg('count')['Content'].sort_values().sort_index().to_string())
Author                     channel
User#3249                  bookclub                113
                           bot-commands             91
                           colosseum              1158
                           finance                 252
User#2867                  bookclub                  1
                           bot-commands             17
                           colosseum                 3
                           finance                   1
try print(df.groupby(['Author', 'channel']).agg('count')['Content'].sort_values().sort_index(level=0).to_string())
inland gull
serene scaffold
try `print(df.groupby(['Author', 'channel']).agg('count')['Content'].sort_values...
No change in output
storm kelp
Didn't he just need to specify a column index to sort_values()?
serene scaffold
storm kelp
Didn't he just need to specify a column index to sort_values()?
no, it's a multiindexed series.
serene scaffold
inland gull
No change in output
print(df.groupby(['Author', 'channel']).agg('count')['Content'].sort_values().sort_index(level=0, kind='mergesort').to_string())
inland gull
serene scaffold
print(df.groupby(['Author', 'channel']).agg('count')['Content'].sort_values().so...
Still the same as initial output
storm kelp
God I really need to work on my python skills
serene scaffold
inland gull
Still the same as initial output
here's a completely different solution.
print(df.groupby(['Author', 'channel']).agg('count')['Content'].rename('Count').reset_index().sort_values(['Author', 'Count']).to_string())
That works for me, it has a weird index in the first col, but it did sort by Author, then count. Thanks!
serene scaffold
inland gull
That works for me, it has a weird index in the first col, but it did sort by Aut...
it involves resetting the index, so that you have three columns instead of one. and then you get a range index.
inland gull
serene scaffold
it involves resetting the index, so that you have three columns instead of one. ...
Right, that makes sense. I appreciate it
storm kelp
@serene scaffold are you any good with PySpark?
serene scaffold
storm kelp
<@253696366952316929> are you any good with PySpark?
no
storm kelp
😢
serene scaffold
use dask idk
hasty mountain
Hey, a question about NLP tokenization... I've noticed that usually people use integers...even embedding layers only accept integers both in keras and in Pytorch.
So...if I scale my tokenized text data so it can get within range [-1, 1]...will it make my model worse? What if I scale my data within range [-10, 10]?
serene scaffold
hasty mountain
Hey, a question about NLP tokenization... I've noticed that usually people use i...
you're asking about encoding, not tokenization. but some libraries might make those look like the same step. and it's important that you don't change the encoding.
since words fundamentally are not numbers, the integers that you're seeing are selected arbitrarily to represent a given token. if you change the encodings, the model won't know what's what anymore.
hasty mountain
serene scaffold
you're asking about encoding, not tokenization. but some libraries might make th...
Oh, ok, encoding... Ok, I know that I must transform words into numbers, but I always see people transforming words into integers. However, I wonder if I can, instead of transforming words into integers, transform them into floats within range [-1,1]. Would that make my model worse?
serene scaffold
hasty mountain
Oh, ok, encoding... Ok, I know that I must transform words into numbers, but I a...
it would make your model meaningless.
hasty mountain
Why?
serene scaffold
because each number represents a specific token. if you go from integers, where there's one integer per token, to floats between -1 to 1, then there's no mapping between the floats and tokens anymore
hasty mountain
But I'm training my model on floats...not training on integers and then converting those integers to floats
hasty mountain
Speech to Text
serene scaffold
what's the model architecture
hasty mountain
1 LSTM with 3 cells and 1 Linear layer
serene scaffold
hmm. I can't help with that, unfortunately. but you'll need to have a decoder that can unambiguously convert numbers back to tokens.
hasty mountain
serene scaffold
hmm. I can't help with that, unfortunately. but you'll need to have a decoder th...
I'm using KNN
simple jacinth
Hey I just updated my python lab and now im getting ```python
cover_df = pd.DataFrame(cover_data)
AttributeError: module 'pandas' has no attribute 'DataFrame'
where does KNN fit into the LSTM and linear layer?
serene scaffold
simple jacinth
Hey I just updated my python lab and now im getting ```python
cover_df = pd.Data...
can you go to the terminal and do pip freeze | grep pandas?
hasty mountain
serene scaffold
hmm. I can't help with that, unfortunately. but you'll need to have a decoder th...
I'm creating my dictionary with some code like this:
word2idx = {}
idx2word = []
for word in self.words:
    if word not in word2idx:
        idx2word.append(word)
        word2idx[word] = len(idx2word) - 1

        word2idx['<EOS>'] = len(idx2word)


maximum = max(word2idx.values())

for word, value in word2idx.items():

    scaled_value = (value-0)*2.0 / (maximum - 0)-1.0

    word2idx[word] = scaled_value
can you fix the indentation on this?
I'm confused by what I'm looking at
 sharp herald
What approach one could use to match entity name that may have typos or abbreviations?
hasty mountain
serene scaffold
can you fix the indentation on this?
Discord isn't helping that much, but I'll try
serene scaffold
sharp herald
What approach one could use to match entity name that may have typos or abbrevia...
so you're asking how to do NER when the data might have typos? a good NER model shouldn't have any issues with abbreviations, if that abbreviation appears enough in the training data.
hasty mountain
hasty mountain
I'm creating my dictionary with some code like this:
```py
word2idx = {}
idx2wor...
@serene scaffold done I guess
serene scaffold
hasty mountain
I'm creating my dictionary with some code like this:
```py
word2idx = {}
idx2wor...
if your idx2word is a list, then how will you look up the word with a scaled value? because a list index has to be an int.
hasty mountain
serene scaffold
if your `idx2word` is a list, then how will you look up the word with a scaled v...
from sklearn.neighbors import NearestNeighbors as KNN

output = output.detach().cpu().numpy()
values = list(word2idx.values())

values = np.array(values).reshape(-1,1)

knn = KNN(n_neighbors=1,algorithm='kd_tree').fit(values)

_, index = knn.kneighbors(output.reshape(-1,1))

keys = list(word2idx.keys())

words = []

for subarray in index:
    for i in subarray:
        words.append(keys[i])

phrase = ' '.join(words)
Yes, actually I am trying fuzzy matching
But I dont want to know the kind but tell if 2 names are the same even if the typing doesnt exaclty matches
hasty mountain
hasty mountain
```py
from sklearn.neighbors import NearestNeighbors as KNN
output = output.det...
I've been managing to encode and decode my text data quite fine this way, but I'm having some trouble with vanishing gradients and I'm wondering if using data with so small numbers might be contributing to that
 sleek tapir
Ik this is not ml
but does anyone know how to do this
If I have
X    |    Y
1    |    5
2    |
     |    4
4    |
5    |    1
     |    6
7    |    8
and i want to do a z column, where x is the priority but if theres no x value then it goes to the y value.
So the final result will be
Z
1
2
4
4
5
6
7
in sql
hasty mountain
hasty mountain
I've been managing to encode and decode my text data quite fine this way, but I'...
Initially I was using 10 LSTM cells in that layer, but my gradients were disappearing in a way that I got NaN for my MSE Loss after 100 epochs. Now I'm just using 3 LSTMs since I'm just practicing, anyway
(Vanishing gradients have been bothering me for quite some time...and residual blocks doesn't seem to be solving completely)
sharp herald
sleek tapir
If I have
```
X | Y
1 | 5
2 |
| 4
4 |
5 | ...
X and Y are python lists?
sleek tapir
sql
simple jacinth
serene scaffold
can you go to the terminal and do `pip freeze | grep pandas`?
ngl I dont know if that did anything
'grep' is not recognized as an internal or external command,
operable program or batch file.```
W3Schools offers free online tutorials, references and exercises in all the major languages of the web. Covering popular subjects like HTML, CSS, JavaScript, Python, SQL, Java, and many, many more.
this
simple jacinth
simple jacinth
```Note: you may need to restart the kernel to use updated packages.
'grep' is n...
I get this error: ImportError: Can't determine version for numexpr @serene scaffold
sleek tapir
wait brb gonna go toilet
sharp herald
SELECT CASE WHEN x IS NOT NULL THEN x ELSE y END AS z FROM xytable;
serene scaffold
simple jacinth
I get this error: ```ImportError: Can't determine version for numexpr``` <@25369...
looks like you installed something else with the name pandas that isn't what you wanted.
 timid kiln
I'm learning about GIS and I wanted to write a function to convert WGS84 lat long to UTM. I probably don't know what I'm talking about here, but it seems in order to do this I need to know the zone. But yet when I see these conversion websites, they don't need a zone to convert to UTM, and in fact they give me the zone for the lat/long.
I installed pyproj to do this, but perhaps there's another python package that might be better? And, how do I get the UTM and zone with just the lat/long?
The folks in the python-general channel suggested that this would be the right place to post this question.
desert oar
timid kiln
I'm learning about GIS and I wanted to write a function to convert WGS84 lat lon...
you're in luck because i've been learning gis stuff for work. yes, pyproj is the right choice for converting between coordinate systems.
timid kiln
desert oar
you're in luck because i've been learning gis stuff for work. yes, pyproj is the...
OK, good! 🙂 So this is pretty much all I've learned at the moment. Supply the lat/long, zone, and the coordinate system (I believe that's the correct term), e.g. WGS84, and then you can get easting northing. But I see this website and apparently you don't need to supply the zone. So, how do I get the zone from lat/long?
https://www.latlong.net/lat-long-utm.html
Convert decimal latitude longitude to UTM easting and UTM northing with zone value.
desert oar
timid kiln
OK, good! 🙂 So this is pretty much all I've learned at the moment. Supply th...
i haven't actually used utm (yet) but let me see if i can dig up something
my company uses wgs84 for everything and i haven't had a need to convert yet
timid kiln
So what sorts of things are you learning? What's the end goal/product?
desert oar
ah, so the zone is just a function of longitude. each zone covers 6˚ of longitude. so you can compute the zone this way:
def utm_zone(lon: float) -> int:
    """UTM zones are 6˚ longitude slices.

    Numbering proceeds from West (-180 ˚E) to East (180 ˚E).

    :param lon: Longitude, in ˚E.
    :returns: UTM zone.
    """

    # Shift from [-180,180] to [0,360]
    lon += 180.0

    # Divide into 6˚ slices, ensuring
    # that 60 "wraps around" to 0.
    zone = (lon / 6) % 60

    # Shift from [0, 59] to [1, 60]
    zone += 1

    return zone
we just have a lot of geospatial data, and i am going to have to analyze it, build models with it, etc.
so i'm not going to go too deep into gis computing specifically, but i need to know enough to be "dangerous", so to speak
 torpid quartz
Whatcha doing?
desert oar
anyway, you can use that utm_zone function (or some equivalent) to get the zone
desert oar
torpid quartz
Whatcha doing?
converting between two "coordinate reference systems" for representing the position of something on the surface of the earth
in this case, converting from WGS84 (traditional latitude and longitude, assuming the earth is an ellipsoid) to UTM (slices the earth into "strips" and uses an x,y coordinate system within each strip)
steady basalt
Anyone else find Athena incredibly buggy l?
frigid solar
@sonic flicker can i ask something?
regarding mlflow?
@sonic flicker
i am using mlflow model serve to expose endpoints but it is not accepting the raw image, how can do that? @sonic flicker
 sonic flicker
sorry cnat help
frigid solar
hehehehe
odd meteor
strong sedge
or else its gonna be a pain to manually label 1000+ tweets 🥲
You could use testblob package 😀 to get the polarity of each tweet. That can help you label the data.
You could use Semi-Supervised Learning to label, or even transfer-learning.
1000-ishh sample observations isn't much data, so if you're free and enjoy doing what many people consider mundane and distasteful, you might wanna hand-label them 😂 (so long you are not bias with the class assignment)
If you wanna try something fun
Consider doing Collective Intelligence vs. Artificial Intelligence. Compare model result from each approach respectively to know which performs best
arctic wedgeBOT
Hey @summer osprey!
It looks like you tried to attach a Python file - please use a code-pasting service such as https://paste.pythondiscord.com
summer osprey
Anyone who is advanced in webscraping? My request takes forever with no return in the console. The website uses cloudflare
odd meteor
odd meteor
You could use testblob package 😀 to get the polarity of each tweet. That can he...
@strong sedge If you're interested in ML Research, you could work on the idea above i.e (Artificial Intelligence vs. Collective Intelligence with the case study on crypto sentiment analysis)
I think it'll make a fine research paper, more over I can tell you'll have fun doing it.
Then try to submit your paper for next year's (2023) EMNLP, NeurIPS, ICLR, etc.
If you're fortunate enough to get your work accepted in any of those conferences, then your worth would automatically double in whichever company you work at. 👌
You should give it a try 😀
For more context: https://www.citizenlab.co/blog/civic-engagement/what-is-the-difference-between-artificial-and-collective-intelligence/

AI and CI might sound like they're from a science fiction movie, but they're becoming a reality for governments. How do they differ, and why do they matter?
Ooh, I forgot to mention that ICLR is coming to Africa (Rwanda) next year 😀 so we might likely meet each other
storm kelp
Depends on what type of regression you've done and on what data
odd meteor
summer osprey
Anyone who is advanced in webscraping? My request takes forever with no return i...
How long are we talking about here? 20 mins? 1 hour?
What are you trying to scrap? Multiple pages or?
Does it throw an error eventually even after taking that much time to return something?
Try using incognito to scrap same website to see if it takes that much time.
If you send multiple request to a server, the website you're trying to scrape might react in so many uncool way to protect their website.
summer osprey
odd meteor
How long are we talking about here? 20 mins? 1 hour?
What are you trying to scr...
It seems not to respond in any way. Like I said it uses Cloudflare protection and responds with "403 Forbidden" or "405 Not Allowed" if no proper header is specified. Just one page like you can see in the code.
odd meteor
summer osprey
It seems not to respond in any way. Like I said it uses Cloudflare protection an...
Hmmm 🤔. I would probably also try using maybe Playwright or Scrappy to see if it can somehow bypass the problem.
odd meteor
summer osprey
It seems not to respond in any way. Like I said it uses Cloudflare protection an...
Is what you're trying to scrape allowed on the website? Try checking the robots.txt file
gloomy anvil
Hello y'all
I created a matrix of grangercausality tests:
How do I interpret these diagonal values? I thought if I test a variable with itself, I thought it should be granger causal. But it seems that it isn't in every case

How to read the matrix: columns cause the rows. so the value in the field indicates in how many cases the column is granger causing the row.
Example: in 3 of 10 cases 15Ewm granger causes 5Ewm.
What I do not understand though are the diagonal values. I expected here 10 every time when testing granger causality with itself. why isn't it like that? Can you help me interpret this relationship?
 sand knoll
does anyone have experience in Pyspark?
 opaque bay
Hi
How do I append to list in which the list acts as a key in a dictionary
 hushed kraken


I want to resample my csv file so it would be every 15 min. But idk what I'm doing wrong, pls help
desert oar
hushed kraken
I want to resample my csv file so it would be every 15 min. But idk what I'm doi...
please repost your code, error messages, and sample data as text in code blocks. it's generally impossible to help with screenshots.
hushed kraken
ok srry
desert oar
!code see below for instructions on how to use a code block:
arctic wedgeBOT
Here's how to format Python code on Discord:
```py
print('Hello world!')
```
These are backticks, not quotes. Check this out if you can't find the backtick key.
Hey @hushed kraken!
You either uploaded a .txt file or entered a message that was too long. Please use our paste bin instead.
hushed kraken
data_belpex = pd.read_csv('C:/Users/abtin/OneDrive/Bureaublad/Belpex.csv',header=0)

data_belpex = data_belpex.rename(columns = {'Unnamed: 0':'Time'})
data_belpex['Time'] = pd.to_datetime(data_belpex['Time'])
data_belpex.set_index('Time', inplace=True)
data_belpex

data_belpex = data_belpex.sort_index()
data_belpex = data_belpex[start_date:end_date]
data_belpex = data_belpex.resample('15T').pad()
ValueError: cannot reindex a non-unique index with a method or limit
should I upload the csv file too?
 gilded bobcat
Hello I have a conceptual question
I have train data with labels. I have test data without labels (they are held by kaggle).
I want to do a gridsearchcv on my train data to find the best parameters, but I see online that early stopping can help my accuracy.
Would it be helpful to do early stopping with my train data on the gridsearchCV or would it be redundant because gridsearchCV already finds the optimal model relative to my OOF data?
 fossil ivy
I wonder how, I wonder why
Yesterday you told me 'bout the
Blue, blue sky
And all that I can see
Is just a yellow #help-lemon tree
Now that I got your attention, could someone shed some light on why my pd.option_context() does not work? Thanks in advance ✨
 bold timber
Hello guys, can anyone give me an insight into the values that come from the two lists in there?

 dense pebble
@bold timber The first and second list are respectively the weights and bias of your output layer
 upper hollow
Hey guys im trynna do a research project on machine learning applications with geospatial data and I need to do a final product at the end of senior year. What should I do for my product? I want to create a machine learning algorithm using geospatial/geographic data. What ideas do yall have that havent been done yet? High school jr btw
bold timber
dense pebble
<@786960616664727572> The first and second list are respectively the weights and...
what layer does that value come from?
 snow cosmos
Hi
I want to print both in real-time and log
How to do with the below command
p= sp run([r'C:\temp\c.ps1'], stdout=sp.PIPE, stderr=sp.PIPE, text=True)
dense pebble
bold timber
what layer does that value come from?
The output layer (the final one), as you can see trainable variables is actually a list with two tf.Variable objects, their names are 'outputLayer/kernel:0' and 'outputLayer/bias:0' and their value (numpy attribute) are the two lists you are asking about
bold timber
dense pebble
The output layer (the final one), as you can see trainable variables is actually...
So that means the output layer has two values that contain output from the kernel/filters and the bias?
I am so confused where does fully connected happen?
dense pebble
bold timber
So that means the output layer has two values that contain output from the kerne...
The final layer is indeed a fully connected layer, it is in the form of Y = WX + b, with W the kernel (or weights) and b the bias. W is a matrix of shape (last_layer_output, 10) and bias is of shape (10)
bold timber
dense pebble
The final layer is indeed a fully connected layer, it is in the form of Y = WX +...
whether the final layer that you mean is the list on number 2?
dense pebble
bold timber
whether the final layer that you mean is the list on number 2?
No the final layer is both list 1 and 2
bold timber
dense pebble
No the final layer is both list 1 and 2
Whether the list 2 is prediction probability for 10 classes?
dense pebble
bold timber
Whether the list 2 is prediction probability for 10 classes?
No, those are not the actual prediction probability, list_1 and list_2 are both used to calculate the final predication probability for the 10 classes.
dense pebble
bold timber
Whether the list 2 is prediction probability for 10 classes?
These are the values of the trainable parameters at the end of the training procedure. These values are what the model learns
bold timber
dense pebble
These are the values of the trainable parameters at the end of the training proc...
can you give me an explanation of what is different between lists 1 and 2? I'm so confused because they have different length
dense pebble
bold timber
can you give me an explanation of what is different between lists 1 and 2? I'm s...
List_1 is the weights W while list_2 is the bias b. If the previous layer output is X then the output Y = X * W + b. In the first you're doing matrix multiplication where X has a size of (number_samples, previous_layer) and W (previous_layer, 10). X * W will be (number_samples, 10). Then b which is a vector (10, 1) will be added to every element. If you don't really understand it I would recommend you read more about the internal math and functioning of a "vanilla" neural network
bold timber
dense pebble
List_1 is the weights W while list_2 is the bias b. If the previous layer output...
Thank you so much for amazing explanation, I really understand know
 unique flame
upper hollow
Hey guys im trynna do a research project on machine learning applications with g...
unique flame
upper hollow
Hey guys im trynna do a research project on machine learning applications with g...
Land subsidence in your area maybe
arctic wedgeBOT
Hey @lapis sequoia!
It looks like you tried to attach file type(s) that we do not allow (.zip). We currently allow the following file types: .gif, .jpg, .jpeg, .mov, .mp4, .mpg, .png, .mp3, .wav, .ogg, .webm, .webp, .flac, .m4a, .csv, .json.
Feel free to ask in #community-meta if you think this is a mistake.
 pale pond
Warning: wall of text, apologies in advance!!
TL;DR - How do I change the input dimensions given to the first layer of a pre-trained model using pytorch?
I have a pytorch question. I'm replicating a paper that uses CNN's to analyse satellite imagery and generate maps showing forest cover in a region. They're using the VGG11 pre trained model - https://pytorch.org/vision/main/models/generated/torchvision.models.vgg11.html
There are 4 different configurations that are possible for the input data being fed to the model, based on the number of "bands" in the satellite image (18 bands, 11 bands, 7 bands, or 3 bands). "Bands" here means "input channels" in the context of a NN. They had a pre-trained VGG11 model as a pretrained model.pt file for each of the 4 configurations.
The 18 band configuration had the best performance, so the only pretrained model that was provided was the one trained with 18 bands.
Since I'm replicating their paper, I am also having to test the CNN's performance on all 4 configurations of the input channel. However, they only provided the 18 band pretrained model, not all 4 😢
When I reached out to one of the authors he suggested that I "load the pretrained weights in the model with 18 channels, change the input dimension of the first layer, and retrain the model".
I don't have a lot of experience with DL or PyTorch so I am getting confused here. The concept seems simple enough - take the pretrained model that has 18 input channels, change the i/p dimensions of just the first layer, and retrain it. But how do I do this? I have the pretrainedmodel.pt file with me...
This is the model.py file - https://paste.pythondiscord.com/eqilefocog
timid kiln
desert oar
so i'm not going to go too deep into gis computing specifically, but i need to k...
Thank you for writing that function for me! Very handy!
One thing, I can't seem to get it to return an int. I've tried to specify all the variables receiving calculations as being int but... I still get floats.
myzone1: int = utm_zone(-105.4514)
print(type(myzone1))
Returns a float.
Also, I noticed some websites, when calculating UTM coordinates, specify a letter as well. I picked a few spots all over the world, and I see S (White House, North Carolina, Spain), and J Paraguay. I'm just now looking up what those letters mean, and if they're required. I got the letters from Google Earth translating between coordinate systems. Then I looked for info on UTM Zones and found this quote:
Each zone is divided into horizontal bands spanning 8 degrees of latitude. These bands are lettered, south to north, beginning at 80° S with the letter C and ending with the letter X at 84° N. The letters I and O are skipped to avoid confusion with the numbers one and zero. The band lettered X spans 12° of latitude. Source: https://maptools.com/tutorials/grid_zone_details
So I'm still wondering, do I really need those letters? Seems unnecessary, no?
MapTools - Tools and instructions for GPS users to work with UTM, MGRS and lat/lon coordinate systems.
 karmic cliff
Anyone here using the official PGA tour api notice how all of the Shotlink data is missing?
desert oar
timid kiln
Thank you for writing that function for me! Very handy!
One thing, I can't see...
oh you will need to call int() on the result at some point. i just forgot. the : int annotation is purely a hint for documentation and static analysis purposes. it has no runtime effect.
the letters ("grid zones") aren't part of the utm system itself, they're part of another system that's built on top of utm: https://en.wikipedia.org/wiki/Universal_Transverse_Mercator_coordinate_system#Latitude_bands so you can just ignore them
timid kiln
desert oar
oh you will need to call `int()` on the result at some point. i just forgot. the...
Gotcha. Thanks for the fix on the int!
So this works:
myzone1: int = int(utm_zone(-105.4514))
This is kind of off topic, related to docstrings, but using vscode, visually, I prefer to use the tick marks around the variables in the docstrings. The internet advises using the colons around the variables as you did. Is there some other IDE that emphasizes the characters between the colon marks as opposed to the marks? For my part the formatting makes it much easier to see the variables called out. Does that make sense?
desert oar
timid kiln
Gotcha. Thanks for the fix on the int!
So this works:
```py
myzone1: int = int...
put the int() inside the function so you don't have to do it over and over. and you can omit the : int annotation entirely, a type checker will be able to infer the type from the function signature
timid kiln
So if I wrote that function my docstring would look like this so it's "prettier" in vscode:
    """UTM zones are 6˚ longitude slices.

    Numbering proceeds from West (-180 ˚E) to East (180 ˚E).
    Parameters
    ----------
    `param` (lon): Longitude, in ˚E.

    Returns
    -------
    `zone` (int): UTM zone.
    """
Something like that
desert oar
def utm_zone(lon: float) -> int:
    """UTM zones are 6˚ longitude slices.

    Numbering proceeds from West (-180 ˚E) to East (180 ˚E).

    :param lon: Longitude, in ˚E.
    :returns: UTM zone.
    """

    # Shift from [-180,180] to [0,360]
    lon += 180.0

    # Divide into 6˚ slices, ensuring
    # that 60 "wraps around" to 0.
    zone = int((lon / 6) % 60)

    # Shift from [0, 59] to [1, 60]
    zone += 1

    return zone
something like that. however you ultimately have to be responsible for checking your own code!
timid kiln
desert oar
```python
def utm_zone(lon: float) -> int:
"""UTM zones are 6˚ longitude sli...
Absolute! I appreciate you help salt rock. (BTW that sounds like a really good band name I called it.)
 coarse plume
How can I convert a 60-bit 01 string into 64 bit word vector using word2vec ?
storm kelp
So the beta coefficients will be based on what the independent covariates in your model are. The sign of the beta coefficient means what direction that particular covariate influences the outcome. If your outcome was heart disease and your covariate was obesity, the beta coefficient for BMI would be positive to say increasing BMI increases risk of heart disease
Beta hat[1] is going to depend on whatever your covariates are in the model
strong sedge
odd meteor
You could use testblob package 😀 to get the polarity of each tweet. That can he...
Yoo, thanks for so much info, I am sorry for the late response (busy day at college), I'll take a look at all these links
Btw i am unemployed, so 2x of 0 is 0 😂😂
I will 100% try to automate the mundane labeling if i ever go on the manual route
Like make a gui program for it or something
storm kelp
So number of days is the outcome, and you have year as your covariate. You want the year where frozen days = 0?
Sorry I've had a skin full of beer
 loud apex
hello
is there a good source to fully understand linear regression? not just the code, but the mathematics behind it
young granite
loud apex
hello
is there a good source to fully understand linear regression? not just th...
loud apex
young granite
https://www.youtube.com/playlist?list=PLZHQObOWTQDPD3MizzM2xVFitgF8hE_ab
thanks
 dusky mesa
i have to create a regression tree with two different target loss functions

but im confused how to make this function he wants
also how do I calculate the loss between the 2 functions? for now im looking at 'sklearn.metrics.log_loss'
desert oar
dusky mesa
it looks like they're asking you to fit the model twice, once with each loss function
dusky mesa
desert oar
it looks like they're asking you to fit the model twice, once with each loss fun...
i understand that but what is that f:[0,1] -> [0,1] function
desert oar
dusky mesa
i understand that but what is that f:[0,1] -> [0,1] function
in math notation, f : A → B is a function called f that takes inputs in the set A and produces outputs in the set B.
the notation [0, 1], is shorthand for "the set of all real numbers ≥ 0 and ≤ 1"
so f : [0, 1] → [0, 1] is a function called f with inputs that are real numbers between 0 and 1, and outputs that are real numbers between 0 and 1
dusky mesa
import random
f = random.random()
sorry if im misunderstanding but would i just use that? or is it something else
since i think the default on that is between 0 and 1
@desert oar
 halcyon zenith
So I was recently looking to use something like tensorflow, but I realized that it only really has support for nvidia graphic cards due to it requiring cuda tech and I have AMD so I am wondering if there is any way I can get around this and or any alternatives.
serene scaffold
halcyon zenith
So I was recently looking to use something like tensorflow, but I realized that ...
I'm pretty sure nvidia is the only brand of GPUs on which you can do deep learning
 iron basalt
serene scaffold
I'm pretty sure nvidia is the only brand of GPUs on which you can do deep learni...
iron basalt
serene scaffold
I'm pretty sure nvidia is the only brand of GPUs on which you can do deep learni...
Pytorch has been working well recently for me on AMD.
iron basalt
Not sure if it works on Windows yet though, but Windows does have the Linux subsystem now.
(Linux scripts needs to install things and all that)
Yeah, so it's weird.
halcyon zenith
Looks like I need to invest into a new pc if I want to do it without headaches
halcyon zenith
oh ROCM?
I looked into that but it requires linux and I dont feel like enabling the Subsystem or swapping to linux rn as the use of ML is really just for a thesis I am working on and not super important to do rn
iron basalt
When they first added ROCm support to Pytorch it was a complete pain to get working and only worked on a few AMD GPUs, but now it has been working better for me.
serene scaffold
halcyon zenith
I looked into that but it requires linux and I dont feel like enabling the Subsy...
for a thesis? does your university have an HPC?
iron basalt
IDK, I would develop on Linux. ML seems to be more supported there in general.
There are a bunch of SDKs needed and without a package system it's a pain.
halcyon zenith
serene scaffold
for a thesis? does your university have an HPC?
I am not in a university. I am just working on a thesis early
serene scaffold
halcyon zenith
I am not in a university. I am just working on a thesis early
I guess we don't have a shared definition of "thesis".
halcyon zenith
I am probably using it wrong to begin with so its likely just me
Either way I came up with something that I thought was worth pursuing and was going to use it in college for one of my projects
serene scaffold
a thesis is a research project that is a requirement for a masters or phd.
halcyon zenith
Ah yea
I plan on going that route
I am trying to start early so I can be prepared
Plus I always wanted to learn ML
Whats it called when you read an image for the text in it again
OCR?
serene scaffold
ya
halcyon zenith
ty
fringe anvil
whats a good rule of thumb that would allow me to create or see if a matrix is idempotent
fringe anvil
i think this is cheating BUT would this be a 4x4 idempotent matrix
[[0.25 0.25 0.25 0.25],
[0.25 0.25 0.25 0.25],
[0.25 0.25 0.25 0.25],
[0.25 0.25 0.25 0.25]]
think of the definition of idempotent: A A = A. so any matrix with that property is idempotent, by definition. therefore it's easy to check if a matrix is idempotent: just check if the definition is true.
another interesting property (that i didn't know until right now) is that all idempotent matrices other than the identity matrix are singular. so you can also check by checking if it's singular, which you can do in several ways, e.g. check if the determinant is zero. if it's not singular, then it's not idempotent. but that's more complicated than just checking the definition.
dusky mesa
Salt rock you free to help 😭
fringe anvil
desert oar
think of the definition of idempotent: `A A = A`. so any matrix with that proper...
thanks!
desert oar
dusky mesa
sorry if im misunderstanding but would i just use that? or is it something else
you're misunderstanding. they are asking you to construct an f that has some very specific properties.
also random.random() is a function of zero arguments, which isn't really something that you have in math.
desert oar
dusky mesa
Salt rock you free to help 😭
sorry, i didn't see your replies before
dusky mesa
desert oar
also `random.random()` is a function of _zero_ arguments, which isn't really som...
Ah i thought it was just us to generate random numbers between 0 and 1 thats why
dusky mesa
desert oar
you're misunderstanding. they are asking you to construct an `f` that has some v...
So what would it be? I have no clhe
dusky mesa
desert oar
sorry, i didn't see your replies before
No problem
desert oar
dusky mesa
So what would it be? I have no clhe
well that's the point of the question! i think it's an interesting task
i don't think there is an obvious right answer to this
desert oar
dusky mesa
Ah i thought it was just us to generate random numbers between 0 and 1 thats why
yeah, you can use random.random() to generate the "x" data for this task
(although you'd probably want to use numpy)
desert oar
dusky mesa
So what would it be? I have no clhe
read the question very carefully. the task here is to come up with a function f such that when you fit a model on x and y = f(x), you get some specific outcome
dusky mesa
desert oar
read the question very carefully. the task here is to come up with a function `f...
😭
desert oar
dusky mesa
😭
you wouldn't be asked this question if your instructor didn't think you could answer it. are you getting stuck in the notation?
dusky mesa
desert oar
you wouldn't be asked this question if your instructor didn't think you could an...
i mean my professor assigns hw without covering topics half the time so
desert oar
dusky mesa
i mean my professor assigns hw without covering topics half the time so
usually that isn't the case, even though it seems like it is. often they are trying to force you beyond your comfort zone.
sometimes you have an actually incompetent instructor and/or they mess up and assign a problem that's too hard.
dusky mesa
no like i mean it. i dont want to blame the professor since its his first time teaching but he doesn't cover many topics used in homeworks in class
dusky mesa
desert oar
sometimes you have an actually incompetent instructor and/or they mess up and as...
so it wouldnt be a function from numpy right its something else?
desert oar
dusky mesa
so it wouldnt be a function from numpy right its something else?
correct
desert oar
this question is testing your intuition about how tree models work
you'll want to start by conceptually working through how a tree model actually is fitted to data
then come up with a function that will produce different results if you use the two different loss functions
if it makes you feel better, i'm not actually sure how i'd solve this either. so it's not an easy problem by any means
especially with a depth of 6, that seems difficult to work through on pen and paper. so there might be a "trick" to it that you will observe if you start trying different things.
solving math problems is very often a process of observation and trial and error. start with some small ideas and just start messing with them.
it's a slow process.
that was one thing that professors sometimes did badly. they forgot that they weren't the only professor assigning homework that week!
dusky mesa
plus we just had an exam for that class today
and i had an exam tuesday and this homework is due today as well
😅 he also only briefly convered decision trees in the beginning of the semester
desert oar
were you covering loss functions recently? what are the two loss functions in this particular problem?
desert oar
dusky mesa
no we are doing rust
rust? like the programming language?
dusky mesa
desert oar
rust? like the programming language?
yeah
desert oar
what kind of course are you in?
that's a really weird thing to do in the same course that covers decision trees and loss functions
dusky mesa
we only did decision trees in the first 2 lectures of class
he never went over loss function only gave us documentation to read
desert oar
ah... your professor might actually fall into the "incompetent" category
is this a computer science course or something?
dusky mesa
its a data science course
hes just super technical since hes been in the industry really long
the lectures are like internships lol
where we either learn on our own or expected to know it already
desert oar
what "documentation" did you read on loss functions?
dusky mesa
it was just online papers or yt vids
desert oar
i'm sorry, but this is inept teaching. you're learning rust, glossing over decision trees, and not even covering loss functions except reading some library docs? i don't care if this guy is yann lecunn, this course is badly taught and badly structured.
dusky mesa
he didn't assign anything specific just gave us the different types and their formula
desert oar
i'm also in industry and i can tell you for sure that unless you are doing some really advanced and specific ML engineering work, you are never going to need or care about the rust programming language
dusky mesa
data science is a brand new major at my college so all the classes are like this
desert oar
that's really disconcerting
dusky mesa
desert oar
i'm also in industry and i can tell you for sure that unless you are doing some ...
dang yea
desert oar
you're being done a great disservice here
i encourage you to look at data science syllabi at a place like caltech for comparison
dusky mesa
ik it really sucks since he assigns really difficult homeworks and we can only submit once and there is no 1 day late due date
you just get a 0
 haughty anvil
hi, what AI technique would I use to find the similarities between a handful of documents or between topics?
serene scaffold
haughty anvil
hi, what AI technique would I use to find the similarities between a handful of ...
topic modeling
serene scaffold
I don't think so
haughty anvil
I;m asking because I already have the topics for each document
I just need to find the similarities between each based on the topics
serene scaffold
what kinds of similarities?
haughty anvil
For example, if there are any similar words or if the documents itself are somewhat alike in meaning or motivation
serene scaffold
haughty anvil
For example, if there are any similar words or if the documents itself are somew...
meaning or motivation. can you elaborate?
haughty anvil
Sure
I'm basically trying to determine if the meaning of motivational speeches are similar. How similar are they and how different. I did find a video on BERT Topic modeling, that has something similar to what I'm looking for. @serene scaffold
 nimble laurel
I'm using Jupyter and I need remove all rows that have identical Values (values are either TRUE or FALSE, so if there's a row where every column is FALSE I need to eject it), what is the Pandas command for this?
serene scaffold
nimble laurel
I'm using Jupyter and I need remove all rows that have identical Values (values ...
the fact that you're using jupyter isn't relevant for your question. Can you please do print(df.head().to_dict('list')) so that I can see your data?
serene scaffold
haughty anvil
I'm basically trying to determine if the meaning of motivational speeches are si...
try that. you can also use this https://github.com/mitre/tmnt

GitHub
Algorithms for training state-of-the-art neural topic models - GitHub - mitre/tmnt: Algorithms for training state-of-the-art neural topic models
nimble laurel
 serene scaffold
nimble laurel
serene scaffold
nimble laurel
I will not look at screenshots of text.
nimble laurel
I don't know what you want me to submit then
serene scaffold
text.
nimble laurel
It's too long
serene scaffold
!paste
arctic wedgeBOT
Pasting large amounts of code
If your code is too long to fit in a codeblock in Discord, you can paste your code here:
https://paste.pythondiscord.com/
After pasting your code, save it by clicking the floppy disk icon in the top right, or by typing ctrl + S. After doing that, the URL should change. Copy the URL and post it here so others can see it.
nimble laurel
serene scaffold
serene scaffold
I will not look at screenshots of text.
please keep this in mind for the future, or I may decide to ignore questions from you.
haughty anvil
serene scaffold
try that. you can also use this https://github.com/mitre/tmnt
Thank you! Will this also give me a graph or a visualization?
nimble laurel
I'm lucky to be heard
serene scaffold
nimble laurel
I'm lucky to be heard
so other than Wiki_ID and TOXICITY, you want to drop rows that are all True or all False?
nimble laurel
I wnat to drop the FALSE rows
serene scaffold
nimble laurel
I wnat to drop the FALSE rows
run ~df.loc[:, 'lesbian':].any() in your notebook and see what the output is.
nimble laurel
serene scaffold
nimble laurel
https://paste.pythondiscord.com/joxicataji
oh, the axis is wrong. my mistake.
if you do ~df.loc[:, 'lesbian':].any(axis=1), you'll get a series of bools. and the ones that are True are the ones where "not any are true"
the ~ is not
nimble laurel
ok
serene scaffold
that said, it's actually easier to select the rows that you do want, then to drop the ones that you don't
do you know how to do boolean indexing?
serene scaffold
nimble laurel
not on this scale
with pandas, the scale never matters. the code will be the same if you have ten rows or ten million.
nimble laurel
still no
serene scaffold
just do df[df.loc[:, 'lesbian':].any(axis=1)]
serene scaffold
nimble laurel
ok
that should be the solution.
nimble laurel
how do I drop the rows with only FALSE and export as a new CSV?
it sorted them, but I need to drop them
serene scaffold
nimble laurel
it sorted them, but I need to drop them
df[df.loc[:, 'lesbian':].any(axis=1)].to_csv('./output.csv')
nimble laurel
thanks
serene scaffold
selecting rows that are a certain way, is the same as dropping rows that aren't that way
does that make sense?
nimble laurel
yup, thanks
hasty mountain
@serene scaffold since you're expert in NLP, tell me...is RoBERTa still the state-of-the-art model for NLP?
serene scaffold
hasty mountain
<@253696366952316929> since you're expert in NLP, tell me...is RoBERTa still the...
model for what? there's a lot of NLP tasks.
hasty mountain
It seems that RoBERTa was kinda the base for many tasks
At least this is what I've been reading
People train on BERT/use BERT to extract features, and then train on their own model to perform their specific task
Like VGG
serene scaffold
well, a lot of my projects do involve some flavor of BERT, yes
but there are tasks where BERT can't really help you
hasty mountain
Can you give some examples?
serene scaffold
hmm. well, I found papers that involve BERT for the examples I had in mind
if I think of one, I'll tell you.
hasty mountain
Ok
serene scaffold
it might be that those authors were just shoehorning bert into some task because it's the sexy thing right now.
hasty mountain
I passed the entire day reading Google's "Attention is all you Need" paper and also reading some code to implement it. That Transformer is quite simple...at least compared to some papers I've read in Computer Vision and GANs. If BERT is indeed only the Encoder part, then...well...
I'll probably have more trouble creating the dataset than in making the actual model's code.
(No, I don't want to use frameworks which already has the model included)
serene scaffold
I hope you have a GPU
hasty mountain
I do, but for BERT I'll be using a cloud server
haughty anvil
What's the best way to visualize a cluster of topics in a graph?
nimble laurel
I have another problem, how can I replace all instances of "False" with a 0? I've tries
df2 = df.replace('False','0')
but nothing happens
serene scaffold
nimble laurel
I have another problem, how can I replace all instances of "False" with a 0? I'v...
bools are not strings.
nimble laurel
ok
serene scaffold
also, False basically already is 0
nimble laurel
wow, thanks
serene scaffold
haughty anvil
What's the best way to visualize a cluster of topics in a graph?
you can reduce the dimensionality to two or three with this: https://scikit-learn.org/stable/modules/generated/sklearn.decomposition.PCA.html
and then display it as a scatter plot.
scikit-learn
Examples using sklearn.decomposition.PCA: A demo of K-Means clustering on the handwritten digits data A demo of K-Means clustering on the handwritten digits data Principal Component Regression vs P...
haughty anvil
Thank you!
nimble laurel
Got another, is there an easy command to merge these columns? Like merging "lesbian, gay, bisexual, etc" into one column for "sexual minorities"?
And just combine all of the values into a giant columb
serene scaffold
nimble laurel
And just combine all of the values into a giant columb
not sure what you mean. do you want one column that's True if any of those columns are True? or do you want multiindexing?
nimble laurel
Combine both the true and false statements for all columns, I have 20+ columns of diff minorities and I need to combine them all into core groups of protected classes
serene scaffold
try explaining what you want without saying "combine".
nimble laurel
merge?
serene scaffold
I still don't know exactly what you want. do you know what multiindexing is?
nimble laurel
no
serene scaffold
!docs pandas.MultiIndex
arctic wedgeBOT
class pandas.MultiIndex(levels=None, codes=None, sortorder=None, names=None, dtype=None, copy=False, name=None, verify_integrity=True)```
A multi-level, or hierarchical, index object for pandas objects.okay, so you want to stop having the columns lesbian, gay, and bisexual, and you instead want to have one column that's True if at least one of those three values was True? is that right?
nimble laurel
standby, I think I figure out what I need, sorry
nimble laurel
ok, I am ready to merge multi indexed columns
bold timber
dense pebble
The final layer is indeed a fully connected layer, it is in the form of Y = WX +...
Hello sir, can you define the value as a number of last_layer_output?
*just for example
coarse plume
coarse plume
How can I convert a 60-bit 01 string into 64 bit word vector using word2vec ?
.
coarse plume
sure
 cloud sand
ty!
coarse plume
cloud sand
it's a bit vague
I am building an AI from a paper, for learning purposes. I am currently at the "4.1. Data Preprocessing" section. I completed the first few steps (see colab). The paper says:
As shown in Figure 3, each character is encoded into a 60-bit 01 string where one in the interface value row and zero in the rest. Then, we use the word2vec method in natural language processing to encode the previously processed 60-bit 01 string into a 64-bit word vector. Thus, each URL is processed into a two-dimensional matrix of length 255 * 60 , which then passes to the input of PDRCNN.
And this where I got no clue what I have to do.
Colab Notebook: https://colab.research.google.com/drive/1HLTXHOb9at_-EQo-yFOPIQSV0RoR1FF8?usp=sharing
Paper: https://doi.org/10.1155/2019/2595794


Through well-designed counterfeit websites, phishing induces online users to visit forged web pages to obtain their private sensitive information, e.g., account number and password. Existing antiphishing approaches are mostly based on page-related features, which require to crawl content of web pages as well as accessing third-party search engin...
coarse plume
cloud sand
ty!
hope this helps
cloud sand
ok makes sense now
since it says to encode the 60 bit string into a 64 bit embedding the string is probably the token rather than a sentence
so you can just get your associated word2vec token and use that to encode it
coarse plume
cloud sand
so you can just get your associated word2vec token and use that to encode it
can you make a short example?
cloud sand
<|s0->t0,s1->t1...|>, s0->t0, w2v(t0)
coarse plume
thank you!
cloud sand
nw!
 compact gazelle
 serene scaffold
it's easier to start with an existing one
serene scaffold
@coarse plume please don't ghost ping people.
coarse plume
? I just deleted my old message, because it was a stupid question
serene scaffold
someone deleted a message in which they pinged me
which is very confusing if you have a ping and can't find the message
fossil ivy
I have a function simulation(). It returns resultsdf, which is of dimension [7x739].
How could I access all of them after 50 runs when using:
if __name__ == "__main__":
    for i in range (0,50):
        simulation()
I don't seem to quite get that
Should I change resultsdf to a different variable each time the function runs?
 sinful surge
How would I go about making a deep learning model that detects violence in videos?
Do I make it analyze violence in every frame?
storm kelp
No expert on deep learning but if I had to guess, looking at sound would be more informative of violence than training on visuals.
arctic wedgeBOT
Hey @lapis sequoia!
It looks like you tried to attach file type(s) that we do not allow (.zip). We currently allow the following file types: .gif, .jpg, .jpeg, .mov, .mp4, .mpg, .png, .mp3, .wav, .ogg, .webm, .webp, .flac, .m4a, .csv, .json.
Feel free to ask in #community-meta if you think this is a mistake.
unique flame
sinful surge
How would I go about making a deep learning model that detects violence in video...
Yes, and also on "non-violence".
sinful surge
unique flame
Yes, and also on "non-violence".
Yes of course, thanks.
split drift
I have a question regarding unittesting for pandas's DataFrame:
What is the best practices?
Should I Create, for each function, two DataFrames: input DataFrame and expected output DataFrame, that I would save aside,
and then to run the function on the input DataFrame and compare it with the expected output DataFrame?
.
 twilit arch
Hello, I don't have much experience in AI, I know basics of neural networks and such, but I haven't played with anything yet. How hard would it be to create a neural network / AI to price products by their attributes based on previous sales? I have the data, but I do not know how to make the AI. I know there are several templates that you just slam data on and it works out of the box. Pricing based on attributes seems simple enough, at least to me. Is there any templates I could use?
serene scaffold
twilit arch
Hello, I don't have much experience in AI, I know basics of neural networks and ...
Are you trying to set static prices for new products based on their similarity to other products, or predict how the prices of things might fluctuate over time based on the sales history of similar products?
dusty valve
https://github.com/HRLO77/Image-CNN am I doing this right? I tried to make a CNN to classify an image as a dog or cat.

GitHub
A CNN to classify something as a dog or cat. Contribute to HRLO77/Image-CNN development by creating an account on GitHub.
I trained it on 42 images for 9 epochs with 96% acc
I think it's overfitting
Should I get more images or train for less epochs?
twilit arch
serene scaffold
Are you trying to set static prices for new products based on their similarity t...
both, prices might change in the future, but it's not necessary if it gets too hard
 barren snow
In google colab, how if my RAM is too big, so it stop working?
i can't run
vqvae, *priors = MODELS[model]
vqvae = make_vqvae(setup_hparams(vqvae, dict(sample_length = 1048576)), device)
top_prior = make_prior(setup_hparams(priors[-1], dict()), vqvae, device)
``` in https://colab.research.google.com/github/SMarioMan/jukebox/blob/master/jukebox/Interacting_with_Jukebox.ipynb#scrollTo=65aR2OZxmfzq river gale
I have an ML/DL interview coming up. Are there any quick resources for preparation?
 rare socket
Would anyone know why my output to my NN varies so little even if the input data always changes? My NN can only chose one option for every input

 midnight crater
hello, i would like to clarify if it's okay for an image's min value to be greater than 0? I have dark images and increase its brightness using opencv then rescaled the images. after checking the .min() it shows 0.3+ and .max() 1.0. is this acceptable before feeding to the neural network?
serene scaffold
river gale
I have an ML/DL interview coming up. Are there any quick resources for preparati...
Tell me what are precision and recall.
Give me an example of unsupervised learning.
 cursive pond
Hey, im currently in need of some help for evolutionary algorithms, id really appreciate someone looking at the post I made and maybe reply there or here on discord if they can help! https://www.reddit.com/r/learnpython/comments/y4uwzz/machine_learning_am_i_doing_this_right/?utm_source=share&utm_medium=android_app&utm_name=androidcss&utm_term=1&utm_content=share_button

reddit
0 votes and 0 comments so far on Reddit
strong sedge
cursive pond
Hey, im currently in need of some help for evolutionary algorithms, id really ap...
I am not really aware of the knapsack problem
So i can't give you pointers on that
I see ur trying out a genetic algorithm, I can't clearly identify if u mutate after reproduction, that might be a reason
Also just play with the parameters like how random u want the mutation to be etc
strong sedge
rare socket
Would anyone know why my output to my NN varies so little even if the input data...
Try changing the activation function
cursive pond
strong sedge
I am not really aware of the knapsack problem
So i can't give you pointers on th...
Hm no im not using any mutation, im just using recombination (two-point crossover) cuz i thought that'd be enough for generating new children, and that mutations would just be a different way to generate them. Is both needed?
strong sedge
cursive pond
Hm no im not using any mutation, im just using recombination (two-point crossove...
Mutation always helps in genetic algorithm
Too much can be bad, and too little or none wont improve the agents/model past a point
cursive pond
Alright, thanks for the tip, imma try to implement it!
strong sedge
One thing, ur already doing 2 parent reproduction, might be worth checking out single parent or more than 2
I general 2 is better than 1 parent reproduction
I have never tried or seen more than 2, but hey u can if u want to
cursive pond
Where should I implement that tho? Just after the recombination? And i should just pick some random parent, mother or father?
strong sedge
cursive pond
Where should I implement that tho? Just after the recombination? And i should ju...
After "recombination"
Also the way you select the parent can also affect the time it takes for the model/agent to become good
Like only choosing the best parents after each generation is not optimal as the agents won't have time to explore possible gene combination
Randomly choosing the parents is also not optimal as you would end up with "bad gene combinations"
The line is some where in the middle, mostly it's better to go for the best parents but every now and then choose randomly
haughty anvil
Hi! I could use some guidance.
I'm trying to do something like 9. Word Clouds of Top N Keywords in Each Topic and 10. Word Counts of Topic Keywords in this blog post https://www.machinelearningplus.com/nlp/topic-modeling-visualization-how-to-present-results-lda-models/#10.-Word-Counts-of-Topic-Keywords
The problem is I don't need to use LDA because I'm using my own Topic Detection. Would anyone need to point me in the right direction of how to do this without LDA?
cursive pond
strong sedge
Like only choosing the best parents after each generation is not optimal as the ...
Thanks for your advice, I thought just following the "best parents" genes would be the fastest way to the goal, but your explanation makes sense!
haughty anvil
I'm basically trying to take topics from each document and visualize them
strong sedge
cursive pond
Thanks for your advice, I thought just following the "best parents" genes would ...
No problem mate :D
haughty anvil
Maybe I'm confused. Maybe I need LDA? But I'm using another topic detection.
storm kelp
Yeah?
I can't remember what the question was. The sign of beta coefficients?
What was the model code?
I'm on the piss at the moment. Probably best if I reply tomorrow
But put the info/code in here for.me to see
hasty mountain
@serene scaffold is there any metric to measure how much the output from a text generator model makes sense?
I'm thinking about trying to make a Text GAN following the same idea as a DCGAN(with some modifications, of course)
I was thinking about using the Bleu score for this, but perhaps there's a better way?
Oh... I've just seen that, in the Bleu Score's paper they use this metric to distinguish text generated by human and by machines...
Sorry for the probably unnecessary ping 
fallow frost
random question
is a column containing time info (in minutes) considered a time-series ?
for some context the format is 2150 for 21:50
young granite
df.assign(newtime=pd.to_datetime(df.st_time, format='%H%M').dt.time)
@fallow frost
fallow frost
just as a general, question would you consider it a time-series (semantics)?
fallow frost
there is this instructor at Udacity that is driving me nuts
young granite
🗿
fallow frost
first he says I should only use line plot for time series, but then when I compare the count of smth (on Y axis) with the time (in integer format on X axis) using a area chart, then he rejects my project stating that I should use a scatter plot instead
young granite
mhhhh
maybe i misunderstood u but if u plot it as area-chart thats not a line plot 🗿
what kind of data are u working with normally i would choose depending on the present data
fallow frost
well and area chart is just a line plot with bottom half filled with a color (which imo makes it easier to read in some cases)
young granite
true
but its not the asked chart type
if its an interactive control panel maybe it just searches for some keywords
fallow frost
young granite
what kind of data are u working with normally i would choose depending on the pr...
its basically:
Y = COUNT(flights/*)
X = time_data # a column containing the time departed in INT format (2150)
fallow frost
young granite
but its not the asked chart type
wdym its the same thing than a line plot
young granite
as stated above if its interactive maybe it searches for keywords in ur code
 young granite
who stops u
fallow frost
this fucking project
its for my bootcamp
gotta do it by tomorrow, and this instructor at Udacity is driving me crazy 😫
young granite
graduate or professional ?
fallow frost
I think its called a nano degree
basically my bootcamp gives us content to do and watch every two weeks, and alot of it is on Udacity
for the past two weeks weve been doing Tableu for ex
fallow frost
young granite
i dont know udacity
youre better off like this
udemy is solid, lots of content, and relatively cheap
 fallow frost
the other is mostly for schools and professionals
young granite
fallow frost
what is "Leader" based on?
to "group" different platforms i assume
quite objective 🗿
fallow frost
I think so too
but back to my og question, can a column containing time data as integers be considered a time series ?
young granite
i would say yes
fallow frost

but udacity sucks, thats for sure
anyways I gtg to bed soon
@young granite have a good night or whathver
young granite
@fallow frost u2
 rapid spindle
Suppose i have a matrix X and a target vector y, how would i get optimized weights w? Would w = ((X^T X)^-1) (X^T)y? is that the formula to get the optimized weights?
serene scaffold
rapid spindle
Suppose i have a matrix X and a target vector y, how would i get optimized weigh...
you mean like, to train the weights in a neural network?
 wary crown
rapid spindle
Suppose i have a matrix X and a target vector y, how would i get optimized weigh...
wary crown
rapid spindle
Suppose i have a matrix X and a target vector y, how would i get optimized weigh...
i think theres a library for that
also my csv isnt working for some reason? im trying to build a machine learning program, but I keep getting an error with this specific csv (but not the iris dataset)
the csv:
28564,0,6284.08,1713.84,19.9948,19994.8,19.9948,19.9948
28411,0,6250.42,852.33,0,20740.03,568.22,0
27515,0,6053.3,550.3,0,20361.1,550.3,0
24586,491.72,5408.92,245.86,0,17947.78,491.72,0
26653,533.06,6130.19,0,0,18923.63,1066.12,0
26836,805.08,6172.28,0,0,18785.2,1073.44,0
26073,1303.65,5736.06,0,0,17990.37,1042.92,0
27055,1352.75,6222.65,0,0,18397.4,1082.2,0
26236,1311.8,6034.28,0,0,17578.12,1311.8,0
26020,1821.4,3903,0,0,18994.6,1040.8,260.2
26538,0,4246.08,265.38,13799.76,6369.12,0,1326.9
25800,3354,5160,0,0,14964,1290,1032
26682,3468.66,5603.22,0,0,14941.92,1600.92,1067.28
24997,3499.58,5499.34,0,0,13248.41,1499.82,1249.85
25100,3765,4769,0,0,13052,1506,2008
24651,4190.67,4930.2,0,0,12325.5,1232.55,1972.08
12053,0,1084.77,0,3133.78,6508.62,0,723.18
11500,2070,2415,0,0,4255,690,2070
is there more to this question?
wary crown
yes
im getting my code one sec
# Python version
import sys

from sklearn.metrics import make_scorer

print('Python: {}'.format(sys.version))

import scipy

print('scipy: {}'.format(scipy.__version__))

import numpy

print('numpy: {}'.format(numpy.__version__))

import matplotlib

print('matplotlib: {}'.format(matplotlib.__version__))

import pandas

print('pandas: {}'.format(pandas.__version__))

import sklearn

print('sklearn: {}'.format(sklearn.__version__))


from pandas import read_csv
from matplotlib import pyplot
from sklearn.model_selection import train_test_split
from sklearn.model_selection import cross_val_score
from sklearn.model_selection import StratifiedKFold
from sklearn.linear_model import LogisticRegression
from sklearn.tree import DecisionTreeClassifier
from sklearn.neighbors import KNeighborsClassifier
from sklearn.discriminant_analysis import LinearDiscriminantAnalysis
from sklearn.naive_bayes import GaussianNB
from sklearn.svm import SVC


url = "energyFormatted.csv"
names = ['TOTAL', 'PURCHASED', 'NUCLEAR', 'SOLAR', 'WIND', 'NATURAL_GAS', 'COAL', 'OIL']
dataset = read_csv(url, names=names)
print(dataset.shape)


array = dataset.values
X = array[:, 0:4]
y = array[:, 4]
X_train, X_validation, Y_train, Y_validation = train_test_split(X, y, test_size=0.20, random_state=1, shuffle=True)
# Spot Check Algorithms
models = []
models.append(('LR', LogisticRegression(solver='liblinear', multi_class='ovr')))
models.append(('LDA', LinearDiscriminantAnalysis()))
models.append(('KNN', KNeighborsClassifier()))
models.append(('CART', DecisionTreeClassifier()))
models.append(('NB', GaussianNB()))
models.append(('SVM', SVC(gamma='auto')))

results = []
names = []
for name, model in models:
    kfold = StratifiedKFold(n_splits=10, random_state=1, shuffle=True)
    cv_results = cross_val_score(model, X_train, Y_train, cv=kfold, scoring='accuracy')
    results.append(cv_results)
    names.append(name)
    print('%s: %f (%f)' % (name, cv_results.mean(), cv_results.std()))
there
 dim wasp
Hey I am looking to make asimple bot for Valorant and I have a couple of questions before starting. I have done a little with ml and am familiar with programming.
1: Would yolov7 be the best for image recognition as i need it to be fast and accurate.
2: the maps look similar to the style in the image but there is no green line. Is there a way I would be able to get the bot to go somewhere if i know locations
3: Similar to 2, how would i get the bot to face the direction iot is travelling
I don't want to acess anything from memory. Everything should be done from gameview. Thanks!
 serene scaffold
what about the error message
wary crown
serene scaffold
what about the error message
do you mean mine?
if so, im getting it right now
wait i have to put it on pastebin
aaah
Pastebin
Pastebin.com is the number one paste tool since 2002. Pastebin is a website where you can store text online for a set period of time.
thats the error if you want to see. It has to do with cv_results, but I think its the csv because this same code works fine with the iris dataset
serene scaffold
@wary crown are you following a tutorial?
serene scaffold
wary crown
https://machinelearningmastery.com/machine-learning-in-python-step-by-step/
the conventions used in your code are pretty old, so I suspect that you're unknowingly trying to use something in a deprecated way.
'%s: %f (%f)' % (name, cv_results.mean(), cv_results.std()) -- if you see a string used with % like this, run away
wary crown
serene scaffold
`'%s: %f (%f)' % (name, cv_results.mean(), cv_results.std())` -- if you see a st...
so its not my csv?
im confused please forgive me
serene scaffold
if you can load the CSV with pandas, then the CSV is fine. and your error isn't raised by pandas.
wary crown
thats what I thought but this same code works with the iris dataset - is it a problem with the size or input?
to cross_val_score
serene scaffold
one issue that comes to mind is that you're using both train_test_split along with a k fold generator
the point of k fold cross validation is that each fold of the dataset takes a turn being the test data
wary crown
thats what I thought, but I couldnt think of alternatives for x_train,x_validation, etc.
dim wasp
can someonie answer my question pls #data-science-and-ml message
wary crown
dim wasp
Hey I am looking to make asimple bot for Valorant and I have a couple of questi...
for #1 why not do some testing, for the other two Im not sure how that would be done without any info from memory
dim wasp
wary crown
for #1 why not do some testing, for the other two Im not sure how that would be ...
peopel have done it
serene scaffold
@dim wasp it looks like that's a multiplayer game, so we won't help you cheat.
please don't ask again.
wary crown
serene scaffold
<@579867729117315072> it looks like that's a multiplayer game, so we won't help ...
it is?
oh it is
serene scaffold
they left the server after I called them out
wary crown
LOL
serene scaffold

wary crown
wary crown
thats what I thought, but I couldnt think of alternatives for x_train,x_validati...
to be entirely honest, I don't exactly understand what they are doing with x_train, x_validation, etc.
@serene scaffold is this old? ```py
print("Feature Ranking: %s")
well, that won't work without a % and something after it
but most people these days would do print(f"Feature Ranking: {ranking}")
if you just put an f before the opening of the string, you can put stuff right in the string
wary crown
yes thats what I would do
serene scaffold
so if someone doesn't do that, don't trust them.
or at least I wouldn't trust them. but I have trust issues.
wary crown
this time im getting an error with this line
Traceback (most recent call last):
  File "C:\Users\danie\AppData\Roaming\JetBrains\PyCharmCE2022.2\scratches\FY23 SCI FAIR\main.py", line 55, in <module>
    rfe = RFE(model, 2)
TypeError: __init__() takes 2 positional arguments but 3 were given
idk man this is the only other tutorial I could find
serene scaffold
look at the docs for RFE
wary crown
I changed it to None which is the default
and ITS THIS AGAIN
ValueError: Unknown label type: 'continuous'
do you think this will help?
This tutorial explains how to fix the following error in Python: ValueError: Unknown label type: 'continuous'.
wary crown
serene scaffold
look at the docs for RFE
I did but this code looks fine
serene scaffold
do you have the latest version of sklearn?
serene scaffold
hmm. I have to go to sleep, unfortunately
serene scaffold
Eh, don't thank me unless I actually help you 😅
 urban knoll
I'm trying to learn GANS but dont understand the "noise" used as input for the generator. what exactly is it?
 austere swift
urban knoll
I'm trying to learn GANS but dont understand the "noise" used as input for the g...
austere swift
urban knoll
I'm trying to learn GANS but dont understand the "noise" used as input for the g...
its just a bunch of random numbers
like those that would be generated from np.random.randn
urban knoll
austere swift
its just a bunch of random numbers
okay but like......how do random numbers help the generator make fake cats?
and how can the generator get better and making fake cats if its always random numbers? I've tried watching some videos on it but still dont understand
cursive pond
Hello, id appreciate any help on my problem I described in this post! Either on reddit or just here. Thanks in advance! https://www.reddit.com/r/learnpython/comments/y4uwzz/machine_learning_am_i_doing_this_right/?utm_source=share&utm_medium=android_app&utm_name=androidcss&utm_term=1&utm_content=share_button
reddit
2 votes and 1 comment so far on Reddit
 random forum
can someone suggest a good book for reinforcement learning with trnsorflow
 earnest rose
on x-axis i have dates like:
2018-01-01 00:00:00,
2018-01-01 01:00:00,
2018-01-01 02:00:00
and so on how to split dates like this
2018 -05-0-1 00:00:00,
2018-010-0-1 00:00:00?
so that the dates are displayed along the x-axis not entirely, but in parts, and in the diagram everything is shown in full?
 young granite
import plotly.express as px
import plotly.graph_objects as go
import pandas as pd

df = pd.read_csv('https://raw.githubusercontent.com/plotly/datasets/master/finance-charts-apple.csv')

fig = px.histogram(df, x="Date", y="AAPL.Close", histfunc="avg", title="Histogram on Date Axes")
fig.update_traces(xbins_size="M1")
fig.update_xaxes(showgrid=True, ticklabelmode="period", dtick="M1", tickformat="%b\n%Y")
fig.update_layout(bargap=0.1)
fig.add_trace(go.Scatter(mode="markers", x=df["Date"], y=df["AAPL.Close"], name="daily"))
fig.show()```and u could work with a split if certain criteria are met
cursive pond
What are possible things I could try out/achieve with evolutionary algorithms? Like what problems could I try to solve, besides optimization problems such as knapsack?
tidal bough
cursive pond
What are possible things I could try out/achieve with evolutionary algorithms? L...
I used EAs for https://www.codingame.com/multiplayer/bot-programming/mad-pod-racing and https://www.codingame.com/multiplayer/optimization/mars-lander, though not sure this is the kind of problem you're looking for.
cursive pond
Thanks for those! They look very interesting, I didnt even know such a website exists!
hasty mountain
urban knoll
and how can the generator get better and making fake cats if its always random n...
The generator will modify its weights in order to be able to generate images using that random noise
Suppose that your target image has a pixel with value 150. Your training function will pass a random noise with a number that is close to 0 with a standard deviation of 0.5 So, let's say your random number is 0.001.
So the first iteration will be something like this:
0.001 * weight = output
Let's say that your weight has been initialized as having value 0:
0.001 * 0 = 0
Then, your generator will compare its output to its loss, backpropagate and modify its weight value, until it can get something like:
0.001 * 150,000 = 150
Fun fact: Modifying the random noise can make you control which type of image you want your GAN to generate
tidal bough
tidal bough
I used EAs for <https://www.codingame.com/multiplayer/bot-programming/mad-pod-ra...
even found an old visualization for the latter.
strong sedge
cursive pond
What are possible things I could try out/achieve with evolutionary algorithms? L...
I used GA on making a flappy bird AI
desert oar
earnest rose
on x-axis i have dates like:
2018-01-01 00:00:00,
2018-01-01 01:00:00,
2018-01-0...
with matplotlib? if you use an actual "datetime" array on the x axis it should generate a nicer looking axis
or use a pandas series
lapis sequoia
What are some cool beginner projects to do with ML?
austere swift
urban knoll
okay but like......how do random numbers help the generator make fake cats?
the generator is just a bunch of layers which are transformations to the initial input (the random numbers)
its trained to give an output of a cat regardless of what the input is, but depending on the noise it can make a different image
basically the discriminator is trained to identify if an image is fake or real, while the generator is trained to make the discriminator wrong, and in that process the generator is just learning how to make images of cats that are so good that the discriminator can't figure out which one is real or fake
the layers are just taking the input noise and turning them into an image by changing the values, so it doesnt matter what numbers you give it it'll give you an image as an output
hasty mountain
Hey, can someone who understands calculus give me a feedback?
I want to get the derivative of the Bleu Score function:
f(x) = BP * math.exp(math.fsum(w_i * math.log(x)))
(I'm using f(x) just for clarification. I'll change it later)
I tried to use chain-rule and got this:
dy/dx = BP * math.exp(math.fsum(w_i * math.log(x))) * len(w_i * math.log (x)) * w_i/x
I don't know if this is correct...I'm not good at calculus...specially when it comes to the chain-rule.
serene scaffold
hasty mountain
Hey, can someone who understands calculus give me a feedback?
I want to get the ...
this is the function you're trying to derive?
 hasty mountain
serene scaffold
this is the function you're trying to derive?
hasty mountain
serene scaffold
this is the function you're trying to derive?
Yes
serene scaffold
is w_i a scaler or an array?
hasty mountain
scaler, I think
weights =[0.25]*4
that's the same as [0.25, 0.25, 0.25, 0.25]. so, not a scaler.
do you know what the p_n part is?
hasty mountain
Is the precision score through n-grams
serene scaffold
serene scaffold
this is the function you're trying to derive?
I don't think your original code actually does this formula.
hasty mountain
weights =[0.25]*4
scores = []

for weight, precision in zip(weights, clipped_precision_score):
    w_i = weight
    p_i = precision

    if p_i == 0.0:
        score = (w_i * math.log(0.0001)) # Log of 0 tends to -infinite. But let's just stick to 0.0001 so a single wrong word won't break the score
        dscore = (w_i/math.log(0.0001))
    else:
        score = (w_i * math.log(p_i))
        dscore = (w_i/math.log(p_i))

    scores.append(score)
this will have an indentation error.
hasty mountain
Where?
serene scaffold
dscore isn't lined up with score and the else isn't lined up with if.
hasty mountain
How about now?
Also, I'm using the code from the solution here with some adaptations
https://stackoverflow.com/questions/56968434/bleu-score-in-python-from-scratch
cursive pond
Hey, could someone look into my code and give feedback on whether or not im implementing the k-nearest neighbors algorithm correctly? thanks in advance! https://pastebin.com/p6JYyHug
Pastebin
Pastebin.com is the number one paste tool since 2002. Pastebin is a website where you can store text online for a set period of time.
 neon vessel
can someone share the most complex csv file for data analysis that you've ever seen ? 😄
lapis sequoia
I was doing classification on the Iris dataset and I got 95% accuracy. Why can't it get to 100%? How can I know what caused it to incorrectly predict 5% of the time? And how do I know what's different about those 5% of flowers compared to the other 95%?
serene scaffold
lapis sequoia
I was doing classification on the Iris dataset and I got 95% accuracy. Why can't...
those 5% that you didn't get might legitimately be ambiguous in some way
 grand breach
if I were to serialize tf.tensor (using tf.io.serialize_tensor) would I be storing it on to the disk?
 mint palm
what can i do to improve my model, i am using yolo, for defect detection in microscopic images of metal surface.
serene scaffold
mint palm
what can i do to improve my model, i am using yolo, for defect detection in micr...
if you want suggestions about how to improve your model, you have to be really specific about what all the hyperparameters are and what your current performance is.
rare socket
Hello, these are the outputs to my deep learning network. They hardly vary at all so the network can only chose one option for every possible input given. Someone told me yesterday to change the activation functions and it helped a bit (I tried many and none) but it is still not enough. I am not sure what else to do

 cinder schooner
Greetings, I need to take a question answering model and somehow make it answer in the style of a specific fictional character. what are your thoughts on this? where can I start?
serene scaffold
cinder schooner
Greetings, I need to take a question answering model and somehow make it answer ...
that would be difficult. do you have a txt file with everything that character has ever said (and nothing else)?
cinder schooner
serene scaffold
that would be difficult. do you have a txt file with everything that character h...
I need to make it talk like Shakespeare so I thought of either using his fictional characters from the plays or the tweets from shakespeare twitter
serene scaffold
cinder schooner
I need to make it talk like Shakespeare so I thought of either using his fiction...
I have some vague ideas about how one might do that, but no specific suggestions.
what kinds of questions does it need to be able to answer though
cinder schooner
I thought of taking a pretrained conversational model and training it using the Shakespeare dataset and then adding some header to make it question answering using squad but as i'm new to nlp i dont know if this can work
cinder schooner
serene scaffold
what kinds of questions does it need to be able to answer though
its a technical assignment for an internship and its somehow open. I need to make a question answering model (so it takes a context) that answers naturally (makes a conversation) and talks in the style of Shakespeare without giving fake news when the info is not in the context.
I'm struggling on it for days now so I thought of asking here.
serene scaffold
@cinder schooner if you can take a general QA system and add a layer to make the answers sound like Shakespeare English, that would do it
What do you mean that it takes a context?
urban knoll
hasty mountain
The generator will modify its weights in order to be able to generate images usi...
@austere swift I just feel like the random noise would have a range/boundary, like not just any set of random noise could be transformed into a cat no? Also at every epoch or whatever does the random noise change?
hasty mountain
urban knoll
<@494466018245345282> I just feel like the random noise would have a range/boun...
Oh yes, the noise will have a range, yes. People usually use a random noise got from a gaussian distribution
austere swift
urban knoll
<@494466018245345282> I just feel like the random noise would have a range/boun...
at every step the random noise changes, and it does have a range, usually 0-1
hasty mountain
That's why the noise range is so small, so it doesn't change too much and the model can adapt
urban knoll
if the random noise keeps changing then how does the generator know what range of weights it should be using at each layer? I'm having a hard time figuring out how it can adapt to inputs that keep changing. But now I think about it, since the there is small change in the input, the generator can choose weights that are a "catch all" for the range of random numbers.
am I correct in my logic?
cinder schooner
serene scaffold
<@347868773694439425> if you can take a general QA system and add a layer to mak...
how can I do this exactly?
hasty mountain
urban knoll
am I correct in my logic?
Yes
It can use the weight1 from layer 1, the weight 9 from layer 2, weight 10 from layer 3...and so on
All while trying to achieve the best loss score
cinder schooner
serene scaffold
What do you mean that it takes a context?
the general qa like this one https://huggingface.co/deepset/roberta-base-squad2 need a context besides the question.
 urban knoll
@hasty mountain what does the generator back propagate from? As in, does the GANS tell the generator "you couldn't fool the discriminator?". I know in normal CNN I get difference of what each output node is and what its supposed to be. so each output node is gonna have its own error that you can then sum up or however that works. Not sure how tit works for generator
hasty mountain
urban knoll
<@388857837222100993> what does the generator back propagate from? As in, does t...
Yes, the generator backpropagates from the discriminator
hasty mountain
urban knoll
<@388857837222100993> what does the generator back propagate from? As in, does t...
We make the discriminator classify the images generated by the generator considering the labels are all true. If he (in reality, correctly) classifies the label as false, you use the loss function to extract the gradients, but, instead of backpropagating through the Discriminator, you'll do that with the generator
You make the discriminator learn which images are true and which are false. Then you invert the classification logic to fool him, and then take its loss to get the gen's gradients
urban knoll
@hasty mountain so would you invert the loss function before back propagating?
hasty mountain
urban knoll
<@388857837222100993> so would you invert the loss function before back propagat...
No, you just use the label "True" for all images generated by the generator(false images) and pass it to the loss function
 grizzled barn
Generally speaking, how difficult would it be to create a program that reads over a users input and paraphrases it in a new, unique way? Seems like a program that would be interesting to work on
i.e input = "A giraffe can eat up to 75 pounds of Acacia leaves and hay every day" is paraphrased and returned as "A giraffe can consume up to 75 pounds of Acacia leaves and hay daily."
 dreamy rapids
would a neural net that you feed a street view image and have output lat-lon coordinates be a cool starter project?
and if so, does anybody know where i can get my hands on thousands of street view images?
they don't have to be 360 degree images but it'd be cool if they were, gives the net more data to look at
 harsh monolith
could someone help me finish a chat bot which i have been working on for the past month?dm me if intrested
odd meteor
grizzled barn
i.e input = "A giraffe can eat up to 75 pounds of Acacia leaves and hay every da...
I guess you can use spaCy to write a custom program that can do text paraphrasing. There's however Text Summarization niche in NLP which kind of almost does the same thing. https://huggingface.co/tasks/summarization
 grizzled barn
odd meteor
I guess you can use spaCy to write a custom program that can do text paraphrasin...
grizzled barn
odd meteor
I guess you can use spaCy to write a custom program that can do text paraphrasin...
Ah this is great, thanks man, Ill check it out rn
fringe anvil
hello, how come i dont get all of the years and just 2 year?

df.groupby(["year","gender"])['births'].sum().unstack().plot()
 woeful hedge

GitHub
Contribute to Zconj095/EdgeLoreScripts_Model_001 development by creating an account on GitHub.
urban knoll
hasty mountain
No, you just use the label "True" for all images generated by the generator(fals...
Now that I'm thinking about it, for a normal CNN. In a classification problem. The training data is used to get the features the groups to be classified. Then the test data is used to get the CNN to be able to correctly classify its inputs(this s where back propagation comes in) right? I was watching this video below and it wasn't made clear how initially the CNN knows how it's supposed to vote X and O. I'm talking about before any back propagation. For example, in the youtube creator's explanation, if the CNN knows its input is X, how does it know how X is supposed to map unto the output layer to even get numbers to add in to get errors in the first place? not sure if my question even makes sense https://www.youtube.com/watch?v=FmpDIaiMIeA

Part of the End-to-End Machine Learning School Course 193, How Neural Networks Work at https://e2eml.school/193
A gentle guided tour of Convolutional Neural Networks. Come lift the curtain and see how the magic is done. For slides and text, check out the accompanying blog post: http://brohrer.github.io/how_convolutional_neural_networks_work.ht...
 novel python
Hello everyone! I'm trying to compare 4 different models to the label, but the thing is that the difference is very subtle among all of them. I wanted to establish a better one, but I'm not sure what would be the best metric for that. Here are the charts comparing the 4 to the label:
Also, I know this is Tableau, but I'm dealing with the dataset in python and everything, just posted the charts in Tableau to give you a better visualization of the problem.
 hasty mountain
urban knoll
Now that I'm thinking about it, for a normal CNN. In a classification problem. ...
hasty mountain
urban knoll
Now that I'm thinking about it, for a normal CNN. In a classification problem. ...
Before any backpropagation, the CNN doesn't know anything
It'll just randomly guess an output
Try making a CNN and run it through a single epoch, for a single batch. You'll see that its output is completely random, because that's the way its weights are initialized.
haughty anvil
I need some help with sentiment analysis
I'm working with multiple documents
And for each document I have a sentiment like positive, negative, neutral, etc.
Each document is different in length of how many words it has.
How would I measure the overall sentiment of each of the documents?
For example, here's what the output could look like for one docment:
{
                                "speaker": 0,
                                "words": "thank you Thank you very much. ",
                                "sentiment": "positive",
                                "confidence": 0.34989961981773376
                            },
                            {
                                "speaker": 0,
                                "words": "Thank you.",
                                "sentiment": "positive",
                                "confidence": 0.33135706186294556
                            },
                            {
                                "speaker": 1,
                                "words": "that's the lowest. ",
                                "sentiment": "negative",
                                "confidence": 0.32402876019477844
},```So in other words, I need to discover if a document is overall positive, negative, neutral
urban knoll
hasty mountain
Before any backpropagation, the CNN doesn't know anything
what does the CNN compare it's output to initially to get errors values it can then use to back propagate?
wary crown
can someone explain this stack overflow answer i dont understand it but it fits my issue exactly
hasty mountain
urban knoll
what does the CNN compare it's output to initially to get errors values it can t...
It compares with the labels in the loss function
That's why every loss function takes as input the model's output and the labels
fringe anvil
soo, im almost there but my legend is not cooperating.
first image is my graph and 2nd is ref image
fig,ax = plt.subplots(figsize=(4,3))
df_piv = df.groupby(["year","gender"])['births'].sum().unstack()
ax.set_xlabel("year")
ax.set_ylabel("total births per year")
ax.plot(df_piv)
ax.legend(df["gender"])

 wary crown
can someone explain this stack overflow answer i dont understand it but it fits ...
wary crown
wary crown
can someone explain this stack overflow answer i dont understand it but it fits ...
can someone pls help
urban knoll
hasty mountain
It compares with the labels in the loss function
How do the filtering layers use back propagation to adapt? In the youtuber's explanaition, the filtering layers use features(sections of the input matrix or picture) to perform convolutions. Are these filter matrixes to be thought of as weights?
hasty mountain
urban knoll
How do the filtering layers use back propagation to adapt? In the youtuber's exp...
Yes. Each filter is a matrix where each item in that matrix is a weight
urban knoll
hasty mountain
Yes. Each filter is a matrix where each item in that matrix is a weight
A single node can have different weights so therefore a node in this context is the matrix being "covoluted" on right?
hasty mountain
urban knoll
A single node can have different weights so therefore a node in this context is ...
Uh... if node = neuron, then...yes, I think.
urban knoll
yes neuron
hasty mountain
But from what I've seen, the CNN there only uses neurons, so it probably flattens the input and pass everything into neuron layers
There are also convolution layers which indeed uses matrices, which are called kernels
urban knoll
thats for the last hidden layer I believe
urban knoll
hasty mountain
But from what I've seen, the CNN there only uses neurons, so it probably flatten...
I thought you said each element in a kernel is a weight? The flattened layer is just for the last hidden layer which then fully connects to output layer, no?
hasty mountain
Nah. The input is an image, right? So it has 2 dimensions.
In order to be passed through a linear/neuron layer, it has to be flattened so it only has 1 dimension. Then it goes through all the layers and, in the end, the output is reshaped to have 2 dimensions again so it can be read as an image
I thought that model from the video was using Conv2D layers, but it isn't.
urban knoll
hasty mountain
Nah. The input is an image, right? So it has 2 dimensions.
In order to be passed...
The initial input once flattened produces several different matrixes(via the different kernels used as filters), these matrixes are the neurons in the next layer? And each element in each kernel are the weights of the one single neuron in the input layer(the initial image) correct?
hasty mountain
urban knoll
The initial input once flattened produces several different matrixes(via the dif...
No, the input, once flattened, has its values passed into the neurons in the first layer
If you have an image that is 28x28, when you flatten it, you'll have 784 values. Then you pass each of those 784 values into a single neuron, forming the first layer.
urban knoll
okay so each value in the image matrix is passed as it's own neuron in first layer, and each neuron has a series of different weights which are each element of the different kernels used for convolution
I've tried looking at pictures that explai this but they confuse me
 urban knoll
yes
hasty mountain
Then yes, you'll have a matrix of weights which will multiply your input
A linear/neuron layer is a matrix multiplication in the end
urban knoll
@hasty mountain not just normal matrix multiplication,its convolution. So it still stands that each element in a kernel matrix is a weight?
hasty mountain
urban knoll
<@388857837222100993> not just normal matrix multiplication,its convolution. So ...
Yes
urban knoll
the output layer itself inthe case of the example in the video consists of 2 neurons correct? we can imagine each of the two neurons as labels?
hasty mountain
urban knoll
the output layer itself inthe case of the example in the video consists of 2 ne...
Yes. Then the neuron which has higher value will probably mean that the network outputted that class
wary crown
can someone help me interpret this stackoverflow answer
https://stackoverflow.com/questions/62689830/supported-target-types-are-binary-multiclass-got-continuous-instead

Stack Overflow
Good day, I have the following code in order to find the optimal algorithm:
models = []
models.append(('LR', LogisticRegression(solver='liblinear', multi_class='ovr')))
models.append(('LDA',
i dont know what this means
pls
help anyone?
have i been muted or something
urban knoll
hasty mountain
Yes. Then the neuron which has higher value will probably mean that the network ...
okay then it compares the output layer the CNN get with the output layer it should have gotten, gets the erros and back propagates.
if this is the case, its confusing to me how the training is actually done. lets say we have 4 categories to classify. Does the CNN train to identify for category 1, then once it has that down it then trains to classify for category 2 and so on? Or is it some mix? like image1 that goes through CNN is from category 3, the next image that goes through CNN is from category 1 and so on?
hasty mountain
urban knoll
if this is the case, its confusing to me how the training is actually done. lets...
It's more or less like a mix
People usually use one-hot encoding, transforming 4 classes into 2 classes. So, to your problem of 4 classes, your CNN will learn, for each class, to classify what is class A, and what is NOT class A. What is class B, what is NOT class B...
urban knoll
@hasty mountain do you have any good links that explain this concept? one-hot coding seems like it would only work for specific classification problems
hasty mountain
urban knoll
<@388857837222100993> do you have any good links that explain this concept? one-...
Uuuh... I don't... I use Pytorch, which focus on index-encoding...
And even in NLP I refuse to use label-encoding...
Label-encoding is more common in keras and maybe in tensorflow. But it isn't that much complicated. You'll just create subarrays of 0s and 1s from the array of labels you had before.
urban knoll
hasty mountain
Uuuh... I don't... I use Pytorch, which focus on index-encoding...
And even in N...
Hmm I have to learn pyTorch actually
what does index encoding mean?
 topaz night
is it possible to do data science with no lib on python ??
 hasty grail
topaz night
is it possible to do data science with no lib on python ??
hasty grail
topaz night
is it possible to do data science with no lib on python ??
Wdym by that? Pure Python with no libraries (apart from the standard library)?
Well, it is possible if you code it yourself...
topaz night
python coding without lib like playing in hard diffu
fossil ivy
Not sure if this is the right place to ask. I have a cumulative density function, without knowledge on any parameters of that distribution. I need to derive the probability density function.
I have found this: https://de.mathworks.com/matlabcentral/answers/83354-how-to-get-mean-and-std-from-a-known-cdf-curve
But my math skills are non-existent, could someone shed some light on what integral of v with respect to p means?

Hello,
I'm a student now doing a project associated with stats a little bit. I need to find the mean and std values from a cumulative distribution plot. The cdf plot is obtained from a documenta...
I need to derive the mean and std deviation to use in my markov chain model
 silent stump
Hi guys, in pandas does does df.iloc[index + 1] get the 2nd iteration in front of the current iteration. It seems to be doing it and i dont really get why? let us know if thats explained poorly
serene scaffold
silent stump
Hi guys, in pandas does does df.iloc[index + 1] get the 2nd iteration in front ...
why are you iterating? what are you actually trying to do?
silent stump
serene scaffold
why are you iterating? what are you actually trying to do?
im using iterrows on a dataframe of stock data, i have a few if statements in the loop, but the one thats confusing me is: if self.df.iloc[index+1]["close"] < x: do xyz for some reason its not getting the current close + 1 index , but rather the close from 2 indexes in front, i dont really understand why. I mean i can fix it by just doing self.df.iloc[index]["close"], but was wanting to understand why it was doing it. hopefully thats explained better
 proper lake
Anyone here who can help with Neural network stock sentiment analysis? I am new in data science and our professor did this for a 2 week project. Thank you. It'll be for a project.
The plan is we will use neural network for stock prediction as well as sentiment analysis on how elected president's first 100 days affect the exchange rate. Thank you
serene scaffold
silent stump
im using iterrows on a dataframe of stock data, i have a few if statements in t...
im using iterrows on a dataframe
you should avoid that as much as possible.
if you want to compare a row to rows before or after it, you should use .shift
!docs pandas.Series.shift
arctic wedgeBOT
Series.shift(periods=1, freq=None, axis=0, fill_value=None)```
Shift index by desired number of periods with an optional time freq.

When freq is not passed, shift the index without realigning the data. If freq is passed (in this case, the index must be date or datetime, or it will raise a NotImplementedError), the index will be increased using the periods and the freq. freq can be inferred when specified as “infer” as long as either freq or inferred\_freq attribute is set in the index.ah ok thanks, at one point i was debating, but just wasnt sure how i could exit a trade without iterating through
hasty mountain
urban knoll
what does index encoding mean?
It means that, instead of doing one-hot encoding, you just assign indices to your labels,
Example:
labels = ["Too cold", "Too hot", "Nice"]
index encoding would be
index-labels = [0, 1, 2]
Where 0 = "Too cold", 1 = "Too hot", 2 = "Nice"
In that case, your data could be, like, an image with the index 1. Then the neural network would receive the data and would have to output something as closest as possible to 1.
I don't know how this is done in keras/tensorflow, but in Pytorch this is mostly made by the Categorical Loss function, which already includes a softmax function.
 serene scaffold
steady basalt
Joining dark side.. becoming data engineer…
serene scaffold
steady basalt
Joining dark side.. becoming data engineer…
you signed the offer letter and everything?
serene scaffold
nice!
steady basalt
My official title hasn’t changed yet from DA to DE tho, but I’m working on getting data from the db to a dashboard with aws apis n stuff
They didn’t have any need for DS sadly, too small a company
 fresh fable
Hello everyone, so I have a matrix for determining the energies of molecular orbitals in a molecule, but these matrices have x's in them. I watched a few YouTube videos on how to evaluate the determinant of a matrix with numpy but they all have defined real number values as elements of the matrix, whereas in this case I have variables. I want to solve for all x's that satisfy a given equation from a matrix.

I'm not really sure whether this is the right channel for chemistryxmathxpython, but can someone maybe help direct me to resources which might help?
Thank you in advance.
steady basalt
Numpy docs?
 warped gate
fresh fable
Hello everyone, so I have a matrix for determining the energies of molecular orb...
warped gate
fresh fable
Hello everyone, so I have a matrix for determining the energies of molecular orb...
Maybe take a look at numpy documents, but curious to know, what are you working on exactly? Maybe you could use a framework