#data-science-and-ml
1 messages · Page 17 of 1
 steady basalt
 versed gulch
Hi, I have images that make a 3D array with each being 2d arrays stacked on top of each other i.e. (242, 512, 512) - (Number of slices, H, W). My question is how do I find out whether any of these 2D slices in the 3D array are exactly the same in Python, this is to detect if there is any repeatability/ doubling within my images.?
 gleaming ginkgo
Hi, I want to return the dataframe rows with parties who had at least two wins using pandas groupby() and filter(). Thanks for help in advance

 wooden sail
versed gulch
Hi, I have images that make a 3D array with each being 2d arrays stacked on top ...
wooden sail
versed gulch
Hi, I have images that make a 3D array with each being 2d arrays stacked on top ...
you could make a 242 x 242 array of the frobenius norm (squared) of the differences. any difference "close enough" to zero (within machine epsilon, maybe?) means two images are the same
the matrix is symmetric, but broadcasting the entire operation is probably faster than indexing and looping unless you jit the loop
versed gulch
wooden sail
you could make a 242 x 242 array of the frobenius norm (squared) of the differen...
The images are or 512x512, but what I mean is that python may detect that slice number 5 is the same as lets say slice 95 (the arrays)
wooden sail
yes, i know
what i suggested is to compute the pairwise difference between all pairs of the 242 images
versed gulch
wooden sail
what i suggested is to compute the pairwise difference between all pairs of the ...
okay pairwise difference would make sense
gleaming ginkgo
gleaming ginkgo
Hi, I want to return the dataframe rows with parties who had at least two wins u...
I managed to get count of each parties win, but how do I return rows where party has won atleast twice?
 versed gulch
wooden sail
what i suggested is to compute the pairwise difference between all pairs of the ...
versed gulch
wooden sail
what i suggested is to compute the pairwise difference between all pairs of the ...
but how would I do this as I don't want it to be pairwise with the consecutive array but with all of the slices
wooden sail
for example like this
In [7]: import numpy as np

In [8]: images = np.random.rand(4,5,5)

In [9]: images[1,:,:] = images[0,:,:]

In [10]: images[3,:,:] = images[2,:,:]

In [11]: reshaped = images.reshape(4,25,order='F')

In [12]: differences = np.sum((reshaped[:,np.newaxis,:] - reshaped[np.newaxis,:,:])**2, axis=2)

In [13]: differences
Out[13]:
array([[0.        , 0.        , 2.22189616, 2.22189616],
       [0.        , 0.        , 2.22189616, 2.22189616],
       [2.22189616, 2.22189616, 0.        , 0.        ],
       [2.22189616, 2.22189616, 0.        , 0.        ]])
we expect 0s in the main diagonal and everything else nonzero
but by construction i made image 1 equal to image 0, and similarly with 2 and 3. we see this in the matrix as the zero elements off the diagonal
at coords (0,1) and also (1,0) due to the symmetry of the computation, and similarly for 2 and 3
you only need to compute either the upper or lower triangular part of the matrix, you can decide whether to loop or just accept the extra memory cost 😛
versed gulch
hmm okay ill see what happens
wooden sail
there was no need to reshape btw, i just forget if one can sum over 2 axis at the same time. let me read the docs
ah you can
one sec
 static mesa
Also thank you for the help
wooden sail
In [10]: import numpy as np

In [11]: images = np.random.rand(4,5,5)

In [12]: images[0,:,:] = images[3,:,:]

In [13]: images[1,:,:] = images[2,:,:]

In [14]: differences = np.sum((images[:,np.newaxis,:,:] - images[np.newaxis,:,:,:])**2, axis=(2,3))

In [15]: differences
Out[15]:
array([[0.        , 4.41873327, 4.41873327, 0.        ],
       [4.41873327, 0.        , 0.        , 4.41873327],
       [4.41873327, 0.        , 0.        , 4.41873327],
       [0.        , 4.41873327, 4.41873327, 0.        ]])
there we go. i changed the pattern, because why not
static mesa
gleaming ginkgo
I managed to get count of each parties win, but how do I return rows where party...
sent you a message
versed gulch
wooden sail
for example like this
Would this also be a feasible solution?
for dcvld_tile_path in dcvld_tile_paths:
  tile_arr = io.imread(dcvld_tile_path)
  for i in range(tile_arr.shape[0]):
    for j in range(tile_arr.shape[0]):
      if (np.array_equal(tile_arr[i, :, :], tile_arr[j, :, :])) & (i != j):
        print(dcvld_tile_path)
        print(i + 1, j + 1)
certainly, yes. if you're doing it this way btw, you can compute just the upper triangular portion
for j in range(i, tile_arr.shape[0]) will do this
saves you roughly half of the iterations
also keep in mind that floating point arithmetic means stuff that should be equal may not be equal
that's why i had used a sum of squares instead of using array equal
you could use an inequality and an epsilon
actually i think for j in range (i+1, tile_arr.shape[0]) allows you to remove the &(i!=j) as well
versed gulch
wooden sail
also keep in mind that floating point arithmetic means stuff that should be equa...
unless I round the numbers to at least lets say 4dp?
versed gulch
wooden sail
certainly, yes. if you're doing it this way btw, you can compute just the upper ...
the image is very scarce i.e. the parts where it does appear is near the centre or some of the edges and they are vessels so not sure if i should do this
wooden sail
no, that's not what i mean
what i mean is that when you do this pairwise comparison, you compare image a to image b, but also image b to image a
equivalence is symmetric
if a = b, then b = a, so there is no need to check both
consider we have images a b c and d
then we want to compare a to b, c, and d
then b to c and d
c to d
and then we are done. all the other options are symmetric and there is no need to compute them

this is what i mean. if we have K images of size M x N, then the comparisons form a matrix of size K x K
but the main diagonal is all True, the images are equal to themselves. then we are left with the upper and lower triangular parts. these are equal to each other due to symmetric, so we only need half of them
this has nothing to do with the content of the images. the images are being taken in their entirety
versed gulch
wooden sail
actually i think for j in range (i+1, tile_arr.shape[0]) allows you to remove th...
but if i was 1 then we miss the 0th slice for but obv skip 1 (idx)
wooden sail
what?
that's the whole point
you WANT to skip that
ah i see what you mean now, that was me being dumb
versed gulch
yh but we dont skip 0 for j
wooden sail
that's my bad, yeah, that won't work
but the one without the +1 and using the & should work
versed gulch
yh if we have a separate if statement before that this would filter out the i==j part
skips extra comparison
wooden sail
wait wait
i think i had it right, let's check
In [16]: for i in range(5):
    ...:     for j in range(i+1,5):
    ...:         print((i,j),end='')
    ...:     print()
    ...:
(0, 1)(0, 2)(0, 3)(0, 4)
(1, 2)(1, 3)(1, 4)
(2, 3)(2, 4)
(3, 4)
yeah this is exactly what you want
you want to skip it due to symmetry. this computes only the upper triangular and requires no ifs, which can slow you down as the number of images increases (though big O hides this)
all the missing combinations are either 0 or symmetric
 desert oar
and maybe https://docs.python.org/3/library/itertools.html#itertools.combinations as in combinations(range(n), 2)
wooden sail
very nice, i wasn't aware of pdist
on the other hand, many of the offered distances involve square roots, which aren't needed here
 maiden sable
we call it "fracciones parciales" here, and it makes sense for a certain value of a and b
 novel python
Hihi guys, not sure if that's the correct channel for it, but since I'm dealing with data I thought it was the right fit.
I'm scraping some data and dumping into a .txt file, the .txt looks like this:

I need to place it into an excel file that looks like this:

I tried a few things, but couldn't really find a solution for it. Any of you got an idea what would be a good approach for it?
 violet gull
If new weight = old weight - learning rate * (derivative of error function with respect to the weight)
Assuming only 1 layer
If I add another layer, what is the equation for just one weight in the first layer using chain rule?
Ping or dm with response
 gusty wedge

How do I achieve the highlighted things in matplotlib? What are they even called in docs? X and y label on sides and arrow heads on line?
static mesa
novel python
Hihi guys, not sure if that's the correct channel for it, but since I'm dealing ...
sent you a message
 serene plume
def l2_norm(matrix):
  return matrix / (matrix**2).sum(axis=1, keepdims=True)**.5

def cosine_sim(m, n):
  return np.matmul(l2_norm(m), l2_norm(n).T))
This is how I implemented cosine_sim for 2 matrics. It works.
Would you write it differently? Can I make it more efficient?
versed gulch
wooden sail
```py
In [16]: for i in range(5):
...: for j in range(i+1,5):
...: ...
wait so this avoids things like (2, 3) and (3, 2) and only gives (2, 3), and obv (1, 1) etc?
 lapis sequoia
Does anyone know if I can see other peoples' submissions on Kaggle? I want to compare the methods they're using to what I'm doing
 iron basalt
serene plume
```py
def l2_norm(matrix):
return matrix / (matrix**2).sum(axis=1, keepdims=Tr...
iron basalt
serene plume
```py
def l2_norm(matrix):
return matrix / (matrix**2).sum(axis=1, keepdims=Tr...
np.linalg.norm
 glad raft
i have a dataframe with a few million entries.
the columns are something like ['id', 'mol', 'radius', 'mass', 'x', 'y', 'z']
I would like to use a kdtree to find the 'mol' entry of the three closest points ell2 in x,y,z using kdtree's nearest neighbor.
Is there a way to build a kdtree around the dataframe of do i have to pull the x,y,z coordinates, make the kdtree, and the use the row index of the closest points in the original dataframe?
 serene scaffold
glad raft
i have a dataframe with a few million entries.
the columns are something like `...
serene plume
iron basalt
`np.linalg.norm`
serene scaffold
glad raft
i have a dataframe with a few million entries.
the columns are something like `...
serene plume
iron basalt
`np.linalg.norm`
Was aware of it, but for some reason they abs the ndarray before squaring it :/ That's additional work
iron basalt
serene plume
Was aware of it, but for some reason they `abs` the ndarray before squaring it :...
Takes about the same amount of time.
>>> abs(1j)
1.0
they take the abs so that it works on complex numbers too. your func is only for real-valued matrices
 dawn dune
hi, hi, how can i convert h0 to fix this error: Expected hidden[0] size (1, 13, 128), got [13, 128]? Not entirely sure how to see the type that they are expecting
serene scaffold
dawn dune
hi, hi, how can i convert h0 to fix this error: Expected hidden[0] size (1, 13, ...
you can just reshape that array/tensor to (13, 128)
or the other way around, I mean
you're just wrapping the whole thing in an extra dimension. it's like going from [[1, 2], [3, 4]] to [[[1, 2], [3, 4]]]
dawn dune
okay thanks
desert oar
novel python
I need to place it into an excel file that looks like this:
you can use the pandas library to construct a "data frame" and export that to excel
dawn dune
serene scaffold
you can just reshape that array/tensor to `(13, 128)`
That being said
print("entered")
print(h0.shape)
seq_embed = self.embed(seq)
#May have to unsqueeze h0 here as combination
output, (h,c) = self.lstm(seq_embed, h0)```
yields ```
entered
torch.Size([1, 13, 128])```
before it breaks with the same error even though I haven't changed the dimensions of h0 burnt falcon
I'd like to store a 2d numpy array of random shape into a 2d container.
Example code,
for arg_1 in range(3,6):
  for arg_2 in range(10,16):
    my_out = myFunc(arg_1,arg_2)
    my_container[arg_1][arg_2] = my_out

#what I want: my_container[4,6] --> [[1,2,3],[23,24,25]]
I want to be able to do operatons on the 2d array for a specfic pair of arguments
arg_1 and arg_2 are positive non-zero integers
serene plume
iron basalt
```py
>>> abs(1j)
1.0
```
Hm...what's the j? Does it mean complex?
burnt falcon
I'm thinking since the indexing is not contiguous that I should use a dict of dict? but I can't seem to find a good solution online or myself. I've spent an hour on this now
serene plume
wooden sail
they take the abs so that it works on complex numbers too. your func is only for...
I see. If your use case only involved real-valued matrices and this calc is in a hot loop, would you still use linalg.norm despite the redundant abs?
dawn dune
Heyo, when you have a sec, is there a difference between sizes [1,13,128] and (1,13,128) and if so how do I convert between the 2?🤔
iron basalt
serene plume
Hm...what's the `j`? Does it mean complex?
Yes.
>>> abs(1 + 1j)
1.4142135623730951
should be the same in numpy, torch, etc.
dawn dune
dawn dune
That being said
``` h0 = h0.view(h0.size())
print("entered")
...
Okay the reason I ask is in relation to the above message and the error message is two messages above that. I don’t understand how it is wrong/breaks as you can literally see me printing the dimensions
wooden sail
serene plume
I see. If your use case only involved real-valued matrices and this calc is in a...
yeah, i would expect it to be slightly faster anyway. you can try timing it yourself
gusty wedge
gusty wedge
How do I achieve the highlighted things in matplotlib? What are they even called...
.
gusty wedge
iron basalt
https://matplotlib.org/stable/tutorials/text/annotations.html
the docs shows how to add arrows independently and not how to add arrowheads on the line plot
or I think I am unable to understand correctly
import matplotlib.pyplot as plt
import matplotlib as mpl

x = [-4, -3, 0, 3, 4]
y = [-4, -2, 0, 2, 3]

fig, ax = plt.subplots()
ax.plot(x, y,
        linestyle='solid', linewidth=3, color='blue',
        marker='o', markerfacecolor='blue', markersize=6, markeredgecolor='blue'
        )
ax.set_xlim([-5, 5])
ax.set_ylim([-5, 5])

ax.set_xticks([-5, -4, -3, -2, -1, 0, 1, 2, 3, 4, 5],
              ['-5', '-4', '-3', '-2', '-1', '', '1', '2', '3', '4', '5'])
ax.set_yticks([-5, -4, -3, -2, -1, 0, 1, 2, 3, 4, 5],
              ['-5', '-4', '-3', '-2', '-1', '', '1', '2', '3', '4', '5'])

ax.spines[['left', 'bottom']].set_position(("data", 0))
ax.spines[['top', 'right']].set_visible(False)

# draw arrows on x and y axis
ax.plot(1, 0, ">k", transform=ax.get_yaxis_transform(), clip_on=False)
ax.plot(0, 1, "^k", transform=ax.get_xaxis_transform(), clip_on=False)

#
plt.show()
As you can see this is my lineplot and I want to add arrow on both ends of my line
iron basalt
gusty wedge
the docs shows how to add arrows independently and not how to add arrowheads on ...
import matplotlib.pyplot as plt

x = [0, 1, 2, 3, 4]
y = [0, 1, 2, 3, 4]

line, = plt.plot(x, y)

line.axes.annotate("", xytext=(x[0], y[0]), xy=(x[0]-0.1, y[0]-0.1), arrowprops=dict(arrowstyle="-|>", edgecolor=line.get_color()), size=30)
line.axes.annotate("", xytext=(x[-1], y[-1]), xy=(x[-1]+0.1, y[-1]+0.1), arrowprops=dict(arrowstyle="-|>", edgecolor=line.get_color()), size=30)

plt.show()
thanks a lot
 compact valley
I am not Data Scientist but I have question if anyone truly is.
I need data on specific market and that is oil on canvas paintings bought by women age 22-60 to determine which type of oil paintings sold most.
I don't need you to do a job for me or anything just asking for your perspective how would you tackle this problem online
 hoary wigeon
Doubt regarding NLTK, I'm doing title clustering.
Where title are like..
"Senior Big Data Engineer",
"Sr. Big Data Engineer",
"Sr Big Data Engineer",
Here, Senior, Sr and Sr. means same. How to achieve this using nltk?
lapis sequoia
I have a folder of cats and dogs images that I have imported into an array but I need to create a labeling vector. Do anyone know how to extract the labeling of the images? For example, one picture is named "Cat.15.jpg", I want to take the index of that image and set for example the name Cat = 1 in my labeling vector
hoary wigeon
just get the name of image name.
class = name.split('.')[0].lower()
if class == "cat":
   return 1
return 0
 fast slate
Can someone share some resources / techniques how to deal with time series data for ML model making ?
I just know, we can split date into separate parts like day, month and year by feature engineering.
But I want to know what more we can do
Your help will be appreciated
hoary wigeon
fast slate
Can someone share some resources / techniques how to deal with time series data ...
week of month
quarters,
fast slate
ok nice!
any list you have ?
hoary wigeon
time to end of month, end of quarters, etc
lapis sequoia
hoary wigeon
just get the name of image `name`.
```py
class = name.split('.')[0].lower()
if c...
But I have to loop through my folder and set it for each and every image. This works for one image:
y_labels = []
image = Image.open('cat.15.jpg')
print("Filename: ", image.filename)
if 'cat' in image.filename:
y_labels.append(1)
else:
y_labels.append(0)
plt.imshow(image), y_labels
This is how im importing atm:
hoary wigeon
while reading every image, start storing labels in an array.
lapis sequoia
img_size = 100
training_data = []
training_labels = []
for filename in os.listdir('train'):
img = cv2.imread(os.path.join('train',filename))
img = cv2.resize(img, (img_size, img_size))
if img is not None:
training_data.append(img)
How do I store the label after my imread?
lapis sequoia
lapis sequoia
y_labels = []
image = Image.open('cat.15.jpg')
print("Filename: ", image.filenam...
I use Image from PIL in this method
hoary wigeon
target = []
for filename in os.listdir('train'):
    img = cv2.imread(os.path.join('train',filename))
    img = cv2.resize(img, (img_size, img_size))
    if img is not None:
        training_data.append(img)
        target.append(1 if 'cat' in image.filename.lower() else 0)
Whats "image" on the last row?
u mean img?
hoary wigeon
oops. yes
I copied it from your code if 'cat' in image.filename:
use filename.lower()
lapis sequoia
Thanks alot @hoary wigeon , now everything works!
lapis sequoia
Do anyone know where in a CNN network its most optimale to use dropout layers? I read that using dropout layers within the dense layers a value of 0.5 could be good but much lower for within the convolutional layers, at approx 0.1 or 0.2
 craggy shadow
Can someone please explain this code to me thoroughly in very simple and basic terms regarding random sample imputation of NAN values? Especially what the last 2 lines are doing, i understand the first 2 lines pretty easily, just creating the new columns, its just the ones below that im having trouble understanding
def impute_nan(df,variable,median):
    df[variable+"_median"]=df[variable].fillna(median)
    df[variable+"_random"]=df[variable]
    ##It will have the random sample to fill the na
    random_sample=df[variable].dropna().sample(df[variable].isnull().sum(),random_state=0)
    ##pandas need to have same index in order to merge the dataset
    random_sample.index=df[df[variable].isnull()].index
df.loc[df[variable].isnull(),variable+'_random']=random_sample```If new weight = old weight - learning rate * (derivative of error function with respect to the weight)
Assuming only 1 layer
If I add another layer, what is the equation for just one weight in the first layer using chain rule?
Ping or dm with response
hoary wigeon
craggy shadow
Can someone please explain this code to me thoroughly in very simple and basic t...
let's parse this line
random_sample = df[variable].dropna().sample(df[variable].isnull().sum(),random_state=0)
getting the count of null records : df[variable].isnull().sum()
Suppose we get 10 missing rows above
Below code will generate 10 records
df[variable].dropna().sample(using_count_to_generate_those_number_of_record, random_state=0)
storing those many sampled record in random_sample
replacing the null value in df with the sampled record random_sample
Can someone help with this? Those word has same meaning.


I want a similar root word.
craggy shadow
@hoary wigeon Thanks!! Can you explain the last 2 as well the same way
 cobalt socket
yea that makes sense so do i
guess i meant, like a site where you can paste in code, and the output is a explanation of each line of code, explaining the operators etc
serene plume
wooden sail
yeah, i would expect it to be slightly faster anyway. you can try timing it your...
Apparently mine is faster?
#bot-commands message
violet gull
If new weight = old weight - learning rate * (derivative of error function with respect to the weight)
Assuming only 1 layer
If I add another layer, what is the equation for just one weight in the first layer using chain rule?
Ping or dm with response
i can’t find anything that says it clearly online and I’ve been asking it here for days now
lapis sequoia
Does anyone know any active Discord servers for Kaggle?
cobalt socket
lapis sequoia
Does anyone know any active Discord servers for Kaggle?
don't think they have any?
wooden sail
serene plume
Apparently mine is faster?
https://discord.com/channels/267624335836053506/26765...
timeit is only relevant if you run it on the same device. i'm using a shitty laptop. you can run bad code on great hardware and have it perform better than good code on old hardware
 tawny gyro
if you make analytical calculation, you will have a=5 and b=3.
 zenith briar
i like neural networks
 vale hinge
Let’s say dataframe A is:
Name - Color - Food
Bob - Red - None
Joe - Blue - None
And Dataframe B is:
Name - Color - Food
Bob - Red - Apples
How can I merge Dataframe B into Dataframe A and have it overwrite the “none” with “Apples”?
serene plume
wooden sail
timeit is only relevant if you run it on the same device. i'm using a shitty lap...
Right...What was your intuition behind betting on np.linalg.norm being faster?
desert oar
vale hinge
Let’s say dataframe A is:
```
Name - Color - Food
Bob - Red - None
Joe - Blue - ...
which combination of fields uniquely identifies each row?
serene plume
@wooden sail Also, on my machine ( i7-9700 cpu)
python3 -m timeit -n 1000 'import numpy as np; [(np.random.rand(3,3)**2).sum(axis=1, keepdims=True)**.5 for _ in range(1000)]'
1000 loops, best of 5: 4.23 msec per loop
python3 -m timeit -n 1000 'import numpy as np; [np.linalg.norm(np.random.rand(3,3), axis=1, keepdims=True) for _ in range(1000)]'
1000 loops, best of 5: 6.41 msec per loop
I really wanted np.linalg.norm to be faster because I'd prefer using a trusted packaged logic rather than typing it out 😕
wooden sail
serene plume
<@467435887236612106> Also, on my machine ( i7-9700 cpu)
```
python3 -m timeit -...
i meant with abs in there as well. my thinking was that hopefully the looping and function composition was done more cleverly in the backend than if one calls sum(abs(x) ** 2), since it would all be compiled in a single lower level call
serene plume
With the abs
python3 -m timeit -n 1000 'import numpy as np; [(np.abs(np.random.rand(3,3))**2).sum(axis=1, keepdims=True)**.5 for _ in range(1000)]'
1000 loops, best of 5: 4.57 msec per loop
A bit slower than without, but still faster than calling linalg.norm 😦
Apparently this is what they do https://github.com/numpy/numpy/blob/main/numpy/linalg/linalg.py#L2555-L2556
 arctic wedgeBOT
numpy/linalg/linalg.py lines 2555 to 2556
s = (x.conj() * x).real
return sqrt(add.reduce(s, axis=axis, keepdims=keepdims))```🤷♂️
 haughty marsh
when you input data in a batch, do you normalize data per batch or normalize for all data?
desert oar
wooden sail
half of the computations are not needed lol
yeah sometimes when you dig into numpy you find that they are actually doing a lot more work than your hand-written version, because they are coving a lot more use cases
sometimes you can beat numpy with a purpose-made alternative in numba. and other times (like here) numpy just internally uses whatever you'd have written anyway, but with 100 lines of prep and validation checks
wooden sail
desert oar
yeah sometimes when you dig into numpy you find that they are actually doing *a ...
that's certainly expected, but even here, if they were going to take the real part, you can compute it explicitly by squaring the real and imaginary parts separately instead of multiplying x by x conjugate and taking the real part. that product has 2x as many multiplications, half of which they don't even use!
it's just careless 😛
desert oar
maybe it's a missed optimization opportunity!
can't expect everything to be perfect. these libraries only become well-tuned over time because lots of "people who know what they're doing" end up looking over the source and submitting patches
wooden sail
maybe i should reach out
desert oar
yeah can't hurt to make a mailing list thread or whatever numpy uses
serene plume
wooden sail
maybe i should reach out
Please post a link if you do 🙂
They just invite you to fork and submit a PR
Also, didn't know about Numba, TIL
wooden sail
numba is pretty nice. you should also look into jax
serene plume
wooden sail
that's certainly expected, but even here, if they were going to take the real pa...
return sqrt(add.reduce(s.real**2, axis=axis, keepdims=keepdims))
Is this what you had in mind?
wooden sail
that's also not right
it would be s.real**2 + s.imag**2
recall for a complex number z, z * z.conj = real(z)^2 + imag(z)^2
the other 2 terms in the product z * z.conj cancel out
serene plume
Oh I see. So basically:
s = (x.real**2 + x.imag**2).real
But that .real means they only take the x.real**2 part of that expression anyway, no?
wooden sail
no
you don't need the last .real there
x.real and x.imag are both real
.latex quick test $\imath$
 strange elbowBOT
 wooden sail
ok
.latex recall that if we have $z = a + \imath b$ with $z \in \mathbb{C}$ and $a,b \in \mathbb{R}$, then
[
z z^* = (a + \imath b) (a - \imath b) = a^2 + \imath a b - \imath a b - \imath^2 b^2 = a^2 + b^2
]
strange elbowBOT
 wooden sail
hence the two products in the middle need not even be computed in the first place
these guys are computing them, and then noticing that due to floating point accuracy issues, those terms don't exactly cancel out, so they also call .real at the end
 worthy hollow
hey there
anyone know if its possible to do and how to make a dataframe matrix like this?```excel
307 308 309 310 311 312 313 314 315 316 317 318 319 320 321 322 323 324 325
306 241 242 243 244 245 246 247 248 249 250 251 252 253 254 255 256 257 326
305 240 183 184 185 186 187 188 189 190 191 192 193 194 195 196 197 258 327
304 239 182 133 134 135 136 137 138 139 140 141 142 143 144 145 198 259 328
303 238 181 132 91 92 93 94 95 96 97 98 99 100 101 146 199 260 329
302 237 180 131 90 57 58 59 60 61 62 63 64 65 102 147 200 261 330
301 236 179 130 89 56 31 32 33 34 35 36 37 66 103 148 201 262 331
300 235 178 129 88 55 30 13 14 15 16 17 38 67 104 149 202 263 332
299 234 177 128 87 54 29 12 3 4 5 18 39 68 105 150 203 264 333
298 233 176 127 86 53 28 11 2 1 6 19 40 69 106 151 204 265 334
297 232 175 126 85 52 27 10 9 8 7 20 41 70 107 152 205 266 335
296 231 174 125 84 51 26 25 24 23 22 21 42 71 108 153 206 267 336
295 230 173 124 83 50 49 48 47 46 45 44 43 72 109 154 207 268 337
294 229 172 123 82 81 80 79 78 77 76 75 74 73 110 155 208 269 338
293 228 171 122 121 120 119 118 117 116 115 114 113 112 111 156 209 270 339
292 227 170 169 168 167 166 165 164 163 162 161 160 159 158 157 210 271 340
291 226 225 224 223 222 221 220 219 218 217 216 215 214 213 212 211 272 341
290 289 288 287 286 285 284 283 282 281 280 279 278 277 276 275 274 273 342
361 360 359 358 357 356 355 354 353 352 351 350 349 348 347 346 345 344 343

i've searched online on internet and haven't found a way
thing is i want to have this dataframe (it is a degrees calculator, it got 360 numbers)
work with a dataframe i already have py Date Earth Mer Ven Mar Jup Sat Ura Nep Plu 14/09/2022 351.5 322.88 147.06 29.11 2.55 322.85 46.28 354.01 297.62
i want to plot those date planets on their specific degrees
like this :

is it doable on python? never came across something alike
on internet
serene plume
wooden sail
these guys are computing them, and then noticing that due to floating point accu...
Huh, interesting insight! So, iiuc, they use the canonical form zz* but not its final resolved version which is more computationally efficient since it's just a**2 + b**2 from a + ib
wooden sail
precisely
serene plume
Then
return sqrt(add.reduce(s.real**2 + s.imag**2, axis=axis, keepdims=keepdims))
Awesome. Thank you 🙂
Is it ok if I submit the PR or do you plan on doing it?
I think you should, it's my problem but it's your fix
But if you're not gonna, someone needs to 😛
wooden sail
i'll give it a shot
serene plume
Awesome 🙂
wooden sail
let's time it first though
!e
import timeit
import numpy as np
x = np.random.rand(1000) + 1j*np.random.rand(1000)

%%timeit
np.sqrt(np.sum(x.conj()*x))

%%
np.sqrt(np.sum(x.real**2 + x.imag**2))
meh
worthy hollow
worthy hollow
hey there
**anyone know if its possible to do and how to make a dataframe matri...
anyone?
desert oar
worthy hollow
hey there
**anyone know if its possible to do and how to make a dataframe matri...
it should be possible, but seems a little unwieldy. you'll need to come up with some kind of algorithm for populating this array and setting values within it
serene plume
python3 -m timeit -n 1000 'import numpy as np; x = np.random.rand(1000) + 1j*np.random.rand(1000); [np.sqrt(np.sum(x.conj()*x.real)) for _ in range(1000)]'
1000 loops, best of 5: 8.81 msec per loop
 python3 -m timeit -n 1000 'import numpy as np; x = np.random.rand(1000) + 1j*np.random.rand(1000); [np.sqrt(np.sum(x.real**2 + x.imag**2)) for _ in range(1000)]'
1000 loops, best of 5: 7.35 msec per loop
🙂
wooden sail
i was running it locally too and got similar results, cool
serene plume
Awesome
worthy hollow
desert oar
it should be possible, but seems a little unwieldy. you'll need to come up with ...
ahh I'm in beautiful sheets :(, seems more complicated that i thought
wooden sail
is there any special reason you want that data structure?
the matrix can be built as a flavor of a spiral matrix
worthy hollow
wooden sail
is there any special reason you want that data structure?
yeah to display it in my main page
on my webapp

this is fairly important for me and the visualisation/use of the interface
wooden sail
all right. as i said, a spiral matrix
here are some examples https://stackoverflow.com/questions/36834505/creating-a-spiral-array-in-python you can make modifications as needed
worthy hollow
ok thanks a lot @wooden sail !!!
i found this code:
!e
import pandas as pd
import numpy as np

#!/usr/bin/env python
NORTH, S, W, E = (0, -1), (0, 1), (-1, 0), (1, 0) # directions
turn_right = {S: W, W: NORTH, NORTH: E, E: S} # old -> new direction

def spiral(width, height):
    if width < 1 or height < 1:
        raise ValueError
    x, y = width // 2, height // 2 # start near the center
    dx, dy = NORTH # initial direction
    matrix = [[None] * width for _ in range(height)]
    count = 0
    while True:
        count += 1
        matrix[y][x] = count # visit
        # try to turn right
        new_dx, new_dy = turn_right[dx,dy]
        new_x, new_y = x + new_dx, y + new_dy
        if (0 <= new_x < width and 0 <= new_y < height and
            matrix[new_y][new_x] is None): # can turn right
            x, y = new_x, new_y
            dx, dy = new_dx, new_dy
        else: # try to move straight
            x, y = x + dx, y + dy
            if not (0 <= x < width and 0 <= y < height):
                return matrix # nowhere to go

def print_matrix(matrix):
    width = len(str(max(el for row in matrix for el in row if el is not None)))
    fmt = "{:0%dd}" % width
    for row in matrix:
        print(" ".join("_"*width if el is None else fmt.format(el) for el in row))

print_matrix(spiral(19,20))```
@worthy hollow :white_check_mark: Your 3.11 eval job has completed with return code 0.
001 | ___ ___ ___ ___ ___ ___ ___ ___ ___ ___ ___ ___ ___ ___ ___ ___ ___ ___ ___
002 | 343 344 345 346 347 348 349 350 351 352 353 354 355 356 357 358 359 360 361
003 | 342 273 274 275 276 277 278 279 280 281 282 283 284 285 286 287 288 289 290
004 | 341 272 211 212 213 214 215 216 217 218 219 220 221 222 223 224 225 226 291
005 | 340 271 210 157 158 159 160 161 162 163 164 165 166 167 168 169 170 227 292
006 | 339 270 209 156 111 112 113 114 115 116 117 118 119 120 121 122 171 228 293
007 | 338 269 208 155 110 073 074 075 076 077 078 079 080 081 082 123 172 229 294
008 | 337 268 207 154 109 072 043 044 045 046 047 048 049 050 083 124 173 230 295
009 | 336 267 206 153 108 071 042 021 022 023 024 025 026 051 084 125 174 231 296
010 | 335 266 205 152 107 070 041 020 007 008 009 010 027 052 085 126 175 232 297
011 | 334 265 204 151 106 069 040 019 006 001 002 011 028 053 086 127 176 233 298
... (truncated - too many lines)
Full output: https://paste.pythondiscord.com/kubimitiro.txt?noredirect
worthy hollow
worthy hollow
how can i turn "print_matrix" output into a working dataframe or idk working numpy matrix where i can input the planets at their specific degree as here in the quoted message
also how could i color the background of those cells

like this:

 zinc obsidian
hey guys, i need help in object detection. i already trained my YOLO model, but when calling the weights im getting:
 iron basalt
worthy hollow
how can i turn "print_matrix" output into a working dataframe or idk working num...
iron basalt
worthy hollow
how can i turn "print_matrix" output into a working dataframe or idk working num...
import matplotlib.pyplot as plt
from matplotlib.patches import Rectangle as Rect
import numpy as np

x = np.arange(100).reshape((10, 10))

cell_text = []
cell_colours = []
for i in range(10):
    cell_text.append([])
    cell_colours.append([])
    for j in range(10):
        cell_text[i].append(str(x[i, j]))
        if i == j or i == 9 - j:
            cell_colours[i].append("red")
        else:
            cell_colours[i].append("none")

fig, ax = plt.subplots()

ax.get_xaxis().set_visible(False)
ax.get_yaxis().set_visible(False)
ax.axes.spines["left"].set_color(None)
ax.axes.spines["right"].set_color(None)
ax.axes.spines["top"].set_color(None)
ax.axes.spines["bottom"].set_color(None)
#ax.set_aspect("equal")

table = plt.table(cellText=cell_text, cellColours=cell_colours, cellLoc="center", bbox=[0, 0, 1, 1])

for k, v in table._cells.items():
    v.set_edgecolor((0.7, 0.7, 0.7))

for i in range(10):
    ax.add_patch(Rect((0.5-0.1*i, 0.5-0.1*i), 0.2*i, 0.2*i, facecolor="none", edgecolor="black", lw=1.5))

plt.show()
Since your image is square you may also want to make the aspect ratio square with ax.set_aspect("equal").
wooden sail
serene plume
Awesome
have you ever submitted pull requests to numpy? or anyone else, for that matter :x
gusty wedge

I have this book and it has a lot of graphics like this, I wonder if its possible to make such in matplotlib, if not is there any other python library which can do this
Also It should have support to export to latex
Not using tikz latex because takes a lot time and poor docs
 mossy whale
gusty wedge
I have this book and it has a lot of graphics like this, I wonder if its possibl...
mossy whale
gusty wedge
I have this book and it has a lot of graphics like this, I wonder if its possibl...
Looks feasible, have you looked at https://matplotlib.org/stable/tutorials/text/annotations.html and https://matplotlib.org/stable/gallery/text_labels_and_annotations/annotation_demo.html ?
gusty wedge
mossy whale
Looks feasible, have you looked at https://matplotlib.org/stable/tutorials/text/...
I am not so good at docs (still beginner), is there any tutorial, book you can recommend
desert oar
wooden sail
have you ever submitted pull requests to numpy? or anyone else, for that matter ...
they probably have a contributor guide.. usually you just have to take the plunge and post on a mailing list, or their issue tracker (github?), with your implementation and at least a few basic tests if it needs new tests
gusty wedge
mossy whale
Looks feasible, have you looked at https://matplotlib.org/stable/tutorials/text/...
I saw, not understood much
wooden sail
desert oar
they probably have a contributor guide.. usually you just have to take the plung...
yeah i'm trying to follow the guide, but in true meme fashion, nothing works
desert oar
wooden sail
yeah i'm trying to follow the guide, but in true meme fashion, nothing works
lol, what's the issue?
wooden sail
trying to run the tests but i get weird errors before the code even runs. versioneer outputting weird stuff
desert oar
gusty wedge
I saw, not understood much
then move on to the "intermediate" tutorials https://matplotlib.org/stable/tutorials/index.html#intermediate
and backtrack to the "introductory" ones as needed https://matplotlib.org/stable/tutorials/index.html#introductory
gusty wedge
Thnx
wooden sail
i've cloned the repo, made a new branch, and made some changes. when trying to run the tests, i get
Building, see build.log...
Traceback (most recent call last):
  File "C:\Users\eduar\Documents\numpy\setup.py", line 64, in <module>
    raise RuntimeError(f'Cannot parse version {FULLVERSION}')
RuntimeError: Cannot parse version 0+untagged.30465.g5f94eb8

Build failed!
where versioneer is reading the version of something and what it outputs is not valid (it should output a valid numpy version)
trying to set up a conda environment following the procedure in their contributor docs also doesn't work
mossy whale
gusty wedge
I am not so good at docs (still beginner), is there any tutorial, book you can r...
@desert oar suggestions are good to get more familiar with mpl. Otherwise the first link is a tutorial, and you could also look at https://jakevdp.github.io/PythonDataScienceHandbook/ , chapter 4 Text and annotations. But good idea to cover basics first
desert oar
wooden sail
i've cloned the repo, made a new branch, and made some changes. when trying to r...
oof... maybe try checking out a tagged commit?
desert oar
mossy whale
<@389497659087650836> suggestions are good to get more familiar with mpl. Other...
chapter 4 looks like a good adjunct to the matplotlib tutorials, it's more focused and directed. but i recommend working through both if you have the time
gusty wedge
desert oar
chapter 4 looks like a good adjunct to the matplotlib tutorials, it's more focus...
I will, i have a lot of time😅
gusty wedge
mossy whale
<@389497659087650836> suggestions are good to get more familiar with mpl. Other...
Does the book require extensive math knowledge if I plan on reading the whole book?
mossy whale
gusty wedge
Does the book require extensive math knowledge if I plan on reading the whole bo...
Can't say, haven't read it all. Another thing to keep in mind is that the book (and many other books as well) can get dated when it comes to code examples. Packages develop fast and breaking changes are common. That's where the official tutorials of packages, like @desert oar linked to for matplotlib but also packages like pandas have an advantage that they are up to date. There might be newer books out there, free or paid, covering the same topics - so worth doing some searching yourself as well. Good luck!
gusty wedge
mossy whale
Can't say, haven't read it all. Another thing to keep in mind is that the book (...
The books plus point is their structure and the way they introduce to new concepts, the matplotlib has a lot of examples so I will probably look there if something's do not work as expected. Does data science in general need extensive math knowledge at an initial level? Calculus?
 swift sleet
I was hoping to get some help on a problem. I have to decide how much traffic should I allocate to my new website from the old site. I have ran tests and saw an strong engagement in the new site and am therefore now scaling traffic towards it. But I need to decide how much traffic to balance between the two until end of the year (sales start to pick towards holiday season so want to make sure the site is running and there are no issues). Starting next year I plan to fully adjust traffic to my new site?
lapis sequoia
Does Sklearn have something like XGBoost?
 sly salmon
hey, i have a pandas df with following columns:
MultiIndex([(90, 'BTCUSD'),
            (90, 'ETHUSD'),
            (90, 'LTCUSD')],
           names=['ma_window', 'symbol'])
how do I access the column "BTCUSD"?
desert oar
sly salmon
hey, i have a pandas `df` with following columns:
```py
MultiIndex([(90, 'BTCUSD...
df[(90, 'BTCUSD')]
worth reading @sly salmon https://pandas.pydata.org/pandas-docs/stable/user_guide/advanced.html
desert oar
lapis sequoia
Does Sklearn have something like XGBoost?
"like xgboost" in what sense? it has its own (somewhat less optimized) gradient boosting implementation, if that's what you're asking.
https://scikit-learn.org/stable/modules/generated/sklearn.ensemble.GradientBoostingClassifier.html
https://scikit-learn.org/stable/modules/generated/sklearn.ensemble.GradientBoostingRegressor.html
scikit-learn
Examples using sklearn.ensemble.GradientBoostingClassifier: Early stopping of Gradient Boosting Early stopping of Gradient Boosting Feature transformations with ensembles of trees Feature transform...
scikit-learn
Examples using sklearn.ensemble.GradientBoostingRegressor: Gradient Boosting regression Gradient Boosting regression Plot individual and voting regression predictions Plot individual and voting reg...
sly salmon
desert oar
worth reading <@812098613450506351> https://pandas.pydata.org/pandas-docs/stable...
thank you so much... I have been stuck on this for an hour. Trying to get my head around hierarchical indexing, thank you!!
desert oar
gusty wedge
Does the book require extensive math knowledge if I plan on reading the whole bo...
just skimming it, probably not. although like all things in machine learning and statistics, a working knowledge of calculus, probability, and linear algebra (or at least matrices of real numbers) is important
lapis sequoia
desert oar
"like xgboost" in what sense? it has its own (somewhat less optimized) gradient ...
Yeah that's what I'm using, I don't know much about XGBoost I just read a lot of people on Kaggle talking about it and I was wondering if that's something I can use in sklearn(the library I know)
desert oar
lapis sequoia
Yeah that's what I'm using, I don't know much about XGBoost I just read a lot of...
xgboost has its own .fit/.predict interface like scikit-learn. you can try using the sklearn gradient boosting class but it's probably better to just learn to use the xgboost library
you can use that interface with other scikit-learn things like pipelines
https://xgboost.readthedocs.io/en/latest/python/python_api.html#module-xgboost.sklearn however you lose some efficiency and control by not being able to reuse the xgboost "dataset" object between model fits
lapis sequoia
Ok, thanks
lapis sequoia
I have a pandas column called Age with some values that are missing. Any ideas on how to replace the missing values with random values from the distribution of the values that are present?
So if the age "30" is present 10x more in the column than age "10", I want the missing values to be 10x as likely to be replaced by 30 than by 10.
How can I achieve this?
Can someone help with this question: Can you create a Series where indexes are the odd numbers from 0 to 10 and values are the square of such numbers?
lapis sequoia
lapis sequoia
I have a pandas column called Age with some values that are missing. Any ideas o...
I figured this out myself, here's what I did if anyone's curious:
isnull = df_test['Age'].isnull()
sample = df_test['Age'].dropna().sample(isnull.sum(), replace=True).values
df_test.loc[isnull, 'Age'] = sample
>>> s = pd.Series((np.arange(5) * 2 + 1) ** 2)
>>> s
0     1
1     9
2    25
3    49
4    81
dtype: int64
>>> s.index = np.arange(5) * 2 + 1
>>> s
1     1
3     9
5    25
7    49
9    81
dtype: int64
>>>
 brave sand
could MARL be used for combating ground effect on drones? Or is it a waste of computing power.
 tacit basin
What's MARL?
brave sand
multi agent RL
 magic dune
can anyone do a quick cr for me
???
serene scaffold
magic dune
can anyone do a quick cr for me
???
What is a cr?
Code review?
Whenever you want something online, you should give everything people would need to do that thing all at once. Don't ask to ask.
!paste
arctic wedgeBOT
Pasting large amounts of code
If your code is too long to fit in a codeblock in Discord, you can paste your code here:
https://paste.pythondiscord.com/
After pasting your code, save it by clicking the floppy disk icon in the top right, or by typing ctrl + S. After doing that, the URL should change. Copy the URL and post it here so others can see it.
magic dune
serene scaffold
What is a cr?

GitHub
Contribute to Flow-Glow/Perceptron development by creating an account on GitHub.
My perceptron code
it has no read me rn
but will add just finished it today
craggy shadow
When we scale the data, why the train dataset use 'fit' and 'transform', but the test dataset only use 'transform'?
 main fox
craggy shadow
When we scale the data, why the train dataset use 'fit' and 'transform', but the...
main fox
craggy shadow
When we scale the data, why the train dataset use 'fit' and 'transform', but the...
To prevent data leakage. In this case, it is having your train data have information from your test data.
craggy shadow
So basically fit just has do do with creating the parameters in the model based on the train data, and we dont want to do transform here because then they will have the same exact mean and std which leads to bias and overfitting which means poorer model accuracy? am i understanding correctly ? @main fox
or i guess the accuracy of predicting future observations
tacit basin
craggy shadow
So basically fit just has do do with creating the parameters in the model based ...
There are two fits, one for transformations (like scaling) and one for model.
re transforms we want to find out how to transform data based on train only, that's fit. Then we transform the train and test data using transform.
 mint palm
So i have finally got access for university GPU after sharing my ssh public key.
Prof has also sent me something that says .....@pc.cc.edu.....
Now how do i actually access the server?
And utilize it??
lapis sequoia
guys can someone explain to me about the sigmoid function in logistic regression??
I know thats its the S-like line... but i dont really get it
wooden sail
what's you question about it?
lapis sequoia
I just simply want to understand it
wooden sail
what do you want to understand about it though 😛
do you know what a function in maths is?
lapis sequoia
in math? well no... But ik abt coding ofc
I understand linear regression... Its the line which can predict future values... But i dont get how a S like line can predict future values
wooden sail
it doesn't, not on its own
we use it because of its other properties
particularly, a sigmoid function maps the reals to the interval [0,1]
this allows us, in some sense, to interpret its output as a probability under special conditions
when you add a bias, it allows you to make a sort of "decision". if the output is small, ignore it. if it's large, keep it
that's the "activation" part in the name "activation function"
this can be useful e.g. if you want to interpret the output of the sigmoid as a probability, or if you want to connect its output as the input of another layer, in which case some outputs will be ignored and others will be kept... roughly speaking
lapis sequoia
ooo
well thanks a lot
but does the prediction need not work every single time right?
wooden sail
in general it won't
not exactly, at any rate. you want to be within some reasonable distance of the true sol
craggy shadow
@tacit basin ok i think im understanding, so we do fit and transform on our training data and we only do transform only on our test data so that the test data can learn from only the training data
tacit basin
craggy shadow
<@490342783572246538> ok i think im understanding, so we do fit and transform on...
Yeah. fit and transform on train and transform only on train.
It's like we don't know the test data, so we don't want to use that information to fit scaler or other transformation
tacit basin
mint palm
So i have finally got access for university GPU after sharing my ssh public key....
You can ssh to it with your login and server address like
ssh myname@ipaddressoftheserver
Also the S shape is to ensure that the values fall in between one and zero, with a regression line alone , the predicted values will extend past 1 and below 0 which doesn't make any sense
mint palm
tacit basin
You can ssh to it with your login and server address like
```bash
ssh myname@ipa...
yes i was able to do that.....now on ls in /tmp directory i see a bunch of files. Considering hundreds of student have access, am i seeing their files as well?
tacit basin
mint palm
yes i was able to do that.....now on ``ls`` in ``/tmp`` directory i see a bunch ...
you should have your home directory, try cd then pwd . are you in /home/yourname/?
mint palm
tacit basin
you should have your home directory, try `cd` then `pwd` . are you in `/home/you...
yess
right

but is if only my folder, how come i see soo many folder already there?
tacit basin
some default folders maybe? depends if it's a destkop or server.

Ask Ubuntu
When a new user is created and it logs in the first time, those default folders in the home are created. How are they created?
If changing the scripts/configurations that create them so that they...
hoary wigeon
Anyone who worked alot with nlp??
I need help with stemming, getting words like advocate and advocacy to a common word.
lapis sequoia
Do anyone know smart way to import folder from computer when using google colab, or do I have to store the folders on google drive aswell?
wooden sail
you'd have to have them on drive, that's the easiest way
tacit basin
lapis sequoia
Do anyone know smart way to import folder from computer when using google colab,...
there should be a tool to sync local folder with google drive and then you can mount google drive to colab session
lapis sequoia
wooden sail
you'd have to have them on drive, that's the easiest way
Ok
lapis sequoia
wooden sail
you'd have to have them on drive, that's the easiest way
These are my lines of code from VSCode:
img_size = 100
training_data = []
training_labels = []
for filename in os.listdir('train'):
img = cv2.imread(os.path.join('train',filename))
img = cv2.resize(img, (img_size, img_size))
if img is not None:
training_data.append(img)
training_labels.append(1 if 'cat' in filename.lower() else 0)
testing_data = []
for filename in os.listdir('test'):
img = cv2.imread(os.path.join('test',filename))
img = cv2.resize(img, (img_size, img_size))
if img is not None:
testing_data.append(img)
They will work in google colab if I have the same folder in drive?
I have to go to a better internetconnection cus it takes a while to upload 25000 pcitures 😮
wooden sail
if you have the folder and the path correctly, yeah
you can see the file structure in colab and put your files where you need them
lapis sequoia
Yes, ty!
lapis sequoia
wooden sail
if you have the folder and the path correctly, yeah

Why is this not working?
FileNotFoundError: [Errno 2] No such file or directory: 'train'
lapis sequoia
lapis sequoia
These are my lines of code from VSCode:
img_size = 100
training_data = []
train...
I have copied my path from folder, how do I implement that in my code?
 strong sedge
how does image tagging work ?
for example in the below image, how is the computer able to identify what part of image is what

?
desert oar
lapis sequoia
These are my lines of code from VSCode:
img_size = 100
training_data = []
train...
!code read below for formatting your code as a "code block" with syntax highlighting and fixed-width font 👇
arctic wedgeBOT
Here's how to format Python code on Discord:
```py
print('Hello world!')
```
These are backticks, not quotes. Check this out if you can't find the backtick key.
 shell crest
strong sedge
how does image tagging work ?
for example in the below image, how is the compute...
shell crest
strong sedge
how does image tagging work ?
for example in the below image, how is the compute...
idk how the latest in cv works but basically deep neural networks is the answer.
desert oar
hoary wigeon
I need help with stemming, getting words like advocate and advocacy to a common ...
what have you tried already?
"advocate" and "advocacy" are not the same word in english
shell crest
desert oar
"advocate" and "advocacy" are *not* the same word in english
they have the same root, definitely
desert oar
they share a common etymology, but they aren't the same word
shell crest
also I'm wondering why make a stemmer when Snowball is practically assumed
desert oar
english doesn't have the same concept of a root word like you might find in arabic
shell crest
desert oar
english doesn't have the same concept of a root word like you might find in arab...
I'm not sure about arabic but I'm pretty sure stemmers seek to reduce redundancy by some removal of grammatical nature
desert oar
right, but grammatically in english the stem of "advocate" (noun) is "advocate"
same with the verb
shell crest
unless you have a word-embedding such that advocate is sufficiently far in distance to advocacy I think stemming them to the same thing is wise
desert oar
the stem of "advocacy" would be something like "advocac" since the plural is "advocacies"
shell crest
desert oar
right, but grammatically in english the stem of "advocate" (noun) is "advocate"
Maybe in some really niche NLP this matters but I think in generic stemming, not really???
desert oar
let me actually install nltk and see what snowball does here
shell crest
I'd check word2vec embeddings instead
desert oar
the point is that for this particular task, i think you need to go beyond "stemming" and do something more like "unifying etymological roots"
word2vec has its own stemmer?
shell crest
I don't think so, hmm
desert oar
huh i didnt realize porter had his own libstemmer library in C
surprised that doesn't have python bindings
shell crest
https://huggingface.co/simonschoe/call2vec?text=advocacy
advocacy_group
0.652
advocacy_organization
0.616
advocate
0.602
why isn't it closer to 1 wtf
I lost I guess
desert oar
because they don't appear in the same contexts in english
shell crest
(or it's a bad model KEKW)
shell crest
desert oar
because they don't appear in the same contexts in english
how so really?
desert oar
think about sentences where "advocacy" appears: talking about organizations, politics, etc.
shell crest
ah in usage yes
desert oar
versus "advocate" will be talking about people, court cases, etc.
shell crest
but the underlying meaning should be the same
desert oar
word2vec is literally a model based on surrounding word context
shell crest
so I was thinking the vector representation would show that (edit: show that more)
desert oar
my point is that the underlying meaning is not the same in english and the vector representation does show that
etymological similarity does not imply semantic equivalence
shell crest
desert oar
etymological similarity does not imply semantic equivalence
good point I suppose
desert oar
but i think part of the problem here is that learning from word context isn't enough
they are conceptually similar words
but that conceptual similarity is not generally communicated through the surrounding text, it's communicated by the common etymological root
so i think there is validity in combining etymological origin with word context. etymologies tend to be fairly sticky over time, i think (not an expert, but i do like reading about word etymologies)
btw:
In [1]: import en_core_web_sm; nlp = en_core_web_sm.load()

In [2]: nlp('advocate')[0].lemma_
Out[2]: 'advocate'

In [3]: nlp('advocacy')[0].lemma_
Out[3]: 'advocacy'

In [4]: nlp('advocacies')[0].lemma_
Out[4]: 'advocacie'
so spacy has no idea what to do with this
craggy shadow
So I know in a linear regression model we use individual t test and hypothesis testing to determine the statistical significance of independent variables with respect to our dependent variable and F test to determine the overall significance of the model. I also know in logistic regression we use the Wald test or z score to find the statistical significance of independents in the model with respect to our Y, but is there a way to conduct a hypothesis test on the overall significance in a logistic regression model kind of like the f test in linear regression ?
desert oar
craggy shadow
So I know in a linear regression model we use individual t test and hypothesis ...
likelihood ratio test
for that matter, i think in general likelihood ratio tests are considered "better" than wald tests, because they have better small-sample performance
(you might want to check out Agresti Categorical Data Analysis)
craggy shadow
Got it, thanks
desert oar
craggy shadow
Got it, thanks
specifically, you would do the likelihood ratio of your model vs a model with only the intercept. being the most extreme case of comparing "nested" models

Cross Validated
I'm a little confused about the different common tests for GLMs.
There is the null deviance, which is similar to a likelihood ratio for the difference between the saturated model and the model with...
craggy shadow
@desert oar is AIC commonly used? whats the most commonly used method in the real world?
desert oar
craggy shadow
<@389497659087650836> is AIC commonly used? whats the most commonly used method ...
AIC is also commonly used, yeah
but people just use "whatever your stats library reports" tbh
that, or if you're doing predictive modeling you use a proper scoring rule and/or some classification metric like accuracy, f1, etc
if you're fitting bayesian models (which arguably everyone should be doing) you can/should use a bayesian-specific criterion, although the common ones are all somewhat unsatisfying in this or that regard http://www.stat.columbia.edu/~gelman/research/published/waic_understand3.pdf
you can also use the bayes factor instead of a frequentist test like likelihood ratio https://en.wikipedia.org/wiki/Bayes_factor
The Bayes factor is a ratio of two competing statistical models represented by their marginal likelihood, and is used to quantify the support for one model over the other. The models in questions can have a common set of parameters, such as a null hypothesis and an alternative, but this is not necessary; for instance, it could also be a non-line...

A core aspect of science is using data to assess the degree to which data provide evidence for competing claims, hypotheses, or theories. Evidence is …
craggy shadow
ok thanks. Man, it seems like the learning curve in data science is so steep from all the different supervised and unsupervised ML methods, as well as deep learning, and steps involved in the whole data science life cycle in general from data gathering, feature engineering, feature selection, model creation and deployment. As well as SQL, cloud computing, linux, excel. Do you have any advice for a fresher who's almost done with college and just trying to get a jr data scientist position?
lapis sequoia
Hi guys. I have a coding trial for pandas this Sunday. I was wondering if there's any resource someone can share to learn/practice pandas at an intermediate level. I already use pandas in my projects. I am just not that skilled at it.
I remember someone sharing this with me earlier:
https://github.com/ajcr/100-pandas-puzzles
Let me know if you think it's comprehensive and a good resource.

GitHub
100 data puzzles for pandas, ranging from short and simple to super tricky (60% complete) - GitHub - ajcr/100-pandas-puzzles: 100 data puzzles for pandas, ranging from short and simple to super tri...
 exotic thicket
Hello, guys is there a technological terms dictionary like the one urban dictionary does have? The urban dictionary I mean: which's great understanding in a less read like I need to get computer stuff for an instance let's take console.
desert oar
exotic thicket
Hello, guys is there a technological terms dictionary like the one urban diction...
are you looking for a general glossary or dictionary of software and engineering terms? (note that probably isn't a data science question)
i don't think there is one, but wikipedia isn't a bad resource for such things. it's best if you just ask a question about something specific if you have a specific question
exotic thicket
desert oar
are you looking for a general glossary or dictionary of software and engineering...
Yes, I meant there are websites like an urban dictionary, Cambridge dictionary, etc which are not for technological and computer stuffs but linguistic understanding I am always used to that one which gives a different perspective and great understanding in a less read. So I'm looking for the same as in technological and computer stuff
desert oar
exotic thicket
Yes, I meant there are websites like an urban dictionary, Cambridge dictionary, ...
okay, that's a good clarification. however this is not a good question for the data science channel.
exotic thicket
desert oar
okay, that's a good clarification. however this is not a good question for the d...
I'm extremely sorry
desert oar
exotic thicket
I'm extremely sorry
it's no problem! but do read the channel description
 raven mulch
Hi a bit of a silly formatting question, but let's say I have a float: 6.97e+01 which I am formatting like this {temp:.2e} . How can I instead print it with e+1 instead of e+01
desert oar
raven mulch
Hi a bit of a silly formatting question, but let's say I have a float: 6.97e+01 ...
this sounds like a general python question. this channel is specifically about data science, machine learning, statistics, and related topics
however: i don't know if this is possible with standard python formatting strings
raven mulch
Yeah I need this for a machine learning research paper xD
But I think it's not possible as well
Sorry about using channel incorrectly
desert oar
yeah unfortunately you might have to manually substitute format(temp, '0.2e').replace('e+0', 'e+') or use regex for a bit more control
raven mulch
Smart idea ty
desert oar
raven mulch
Sorry about using channel incorrectly
no problem, some people come in here seeing "data" and not realizing what the channel is for
tacit basin
strong sedge
how does image tagging work ?
for example in the below image, how is the compute...
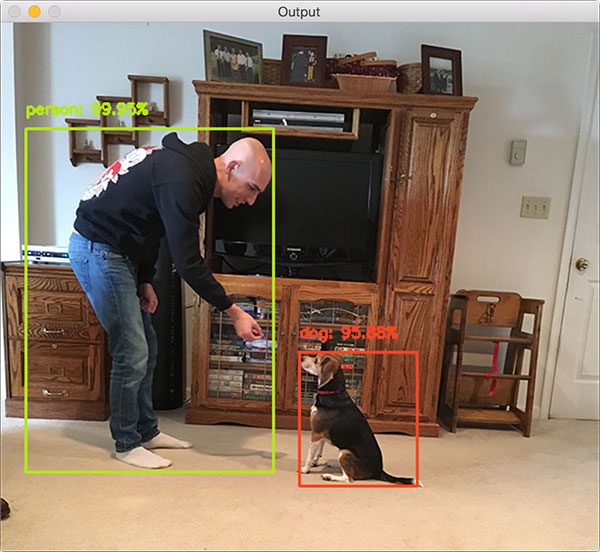
Learn how to apply object detection using deep learning, Python, and OpenCV with pre-trained Convolutional Neural Networks.
lapis sequoia
Is LabelEncoding the main way to convert strings to numerical data?
Or are there better alternatives out there
serene scaffold
lapis sequoia
Or are there better alternatives out there
"better" depends on what your model is. there's also one hot encoding.
lapis sequoia
serene scaffold
"better" depends on what your model is. there's also one hot encoding.
and that's it? these two are the only way people deal with strings in tabular data?
serene scaffold
lapis sequoia
and that's it? these two are the only way people deal with strings in tabular da...
it depends on your model. what are you trying to do?
serene scaffold
lapis sequoia
and that's it? these two are the only way people deal with strings in tabular da...
well, those are the two ways that come to mind. but in nlp, you obviously need more sophisticated representations.
lapis sequoia
I see
 frail patio
Hey all - how do I rename an aggregated column on a dataframe?
 agile cobalt
can you show an example of what you mean?
frail patio
so I'm doing this:
policyDataSum = policyData.groupby(by=['D#'], dropna=False, as_index=False).agg({'Actual Premium' : ['sum']})
and the column name is returned as this
agile cobalt
remove the last []
frail patio
('Actual Premium', 'sum')
AttributeError: 'SeriesGroupBy' object has no attribute 'Actual Premium'
agile cobalt
I meant that as in ```py
policyDataSum = policyData.groupby(by=['D#'], dropna=False, as_index=False).agg({'Actual Premium' : 'sum'})
though you can go further and completely replace py .agg({'Actual Premium' : ['sum']}) by just ```py
['Actual Premium'].sum()
the original one you had should return a dataframe with a MultiIndex for the columns, which is confusing to say the least
frail patio
so I am merging this with another dataframe - would it make sense to make it a series?
agile cobalt
that said, you can just overwrite df.columns if you ever actually need to do something like it - ```py
d
A
sum
B
1 3
2 3
d.columns
MultiIndex([('A', 'sum')],
)
d.columns = ['-'.join(col) for col in d.columns]
d
A-sum
B
1 3
2 3
if you are going to merge it with itself later, you might as well just use transform() instead of merging
frail patio
well I'm merging it with a different dataframe. let me show you
agile cobalt
either way may work then
frail patio
so take this code with a grain of salt as I'm not a developer ... lol
print("Content-Type: text/html\n\r\n")
from ctypes import resize
from itertools import groupby
import pandas as pd

policyData = pd.read_excel (r'Policy-Data.xlsx')

policyDataSum = policyData.groupby(by=['D#'], dropna=False, as_index=False).agg({'Actual Premium' : ['sum']})

policyDataResult = pd.merge(policyData,policyDataSum[['D#','Actual Premium']],on='D#', how='left').drop_duplicates(subset=['D#'], keep='last')

claimsData = pd.read_excel (r'Claims-Data.xlsx')


claimsData = claimsData.groupby(by=['D#'], dropna=False, as_index=False)['Gross Incurred', 'O/S Indemnity', 'Paid Indemnity', 'O/S Expense', 'Paid Expense', 'Paid', 'Outstanding', 'Incurred', 'Incurred (incl. ACR)'].sum()

result = (policyDataResult.merge(claimsData, on='D#', how='outer')
            .fillna(0))
result['Loss Ratio'] = result['Incurred (incl. ACR)']/result['Actual Premium']

print (result.to_excel('output.xlsx'))
result = result.drop(columns=['Underwriter #2'])
#print (result)
print (result.to_html(table_id="results"))
with a series, you can just use df['new_col'] = series.loc[df['merge_col']] without having to bother with calling merge() / join
not sure if it's much (if any) better though
frail patio
well I have multiple columns from both dfs that I'm trying to put together
this was the only way I could figure it out
agile cobalt
uh, nvm then
for multiple columns do use merge()
frail patio
agile cobalt
though you can go further and completely replace ```py
.agg({'Actual Premium' : ...
when I did this it gave me an actual premium_x and Y
agile cobalt
that's what happens when you try to merge but there's a column with the same name in both sides
frail patio
can I set the name of the agg column when it's run?
agile cobalt
series.name = 'something'
df.columns = ['something', 'somethingelse', ...]
if you want to do it in the same line, series.rename
frail patio
policyDataSum.rename(columns={'Actual Premium' : 'Total Premium'})
I'm trying to do this but it's not working
serene scaffold
frail patio
I'm trying to do this but it's not working
how do you know that it's not working? also, keep in mind that pandas operations usually return new objects.
frail patio
so I'm obviously doing it wrong but I'm calling it here
policyDataSum = policyData.groupby(by=['D#'], dropna=False, as_index=False).agg({'Actual Premium' : 'sum'}).rename(columns={'Actual Premium' : 'Total Premium'})
and I'm getting a syntax error
serene scaffold
frail patio
and I'm getting a syntax error
any time you "get an error", please always always show the error.
frail patio
>>> & C:/Users/kevin/AppData/Local/Programs/Python/Python310/python.exe c:/wamp64/www/Work/excel-project-exposure.py
  File "<stdin>", line 1
    & C:/Users/kevin/AppData/Local/Programs/Python/Python310/python.exe c:/wamp64/www/Work/excel-project-exposure.py
    ^
SyntaxError: invalid syntax
hmm I must have mashed the enter button
frail patio
I'm trying to think of how to frame this question (which could possibly be a two parter) but the first part is: I want to create another "view" which is basically going to be a pivot table of a the merged dataframe - if I want to view this on a new page, I assume I'll need to load up the excel sheets again or can I pass the the DF from one page to the next?
serene scaffold
frail patio
I'm trying to think of how to frame this question (which could possibly be a two...
I don't think you can append sheets to an existing workbook (but you can load the whole workbook, add a new sheet, and overwrite the original file)
frail patio
ok so I meant - I'm printing the results of the main DF to html (which is within a bootstrap template) and I want to basically have a sidelink to view different groupings ... like the main page will see all, then there will be links for "grouped by: x, y, z, etc)
serene scaffold
someone on SO says that you can
with pd.ExcelWriter('sample.xlsx', engine='openpyxl', mode='a') as writer:
    df2.to_excel(writer, sheet_name='x2')
and when I click on each other different group by options I just want to know if I need to create a brand new page and reload the xl all over again
serene scaffold
I'm not sure I understand the dilemma. if you have a dataframe, and you write its content to excel, that doesn't delete the dataframe from your program. you can still use it to compute other dataframes.
frail patio
Yeah I don't think I'm explaining properly sorry
I have a dataframe which has been created from 2 excels
I'm merging them together to make a 3rd results dataframe
I'm then printing that dataframe to html
that dataframe shows everything, but then I want to cut up the data and group by certain columns
so I don't know if I have to load the excel files into the DFs on each page I want to do that with
desert oar
frail patio
that dataframe shows everything, but then I want to cut up the data and group by...
you can do this all in pandas. no need to modify the original data or mess with how you load it
serene scaffold
frail patio
that dataframe shows everything, but then I want to cut up the data and group by...
- make the combined dataframe, call it
df - output the html version of that df. note that
dfstill exists, and you can still do whatever you want with it - use
dfto do whatever grouped operations you have in mind--no additional file IO is necessary to accomplish this, becausedfstill exists
frail patio
so yes I got those parts, like I'll just make a new DF which is a grouped view of the existing DF - got that
but let's say all.php contains the result dataframe, and I want to have exposure.php which will be the output of the new grouped DF
on that exposure.php will I need to reload the excel files and run the merge again? Or do I even need to create a separate page? Can I use a link to run a new python script on the same page and reload it?
serene scaffold
can't you just keep all the DFs you need to accomplish all this in memory?
frail patio
That's what I was hoping - but then I don't know how to show one vs another dynamically
desert oar
how are you currently showing a dataframe in a php application?
frail patio
desert oar
how are you _currently_ showing a dataframe in a php application?
I'm just calling it within a PHP page like so
desert oar
i assume you aren't invoking pandas directly from php, so you need to explain what your current code does
frail patio
        <?PHP
        echo shell_exec("excel-project-dealnum.py");
        ?>
        <script>
oh... i see
you need to write your python script to look at its command line arguments, and pass things into the python script that way
frail patio
desert oar
oh... i see
lol I assume that's a bad way of doing it? I'm new to python ....
desert oar
i mean, it's clever
but it's not at all obvious and nobody would have figured it out if you didn't explain it!
frail patio
ah I figure that's just how people did it! Mine is a small project and I'm already trying to learn this myself, so I wasn't really up for the task of learning a framework as well... figured I could just use bootstrap and then use python to manipulate the data
I would very much welcome any tips or help to try and streamline what I'm doing
desert oar
most people don't do this at all!
so what do you need to do? just select specific columns?
frail patio
well let me tell you what I'm doing and maybe you have a better way
desert oar
no this actually makes a lot of sense
you're using .to_html() on the dataframe?
you know... you could also just write 2 different scripts
one to generate the full data, one to generate the pivoted data
frail patio
At this point I have two sources of data (two separate spreadsheets) which need to be combined using one key value (deal number) the data has a many to many relationship.
PolicyData.xlsx
claimsData.xlsx
Policy data is basically a list of policies (22 columns). Each row has things like Deal number, deal name, Underwriter name, year, premium - most of the times it's one to one where there's one deal per year by that name (company xyz) and the premium is ##. Sometimes though, there are multiple entries for the same deal and deal number and the premium is all different, which means I need to total it
Claims data is the claims for the policies/deals. Not every deal has a claim, and some deal has multiple claims
desert oar
deal number == policy number?
frail patio
so I need to sum the "total incurred" value for the claims listed
then I need to put these two dataframes together in order to do other calcs
frail patio
desert oar
deal number == policy number?
yes
frail patio
desert oar
you know... you could also just write 2 different scripts
Yes so that's what I've been planning doing, but loading the excel sheets takes about 10 seconds so didn't know if there was a faster way
I posted my script earlier but can post it again if you don't want to scroll
desert oar
frail patio
Yes so that's what I've been planning doing, but loading the excel sheets takes...
you could do all the intermediate data processing in advance and just load the finished data with pandas .to_html, basically one line of python code in your php app
why are you printing both the xlsx and html versions?
frail patio
I'm not, I'm only printing the html
desert oar
it looks like you are in the script you posted
this is mildly cursed, you're manually constructing an http response by print()ing stuff from python. wild
frail patio
desert oar
it looks like you are in the script you posted
oh ye - so that was just in there for testing
desert oar
is <?PHP ... ?> supposed to contain http responses, or just html? is this typical for php scripts to set their own headers like this?
frail patio
it just spits out HTML - I assign the table an ID and it comes out as a table
desert oar
what's with the ctypes import?
the D# is the deal number, and it's unique for every row?
frail patio
desert oar
what's with the `ctypes` import?
a holdover, needs to be cleaned
frail patio
desert oar
the `D#` is the deal number, and it's unique for every row?
it's not - that's why I needed to aggregate it first
desert oar
ah i see now
 desert oar
i see what your code is doing. i can help you clean this up a bit
lol that content-type printout
you can remove that print() at the top
desert oar
not bad for 1 day of work for a beginner
frail patio
well my uninteresting background is that I graduated college (about 20 years ago) with a CIS degree so I understand the logic of programming, just not the syntax and was actually in the IT field for 10 years before switching to insurance
so I haven't coded in over 10 years but I understand how it works
desert oar
interesting path. what do you do currently in insurance? i was at a big p&c insurer for a few years
frail patio
at a very base level
oh interesting, so I'm an underwriter and write Professional Liability - Management Liability/Employment Practices Liability as well as Lawyers Professional Liability
desert oar
import pandas as pd

policies = pd.read_excel(r'Policy-Data.xlsx')

total_premium = (
    policyData
    .groupby('D#', dropna=False)
    ['Actual Premium']
    .sum()
)

policies = (
    policies
    .join(total_premium, on='D#', how='left')
    .drop_duplicates(subset=['D#'], keep='last')
)

claims = pd.read_excel(r'Claims-Data.xlsx')

claims_cols = ['Gross Incurred', 'O/S Indemnity', 'Paid Indemnity', 'O/S Expense', 'Paid Expense', 'Paid', 'Outstanding', 'Incurred', 'Incurred (incl. ACR)']

claims = (
    claims
    .groupby('D#', dropna=False)
    [claims_cols]
    .sum()
)

result = (
    policies
    .join(claims, how='outer')
    .fillna(0)
)

result['Loss Ratio'] = result['Incurred (incl. ACR)'] / result['Actual Premium']

print(
    result
    .drop(columns=['Underwriter #2'])
    .to_html(table_id="results")
)
this is how i'd write it more or less
frail patio
we currently have no report that allows us to see our Loss Ratio or anything like that
desert oar
note that i'm actually using the default of as_index=True and doing the joins using the D# as in the index
frail patio
I'm reading it now
desert oar
honestly this is super clever and i'd probably have wasted a bunch of time writing a web app
i should check out php some time, it seems like "easy mode" for putting together a basic webpage with some server-side dynamic content.
that said, if this data isn't changing frequently, i strongly suggest running these scripts separately, saving the output to a .html file, and importing the .html file into your webpage however that needs to work
(maybe php has some "import html from file" feature?)
frail patio
ok this code looks real good - I think I still need to rename Actual premium as you end up getting another column called "actual premium, sum"
desert oar
frail patio
ok this code looks real good - I think I still need to rename Actual premium as ...
after the .sum(), try .rename('Total Premium') or similar
total_premium = (
    policyData
    .groupby('D#', dropna=False)
    ['Actual Premium']
    .sum()
    .rename('Total Premium')
)
your code before did something with agg which will give you weirder column names
you shouldn't need this rename at all, but here you can at least distinguish the "sums"
frail patio
hmm this is throwing an internal server error
desert oar
the usual caveats apply regarding code written by unpaid strangers on the internet
try to run the script outside of the php app and see what happens
desert oar
i do need to head back to work, but hopefully this gives you a starting point
when in doubt, the pandas docs are mostly pretty thorough, if a bit dense
frail patio
ok no worries, thanks I'll try and fix it
desert oar
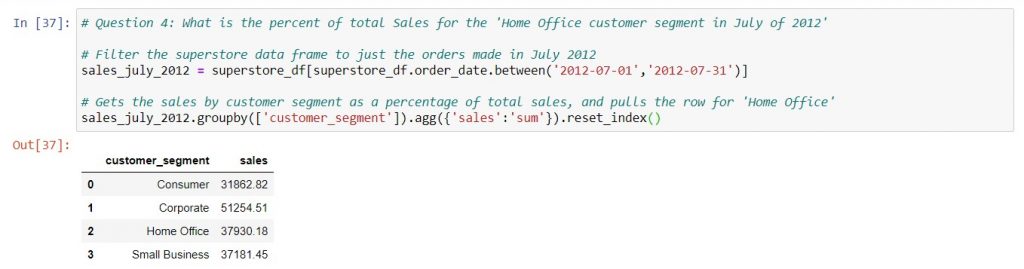
Very often, you'll find yourself creating pivot tables in Excel. This post explores the equivalent ways of grouping and aggregating data in pandas.
 fresh cave
why this:
print("PequeCalculadora")
x = input("Escribe un valor x: ")
y = input("Escribe un valor y: ")
z = x + y

print(f"El resultado es {z}")
Return 66?
pls help
wooden sail
i'm guessing you entered 6 twice and were hoping for 12?
 lavish crypt
fresh cave
why this:
```
print("PequeCalculadora")
x = input("Escribe un valor x: ")
y = in...
lavish crypt
fresh cave
why this:
```
print("PequeCalculadora")
x = input("Escribe un valor x: ")
y = in...
The input function takes string data by default.
If you gave the x and y values 6, the strings are summed for the z value, which means 66
To prevent this, you can convert the input data you receive to float or int data type.
Like:
print("PequeCalculadora")
x = float(input("Escribe un valor x: "))
y = float(input("Escribe un valor y: "))
z = x + y

print(f"El resultado es {z}")
 fresh cave
thanks
worthy hollow
iron basalt
```py
import matplotlib.pyplot as plt
from matplotlib.patches import Rectangle a...
thanks a lot for your code i just saw!!! i just need to ask one last thing bcuz the code output isn't exactly what i need
check your code gives this matrix, but what i need to plot as a matrix is a spiral matrix

 worthy hollow
worthy hollow
worthy hollow
but i actually need a spiral matrix that start with 1 as the centre and need to finish with 361 at the bottom left
x = np.arange(100).reshape((10, 10))
``` *i know that it is this part of the code i need to change*Thx to @wooden sail i've found a code to do a spiral matrix as i want but no idea how to implement in your version of the code (as the spiral matrix is made thru 2 function)
which gives this output
 iron basalt
worthy hollow
which gives this output
iron basalt
worthy hollow
which gives this output
The code I gave will plot a table of any matrix, I highlighted some of the cells to show how they can be highlighted and added some of the bold rectangles to show how those can be done. Everything you need has already been given (spiral matrix and how to draw stuff).
The code I gave has "sections" separated by blank lines. See if you can figure out what each "section" does by modifying it a bit.
lapis sequoia
I'm trying to use RMSE(via sklearn) using this code:
model = gbr.fit(X_train, y_train)
prediction = model.predict(X_test)
accuracy = mean_squared_error(y_test, prediction)
print(accuracy)
But I'm getting a value around
2302627489.5321536
what am I doing wrong?
I know RMSE is supposed to be below 1
main fox
Get the square root
tacit basin
lapis sequoia
I know RMSE is supposed to be below 1
What's the distribution of y_train
main fox
mean_squared_error needs to have it's square root taken
lapis sequoia
main fox
Get the square root
How do I do that? shouldn't it calculate that itself?
main fox
np.sqrt()
tacit basin
You want to minimize the error but it doesn't have to be less than 1
lapis sequoia
oh
so sqrt of that number above gives me 47985
which I'm guessing is the correct answer
main fox
Now compare that to the mean of your target
tacit basin
Mse != Rmse
main fox
And std dev
tacit basin
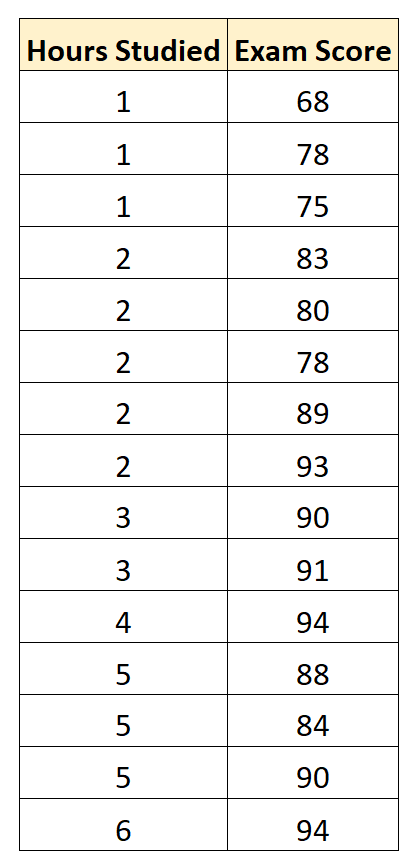
This tutorial explains how to interpret the root mean squared error (RMSE) of a regression model, including an example.
 winter barn
Hello I am new to ML / AI dev and I was reading this guide as my first steps into AI https://towardsdatascience.com/how-to-create-an-ai-that-plays-tick-tac-toe-with-reinforcement-learning-d10e8fbbaa2c
My question is I wanted to know when we talk about the epsilon greedy, if I decrement it at a slower rate, will the machine learn more? Or how do I know the optimal value to decrement it where I maximize learning but minimize cycles spent learning?
tacit basin
lapis sequoia
so sqrt of that number above gives me 47985
The better the model the lower the rmse
 vapid crypt
As a machine learning engineer, data scientist, or in any AI role that requires you to build and test the performance of machine learning algorithms, It is usually stressful and time-consuming to test algorithms one by one before concluding.
To this effect, I built a library to solve this problem.
MultiTrain is a library that allows you to train multiple machine learning models on a dataset at once to quickly evaluate their performance and determine the best model to use.
When I was building this library, I discovered a library, LazyPredict that also does the same thing. I identified its strengths and weaknesses and designed MultiTrain to be better, with way more features for flexibility.
It's been a fun four months of building this library and now it's finally published on PyPi and you can easily install it using the good old 'pip install MultiTrain'.
To read more about how to use this library, check out this medium article I wrote: https://lnkd.in/dWSgu2Nc
If you develop an interest and you'd like to contribute to the source code or look through the codes, here's a link to the GitHub repository: https://github.com/LOVE-DOCTOR/MultiTrain
Share this post if you find it informative or useful.

Medium
MultiTrain is a python library that allows you to train multiple ML models at once to evaluate their performance on a dataset. I’m excited…

GitHub
Test several machine learning models on your dataset with few lines of code - GitHub - LOVE-DOCTOR/MultiTrain: Test several machine learning models on your dataset with few lines of code
glad raft
does anyone use matlab much? i'm trying to convert some matlab to python and there is a frustratingly circular looking logic statement
craggy shadow
in terms of feature selection and filter methods, what is the difference between the ch2 filter method and information gain filter method ?
winter barn
vapid crypt
As a machine learning engineer, data scientist, or in any AI role that requires ...
looks interesting
 scenic tulip
So I'm trying to predict numbers in an array. I have millions of different numbers that have occurred already. When I start doing mean squared errors and other variable rating, between array to array, what would be a sensible approach to teaching a neural net what the best probable outcomes would be based on all the previous data?
I mean, obviously the numbers to predict are random...but I believe there are key factors that can fine tune an educated guess.
vapid crypt
winter barn
looks interesting
It definitely is..you can check it out
main fox
vapid crypt
It definitely is..you can check it out
Cool project. I will definitely test it out and keep an eye on it.
wooden sail
scenic tulip
So I'm trying to predict numbers in an array. I have millions of different numb...
have you tried looking at at the autocorrelation function of the array?
the wider the ACF, looks around zero, the more correlated groups of successive numbers are. if you get something very spiky though, one number tells you nothing about the others and you can't hope to make a prediction
lapis sequoia
How is ai made?
wooden sail
by doing a lot of math. the computer does it automatically, but you need to tell it how
you make a sort of function with many parameters and then show it examples. those examples are used to optimize the parameters of the model
winter barn
Guys I have successfully trained an AI for my first time ever, on tic tac toe 🙂 🙂
 torpid arrow
anyone here at an advanced level in AI/ML?
wooden sail
that's fairly vague. it's better if you ask a concrete question instead
vapid crypt
torpid arrow
anyone here at an advanced level in AI/ML?
Don't ask to ask
 warm jungle
I'm doing a bit of profiling, and I've identified the following line in my code as being quite expensive:
np.multiply(scores, mult, out=scores, where=caps_where)
The shapes and dtypes are:
scores.shape=(9200001, 15), scores.dtype=dtype('int16'), mult.shape=(9200001, 1) mult.dtype=dtype('int16'), caps_where.shape=(9200001, 15) caps_where.dtype=dtype('bool')
There's an additional bit of information that I don't use: caps_where will be True in exactly one position in each row. Is there an obvious way I can make this any faster?
wooden sail
i can't think of an obvious way. you can try to see if doing scores = mult[caps_where]*scores is faster, but that's probably close to what is already happening
warm jungle
thanks, I'll try - I guess that's going to make another intermediate array, which possibly doesn't happen atm, but still - it would be interesting to see if it performed any different
wooden sail
right, the fancy indexing would make a temporary copy
warm jungle
hmm - so that gives an IndexError on mult[caps_where], which I guess makes sense
wooden sail
yeah on mult it gives an error but that one needs no indexing
you said caps where is true in exactly one index per row, meaning all of the entries in mult participate in the product
warm jungle
yeah, mult is a per row scale factor, but it only gets applied to one element of the row, depending on caps_where
Maybe there's some mileage in starting out with an array of ones, and then assigning the scale factor just at the appropriate place in each row, before doing the multiply
wooden sail
warm jungle
yeah, mult is a per row scale factor, but it only gets applied to one element of...
you want the other values in the array to remain unchanged?
warm jungle
yeah, that's what the where= ensures...
(since it's only True once on each row - only one is changed on each row)
wooden sail
res = mult
res[caps_where] = mult[caps_where]*scores
scores = res
del res.copy()
try something like that?
tbh it makes more sense to change mult that store the result in scores, it saves a lot of these ops
mult[caps_where] = mult[caps_where]*scores
warm jungle
mult[caps_where] still won't work atm ^^
wooden sail
bleh i got the dimensions mixed up
then scores[caps_where] = scores[caps_where]*mult
warm jungle
ok - broadcasting to something we don't want here: ArrayMemoryError: Unable to allocate 167. TiB for an array with shape (9200001, 9974859) and data type int16
wooden sail
lol
but then the shapes are not what you said they were?
where did 9974859 come from
warm jungle
print(f'{scores.shape=}, {scores.dtype=}, {mult.shape=} {mult.dtype=}, {caps_where.shape=} {caps_where.dtype=}')
# np.multiply(scores, mult, out=scores, where=caps_where)
scores[caps_where] = scores[caps_where] * mult
prints:
scores.shape=(9200001, 15), scores.dtype=dtype('int16'), mult.shape=(9200001, 1) mult.dtype=dtype('int16'), caps_where.shape=(9200001, 15) caps_where.dtype=dtype('bool')
then scores[caps_where] should work
warm jungle
yeah, it's something about the assignment - scores[caps_where] is OK without the assignment
or possibly the * ... let me see
wooden sail
can you check the shape of scores[caps_where]
warm jungle
 scores_where = scores[caps_where]
 print(f'{scores_where.dtype=} {scores_where.shape=}')
gives:
scores_where.dtype=dtype('int16') scores_where.shape=(9974859,)
now I'm a bit confused
back in a couple of mins...
wooden sail
something in your caps_where is not what you think it is 😛
a quick check is to compute sum(caps_where)
warm jungle
yea, so it's 9974859, so you're right - there must be some rows with more than one True
ok - I have to investigate that - seems I'm not computing caps_where as I thought
I revise my previous statement that it's True exactly once per row... I can get padding rows at the bottom, where it might not be True anywhere, although I don't think that accounts for this
wooden sail
in that case i'd suggest to just stick to the multiply function as you were doing, assuming caps_where and the results you get are correct. if that's not the case, some debugging is in order
still you have a total of 9974859 trues
warm jungle
yeah
so - either the incoming data isn't as I thought, or I've made an error in an earlier calculation with the incoming data - I'll make some tests
worthy hollow
iron basalt
The code I gave will plot a table of any matrix, I highlighted some of the cells...
ah but i don't know how i can convert this 2 function spiral matrix to your code i'm sorry could u give me a few more details
warm jungle
yeah, so I have some padding rows at the end of my data, where everything is zeros, but something about the way I make caps_where means that these rows have 15 True rather than just one. In my original code I don't think this actually matters, because the derived scores for the padding rows don't matter... but still, probably needs fixing up
hoary wigeon
Hi, I want to automate finding the number of cluster while building KMean Model.
Can anyone help me with this?
 frozen nymph
import numpy as np
from sklearn.preprocessing import PolynomialFeatures
X = np.arange(6).reshape(3, 2)
X
array([[0, 1],
[2, 3],
[4, 5]])
poly = PolynomialFeatures(2)
poly.fit_transform(X)
array([[ 1., 0., 1., 0., 0., 1.],
[ 1., 2., 3., 4., 6., 9.],
[ 1., 4., 5., 16., 20., 25.]])
Seriously, is there any one can tell me how this example from Sklearn works?
I know it will generate [1,x,y,xx,yy,xy]
I just don't know the output 3*6 array is doing what
craggy shadow
anyone know the difference between chi squared filter methods and information gain filter methods?
regarding feature selection techniques
 velvet birch
I've been going through ISLR and learning Linear Regression through it
What are the important things that should be learned about it?
From the book I learned about the least squares method of estimating the coefficients
Once we have the coefficients we then move onto hypothesis testing for these coefficients by stating the null hypothesis as "The predictor and the response don't have a relation" and rejecting this null hypothesis if the p-value for that coefficient is sufficiently small enough
A small p-value would prove that the coefficient value we got isn't by chance thus solidifying that their truly is a relation here
Among all this I also learned about a new concept of the Standard Error and how to use it to find the lower and upper limits of what the coefficient might actually be
Then moving on I learn about RSE, R2 and F-statistic and Multiple Linear Regression too
Is there anything am missing?
serene scaffold
this isn't a data science question. see #❓|how-to-get-help.
fresh cave
thanks 😦
lapis sequoia
Heyy guys
serene scaffold
lapis sequoia
Heyy guys
hi. what do you think about data science?
lapis sequoia
serene scaffold
hi. what do you think about data science?
Data science is really cool... And i absolutely love it... I'm still a beginner, but I'm always excited to learn new things in data science :)
steady basalt
Rip
serene scaffold
steady basalt
Rip
why rip
lapis sequoia
What algorithm would be the best for digit recognition? SVM?
steady basalt
serene scaffold
why rip
For his soul, what he will endure over the next years 🤓
serene scaffold
lapis sequoia
What algorithm would be the best for digit recognition? SVM?
are you trying to do MNIST?
lapis sequoia
serene scaffold
are you trying to do MNIST?
yes
serene scaffold
I think people usually use convolutional neural networks for that.
lapis sequoia
Do you know if I can implement CNNs with sklearn
serene scaffold
shameless self-promotion: one of my (very senior) coworkers created MNIST
serene scaffold
lapis sequoia
Do you know if I can implement CNNs with sklearn
sounds like something one would do with pytorch.
lapis sequoia
Ok
It feels like neural networks are so different compared to the rest of ML algorithms
wooden sail
for completeness, the answer is "probably yes". you could also do it with vanilla python. you surely don't want to though
serene scaffold
lapis sequoia
It feels like neural networks are so different compared to the rest of ML algori...
they're challenging for sure. but they also lend themselves well to image data.
desert oar
lapis sequoia
It feels like neural networks are so different compared to the rest of ML algori...
they are and they aren't. a lot of ML algorithms fall into the very broad categories of "optimizing a differentiable loss function" and "stacking/chaining/concatenating outputs from individual small units", and neural networks are basically just both of those at the same time.
it turns out that, with some tricks and specific techniques, 1st-order optimization is really really powerful even if it can only ever iteratively find local optima. and it also turns out that combining lots of little units into big models can be extremely powerful at learning and capturing high-order high-dimensional structure.
 dusty valve
serene scaffold
shameless self-promotion: one of my (very senior) coworkers created MNIST
dusty valve
serene scaffold
shameless self-promotion: one of my (very senior) coworkers created MNIST
Bad stelercus, I'm going to modmail with a complaint of hate, advertisement, shamelessness, role abuse and everything else
lapis sequoia
steady basalt
For his soul, what he will endure over the next years 🤓
if you like something, then even if its very hard, you wont ever leave it... because you love it :)
 rich olive
Guys what's the chances of landing a data science job with no degree and how much does a bootcamp increase them lol
serene scaffold
rich olive
Guys what's the chances of landing a data science job with no degree and how muc...
without a degree, almost zero. with a bootcamp and no degree, probably still close to zero. unless you have a few years of professional experience doing something technical.
rich olive
That's what I figured. Guess I'm going back to school 🤓
serene scaffold
back to school?
rich olive
Yeah I dropped out of Biochem and got a trade certificate from a cc. Now I get to go back and finish uni at 26
serene scaffold
I finished my CS degree shortly before 26, but it was worth it.
rich olive
Or keep making 6 figures at a job where I have to work 21 days straight at 12hr/day to get 7 days off 🤔
Yeah I'll be 28 or 29 when I finish
serene scaffold
rich olive
Yeah I dropped out of Biochem and got a trade certificate from a cc. Now I get t...
not that it matters, but if you had finished the biochem degree, you would have probably had the option to do a CS masters.
rich olive
I know lol
serene scaffold
sorry I don't have better news.
rich olive
That's okay I literally have a career I'm just restless
serene scaffold
rich olive
That's okay I literally have a career I'm just restless
try melatonin
rich olive
serene scaffold
try melatonin
I'm gonna try not living in the woods for months on end and if that doesn't work I'll go with this
serene scaffold
rich olive
I'm gonna try not living in the woods for months on end and if that doesn't work...
melatonin is a sleep aid, if that wasn't clear
rich olive
I know lol
 heavy burrow
can someone help me with setting up for object detecting using tensorflow?
my question is in help-cake
desert oar
rich olive
I'm gonna try not living in the woods for months on end and if that doesn't work...
hey, some people specifically move to the woods for months on end in order to focus and study!
steady basalt
rich olive
That's what I figured. Guess I'm going back to school 🤓
U also need multiple years of experience in the field not just degrees
rich olive
steady basalt
U also need multiple years of experience in the field not just degrees
Oh I need multiple years experience in the field to get into the field, got it thanks
steady basalt
serene scaffold
not that it matters, but if you had finished the biochem degree, you would have ...
I wonder cs master is too hard for non cs grads
They code in fkin assembly
steady basalt
rich olive
Oh I need multiple years experience in the field to get into the field, got it t...
Unironically, yes
rich olive
Guess we'll see
steady basalt
I’ve already seen, and data science isn’t junior
rich olive
Oh ya analyst first
steady basalt
“Junior” data science roles are one per thousand grads looking for it
rich olive
Eh, I probably interview better than them
serene scaffold
steady basalt
I wonder cs master is too hard for non cs grads
non-CS grads might have to take some of the undergraduate CS courses before they can take the masters-level courses. But assembly assignments usually aren't that hard. it's stuff like "write an assembly program that divides two integers".
steady basalt
Data analyst is doable if ur good at sql yes
Sql is actually not easy to be good at, contrary to what you may think
rich olive
Sick I'll learn SQL, be a data analyst, and be a data scientist after
steady basalt
Good luck chap
rich olive
Thx
rich olive
Ya Imma keep working on graphing things and I'm sure I'll get there
 unborn adder
would you guys do AI robo car on raspberry pi 3B+ or 4B? I have them both but I can't decide, so many people do it with 3B+ instead of 4B so I'm confused why haha
desert oar
maybe something to do with power usage and heat?
wooden sail
or with it being impossible/very expensive to get a 4B in the current market 😛
unborn adder
oh yes
they used to be "cheap" before, I just ordered one for 200$, they were 80$ when they were released i think
 knotty hollow
who can help with dash plotly?
iron basalt
worthy hollow
ah but i don't know how i can convert this 2 function spiral matrix to your code...
The spiral code you got gives you a list of lists that represents the matrix. You need only fill out the cell text and colour values based on those values. In the code I gave I created a 10x10 matrix using numpy. Lookup how matrices are represented in Python.
iron basalt
lapis sequoia
It feels like neural networks are so different compared to the rest of ML algori...
Depends on the type of neural network. Neural networks itself is very broad. The most common type as described by salt rock lamp is pretty similar to other ML algorithms (and it's why it's the most common kind, it has the most people working on/with it and is therefor the most widely understood (and also differentiable systems is just a very nice broad generic framework to work in that contains/results in highly reusable code (e.g. the various ANN frameworks in Python) (good for fast iteration / algorithm creation))).
vapid crypt
main fox
Cool project. I will definitely test it out and keep an eye on it.
If you have any suggestions.
Please create an issue in the GitHub repository.
GitHub
Test several machine learning models on your dataset with few lines of code - Issues · LOVE-DOCTOR/MultiTrain
iron basalt
lapis sequoia
It feels like neural networks are so different compared to the rest of ML algori...
*There are also ML algorithms that feel very different from neural networks and the other ML you are probably thinking of. There are a lot of unique ideas out there, but they all build on some math somehow (to explain/justify their ideas) (the usual and more (calc, linear algebra, statistics, etc)). So if you know enough math, it does not really matter how different they are because they are still the same (if that makes sense), you can pick up any new one fast.
lapis sequoia
iron basalt
*There are also ML algorithms that feel very different from neural networks and ...
Makes sense
Anyone here has experience with the Ames Housing Prices dataset competition on Kaggle? Any tips on how much effort I should put on data preprocessing/cleaning vs model building for this one?
The dataset has 71 features and I'm spending a lot of time manually going through each one, just wondering if the overall impact of cleaning the data would be less than building the model given equal time spent on both? Basically, am I wasting my time intricately cleaning/preprocessing the dataset?
main fox
@lapis sequoia The model can only be as good as the data you feed it. Since this is a regression task, it might be worth making sure your features follow the assumptions of the model you plan on testing. Check distributions for example, and if you see a log-normal distribution maybe transform it.
 shrewd grove
Has anyone explored O'Reilly platforms books on ml ? I've seen there are a few.
main fox
shrewd grove
Has anyone explored O'Reilly platforms books on ml ? I've seen there are a few.
Currently reading a few. My experience is that the books are generally good. Always check reviews though.
lapis sequoia
I almost always remove features that have a correlation to my target variable below 0.1. Would this hurt my model training?
My thought process is since this feature seems to have no effect on the value of the target, there's no point in having it.
agile cobalt
generally speaking, removing irrelevant features is good - but you might want to use more 'scientific' methods.
Look up Feature Selection to learn more -
from Wikipedia: https://en.wikipedia.org/wiki/Feature_selection
from sklearn: https://scikit-learn.org/stable/modules/feature_selection.html
lapis sequoia
Ok
main fox
lapis sequoia
I almost always remove features that have a correlation to my target variable be...
Remember that low correlation only means no linear relationship. There may be another type of relationship between the two variables.
 ripe flume
idk if I am allowed to ask questions here, but I figured more people would see it that know the topic well:
for a custom loss function (tensorflow), what would be a good formula for adding loss for 2 weights being both too close to 0?
so if w1 = 0.000001 and w2 = 0.01 then loss +999999 but if w1 = 0.001 and w2 = -10.53432 then loss +0.0001?
sorry if I don't make sense, I can clear something up if someone doesnt understand.
lapis sequoia
main fox
Remember that low correlation only means no linear relationship. There may be an...
Aha, I see
What are some recommended ways to find correlations? I'm just using .corr()
or would just using the 3 methods built-in to .corr() be enough? (spearman, kendall, pearson)
wooden sail
mu of the whole data set, since you wanna end up with a covariance matrix
shell crest
lapis sequoia
What are some recommended ways to find correlations? I'm just using .corr()
It's not about finding correlations. You want to find relationships that allow you to predict (or act on) your data.
wooden sail
dimensionality means... dimension :p the images are in a vector space that could be all of R^n. you use pca to find a basis with fewer than n elements. this number of elements in the basis, i.e. the number of p3incipal components, is the dimension of the subspace they span
lapis sequoia
shell crest
It's not about finding correlations. You want to find relationships that allow y...
I've been using correlation as a way to determine whether or not a feature affects if I will be able to make a prediction or not.
Is that the wrong way? What else matters besides correlation to do predictions?
wooden sail
whatever the size of the images is
then yeah
yes
pca is a projection onto a subspace spanned by the principal components
what's lambda there, just to make sure
eigenvals of the covariance mat, then
you need only do pca once
as part of the procedure you will likely compute an EVD or SVD
you just need to play with the ratios of eigen- or singular-values
 sharp laurel
hi guys, I was wondering if you could help giving some info where I can learn DS from scratch
any youtube channel o at least a list of steps I should follow
 tropic matrix
with tensorflow, what's the optimal method of training multiple different models back to back? when trying to do so in a loop, it fails after successfully training the first model due to being unable to allocate more GPU memory. i've tried to use multiprocessing to start a new process and kill it after each model trains, but tf is unable to access cuda in a forked process. what should i do?
 worldly dawn
sharp laurel
hi guys, I was wondering if you could help giving some info where I can learn DS...
worldly dawn
sharp laurel
hi guys, I was wondering if you could help giving some info where I can learn DS...
https://www.amazon.com/Hands-Machine-Learning-Scikit-Learn-TensorFlow-dp-1492032646/dp/1492032646/ is a good book to get you started
worldly dawn
tropic matrix
with tensorflow, what's the optimal method of training multiple different models...
Given that there isn't enough memory, it sounds like it doesn't get released (or your latest model is asking for more memory than available).
So something is fishy around your memory management
shell crest
Might need to somehow find out a way repeatedly go back to some coldstart perhaps
 manic fossil
Hi! This might be also related to software-design, but I was wondering if anyone has an example of a good piece of software written using pandas? I'm able to use the pandas api to get things done, but I'd like to be able to learn how to use it a more reliable and robust way. Like for instance, how to design classes and functions that manipulate dataframes and series, how to handle type hinting, correctly handling errors, etc
 dapper forum
Hi all, I have a question on NetworkX, I am trying to use nx.subgraph_view and create a function that filters the edges, based on the example function shown at https://networkx.org/documentation/stable/reference/classes/generated/networkx.classes.graphviews.subgraph_view.html the function assumes there is only one NetworkX graph, G that is in scope. Is there a way for me to also pass along the working graph so that the correct edges from the correct graph can be worked on? Or do I need to have a wrapper function that has a copy of the graph being worked on?
 glad totem
I got a question
um,
when working w stock data,, and like I have to train a model
the cols I got are, open , close, high , low , volume, stock split, dividends
um I wanna ask,,, on the basis of which col do we train our model and why??
on internet, they aint using the stock split and dividends,,,, but I think they are also imp for the prediction thingy no??
wooden sail
depends on what you're trying to model. not all variables have predictive power for others
to know which ones are important, you need domain experience in what the data means/represents, as well as some exploratory analysis and statistics
as a trivial case, imagine we know that y = mx + b, where m and b are unknown scalars, and we have observations of y, x, and another variable z
would it make sense to use z to try and predict y?
(surprisingly there are cases where the answer is yes, but let's leave that aside)
glad totem
rightyyy
glad totem
wooden sail
to know which ones are important, you need domain experience in what the data me...
ye I dont have any domain xp for stocks,,,
well,, thanks!
worthy hollow
hey guys, **how could I run a jupyter notebook automatically on a daily basis and make it upload automatically to github everyday? **
i'm pretty sure this is possible
wooden sail
the easiest way that comes to mind is to not use a notebook, use a py file instead. then create a cron job or windows equivalent task scheduler that runs the file and then commits and pushes
there must be some way to run a notebook in a similar way, but i wouldn't know the command
worthy hollow
wooden sail
the easiest way that comes to mind is to not use a notebook, use a py file inste...
ah! i see, i have all those files in separate .py files too, it could work

but would have prefer to make it run the whole notebook honestly
lapis sequoia
Does anyone know why this doesnt work in Colab, when I run it on VSCode it works! I need to use colab in order to train my CNN faster
 wooden sail
worthy hollow
ah! i see, i have all those files in separate .py files too, it could work
wooden sail
worthy hollow
ah! i see, i have all those files in separate .py files too, it could work
ok, so, google says jupyter nbconvert --to notebook --execute mynotebook.ipynb
that should execute the notebook from the terminal, apparently
so put this and the git commit and push in a shell script and have that run daily. how exactly you write the script and schedule it depends on your os
serene scaffold
wooden sail
ok, so, google says ```jupyter nbconvert --to notebook --execute mynotebook.ipyn...
Yay, more tooling to prop up a silly programming technique
wooden sail
yeah tbh you should really just run a py. anyway the notebook doesn't store variables, at best you're storing plots
you gain nothing from running it that way. run the py and store what you need in your preferred format, then make a separate visualizer, which DOES make sense in jupyter
 silent pasture
anyone know how I can properlly join tokenized text?
i have two tokenized text, one partially masked and one isn't, and I want to preappend them
using autotokenizer from transformers
worthy hollow
wooden sail
yeah tbh you should really just run a py. anyway the notebook doesn't store vari...
aight i'll do with that, i won't go wxith the notebook
tropic matrix
worldly dawn
Given that there isn't enough memory, it sounds like it doesn't get released (or...
so what do you think i should do to try to troubleshoot?
 misty flint
serene scaffold
Yay, more tooling to prop up a silly programming technique
misty flint
serene scaffold
Yay, more tooling to prop up a silly programming technique
omg it be true
notebooks only for experiments please
please

lapis sequoia
I had a column called "HomePlanet" with 6606 rows and 3 unique values.
I did one-hot encoding using the following code:
encoder_df1 = pd.DataFrame(encoder.fit_transform(df[['HomePlanet']]).toarray())
encoder_df1.rename(columns={0:'Ea', 1:'Eu', 2:'Ma'}, inplace=True)
df = df.join(encoder_df1)
df.drop('HomePlanet', axis=1, inplace=True)
But the 3 new columns have 4999 non-null rows each instead of 6606 non-null rows like I would expect. What went wrong here?
 grave token
# VGG16
from keras.applications.vgg16 import VGG16
import tensorflow_hub as hub
base_model_VGG16 = VGG16(input_shape=input_dimension, input_tensor=inputs, weights='imagenet', include_top=False, classes=num_classes)
base_model_VGG16 = hub.KerasLayer(base_model_VGG16, input_shape=input_dimension, trainable=False)
model_vgg16 = Sequential()
model_vgg16.add(base_model_VGG16)
model_vgg16.add(Flatten())
#fully connected 1
model_vgg16.add(Dense(units=4096, activation='relu'))
#fully connected 2
model_vgg16.add(Dense(units=4096, activation='relu'))
model_vgg16.add(Dense(num_classes,activation=('softmax')))
model_vgg16._name = "VGG16"
models.append(model_vgg16)```
```Model: "VGG16"
_________________________________________________________________
Layer (type) Output Shape Param #
=================================================================
keras_layer_14 (KerasLayer) (None, 2, 2, 512) 14714688
flatten_18 (Flatten) (None, 2048) 0
dense_54 (Dense) (None, 4096) 8392704
dense_55 (Dense) (None, 4096) 16781312
dense_56 (Dense) (None, 36) 147492
=================================================================
Total params: 40,036,196
Trainable params: 25,321,508
Non-trainable params: 14,714,688```Do I need to rescale before passing image to vgg model ? (` Ex: img / 255 `) spare briar
you should do imagenet scaling
transforms.Normalize(mean=[0.485, 0.456, 0.406], std=[0.229, 0.224, 0.225])
worldly dawn
tropic matrix
so what do you think i should do to try to troubleshoot?
Let's use the scientific method. If the hypothesis is the memory isn't released after completing the training, then let's measure the memory usage on the host and GPU before and after each training session
desert oar
lapis sequoia
I had a column called "HomePlanet" with 6606 rows and 3 unique values.
I did o...
what is encoder? maybe it dropped null values. also pandas has pd.get_dummies which is a little nicer to work with for dataframes; you can pretty easily wrap a scikit-learn FunctionTransformer around it if you want to use it in a pipeline
pandas.get_dummies also works well in conjunction with the "categorical" dtype
!d pandas.get_dummies
arctic wedgeBOT
pandas.get_dummies(data, prefix=None, prefix_sep='_', dummy_na=False, columns=None, sparse=False, drop_first=False, dtype=None)```
Convert categorical variable into dummy/indicator variables.Does anyone here have experience with Apache Beam? My problem is the following, I have a live data-stream of price-data, I want to take this data and separate it, then I want to push it to a Websocket. That Websocket in it's turn will stream the data live there. Is Apache Beam suitable for this / does anyone here have a suggestion where I just for starters take livedata and forward it to a Websocket?
grave token
spare briar
transforms.Normalize(mean=[0.485, 0.456, 0.406], std=[0.229, 0.224, 0.225])
can I add it as a layer? (Ex: model.add())
tf.keras.layers.Normalization(
    axis=-1, mean=None, variance=None, invert=False, **kwargs
)
```Here is no option for std?encoder is OneHotEncoder()
lapis sequoia
Any tips on how to encode non-ordinal categorical data?
Should I use onehotencoder for it?
I'm trying to encode "HomePlanet" from the Spaceship titanic dataset on Kaggle
tropic matrix
worldly dawn
Let's use the scientific method. If the hypothesis is the memory isn't released ...
I've already done so, and I already know that tensorflow isn't freeing up GPU ram used during training, i'm just wondering what i can do to remedy that.
worldly dawn
tropic matrix
I've already done so, and I already know that tensorflow isn't freeing up GPU ra...
What have you tried?
desert oar
lapis sequoia
Any tips on how to encode non-ordinal categorical data?
Should I use onehotenco...
- read what i wrote about
pd.get_dummies - one-hot / dummy encoding is one way to do it. another popular technique is "target encoding". yet another option is to fit some model to the categorical values and then replace the categorical values with a dense real-valued vector; this is essentially dimension reduction. target-encoding is a specific case of this technique; the model could also be unsupervised, of course.
 gloomy anvil
Hey y'all, quick stupid question: How do I call models that only look at current data in t0 to predict t+1? No lookback-window, just plain current data to predict the next timestep in a one-step-ahead prediction?
tropic matrix
worldly dawn
What have you tried?
i've tried to use multiprocessing to start a new process and kill it after each model trains, but tf is unable to access cuda in a forked process
#data-science-and-ml message
 charred cipher
#3.Checking during which months people require car parking space
cmap = sns.cubehelix_palette(rot=-.2, as_cmap=True)
g = sns.relplot(
    data=df,
    x="country", y="arrival_date_day_of_month", size="required_car_parking_spaces",hue='arrival_date_year',
    palette=cmap, sizes=(10, 200),
)
g.set(xscale="log", yscale="log")
g.ax.xaxis.grid(True, "minor", linewidth=.25)
g.ax.yaxis.grid(True, "minor", linewidth=.25)
g.despine(left=True, bottom=True)
plt.show()```

Hey! Im unable to figure out how to specify a country from my dataset worldly dawn
tropic matrix
> i've tried to use multiprocessing to start a new process and kill it after eac...
worldly dawn
tropic matrix
> i've tried to use multiprocessing to start a new process and kill it after eac...
What about explicitly freeing the memory then?
tropic matrix
worldly dawn
What about explicitly freeing the memory then?
sounds like a wonderful idea, how would I go about doing that?
worldly dawn
tropic matrix
sounds like a wonderful idea, how would I go about doing that?
I don't have tf's API on top of my mind.
So looking at the docs would be a good start. I would also expect it to be somewhat automatic if you use a context like leveraging with which should auto close some of the resources
tropic matrix
worldly dawn
I don't have tf's API on top of my mind.
So looking at the docs would be a good ...
you see that's what concerns me. from the research i have done so far when looking into this it seems that tensorflow inherently doesn't release whatever vram it's allocated until the process ends, as an inherent flaw that won't be fixed
worldly dawn
tropic matrix
you see that's what concerns me. from the research i have done so far when looki...
also sharing your code would be a good way to get a sense of potential gaps
 hasty mountain
So... I made a Numpy Neural Network, in case someone wants to see more or less how the idea behind it works...
At least I think I've applied the theory correctly...the network is working, at least...
https://github.com/Martyn0324/NumpyNetwork
I've also tried to not stay just on the "Hey, let's see how NNs work...with Linear layers only" and tried to implement Conv2D, but I got stuck in the backpropagation.
desert oar
gloomy anvil
Hey y'all, quick stupid question: How do I call models that only look at current...
ARIMA or ETS
 lapis sequoia
desert oar
1) read what i wrote about `pd.get_dummies`
2) one-hot / dummy encoding is one w...
lapis sequoia
desert oar
1) read what i wrote about `pd.get_dummies`
2) one-hot / dummy encoding is one w...
Ok
 vocal folio
how does one get started with machine learning?
I want to do AI in the future but I feel like ML is a good start
right now I'm thinking about learning the basics of python then learning a ML algorithm like Linear regression or KNN and then trying to make some cool stuff
serene scaffold
vocal folio
I want to do AI in the future but I feel like ML is a good start
ML is part of AI, just so you know.
serene scaffold
I'm confused by your statement about doing AI in the future, but I guess that doesn't matter.
Anyway, the book I recommend is "Data science from scratch"
vocal folio
serene scaffold
I'm confused by your statement about doing AI in the future, but I guess that do...
right now I'm just intrested in ML
vocal folio
serene scaffold
Anyway, the book I recommend is "Data science from scratch"
But I want to do machine learning
serene scaffold
The lines between these things are blurry, as we've established.
It introduces some basic ML algorithms in the first few chapters
 primal glacier
vocal folio
how does one get started with machine learning?
primal glacier
vocal folio
how does one get started with machine learning?
get a graduate degree
vocal folio
primal glacier
get a graduate degree
I would if I was old enough lol
primal glacier
how old are you then
serene scaffold
primal glacier
get a graduate degree
They asked how to get started with learning it. Not how to become employment ready
vocal folio
primal glacier
how old are you then
14
primal glacier
 go learn calculus, linear algebra, and some statistics
serene scaffold
But yes, if you want to be a professional ML engineer, you will almost certainly need one or more degrees related to it.
serene scaffold
primal glacier
<:worry:769211173207015444> go learn calculus, linear algebra, and some statisti...
Which are all topics covered in that book I mentioned.
primal glacier
u can practice with dummy training data on kaggle
vocal folio
I'm more worried about the programming part then the math
serene scaffold
vocal folio
I'm more worried about the programming part then the math
You should be more worried about the math tbh.
vocal folio
My dad is like really good at math he has a master's degree or something like that
primal glacier
introduction to statistical learning is also a good book to start
if you can get through elements of statistical learning, then ur golden
vocal folio
Yeah the thing is I'm going to get very bored learning Math and not building anything
primal glacier
you won't understand ML if you can't do math
vocal folio
I thought Linear Algebra was important
primal glacier
its all important
serene scaffold
vocal folio
I thought Linear Algebra was important
It is. We've both mentioned that.
vocal folio
Okay but what do I prioritize?
primal glacier
whats ur highest level math
vocal folio
primal glacier
whats ur highest level math
I did some grade 11 algebra with my dad
serene scaffold
I would get that book I mentioned and just read the chapters in order.
serene scaffold
vocal folio
I did some grade 11 algebra with my dad
Grade 11 doesn't tell us anything. What kind of math is that?
primal glacier
might be algebra II or I
if you want to mess around with the coding part, just go to kaggle. If u wanna learn some math professor leonard is pretty good on utube
vocal folio
@serene scaffold is this the pdf?
I don't know any programming languages besides JavaScript
serene scaffold
vocal folio
<@253696366952316929> is this the pdf?
I'm not going to endorse pirated pdfs.
vocal folio
serene scaffold
I'm not going to endorse pirated pdfs.

Data Science from Scratch: First Principles with Python
this?
I'll go get the book from my library
primal glacier
u might be overthinking this, just learn some basic code before throwing yourself at ML
serene scaffold
Yep, that's the one. If you're not an experienced python user, you should try to get the second edition.
serene scaffold
primal glacier
<:worry:769211173207015444> u might be overthinking this, just learn some basic ...
Do we know one way or another what their programming ability is?
primal glacier
im sure any online intro to CS would work
vocal folio
I know a very good amount of JavaScript like good enough to market my skills as a web-developer
serene scaffold
Learn python
vocal folio
serene scaffold
Learn python
And then?
serene scaffold
Read the book
 delicate tendon
Hey there I had a question on virtual enviroments
I typically just used base and downloaded everything into base and used base.
But recently after downloading tensor-flow I realized that one bad package destroys everything. So I was curious if you guys just make a new virtual environment for each new project? If so, do you just re-install like the 10 must-have packages every time? Is there a better way?
serene scaffold
delicate tendon
I typically just used base and downloaded everything into base and used base.
B...
The point of virtual environments is to have a separate one for each project, yes.
You could make a bash script to install all the fundamental packages, I guess. But you can do it with one command
pip install numpy pandas sklearn
Etc.
delicate tendon
When you're just messing around (just doing some quick analysis), do you have go-to environment you use?
serene scaffold
Yes
serene scaffold
Yw!
 misty flint
@serene scaffold ahh im dead
https://mlopsfluff.dstack.ai/p/notebooks-and-mlops-choose-one

In the previous issue, I wrote about what MLOps suffers from. Now that I come to think of it, I have realized that it is worth writing about one more thing that stands in our way towards MLOps. You know this thing very well. It’s Jupyter notebooks. In fairness to Jupyter notebooks, they have become the standard way of prototyping ML models all o...
Imagine that you’d like to say fit. Often people think that extra calories can be compensated with more work at the gym. Without fixing the level of calorie composition, they go to a gym and work until exhaustion. This won’t work. At least this won’t make you fit. The same is true about Jupyter notebooks and MLOps. If you think MLOps tools, for example, such as pipeline orchestration frameworks, will help you improve the reproducibility of your models while you still work on them in Jupyter notebooks, good luck with that.
this section
💀
what a metaphor
worldly dawn
misty flint
> Imagine that you’d like to say fit. Often people think that extra calories can...
that's a non sequitur.
notebooks are useful because they enable much faster iterations. But they aren't as appropriate once you go to prod
lapis sequoia
I just made my first neural network with only numpy. I made it really easy to change the input output and hidden layer parameters and I’m able to get 95 percent Acuracy on the mnist handwritten digits set. Currently training it with the google doodles set. Rly proud of what I could accomplish coming from zero ML experience.
 clear axle
Hey is anybody here good with Image Classification and Model Training?
DM me if you are!
 austere swift
If you have a question it's best to just ask it, and someone with relevant knowledge will answer eventually
clear axle
austere swift
If you have a question it's best to just ask it, and someone with relevant knowl...
Giving a job offer.
clear axle
well then im leaving
austere swift
to each their own
warm jungle
I have the following code:
scores = sub_scores[:,0]
transfers = sub_scores[:, 1]

score_changed = scores[1:] != scores[:-1]
transfer_changed = transfers[1:] != transfers[:-1]

obs = np.r_[True, np.logical_or(score_changed, transfer_changed, out=score_changed)]

# this is the number of times we've seen a new score
cum_obs = obs.cumsum() - 1

count = np.r_[np.nonzero(obs)[0], len(obs)]
count.take(cum_obs, out=ranks, mode='clip')
profiling reveals that the obs = ... line is quite expensive. The count = ... line is also taking significant time. Ultimately I'm only interested in the final value in ranks. Is there anything I can do to speed this up?
manic fossil
How do you deal with column names in pandas in general? More specifically, I have a bit of long ETL in pandas with a bunch of input dataframes (their schemas are defined by an external api schema) and an output (also with a schema defined by an external api). In this ETL I make a bunch of operations over these dfs (merge, group by, explode, etc), all of them depending on the columns names. This means that I have a bunch of colum names in the transformations within the ETL, which makes it very hard to read for people who are not very familiar with the code, hard to maintain, etc. Any general recommendations here?
shell crest
What about numerical indices? Try indices?
 fiery crest
oi
I want to make an ML model that selects certain parts of a pdf, such as in this image.
I have a pdf of n number of pages, and i want a ML model to go through it and select these certain parts.
 lapis sequoia
fiery crest
I want to make an ML model that selects certain parts of a pdf, such as in this ...
lapis sequoia
fiery crest
I want to make an ML model that selects certain parts of a pdf, such as in this ...
I don’t feel like an AI would be good for something like this. If you want to put a box around everything of a specific font there’s libraries that can help with that for you

Stack Overflow
Right now i am Working on a project in which i have to find the font size of every paragraph in that PDF file. i have tried various python libraries like fitz, PyPDF2, pdfrw, pdfminer, pdfreader. a...
from pdfminer.high_level import extract_pages
from pdfminer.layout import LTTextContainer, LTChar,LTLine,LAParams
import os
path=r'/path/to/pdf'

Extract_Data=[]

for page_layout in extract_pages(path):
    for element in page_layout:
        if isinstance(element, LTTextContainer):
            for text_line in element:
                for character in text_line:
                    if isinstance(character, LTChar):
                        Font_size=character.size
            Extract_Data.append([Font_size,(element.get_text())])
thanks man
gloomy anvil
desert oar
<@803185107547586600>
https://otexts.com/fpp3/
https://forecasting-encyclopedia....
Thanks! These papers look really nice! Will definetely go through them. My question though was, if there is a scientific term for models that do not use a look back window and make their prediction only based on the current timestep, disregarding prior data. For example I trained a number of models (LogReg, Bernoulli Naive Bayes, SVM, KNN, Neural Nets,… ) to take a timeseries, look at each timestep separately and make a prediction based on only this 1 timestep for t+1. On the other hand I have ARIMA, SARIMAX, and multiple LSTMs with different lookback windows and compare which ones work better. But is there some scientific term which is used for these type of models that basically disregard the fact that there is a continuous timeseries and look just at the single timesteps separately?
wooden sail
gloomy anvil
Thanks! These papers look really nice! Will definetely go through them. My quest...
do you have an example in mind? i can't think of any off the top of my head, and the whole point in time series analysis is to discover trends and learn the statistics over time, which you can't do if you only have a single time step
unless you make it recursive
gloomy anvil
My idea was basically, that my data basically had almost no autocorrelations and crosscorelations. Basically like a random walk. So I wanted to compare if simply using the single timesteps separately yields results that might be better than timeseries regression
wooden sail
you wouldn't use time series techniques for that kind of data, then
if there's no correl, there's no gain
and in that case you'd kinda wanna look at an entire set of data to learn the stats, looking at a single point will tell you nothing at all
so instead of a small window, you'd want the whole thing
gloomy anvil
wooden sail
do you have an example in mind? i can't think of any off the top of my head, and...
Well I did use the entire dataset. I just meant that I used 2-dimensional data as input compared to 3-dimensional for LSTMs eg. my question still is if there is a scientific term for this?
wooden sail
i think you're gonna have to give more details
so if you have 2D data, you have, say, N variables and M observations of each
what do you wanna do with them?
 glacial wadi
hello how can i fit this Polynomial regression

there is no library called polynomial regression
like from sklearn.linear_model import LinearRegression
wooden sail
you could use numpy polyfit or numpy.polynomial.polynomial.Polynomial.fit (yes, that's the name)
shell crest
polyfit is legacy. Better to look at the latter. The naming is because it's package.subpackage.module.Class.method
 astral inlet
hi
 ruby idol
Hey there, I have a question I would like your assitance on this topic.
I want to make an AI that can learn by time, and the job is to read website (either html or content), to specify 3 things for me:
- subject of a product
- Amount of the product
- Price of the product
Which way would you recommend to learn if I want to achieve this and what ways(Models, Algorithms or...) do you think this can be possible?
tacit basin
ruby idol
Hey there, I have a question I would like your assitance on this topic.
I want t...
 ruby idol
tacit basin
https://huggingface.co/course/chapter7/2
ruby idol
tacit basin
https://huggingface.co/course/chapter7/2
Thank you its a great source
glacial wadi
wooden sail
you could use numpy polyfit or numpy.polynomial.polynomial.Polynomial.fit (yes, ...
got it thanks for your answer
glacial wadi
shell crest
`polyfit` is legacy. Better to look at the latter. The naming is because it's `p...
ok i will check it thanks
 lament shadow
Anyone out there got a Jupyter notebook for reading tomcat logs and spitting out basic graphs and such for analytics? Just need basic stuff like endpoint hit counts, per day or hour etc
serene scaffold
lament shadow
Anyone out there got a Jupyter notebook for reading tomcat logs and spitting out...
what are tomcat logs?
lament shadow
serene scaffold
what are tomcat logs?
Tomcat is a web server for java. Like nginx or iis or unicorn.
serene scaffold
lament shadow
Tomcat is a web server for java. Like nginx or iis or unicorn.
can you make a regular expression to pull out what you want and feed it into a dataframe?
lament shadow
serene scaffold
can you make a regular expression to pull out what you want and feed it into a d...
Probably. Was hoping it was a “solved problem” that I could just use quickly and learn from. But yeah, that’s the general idea, I think.
serene scaffold
lament shadow
Probably. Was hoping it was a “solved problem” that I could just use quickly an...
it would probably be faster to implement yourself than to find a solution that does something vaguely similar to what you want and adapt it.
misty flint
worldly dawn
that's a non sequitur.
notebooks are useful because they enable much faster iter...
true
misty flint
ah this is a really good explanation of data engineering from a software engineering perspective


The Pragmatic Engineer
A broad overview of the data engineering field by former Facebook data engineer Benjamin Rogojan. Part 1.
serene scaffold
misty flint
I wonder how common it is for teams to actually be arranged this way.
 weary crown
Anyone know of a way to use pydantic.BaseModel in PyTorch?
# Convolutional neural network (two convolutional layers)
class ConvNet(nn.Module):
    def __init__(self, num_classes=10):
        super(ConvNet, self).__init__()
        self.layer1 = nn.Sequential(
            nn.Conv2d(1, 16, kernel_size=5, stride=1, padding=2),
            nn.BatchNorm2d(16),
            nn.ReLU(),
            nn.MaxPool2d(kernel_size=2, stride=2))
        self.layer2 = nn.Sequential(
            nn.Conv2d(16, 32, kernel_size=5, stride=1, padding=2),
            nn.BatchNorm2d(32),
            nn.ReLU(),
            nn.MaxPool2d(kernel_size=2, stride=2))
        self.fc = nn.Linear(7 * 7 * 32, num_classes)

    def forward(self, x):
        out = self.layer1(x)
        out = self.layer2(out)
        out = out.reshape(out.size(0), -1)
        out = self.fc(out)
        return out
``` feel like this could be much cleaner that way but I'm not sure if not inheriting from nn.Module would mess it up?would using pydantic really help that much, if everything is going to be a tensor?
weary crown
good point
wooden sail
this is anyway a case where typehinting doesn't do anything for you
automatic broadcasting of dimensions whenever possible means you can have output errors even if all the types are correct and there are no runtime errors because logic errors will be gladly accepted in many parts of pytorch, tf, and numpy
grab some docstring and write some tests
misty flint
serene scaffold
I wonder how common it is for teams to actually be arranged this way.
only at large companies/data-forward companies do people realize the value of having this separation and dedicated individuals working on actual data engineering
the first thing some peeps have to realize is the difference between transactional vs. analytical databases
austere swift
weary crown
Anyone know of a way to use pydantic.BaseModel in PyTorch?
```py
# Convolutiona...
that could be made simpler by just combining it all into a sequential model, since you're not doing anything fancy with the layers
so it could be written as:
nn.Sequential(
    nn.Conv2d(1, 16, kernel_size=5, stride=1, padding=2),
    nn.BatchNorm2d(16),
    nn.ReLU(),
    nn.MaxPool2d(kernel_size=2, stride=2),
    nn.Conv2d(16, 32, kernel_size=5, stride=1, padding=2),
    nn.BatchNorm2d(32),
    nn.ReLU(),
    nn.MaxPool2d(kernel_size=2, stride=2),
    nn.Flatten(),
    nn.Linear(7 * 7 * 32, num_classes)
)
 rigid bronze
hello everyone
i made a project with streamlit and its using a data set of size 1GB from kaggle
i am not able to deploy it
can anyone tell me how i can deploy that projects ??
 odd meteor
rigid bronze
hello everyone
i made a project with streamlit and its using a data set of size...
odd meteor
rigid bronze
hello everyone
i made a project with streamlit and its using a data set of size...
Could the size of the data used to train the model considered why you're unable to deploy the model? I doubt if that's why you are unable to deploy the model.
What's the size of your pickle file?
rigid bronze
odd meteor
Could the size of the data used to train the model considered why you're unable ...
for deploying on streamlit
we have to deploy it first on github
but max file size on github is 150Mb
thats why i am not able to upload that 1GB data set