#data-science-and-ml
1 messages · Page 16 of 1
 wooden sail
 steady basalt
(all i recall from school is the rule where u add power and divide by it)
wooden sail
no, it works different for exp(x)
steady basalt
So thats where I havnt ever studied before
wooden sail
the main properties are
steady basalt
From what I cuold google, you keep the power and just divide by the value infont of x?
this is 400 or so pages away in my calc text book 😄
Maybe its best i wait a bit
 shell crest
You should read the book more
steady basalt
Im burning through it 2 pages a day
- quesitons
im just fnishing polynomial stuff rn
theres 50 quesitons then its more on limits and continueity, then its differentials
integrals are very long off
shell crest
It will be a long time before you hit anything related to DSAI
steady basalt
wats that?
shell crest
wooden sail
.latex $\frac{\mathrm{d} \exp(f(x))}{\mathrm{d} x} = \exp(f(x)) \frac{\mathrm{d} f(x)}{\mathrm{d} x}$
 strange elbowBOT
 shell crest
It's not really off topic, but I would prefer if the discussion here wasn't on high school stuff
I mean, it also doesn't matter what I prefer lmao
wooden sail
as a result of using the chain rule on e(f(x)) and that d exp(x) /dx = exp(x)
steady basalt
surely dsai stuff isnt that far past this?
wooden sail
it's way past
steady basalt
so im not even near the not even near dsai
wooden sail
all of this stuff should be trivial
steady basalt
im months away from this stuff
wooden sail
the stuff you've been looking at is mostly HS maths and maybe some early first year uni
so a couple of years off from the perspective of a full time engineering student
steady basalt
have i chosen the wrong career?
wooden sail
idk about that. but as commented before, it's surprising to hear a lot of the stuff you say from someone that is finishing a masters in data science stuff
shell crest
data science, ignoring the business-like portions, is plain statistics. You need a solid grounding in statistics
steady basalt
i do
shell crest
AI has a lot of computer science but I don't know well enough about them
steady basalt
this isnt exactly statistics
steady basalt
im not sure about requires
wooden sail
it does
steady basalt
unles you go into alot of detail
shell crest
you don't really need to 'go into detail'
wooden sail
statistics is one of the more challenging parts tbh, it's weird maths
shell crest
if all you can do is just statistics on R^n, its quite a lot already
statistics on continuous spaces is scary, because continuous spaces scare me
steady basalt
its interesting you should say this, because a thirdof my course are on par with my level of maths
and all passed
altho it wasnt purely focused on the numerical side of it, also applied to a specific field
wooden sail
wdym by continuous spaces?
shell crest
wooden sail
wdym by continuous spaces?
general skorohod stuff
wooden sail
this isn't that far off from what you run into as soon as you start working with maximum likelihood though
shell crest
steady basalt
altho it wasnt purely focused on the numerical side of it, also applied to a spe...
You might have a very applied perspective then
wooden sail
when i hear "applied" though i imagine very heavy linalg and numerics
shell crest
wooden sail
this isn't that far off from what you run into as soon as you start working with...
I'm kinda tired of all the differentiating twice stuff mechanically, and the theorems confuse me tbh
I'm also trying to find a unified textbook I can get online......aaaaaaaa
https://www.ssc.wisc.edu/~bhansen/probability/
^ can't find this anywhere. Sucks that even my library doesn't have any mention of it
wooden sail
louis scharf and steven kay are some of my staples
 lapis sequoia
For a sequential model, how do you determine how big "Batch Size" you should have?
shell crest
wooden sail
louis scharf and steven kay are some of my staples
I'll look into them
steady basalt
apparently someone did a study and found 32 was most commonly best
lapis sequoia
steady basalt
apparently someone did a study and found 32 was most commonly best
But it completely depends from what I can see. Bigger batchsize = Faster training but slower converge, smaller batchsize = Slower training but faster converge?
shell crest
lapis sequoia
For a sequential model, how do you determine how big "Batch Size" you should hav...
The only value I'd trust is some kind of analysis into stochastic gradient descent
lapis sequoia
Depends on how large the dataset it? Ofc it depends but for a general beginner like me, what should I go with?
shell crest
If not you have to go for something really data driven (i.e. repetitive code that tests things out)
shell crest
You should look into source code, and None isn't an integer
lapis sequoia
I found it, it is defaulted to 32
shell crest
I suppose the implementers read the paper that suggested that specific size
lapis sequoia
ya
steady basalt
@shell crest may I ask what is your occupation
lapis sequoia
Does keras method ".evaluate" do anything with data or just "evaluates" it?
 worthy hollow
hey guys, got a small issue on this matter
INPUT
!e ```py
import pandas as pd
revs = pd.DataFrame({ "Planets": ["Earth", "Mer", "Ven", "Mar", "Jup"],
"0": ["31/10/2021", "24/07/2022", "14/05/2022", "30/12/2021", "08/09/2020"],
"1": ["", "", "", "", ""],
"2": ["", "", "", "", ""],
"3": ["", "", "", "", ""]
})
print(revs)```
 arctic wedgeBOT
@worthy hollow :white_check_mark: Your 3.11 eval job has completed with return code 0.
001 |   Planets           0 1 2 3
002 | 0   Earth  31/10/2021
003 | 1     Mer  24/07/2022
004 | 2     Ven  14/05/2022
005 | 3     Mar  30/12/2021
006 | 4     Jup  08/09/2020
What we want to do in the output

so output will be:
!e ```py
import pandas as pd
Earth = 365.2425
Mercury = 88
Venus = 225
Mars = 687
Jup = 4330.6
output= pd.DataFrame({ "Planets": ["Earth", "Mer", "Ven", "Mar", "Jup"],
"0": ["31/10/2021", "24/07/2022", "14/05/2022", "30/12/2021", "08/09/2020"],
"1": ["31/10/2022", "20/10/2022", "25/12/2022", "17/11/2023", "30/12/2030"],
"2": ["31/10/2023", "16/01/2023", "06/08/2023", "04/10/2025", ""],
"3": ["30/10/2024", "14/04/2023", "18/03/2024", "22/08/2027", ""]
})
print(output)```
arctic wedgeBOT
@worthy hollow :white_check_mark: Your 3.11 eval job has completed with return code 0.
001 |   Planets           0           1           2           3
002 | 0   Earth  31/10/2021  31/10/2022  31/10/2023  30/10/2024
003 | 1     Mer  24/07/2022  20/10/2022  16/01/2023  14/04/2023
004 | 2     Ven  14/05/2022  25/12/2022  06/08/2023  18/03/2024
005 | 3     Mar  30/12/2021  17/11/2023  04/10/2025  22/08/2027
006 | 4     Jup  08/09/2020  30/12/2030
here's what we did to obtain the output is:
ADD FOR EACH PLANET ROW THEIR CORRESPONDING REVOLUTION DAYS
exemple earth:
EARTH[row] = 31/10/2021 + 365.2425 * number_of_column
so you can see for the column " 1 "
it is
31/10/2021 + 365.2425 * 1 = 31/10/2022```
**I want to iterate my operation not over columns, but over rows... Anyone has a clue?** rich olive
worthy hollow
here's what we did to obtain the output is:
**ADD FOR EACH PLANET ROW THEIR CORR...
rich olive
worthy hollow
here's what we did to obtain the output is:
**ADD FOR EACH PLANET ROW THEIR CORR...
.apply() with a lambda will aggregate your function across the column
earth[column] = earth[column].apply(col_num * 31/10/21/021 + 365.2425)
ah! i see your
point wait lemme try, thanks a lot for ur response
rich olive
Can try
 serene scaffold
rich olive
.apply() with a lambda will aggregate your function across the column
serene scaffold
rich olive
.apply() with a lambda will aggregate your function across the column
huh? that's not what aggregate means.
rich olive
No? Can you correct?
serene scaffold
Please don't ask to ask. Please say what your question is in your first message.
arctic wedgeBOT
Hey @agile kite!
It looks like you tried to attach a Python file - please use a code-pasting service such as https://paste.pythondiscord.com
serene scaffold
rich olive
No? Can you correct?
Aggregate means that you're combining related things.
rich olive
Oh you're right it's not a dimension reduction
serene scaffold
rich olive
Oh you're right it's not a dimension reduction
You can aggregate without reducing the number of dimensions, like if you do a groupby and take the mean of that.
worthy hollow
rich olive
```py
earth[column] = earth[column].apply(col_num * 31/10/21/021 + 365.2425)
```
Earth[column] = Earth[column].apply(pd.to_datetime("31/10/2021") + (timedelta(days=365.2425) * col_num))
gives me this error: ```py
NameError Traceback (most recent call last)
~\AppData\Local\Temp/ipykernel_12236/2606786340.py in <module>
12 (timedelta(days=365.2425) * 3)
13
---> 14 Earth[column] = Earth[column].apply(pd.to_datetime("31/10/2021") + (timedelta(days=365.2425) * col_num))
NameError: name 'Earth' is not defined```
rich olive
Do you have a dataframe named Earth lol
worthy hollow
worthy hollow
!e ```py
import pandas as pd
revs = pd.DataFrame({ "Planets": ["Earth", "Mer", ...
here's the dataframe
i have, actually i didnt understand
what you wanted to say by Earth[column]
rich olive
worthy hollow
what you wanted to say by Earth[column]
revs[column]
Is how you access the df column
worthy hollow
!e ```py
import pandas as pd
Revs = pd.DataFrame({ "Planets": ["Earth", "Mer", "Ven", "Mar", "Jup"],
"0": ["31/10/2021", "24/07/2022", "14/05/2022", "30/12/2021", "08/09/2020"],
"1": ["", "", "", "", ""],
"2": ["", "", "", "", ""],
"3": ["", "", "", "", ""]
})
Revs['0'] = pd.to_datetime(Revs['0'])
print(Revs)
@worthy hollow :white_check_mark: Your 3.11 eval job has completed with return code 0.
001 | <string>:9: UserWarning: Parsing '31/10/2021' in DD/MM/YYYY format. Provide format or specify infer_datetime_format=True for consistent parsing.
002 | <string>:9: UserWarning: Parsing '24/07/2022' in DD/MM/YYYY format. Provide format or specify infer_datetime_format=True for consistent parsing.
003 | <string>:9: UserWarning: Parsing '14/05/2022' in DD/MM/YYYY format. Provide format or specify infer_datetime_format=True for consistent parsing.
004 | <string>:9: UserWarning: Parsing '30/12/2021' in DD/MM/YYYY format. Provide format or specify infer_datetime_format=True for consistent parsing.
005 |   Planets          0 1 2 3
006 | 0   Earth 2021-10-31
007 | 1     Mer 2022-07-24
008 | 2     Ven 2022-05-14
009 | 3     Mar 2021-12-30
010 | 4     Jup 2020-08-09
i'm sorry but i havnt understand well, could you show me an example using this?
rich olive
worthy hollow
i'm sorry but i havnt understand well, could you show me an example using this?
You're dataframe isn't constructed the way you want I don't think. Can you describe what you're trying to do again specifically? I can actually handle this one lol
worthy hollow
ok for sure wait a sec
rich olive
I'm working on it now I'm not that good so give me a bit but I'm confident I can do it lol
worthy hollow
!e ```py
import pandas as pd
s_d = "31/10/2008"
revs = pd.DataFrame({ "Planets": ["Earth", "Mer", "Ven", "Mar", "Jup"],
"Rev": ["13", "57", "22", "7", "1"],
"0": ["", "", "", "", ""],
"1": ["", "", "", "", ""],
"2": ["", "", "", "", ""],
"3": ["", "", "", "", ""]
})
print(revs)
@worthy hollow :white_check_mark: Your 3.11 eval job has completed with return code 0.
001 |   Planets Rev 0 1 2 3
002 | 0   Earth  13
003 | 1     Mer  57
004 | 2     Ven  22
005 | 3     Mar   7
006 | 4     Jup   1
here's the correct dataframe
so each rows (planets) has different characteristic
What we want to do is calculate the next date where Earth does 360° (1 revolution upon the Sun or we can call it ONE YEAR FOR EARTH) starting at a specific date
so here the starting date is: s_d = "31/10/2008"
so to calculate the "0" column
we use this operation:
revs['0'][Earth] = (revs.Rev * 365.2425) + s_d
revs['1'][Earth] = ((revs.Rev + 1) * 365.2425) + s_d
revs['2'][Earth] = ((revs.Rev + 2) * 365.2425) + s_d
revs['3'][Earth] = ((revs.Rev + 3) * 365.2425) + s_d

which will give those 3 dates

for only this specific "Earth" row
worthy hollow
worthy hollow
```py
revs['0'][Earth] = (revs.Rev * 365.2425) + s_d
revs['1'][Earth] = ((revs....
then for "Mercury" row it will be this operation
revs['0'][Mer] = (revs.Rev * 88) + s_d
revs['1'][Mer] = ((revs.Rev + 1) * 88) + s_d
revs['2'][Mer] = ((revs.Rev + 2) * 88) + s_d
revs['3'][Mer] = ((revs.Rev + 3) * 88) + s_d
and so on
(revs.Rev * 88)
``` needs to be added as a **time_delta (in days)**, because we want to add this to the **s_d (*starting_date*)** which is **31/10/2008**is it more clear?
rich olive
Yes it's more clear thanks
worthy hollow
worthy hollow
```py
revs['0'][Mer] = (revs.Rev * 88) + s_d
revs['1'][Mer] = ((revs.Rev + 1) *...
i know ```py
revs['0'][Mer]
Is the revs per year? Or why are you adding the column number to the relative revs number?
worthy hollow
rich olive
Is the revs per year? Or why are you adding the column number to the relative re...
we are adding the column number to the relative revs numbers
because this way we can directly calculate the 1st rev, then the 2nd rev, then the 3rd etc
so for revs['0'] we start with 13 revs for earth, for **revs["1"] **it will be 14 revs, for revs['2'] it will be 15 revs and so on
 worthy hollow
worthy hollow
worthy hollow
check the date for earth every revolution is one year ahead, its the exact same date with one year in between every revs
rich olive
Do you have a series to store the days per revolution value? You used 365 for earth and 88 for merc but don't have those stored anywhere?
worthy hollow
rich olive
Do you have a series to store the days per revolution value? You used 365 for ea...
no, i don't have it stored in a series
# Revolutions

Earth = 365.2425
Mer = 88
Ven = 225
Mar = 687
Jup = 4330.6
^ here are all the different revolutions days it takes for all the planet used
rich olive
worthy hollow
^ here are all the different revolutions days it takes for all the planet used
this is where Im at with it, not working yet. I have a suspicion theres a better way to store the data but idk
import numpy as np
import pandas as pd

rev_times = {'Earth': 365.2425, 'Mer': 88, 'Ven': 225, 'Mar': 687, 'Jup': 4330.6}
revs = pd.DataFrame({'Planets': ['Earth', 'Mer', 'Ven', 'Mar', 'Jup'], 'Rev': [13, 57, 22, 7, 1],
                     '0': ['31/10/2021', '24/07/2022', '14/05/2022', '30/12/2021', '08/09/2020']})
revs = pd.concat([revs, pd.DataFrame(columns=['1', '2', '3'])])

for i in range(4, 7):
    revs[i] = revs.apply(lambda x: (x[2] + int(revs.columns[i]) * rev_times[x[1]]) + revs[3])

print(revs)
something dumb wrong with it right now, will figure out
worthy hollow
---------------------------------------------------------------------------
TypeError                                 Traceback (most recent call last)
 5
      6 for i in range(4, 7):
----> 7     revs[i] = revs.apply(lambda x: (x[2] + int(revs.columns[i]) * rev_times[x[1]]) + revs[3])
      8
      9 print(revs)
TypeError: can only concatenate str (not "int") to str```weirdly
 young granite
u give first as str then search as int
rich olive
young granite
u give first as str then search as int
pls elaborate?
young granite
just try to use ur code manuly for revs[1] ull notice that it wont work
rich olive
Yea
worthy hollow
!e ```py
import pandas as pd
s_d = "31/10/2008"
revs = pd.DataFrame({ "Planets": ["Earth", "Mer", "Ven", "Mar", "Jup"],
"Rev": ["13", "57", "22", "7", "1"],
"0": ["", "", "", "", ""],
"1": ["", "", "", "", ""],
"2": ["", "", "", "", ""],
"3": ["", "", "", "", ""]
})
print(revs)
@worthy hollow :white_check_mark: Your 3.11 eval job has completed with return code 0.
001 |   Planets Rev 0 1 2 3
002 | 0   Earth  13
003 | 1     Mer  57
004 | 2     Ven  22
005 | 3     Mar   7
006 | 4     Jup   1
we should be able to create the Date of " 0 " column
rich olive
Where are you storing the dates then
worthy hollow
by doing (13 * 365.2425) + S_D (31/10/2008)
worthy hollow
worthy hollow
by doing (13 * 365.2425) + S_D (31/10/2008)
which will give: 31/10/2021
rich olive
Don't you want a variable to input for the date lol
worthy hollow
yeah the variable is py s_d = "31/10/2008"
but nvm its fine i'll find that out, it's not important compared to the rest
rich olive
Ah that's ez
s_d = 'sup'
rev_times = {'Earth': 365.2425, 'Mer': 88, 'Ven': 225, 'Mar': 687, 'Jup': 4330.6}
revs = pd.DataFrame({'Planets': ['Earth', 'Mer', 'Ven', 'Mar', 'Jup'], 'Rev': [13, 57, 22, 7, 1],
                     '0': s_d})
revs = pd.concat([revs, pd.DataFrame(columns=['1', '2', '3'])])
ah thats not exactly
what i said above

31/10/2008 is just the starting date
for earth, for column ['0']:
13 (revs) x 365.2425 (days) = 4748 days
and if you add 4748 days to 31/10/2008
you will land on 31/10/2021
worthy hollow
rich olive
```py
s_d = 'sup'
rev_times = {'Earth': 365.2425, 'Mer': 88, 'Ven': 225, 'Mar': ...
this code just plot 31/10/2008 but doesnt do the whole calculation with revs & corresponding days based on planets
rich olive
oh mine isnt working because its trying to add to the date string lol one sec
i also had the indices wrong. still not working, same error
import numpy as np
import pandas as pd
import datetime as dt

s_d = '31/10/2008'
rev_times = {'Earth': 365.2425, 'Mer': 88, 'Ven': 225, 'Mar': 687, 'Jup': 4330.6}
revs = pd.DataFrame({'Planets': ['Earth', 'Mer', 'Ven', 'Mar', 'Jup'], 'Rev': [13, 57, 22, 7, 1],
                     '0': s_d})
revs = pd.concat([revs, pd.DataFrame(columns=['1', '2', '3'])])

for i in range(3, 6):
    revs[i] = revs.apply(
        lambda x: dt.timedelta(days=(x[1] + int(revs.columns[i]) * rev_times[x[0]])) + pd.to_datetime(revs[2])
    )

print(revs)
so this?
s_ds = ['date1', 'date2', 'date3', 'date4', 'date5']
rev_times = {'Earth': 365.2425, 'Mer': 88, 'Ven': 225, 'Mar': 687, 'Jup': 4330.6}
revs = pd.DataFrame({'Planets': ['Earth', 'Mer', 'Ven', 'Mar', 'Jup'], 'Rev': [13, 57, 22, 7, 1],
                     '0': [s_d for s_d in s_ds]})
revs = pd.concat([revs, pd.DataFrame(columns=['1', '2', '3'])])
not really i don't think, i've explained it all above in the screenshot
let me reput it all here in form of message
the intiial df should look like that
!e```py
import pandas as pd
starting_date = "31/10/2008"
revs = pd.DataFrame({ "Planets": ["Earth", "Mer", "Ven", "Mar", "Jup"],
"Rev": ["13", "57", "22", "7", "1"],
"0": ["", "", "", "", ""],
"1": "",
"2": "",
"3": ""
})
print(revs)
@worthy hollow :white_check_mark: Your 3.11 eval job has completed with return code 0.
001 |   Planets Rev 0 1 2 3
002 | 0   Earth  13
003 | 1     Mer  57
004 | 2     Ven  22
005 | 3     Mar   7
006 | 4     Jup   1
the column " 0 "
can be calculated using "starting_date"
"revs" & "planetary days per revs"
so
31/10/2008 is just the starting date
for earth, for column ['0']:
13 (revs) x 365.2425 (days) = 4748 days
and if you add 4748 days to 31/10/2008
you will land on 31/10/2021
another example on mercury
57 (revs) x 88 (days) = 5016 days
if you add 5016 days to 31/10/2008, you will land on 24/07/2022
so you can see now thats how we get the initial date from " 0 " column
i want to automatise this process for the "0" column based on the starting_date and the whole operation
rich olive
worthy hollow
i want to automatise this process for the "0" column based on the starting_date ...
weird, this line works
print((timedelta(revs.iloc[0, 1] + int(revs.columns[3])) * rev_times[revs.iloc[0, 0]]) + pd.to_datetime(s_ds[0], infer_datetime_format=True))
well im pretty much blocked on this
worthy hollow
rich olive
```py
print((timedelta(revs.iloc[0, 1] + int(revs.columns[3])) * rev_times[revs....
lol thats so hard to do on python compared to excel i want to smash my head
 leaden hamlet
Shoukd I use a help channel for simple questions or can I jsut ask here? I’m trying to make a neural network, and I think I’ve written the back propagation algorithm correctly, however it keeps learning to get to a point between the expected output values
Made the expected output values as -1.0 and 1.0 depending on the data given, and it woukd get to a 0.0 output everything, or .5 if I set the values to 1.0 and 0.0, so I’m very confused
serene scaffold
leaden hamlet
Shoukd I use a help channel for simple questions or can I jsut ask here? I’m try...
you can ask any question about data science or AI here, assuming that it relates to something you ultimately want to do in python.
leaden hamlet
Okie dokies, thank you
serene scaffold
anyway, we'd have to see the implementation to even begin to speculate about why it doesn't work.
leaden hamlet
Understandable, I’m gonna do some stuff to the code to make it more readable and I’ll be back in a bit to ask
 flint mason
lapis sequoia
flint mason
lapis sequoia
A Conv2D layer, does it have any default values for filters and kernelsize?
From what I can see on the net, filters=32 and kernelsize=(3,3) is very common or 64 & 5,5
 plush jungle
I'm trying to retrain a gan I found on a different dataset and I'm getting this error
    down = intermediate.view(-1, 6*6*512)
RuntimeError: shape '[-1, 18432]' is invalid for input of size 802816```this is the relevant code
down_channels = [3, 64, 128, 256, 512]
self.width = down_channels[-1] * 6**2
intermediate = intermediate.view(-1, self.width)```what exactly is this error telling me and how do I fix it? all of the stack overflow posts about it have people saying things like "oh I just switched it to intermediate.view(4, 16 * 13 * 13) and that fixed it", but I'm not just gonna put random numbers in until I find the right shape. How do I know what the right numbers for my images are?
 serene scaffold
 misty flint
<@253696366952316929> #7 is for you
misty flint
<@253696366952316929> #7 is for you
I love that 😄
misty flint
haha im glad. i like these little nuggets too
 cloud sand
leaden hamlet
Shoukd I use a help channel for simple questions or can I jsut ask here? I’m try...
cloud sand
leaden hamlet
Shoukd I use a help channel for simple questions or can I jsut ask here? I’m try...
yea very common problem here
the issue is that for one reason or another your task is "unlearnable" so the network is learning the average
leaden hamlet
Makes sense, I’ll check my inputs again, but it only has 1 input, which is a number between 0 and 10, and I want it to predict whether it’s above or below 5
Wich is extremely easy and there’s no reason to use machine learning on it, but that’s what I’m using to make sure the code works
It’s very confusing
cloud sand
ehh another problem here
the input is probably not normalized
how is the ann structured anyways?
leaden hamlet
Like how the nodes and weights/biases connect to each other?
cloud sand
yep
leaden hamlet
Left is input, Right is output, and middle are hidden layers, and it goes through from left to right

For Thsi task anyway, for others I made the class so that I can adjust the number of nodes and layers, but this is the current number of nodes and layers for the given task
 nimble storm
For some reason its coming out like this my learning rate is 0.01 and my epoch is 100 and I have 600 lines of Shakespeare's sonnets, are their some parameters that I need to change? Like not enough data or something?
 lapis sequoia
partial fraction
 wild dome
please feel free to do a code review of the following Jupyter Notebook: https://github.com/netotz/alpha-neighbor-p-center-problem/blob/feature/grasp/anpcp/igrasp_betas.ipynb
GitHub
Algorithms to solve the alpha-neighbor p-center problem. - alpha-neighbor-p-center-problem/igrasp_betas.ipynb at feature/grasp · netotz/alpha-neighbor-p-center-problem
it models the data of the results of some experiments for Operations Research
and it's all about pandas DataFrames
I'm not a pandas expert so I'd like to know if there are some better practices that I should follow
the displayed tables are the desired result, but I'm willing to refactor the code
lapis sequoia
Does anyone know how how to speed up training time of CNN-models?
 fresh tiger
Hi! I have a question related to matrix vecotr multiplication with numpy. I am not sure if im being a mega monkey, but I am a bit confused with the following code: ```py
import numpy as np
A = np.array([[0,0,1],
[1,1,0]])
B = np.array([0,2,1])
a_dot_b = np.dot(A,B)
b_dot_a = np.dot(B,A.T)
print('A: ')
print()
print(A)
print(A.shape)
print('------------------------')
print('B: ')
print(B)
print(B.shape)
print('------------------------')
print('A dot B')
print(a_dot_b)
print(a_dot_b.shape)
print('------------------------')
print('B dot A ')
print(b_dot_a)
print(b_dot_a.shape)```
results:
[[0 0 1]
 [1 1 0]]
(2, 3)
------------------------
B:
[0 2 1]
(3,)
------------------------
A dot B
[1 2]
(2,)
------------------------
B dot A
[1 2]
(2,)```So when Im trying to do this on paper, I get the same results for A dot B
But for B dot A.T i get something different: ```
[0 2 1] dot [1 0] = [2 1]
[1 0]
[0 1]
while numpy is giving a result of: ```
[1]
[2]
does anyone know why numpy handles this multiplication like this? Am I doing something wrong with my maths?
wooden sail
fresh tiger
Hi! I have a question related to matrix vecotr multiplication with numpy. I am n...
there's a couple of this to consider here, the most important being that numpy does not treat 1D arrays as true vectors. what this means is that a 1D array behaves as a row or column depending on the context, which leads to unexpected results and it also lets you multiply stuff that really should be undefined
for example, if we consider B to be a column vector, then AB is defined, but BA^T is not. numpy will allow you to do it anyway though by automatically assuming B is a column in one case and a row in the other
then when you multiply a matrix times a vector, it will yield another one of these 1D arrays, which again is a row or a column depending on context
 velvet plover
I am having issues with installing matplotlib to pycharm can anyone help me out?
fresh tiger
wooden sail
then when you multiply a matrix times a vector, it will yield another one of the...
Ahaa I see! Thank you! Is this generally considered iffy ie should I do somehting to make it more explicit?
wooden sail
fresh tiger
Ahaa I see! Thank you! Is this generally considered iffy ie should I do somehtin...
i usually write comments explaining the math. you can also explicitly add dimensions to vectors so they behave as proper vectors, but then you need 2 indices whenever you use them. numpy kinda loses out to matlab in the indexing regarding this
fresh tiger
Ahh ok I see! In that case I will just try to get the ordering of my dot product parameters in a way that makes sense on paper too
Thank you for ur help! 🙂
lapis sequoia
This is a weird question but im making a discord bot for my server, it has word blacklist and it seems my members are finding lot of combinations with special characters for each word and i don't feel like finding all of them, can i use some Ai way to process the word and see what it looks like from a dictionary of words?
serene scaffold
lapis sequoia
This is a weird question but im making a discord bot for my server, it has word ...
!pypi fuzzywuzzy
arctic wedgeBOT

Fuzzy string matching in python
serene scaffold
AI would be overkill for a task like this.
 tepid hare
Hey guys, anyone familiar with a tool that helps manage BI events?
Spoke with a data analyst friend and apparently when an analyst wants a new event to be created they use a temporary excel file to specify the fields etc. and share it with the developer.
And (outside of actually querying their data) they have no place to view all of their existing events and or to manage constant values/structures in events.
Is there a product that solves my question above?
worthy hollow
ok so just one quick question, i see that Rev is not exact to write it down, i need to take it from my REV dataframe bcuz along the years the data will move (check the screenshot i've explained here)

code used:
# 31/10/2008

import datetime

starting_date = datetime.datetime.strptime("31/10/2008", "%d/%m/%Y")

input1 = pd.DataFrame({"Planets": ["Earth", "Mer", "Ven", "Mar", "Jup"],
                       "Days": [365.2425, 88, 225, 687, 4330.6],
                       "Rev": [13, 57, 22, 7, 1],
                       "0": "",
                       "1": "",
                       "2": "",
                       "3": ""
                       })

output1 = pd.DataFrame()

for col in input1.columns[0:3]:
    output1[col] = input1[col]

for col in input1.columns[3:]:
    output1[col] = input1[col]
    for row, _ in input1.iterrows():
        delta = f'{int(input1["Days"][row] * (input1["Rev"][row] + int(col)))} days'
        output1[col][row] = (starting_date + pd.to_timedelta(delta)).strftime('%d/%m/%Y')

output1```and here's the df where i want to get the revs: ```py
print(revgui)
Earth Mer Ven Mar Jup
0 13.0 57.0 22.0 7.0 1.0
0 13.0 56.0 22.0 7.0 1.0
0 12.0 51.0 20.0 6.0 1.0
0 8.0 36.0 14.0 4.0 0.0
0 4.0 19.0 7.0 2.0 0.0
0 3.0 15.0 6.0 1.0 0.0
0 3.0 13.0 5.0 1.0 0.0
0 2.0 10.0 4.0 1.0 0.0
0 1.0 5.0 2.0 0.0 0.0
0 1.0 4.0 1.0 0.0 0.0
0 0.0 3.0 1.0 0.0 0.0
0 0.0 3.0 1.0 0.0 0.0
0 0.0 0.0 0.0 0.0 0.0```
worthy hollow
worthy hollow
anyone has a clue how i could do this with both of them
 frigid glade
partial fractions
misty flint
omg im dead 💀

 quaint gorge
if we have boxes with 2 outcomes Prize or No-Prize, and as you open more boxes the probability of getting the prize increases so at N=1 its 0.00001 but at N=50 it's 0.05. Is This conditional probability or not? For example the Pr(50thBox) or Pr(50thBox|the previous box doesn't contain prize) which one is correct? (edited)
rich olive
If the probability changes the same regardless of whether the previous box had a prize or nothing then it's non-conditional
rich olive
quaint gorge
if we have boxes with 2 outcomes Prize or No-Prize, and as you open more boxes t...
If your probability for the next box having a prize is not increased at the same rate as described if the current box is a prize, then it's conditional
 tidal bough
Pr(nth box|the previous boxes didn't have the prize) is always the same. It's Pr(any of the first n boxes) that increases with n.
rich olive
tidal bough
`Pr(nth box|the previous boxes didn't have the prize)` is always the same. It's ...
That would be conditional on which box you're opening. It is only the same if the relationship between i and p is uniform
tidal bough
oh, I see, so the boxes actually are different
rich olive
Which wasn't specified in the post. I believe they meant conditional on whether the previous box contained a prize in terms of whether that outcome does or does not affect the present outcome
They could be different or the same or follow any function that isn't uniform and intersects i = 50, p = 0.05 and the other vector given
rich olive
rich olive
They could be different or the same or follow any function that isn't uniform an...
Note if they followed a continuous function like p = i^2, it would still be conditional
print(ds_salaries[len(ds_salaries.job_title) == 3])
ds_salaries is my dataframe. job title is a column in that df containing lists of different lengths
why doesnt this work? something about hashability with the lists?
tidal bough
What's this supposed to achieve? len(ds_salaries.job_title) will be a single int, len(ds_salaries.job_title) == 3 a boolean, so you're indexing ds_salaries with one boolean.
tidal bough
well, indexing a dataframe with one boolean gets you, IIRC, either the entire dataframe (True) or an empty one (False)
rich olive
It's boolean conditional, no? If len of cell is 3 it's True and included in df otherwise False and discarded
tidal bough
When I say "a single boolean", I really do mean a single one, not a column.
I think what you were trying to do is ds_salaries.job_title.apply(len), which gets you a Series of ints - the lengths of every list in job_title.
tidal bough
tidal bough
I think what you were trying to do is `ds_salaries.job_title.apply(len)`, which ...
whereas len(ds_salaries.job_title) is just the number of rows in the series
rich olive
Yeah you're right
 versed gulch
does anyone know how to use guassian blur in python for a 3D image using sigma values (2, 2, 2) for (x, y, z)?
rich olive
print(ds_salaries[ds_salaries.job_title.apply(lambda x: True if len(x) == 3 else False)])
much better
tidal bough
rich olive
```py
print(ds_salaries[ds_salaries.job_title.apply(lambda x: True if len(x) == ...
.apply(lambda x: True if len(x) == 3 else False)
that's just.apply(lambda x: len(x)==3)🙂
rich olive
Ah thanks ofc
 odd meteor
misty flint
omg im dead 💀
odd meteor
misty flint
omg im dead 💀
Some of us started with Streamlit & Gradio, then trying out Flask later at some point 😊
misty flint
odd meteor
Some of us started with Streamlit & Gradio, then trying out Flask later at some ...
thats hilarious bc same place:

also +1 for streamlit
i hope snowflake acquiring them makes them better
/ increase number of features
they also caveat that once you start to scale, theres limitations with these
so youll want to learn a proper web framework
like Vue or React
 trail monolith
Hi all. I have 5 variables and one of them always equals the target variable. However I cannot exactly figure out the rules/conditions for the variable to be equal to the target variable. I know for sure that there are 5 cases (for the 5 variables) and one of them is always gonna be the target var.
Is there a model that can learn the condition in which one of my 5 vars matches the target?
 agile cobalt
you can try using a decision tree, but that sounds weird overall
odd meteor
trail monolith
Hi all. I have 5 variables and one of them always equals the target variable. Ho...
What's your target variable and what's the name of the explanatory variable that's same with your target variable?
You might have to drop the said feature to avoid data leakage. Have you checked the correlation yet?
odd meteor
misty flint
i hope snowflake acquiring them makes them better
Hopefully! 🤞
trail monolith
So the problem is salary estimation from pension amount. target is salary. Now there's a lot of different cases acc to pension laws, but I have derived 5 formulas and one of them always matches
agile cobalt
you might have to change your problem statement, maybe instead try to determine in which of these classes the person falls into - in which case you're now left with a more common multiclass classification problem, but one way or the other you will most likely have to use some other features, not these 5 methods
aren't these 'different cases' supposed to be set in stone though? not sure if you should be using ML for it at all
trail monolith
Well I just have one variable being pension amount. And the rules are quite complicated to implement manually on the data tbh. The reason for that being you cannot tell which rule applies to which pension amount.
How I got the 5 variables is using some back calculation
So I know one of them is true but don't know which one and when
agile cobalt
probably worth mentioning:
if you yourself do not know that for any of them, there is literally no way for the computer to know it
trail monolith
It's not that the relationship doesn't exist
Its just hard to figure out
a tree based regressor seems to be the only option here
Or else the approach needs to be changed
agile cobalt
trail monolith
Or else the approach needs to be changed
I'm pretty sure that this is the case tbh
feel free to try something, but it sounds like you're trying to solve the wrong problem in first place
trail monolith
Original dataset contains just pension amount and salary. Univariate regression is out of the question ig
wooden sail
if the pension amount depends only on one variable, this is a thresholding problem
a simpler flavor of svm
you could try svms, decision trees, or simply if-else statements
though pension is something i'd imagine is well regulated, so there shouldn't be a need for ML here?

 main fox
It's been a good week of hitting brick walls trying to learn PySpark but things are finally starting to click 
serene scaffold
main fox
It's been a good week of hitting brick walls trying to learn PySpark but things ...
too bad they won't just let you use dask.
main fox
I've heard good things about Dask, what would you say it does better?
I initially had issues with the Frankenstein syntax PySpark has between SQL, Python, and Spark nuances. Now I need to see what the details are in MLLib.
serene scaffold
main fox
I've heard good things about Dask, what would you say it does better?
I initial...
just that it's not a whole ecosystem that you have to buy into.
main fox
I can already see that being the case with learning Spark also meaning becoming familiar with Databricks
I got excited when I saw Spark now had pyspark.pandas but I've hit some bugs making me hold off from just trying to do pandas in spark
trail monolith
I run into databricks bugs quite often as well
 neon orchid
I don't know anywhere else to ask this question. But any one that uses python for trading bots, what's a good way to start building my own indicators and backtests
 viscid trail
so I'm trying to make a scatter matrix, but without using pandas, any help?
rich olive
example1 = pd.DataFrame({'name': ['Josh', 'Sarah', 'Mike'],
                         'job': ['grocer', 'lawyer', 'lawyer'],
                         'salary': [30000, 60000, 70000]})

example2 = pd.DataFrame({'grocer': [30000, np.nan],
                         'lawyer': [60000, 70000]})
how do i turn example1 into example2
quaint gorge
rich olive
If your probability for the next box having a prize is not increased at the same...
how would you find the pr then
of p(50th box contains the prize| Box (49,.....1) didn't contain the prizE)
the denominator will be a recursive formula
how about P(Nthbox containd the prize interscts n-1 has no prize)
rich olive
I'm lost. is the probability of the present box containing a prize dependent on the previous?
quaint gorge
have you ever played a game with loot boxes?
I'm doing something simillar for fun so lets say you keep opening boxes to get the reward you want
but there is a "back luck protection" kicks in everytime you you open a box and not get the prize
which increases the probability so P(N+1) >= P(N)
Now what's the probability you get the reward at the 50th box
how would you answer that
still lost?
rich olive
quaint gorge
Now what's the probability you get the reward at the 50th box
Ohh okay. You would need an equation to describe how the probability increases, otherwise the best you can say is P(50 | not 49) > P(49 | not 48) lol
quaint gorge
I have the Probabilites up to N= 50 after that N is constant, so I fitted a quadratic model
 stark zenith
Is there a best general purpose NLP library? Or is it better to learn a little bit about all of them?
quaint gorge
rich olive
Ohh okay. You would need an equation to describe how the probability increases, ...
But my main problem is P(AUB) = P(A) + P(B) - P(ANB), the quesiton is are the trials independent or not?
rich olive
quaint gorge
I have the Probabilites up to N= 50 after that N is constant, so I fitted a quad...
If it's modelled based on the conditional data, then that model would reflect P(n | not n-1)
quaint gorge
rich olive
If it's modelled based on the conditional data, then that model would reflect P(...
true but how would you estimate (n interscts not n-1)
rich olive
I'm not sure what you mean
quaint gorge
ahh like the formula for condtional pr
do you agree its P(n | ~n-1)
so if you were to solve for n= 50 for example then
plush jungle
how does view() work in pytorch? I'm getting runtime errors whenever I try to use it
quaint gorge
then P(50|~49) = P(50 n ~49)/p(~49)
 austere swift
plush jungle
how does view() work in pytorch? I'm getting runtime errors whenever I try to u...
austere swift
plush jungle
how does view() work in pytorch? I'm getting runtime errors whenever I try to u...
its similar to .reshape()
quaint gorge
where do I get the value of the numerator from thats the question
austere swift
it returns the tensor in the specified shape
plush jungle
so if I have a tensor like this
torch.Size([32, 512, 7, 7])```this is trying to reshape that into what shape?
intermediate.view(-1, 6*6*512)```flatten it into a vector of length 6 * 6 * 512?
shell crest
stark zenith
Is there a best general purpose NLP library? Or is it better to learn a little b...
I think this depends on your use case
austere swift
if you want to flatten it you should use .view(-1)
or .flatten()
.view has some specific requirements about the shape, which are explained in the documentation https://pytorch.org/docs/stable/generated/torch.Tensor.view.html#torch.Tensor.view
wooden sail
plush jungle
this is trying to reshape that into what shape?
```
intermediate.view(-1, 6*6*51...
it is reshaping into whatever value of x makes it so that x * 6 * 6 * 512 is equal to 32 * 512 * 7 *7
plush jungle
austere swift
it would return a 2 dimensional tensor
why would it be two dimensional?
austere swift
plush jungle
why would it be two dimensional?
-1 means that it infers the dimension
wooden sail
-1 means "compute the shape automatically for this dimension"
austere swift
so there would be 2 dimensions
plush jungle
because 2 * 6 * 6 * 512 = 32 * 512 * 7 * 7?
rich olive
quaint gorge
do you agree its P(n | ~n-1)
yes but I don't know enough to turn that into a single dependency
quaint gorge
rich olive
yes but I don't know enough to turn that into a single dependency
are the trials independt in this context or not
wooden sail
well, if you divide 32 x 512 x 7 x 7 / ( 6 x 6 x 512), you get a fraction, so this reshaping shouldn't work
plush jungle
wooden sail
well, if you divide 32 x 512 x 7 x 7 / ( 6 x 6 x 512), you get a fraction, so th...
hence the error
RuntimeError: shape '[-1, 18432]' is invalid for input of size 802816```theres also some other requirements that view has to satisfy about the stride and stuff iirc, so if it doesnt satisfy those it'll give you an error
wooden sail
aha, i hadn't read they got an error, but that certainly explains it
austere swift
if you use .reshape it'll work
rich olive
quaint gorge
are the trials independt in this context or not
trials of box opened? no. Trials of number of boxes opened until prize? yes
plush jungle
austere swift
if you use .reshape it'll work
the issue is I'm trying to use someone's autoencoder gan code on my dataset
and I'm guessing they handpicked these numbers for their dataset
austere swift
what are you trying to reshape?
quaint gorge
rich olive
trials of box opened? no. Trials of number of boxes opened until prize? yes
is it not because you wouldn't open the next box if the prize is in the n-1th box?
wooden sail
plush jungle
and I'm guessing they handpicked these numbers for their dataset
most likely
plush jungle
austere swift
what are you trying to reshape?
this augmented_input tensor
        rv = torch.randn(input_tensor.size(), device=self.device) * 0.02
augmented_input = input_tensor + rv```guys I have a sample of salaries, and I have a sub-sample of that I want to compare to it. is that a related or independent 2-samp ttest
austere swift
in this case you should resize your input data to match the shape of their input data
rich olive
quaint gorge
is it not because you wouldn't open the next box if the prize is in the n-1th bo...
simply because the probability of attaining a prize is dependent on whether the last box had one or not, regardless of whether you choose to continue
quaint gorge
rich olive
simply because the probability of attaining a prize is dependent on whether the ...
I see
austere swift
otherwise you'd have to change the structure of the model to work with your data, since usually autoencoders have to be designed specifically for the size of the image they're using
plush jungle
austere swift
otherwise you'd have to change the structure of the model to work with your data...
right, that makes sense. I'm hoping it's as simple as changing a single input shape variable
and that that doesn't cause cascading effects that I have to fix
austere swift
it likely will, the best way is to just resize your dataset to match theirs
so if they're using 512x512 images and you're using 1024x1024, you should resize yours to be 512x512
I remember when I was making a DCGAN I had to make the code create the model so that it works with the input shape of the images, and it had to change each layer to work properly
I'm not sure how the GAN you're working on is structured but it's probably similar in that the architecture is built for a specific image size
plush jungle
austere swift
it likely will, the best way is to just resize your dataset to match theirs
I'm not sure this will work. I downloaded the dataset he trained it on and tried running the code on his dataset and it threw the same error
plush jungle
austere swift
are you on the same pytorch version as he is?
I don't know, but I see in his blog article that he mentions the images are 96x96 and when I look in the dataset, half of them are, and the other half are 128x128
so maybe he just reshaped the 128 ones and didn't mention it or provide the code for that?
austere swift
does it work with the 96x96 images at least?
plush jungle
austere swift
does it work with the 96x96 images at least?
I don't know, because on the first forward pass it crashes with the view() error
austere swift
try running it on only the 96x96 images
plush jungle
I could experiment with a folder that only contains one 96 image
austere swift
yeah like that
plush jungle
austere swift
does it work with the 96x96 images at least?
nope, just tested it, it doesn't even work with those
gives the exact same error
RuntimeError: shape '[-1, 18432]' is invalid for input of size 802816
did you change the code from what he had?
plush jungle
austere swift
did you change the code from what he had?
no, I don't think so
austere swift
double check that you're using the same version of pytorch
if its the same code, same data, and same environment, it should have the same results
misty flint
main fox
It's been a good week of hitting brick walls trying to learn PySpark but things ...
speaking of pyspark my friend spent his labor day weekend trying to debug it since he made changes on friday and it broke prod at like 5pm

i was in austin at the time, but he was telling me this story just now
misty flint
serene scaffold
too bad they won't just let you use dask.
+1 on Dask
steady basalt
What’s labour day
serene scaffold
steady basalt
What’s labour day
I think you mean labor day and it's a totally capitalist, non-communist way of celebrating how American 🇺🇸 🗽 workers secured rights such as the 40-hour work week, and generally not being worked to death in sweatshops.
steady basalt
serene scaffold
I think you mean *labor* day and it's a totally capitalist, non-communist way of...
It shud be labour
serene scaffold
steady basalt
It shud be labour
miss me with your british spelling shit. but how is this related to the topic of the channel?
stark zenith
shell crest
I think this depends on your use case
I was leaning towards a very general use case tbh, I don't have a specific problem to apply it to yet.
 exotic pike
wtf am i looking at
 dreamy isle
exotic pike
wtf am i looking at
dreamy isle
exotic pike
wtf am i looking at
discord
austere swift
steady basalt
It shud be labour
you might want to worry about how to spell should before worrying about how to spell labor
steady basalt
It’s a joke, I spell it that way cause I’m British
Anyone else want to chime in too?
austere swift
its not on topic for this channel anyways, move to an off-topic channel
steady basalt
And yourself mate
 tame bison
is VPD a variable, or three variables?
 craggy mango
Hey all, I've been trying to optimize some code with numpy, and I was referred to come here for some help on the matter
The problem:
I have an image, 'i'. For each pixel in 'i', I want to store it in it's respective province 'p', inside a list/array.
Each pixel corresponds to a province based off it's colour, and each province is defined by a specific colour on a 1-to-1 mapping.
How would I optimize this with numpy? I can drop the giga-inefficient code I currently have here if needed
serene scaffold
craggy mango
The problem:
I have an image, 'i'. For each pixel in 'i', I want to store it in ...
Lists and arrays are different, so you need to decide for sure which one you're talking about.
Also, did you mean to use i twice? For the ith image, do you only care about the ith pixel? Only one pixel per image matters?
craggy mango
sorry, 'i' is the name of the image I'm using in the example, not the index. There is only one Image, named 'i'
craggy mango
serene scaffold
Lists and arrays are different, so you need to decide for sure which one you're ...
currently it uses a list, but I'd be better off using an array
serene scaffold
How are you representing the image in your code currently?
craggy mango
as an array:
self.provinceMapImage = Image.open("{}/{}/{}".format(path, MAP_FOLDER_NAME, PROVINCE_FILE_NAME))
self.provinceMapArray = numpy.array(self.provinceMapImage)
So in the end, you want a 2d array of strings, where each index represents a pixel, and each element is the name of a province?
craggy mango
before the method call, I have a list of provinces (Object) which as a field, has a list of pixels
the purpose of the method is to populate this list of pixels for each province object
sorry, array of pixels
serene scaffold
What is "(Object)" doing in that sentence? Everything in python is an object.
serene scaffold
That's good information to have, but what you said initially doesn't communicate that. Just keep that in mind
craggy mango
Ah, my bad.
Should I paste the code I currently have, that I'm looking to optimize?
serene scaffold
That would help, but I think answering this would involve more than I'm currently willing to commit to.
craggy mango
I understand, thank you for your consideration though :>
 desert oar
craggy mango
Ah, my bad.
Should I paste the code I currently have, that I'm looking to optimi...
desert oar
craggy mango
Ah, my bad.
Should I paste the code I currently have, that I'm looking to optimi...
ideally you would share a small and understandable ("minimal") sample of code that reproduces whatever problem you have or demonstrates where you are stuck on something
!paste if it's longer than a few lines it's best to use the paste site 👇
arctic wedgeBOT
Pasting large amounts of code
If your code is too long to fit in a codeblock in Discord, you can paste your code here:
https://paste.pythondiscord.com/
After pasting your code, save it by clicking the floppy disk icon in the top right, or by typing ctrl + S. After doing that, the URL should change. Copy the URL and post it here so others can see it.
shell crest
stark zenith
I was leaning towards a very general use case tbh, I don't have a specific probl...
I'd look at spacy to try things out first IMO. Then move on to other tools which provide me the way to implement state of the art
 grand canyon
hey everyone
i had a question, so im integrating a pytorch model into my flask app. however, when i do it, my outputs for binomial classification's outputs keep staying at 0.50. this wasn't the case when i trained the model on jupyter notebook. could someone please take a look at my code?
GitHub
Contribute to Dodesimo/IDCApp development by creating an account on GitHub.
 floral forge
any idea on how to get Xp
 serene scaffold
floral forge
any idea on how to get Xp
serene scaffold
floral forge
any idea on how to get Xp
please don't ask people to read screenshots of text.
!code
arctic wedgeBOT
Here's how to format Python code on Discord:
```py
print('Hello world!')
```
These are backticks, not quotes. Check this out if you can't find the backtick key.
grand canyon
could someone take a look at my earlier message
serene scaffold
grand canyon
i had a question, so im integrating a pytorch model into my flask app. however, ...
there are so many reasons this could be and so few ways to confirm if any of them are your reason. questions like this, unfortunately, typically go unanswered.
when i trained the model on jupyter notebook
Don't train models that you plan to use in production in a notebook. they should be created from regular py files. and then there should be a version number associated with that py file (possibly via a commit hash).
Notebooks are for presenting stuff and for rapid experimentation. anything that some system depends on should not be in a notebook.
rich olive
I have a sample of salaries. I want to compare that sub-sample to the same to see if it significantly differs, or to the piece of the sample to see if each are significantly unlikely to be from the same population, if that's the proper way to go about it. I thought a 2 sample t-test was the best way to do this? Seems like the arrays have to be the same size? Does anyone know how to approach this?
 craggy shadow
9.6 LAB: Generating random numbers
Write a program that would generate 500 data points and create a linear regression model using the scipy.stats module.
Generate a numpy array, x, of 500 numbers evenly spaced between 0 and 100.
Generate another numpy array, noise, of 500 numbers from the normal distribution with a mean of 0 and standard deviation of 1.
Let y be the sum of the x and noise.
Create a linear regression model using x as the predictor variable and y as the response variable.
import numpy as np
import scipy.stats as st

# set seed to input
num = int(input())
np.random.seed(num)

x = np.linspace(0,100,500) # randomly generate 500 numbers between 0 and 100 using the linspace function
noise = np.random.normal(0,1,500) # randomly generate 500 numbers from the normal distribution with mean = 0 and sd = 1

y = (x + noise)  # sum of x and noise

model = st.linregress(x,y) # create a linear regression model using scipy.stats

print(model)```Your output
LinregressResult(slope=0.9992310659831274, intercept=-0.00019727266958113887, rvalue=0.9993984742634541, pvalue=0.0, stderr=0.0015537793998482148, intercept_stderr=0.08975242785858577)
Expected output
LinregressResult(slope=0.9992310659831275, intercept=-0.0001972726695882443, rvalue=0.9993984742634541, pvalue=0.0, stderr=0.001553779399848215
can anyone tell my why my results are off here?
craggy shadow
i think theres something wrong with my y = (x+noise) line but im not sure what to change
desert oar
rich olive
I have a sample of salaries. I want to compare that sub-sample to the same to se...
I want to compare that sub-sample to the same to see if it significantly differs
did you leave out something by accident? this is a bit confusing
if you have two samples, you can do a "welch's t-test" for independent ("unpaired") samples to test the hypothesis that their means are equal. and no the sample sizes do not need to be the same
 tacit basin
serene scaffold
Notebooks are for presenting stuff and for rapid experimentation. anything that ...
tacit basin
serene scaffold
Notebooks are for presenting stuff and for rapid experimentation. anything that ...
That's one point of view. Some say otherwise :), for example
https://nbdev.fast.ai/
https://papermill.readthedocs.io/en/latest/
These are just different tools for the same job.
I'm not looking to start a editor war here 🙂
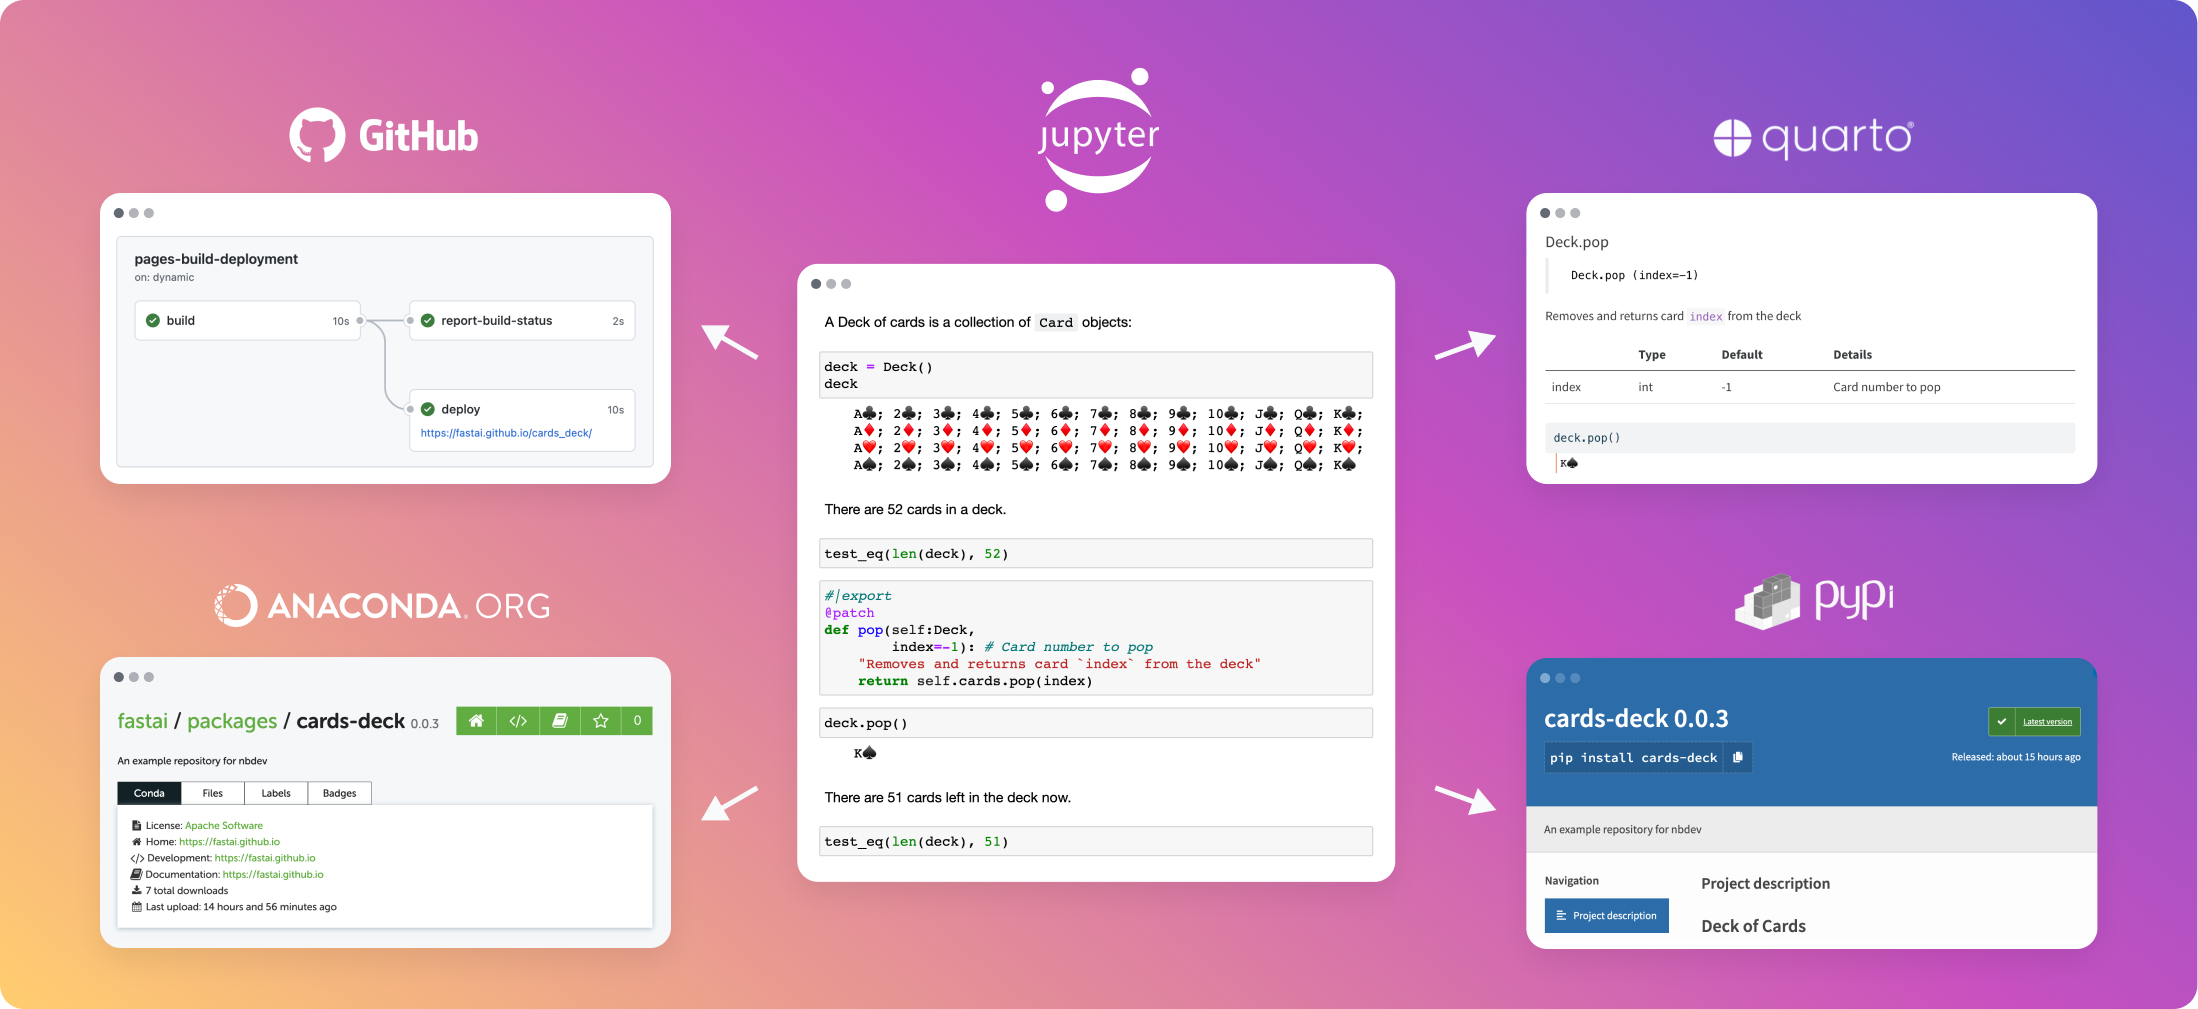
Write, test, document, and distribute software packages and technical articles — all in one place, your notebook.
craggy shadow
can anyone with a data science/math background help with my solution? im still a bit stuck on my code
wooden sail
craggy shadow
Your output
LinregressResult(slope=0.9992310659831274, intercept=-0.000197272669...
wdym by "off"? they're almost identical
craggy shadow
 wooden sail
estimators produce estimates based on random data observations, meaning they are THEMSELVES random variables
every single time you run this code you will get a different result, because there is random noise and the estimator takes that noise in its input
your first lesson in estimation theory 😛 you are not "solving" for the parameters, you are "estimating" them. estimates are random variables, so if the noise you observe changes, so does your estimate
what you got is correct to several orders of magnitude, you can't do any better
shell crest
rich olive
I have a sample of salaries. I want to compare that sub-sample to the same to se...
Sounds like a general question on sampling distribution identity. Not too sure what your 'sub-sample' is.
T-tests only measure differences in means, which isn't a very descriptive statistic for whole distributions
craggy shadow
@wooden sail i see, the grading system thinks otherwise lol, also i keep getting the same outputs when i run it but its wrong every time because of those last few digits
@wooden sail the grading process is automated
shell crest
wooden sail
your first lesson in estimation theory 😛 you are not "solving" for the paramete...
True for applied statistics (where you need to find params), but MLE is like 'the natural solution' for physical random systems
wooden sail
that's because of the seed you used
shell crest
shell crest
True for applied statistics (where you need to find params), but MLE is like 'th...
the likelihood ratios in physical randomness is like out of this world
wooden sail
craggy shadow
<@467435887236612106> i see, the grading system thinks otherwise lol, also i kee...
are you using a specific seed they gave you?
if you change the seed, the result will change
i have to say whoever wrote this task is not very good at this 😛
craggy shadow
Yeah so the seed which is set to user input was already given
shell crest
I think they set a seed behind the scenes
It's recommend you do not solve for the seed they use
wooden sail
you should contact the person that wrote this task, then. the error there is anyway comparable to machine epsilon
there are so many things wrong with how this task was designed 😛
craggy shadow

when i submit it, they enter the input for me 3 different times n compare the results
shell crest
Wait, they show the seed.....
Now it becomes a quest in reproducibility
I think Numpy has been relatively good in terms of not doing backward-version reproducibility changes
Trying on my Google colab reproduces the result under 'expected'
desert oar
wooden sail
there are so many things wrong with how this task was designed 😛
agreed 100%, i was just discussing this in a help channel
it sounds like the instructor is extremely lazy or incompetent or both
shell crest
IMO it's fine to use random seeds
But the grader needs to use some form of epsilon distance checking
Plus probably actually try to see if the final code runner has the same random sequence
Personally I've handled random-seed questions before, but I actively sought students who face reproducibility issues
craggy shadow
ok ill have to email my professor lol
desert oar
shell crest
But the grader needs to use some form of epsilon distance checking
that's the part i'm talking about, this is really not okay. the random seed stuff is not bothering me
wooden sail
if the prof was very serious about this, they couldn've estimated the statistics of the estimator and chosen a solid epsilon for this based on the variance of the estimator
this had an easy fix
either analytically using estimator lower bounds or numerically with monte carlo trials
 quaint loom
tame bison
is VPD a variable, or three variables?
quaint loom
tame bison
is VPD a variable, or three variables?
Its one variable. Thanks but I have got the help I need 😀If you don’t have anything to share^^
 rugged mist
any resource recommendations for computer vision?
tacit basin
rugged mist
any resource recommendations for computer vision?
Deep learning for CV i guess?
Fastai lessons on CV: 1,2,3,8
https://course.fast.ai/
A free course designed for people with some coding experience, who want to learn how to apply deep learning and machine learning to practical problems.
rugged mist
thanks
tacit basin
As a start, fastai 7 lesson course covers CV, NLP, tabular. There are more topics in CV like object detection, image generation etc, these are not covered in fastai part 1.
 void sail
Does an multivariate LSTM capture the relationship between the input sequences?
Example: does the lstm with 2 input sequences A and B, capture the relationship between A[key] and B[key] when processing the inputs?(even when A[key] and B[key] change positions in the sequences)
 earnest widget
Has anyone seen any of the linear algebra videos from this YT channel? Is it any good?
https://www.youtube.com/playlist?list=PLZHQObOWTQDPD3MizzM2xVFitgF8hE_ab

YouTube
A geometric understanding of matrices, determinants, eigen-stuffs and more.
void sail
earnest widget
Has anyone seen any of the linear algebra videos from this YT channel? Is it any...
if trolling lmao, if not, yes its considered the best by many
earnest widget
void sail
if trolling lmao, if not, yes its considered the best by many
Oh alright, does it teach enough of the concepts or do I need to study further elsewhere for more?
void sail
its enough in the general sense which is what you usually need. Another source which is nice and concise is: https://arxiv.org/pdf/1802.01528.pdf
earnest widget
Oh okay, I'll save this. Thanks.👍
 cinder schooner
Greetings, I'm looking for ressources to learn Pytorch. I never used It. Can any one recommend something?
 spare briar
what do you want to do with pytorch
craggy shadow
can someone please explain to me why this code is failing ?
9.6 LAB: Generating random numbers
Write a program that would generate 500 data points and create a linear regression model using the scipy.stats module.
Generate a numpy array, x, of 500 numbers evenly spaced between 0 and 100.
Generate another numpy array, noise, of 500 numbers from the normal distribution with a mean of 0 and standard deviation of 1.
Let y be the sum of the x and noise.
Create a linear regression model using x as the predictor variable and y as the response variable.
import numpy as np
import scipy.stats as st

# set seed to input
num = round(int(input()))
np.random.seed(num)

x = np.linspace(0,100,500) # randomly generate 500 numbers between 0 and 100 using the linspace function
noise = np.random.normal(0,1,500) # randomly generate 500 numbers from the normal distribution with mean = 0 and sd = 1

y = (x + noise)  # sum of x and noise

model = st.linregress(x,y) # create a linear regression model using scipy.stats

print(model)```my output: LinregressResult(slope=0.9992310659831274, intercept=-0.00019727266958113887, rvalue=0.9993984742634541, pvalue=0.0, stderr=0.0015537793998482148, intercept_stderr=0.08975242785858577)
Expected output
LinregressResult(slope=0.9992310659831275, intercept=-0.0001972726695882443, rvalue=0.9993984742634541, pvalue=0.0, stderr=0.001553779399848215
desert oar
cinder schooner
Greetings, I'm looking for ressources to learn Pytorch. I never used It. Can any...
The tutorial in the documentation is not bad
desert oar
craggy shadow
can someone please explain to me why this code is failing ?
i don't know what you expect to gain by reposting this question with total disregard for the fact that several people helped you with it yesterday
the answer is that you need to email your professor because your solution is correct and their grading code is incorrect
cinder schooner
desert oar
The tutorial in the documentation is not bad
I'm looking for something a little more exhaustif
desert oar
cinder schooner
I'm looking for something a little more exhaustif
are you looking to learn about machine learning in general, or pytorch specifically?
pytorch is a software library, often the best way to learn such things is to read the documentation and to look at other people's code that uses it
 whole dust
That's an thermodynamic or fluid dynamic equation?
quaint loom
whole dust
That's an thermodynamic or fluid dynamic equation?
Part of calculation of Evopotranspiration
cinder schooner
desert oar
are you looking to learn about machine learning in general, or pytorch specifica...
I'm an Ai master's student, I know things about the theory and have worked different projects in DL using keras. But now I will be looking for internships and to have a better chance I thought of specializing in either tensorflow or pytorch to add it as a skill in me resume
So i asked here and they told me pytorch would be better
desert oar
cinder schooner
I'm an Ai master's student, I know things about the theory and have worked diffe...
got it. describing your background is very helpful when asking questions like this.
in that case, i would definitely start with the pytorch docs, which are pretty good. i'm not an expert user myself so i don't have better advice than that. but between the docs, stackoverflow, and random blog posts, i'm able to hack my way through whatever i need to do.
cinder schooner
I can do that when I have a project to work on with pytorch. But the problem is i'm trying to become good in pytorch before getting to interviews so I would need a course or something. Thank you anyway for the advice
desert oar
cinder schooner
I can do that when I have a project to work on with pytorch. But the problem is ...
with your level of expertise & hands-on experience with keras already, i think you'd do fine by just using pytorch on some example/toy problems. mnist, some kaggle dataset, etc.
a course is probably overkill
imo it's much better to start interviewing and say "i have hands-on experience with keras and i've started messing around with pytorch"
especially for your first job out of school, nobody expects you to be an expert in everything. focus more on statistical and other principled methodology rather than learning more kinds of software
 unique flame
So if your train and validation consists of 70% and 30% of the total data, then for cross validation you should at least go for three folds right? Is there a reason you would go for four, five or more folds?
craggy shadow
@desert oarim not disregarding anything. Its not the same code exactly. I figured out that changing py num = (int(input())) to py num = round(int(input())) Gives me the desired results when i run the code locally but when i run it on zybooks which is my hw application its still wrong. So thats what i wanted to figure out, it may be due to a version difference but zybooks is running python 3 so im still unsure
 cyan drum
Anyone know how on matplot lib I would go about moving the results of this graph to the right, so im not getting that first tick outside of the graph range?

font = {'family' : 'Tahoma',
'size' : 8}
matplotlib.rc('font', **font)

blue, red, green = sns.color_palette("muted", 3)

x = xAxis
y = yAxis

xavg = xAxis
yavg = periodAverage

xavgRun = xAxis
yavgRun = runtimeAverage


fig, ax = plt.subplots()
ax.plot(x, y, color=blue, lw=0.75)
ax.plot(xavg, yavg, color=green, lw=0.75)
ax.set_xlabel(xLabel)
ax.set_ylabel(yLabel)
ax.set_title(title)
ax.plot(xavgRun, yavgRun, color=red, lw=0.75)
ax.set(xlim=(0, len(x) - 1), ylim=(min(yAxis), max(yAxis) + (max(yAxis)/2)), xticks=x)
plt.xticks(rotation=315)

ax.locator_params(axis="x", tight=True, nbins=8)
plt.rcParams['xtick.direction'] = 'in'
Current code
desert oar
unique flame
So if your train and validation consists of 70% and 30% of the total data, then ...
it's a tradeoff between having more data in each fold, and having more folds to obtain a better estimate of the sampling distribution
use as many folds as possible without making each training set too small
tacit basin
The more folds the more data in train set
desert oar
tacit basin
The more folds the more data in train set
oops i meant the test set
tacit basin
To the extreme where you have as many folds as data points
desert oar
exactly, leave one out is the extreme limit
tacit basin
It's more accurate but takes way more time
desert oar
 gentle hornet
Is mastering python enough?
gentle hornet
Is mastering python enough?
no. you need skill in math, statistics, data visualization, creative problem-solving, data cleaning/processing/manipulation, general software engineering, and whatever other considerations are relevant to your specific problem domain (eg computer vision, economics, medicine, et alia). usually people become experts in only a few of these categories, but still must develop intermediate level competence in the rest. most people whom you would consider "masters" of AI and ML have 10+ years of experience
of course, you can do a lot with introductory level knowledge! you could go from nothing to fit in your first model in as little as a couple of hours
but achieving mastery is a long process that involves deep study in several fields
mastery of python itself is a decade-long endeavor
aim for practical competence, not mastery
gentle hornet
desert oar
but achieving *mastery* is a long process that involves deep study in several fi...
Does University helps getting these skills or its all a personal thing and interest?
wooden sail
uni can help by giving you a framework, providing material and establishing a pace at which to learn even the stuff you're not excited about
when studying on your own, you need a great deal of dedication and responsibility to learn the stuff you don't like
misty flint
if youre interested in MLOps, this looks interesting https://zenml.notion.site/ZenML-s-Month-of-MLOps-Competition-Announcement-3c59f628447c48f1944035de85ff1a5f

ZenML on Notion
Welcome! ZenML is excited to be gearing up for a month of MLOps and we invite you to join in!
desert oar
gentle hornet
Does University helps getting these skills or its all a personal thing and inter...
i think the big value of university is being immersed for several years with other highly-motivated students in an environment where striving for high achievement and deep understanding is normal. grinding through homework assignments in the library with my classmates was probably one of the most educational things i did in school. it's also an opportunity to expose yourself to academic research and to surround yourself with good role models, as well as to seek out advice and mentorship.
i think some people really benefit from that kind of environment, other people can't stand it. it also depends a lot on the specific university.
 tall pewter
yeah its really important to work with other people, I'd never have been able to pass some of my really tough courses on my own, like sometimes you get the motivation to study alone but I find I can't count on it, much more reliable to do it with others
desert oar
a good university curriculum will push you hard enough to keep you moving forward, without being so hard that you lose confidence and give up. also it will expose to you a broader range of things than you might otherwise find in self-directed study.
desert oar
tall pewter
yeah its really important to work with other people, I'd never have been able to...
and this is also where professional networks come from! your homework buddy today might be a work colleague some day in the future, or might otherwise be a good connection.
 proven pier
So I'm having this obscure problem we're trying to solve. Essentially I'm managing low level firmware for a device. We're having inconsistent problems with some configurations, they'll work most of the time but sometimes fail. I am trying to debug some potential reasons this could be happening, besides also having read many data sheets.
I have an application that runs a bunch of different configurations per execution, this gives a good sample size of "unique" configurations I'm testing. I'm running this application about 100 times as well. When it runs, a bunch of data is logged based on what I programmed in, as well as if the thing fails or not.
With python I've done basic correlation but the results are inconclusive and I think it's because I'm doing linear correlation. Yes there's a lot of unique configurations, but specific values only change a quantized amount, so I almost feel as if they could all be treated categorically.
Any thoughts on that? I'm looking at Cramer's Correlation right now with those thoughts in mind. Not sure if maybe somebody here has basic guidance on what I should do to figure out if there's good reason some configurations will fail so inconsistently
tall pewter
proven pier
So I'm having this obscure problem we're trying to solve. Essentially I'm managi...
if it's low level, have you carefully triple checked the specs for the protocols? It's common to have difficult errors like that when data that is being transmitted for example happens to contain the "start of message" bytes. Often you need to specifically escape those values before sending
proven pier
tall pewter
if it's low level, have you carefully triple checked the specs for the protocols...
All of our serial comms have been unit tested and vetted out, shouldn't be the cause of any of the errors. Like testing register reads and such
First place to check is documentation/datasheets but it gets rough out here lol
tall pewter
another thing to consider which is entirely outside of programming is having a look at the transmissions with an oscilloscope, I've had issues before where HIGH/LOW drift just on the edge of part specs so it will work one moment and then a slight change of resistivity makes it not work the next
proven pier
Yeah those are awful. I am 100% certain that is not the issue though. Think of it like there's a state machine I'm interacting with, and that gives inconsistent results. The state machine is documented, but behind a lot of proprietary inner mechanisms. And the documentation is not crystal, although it is helpful
tall pewter
hmmm, I'm not sure. I come mainly from a robotics background rather than compsci so I'm not too sure about that state machine/correlation stuff, my approach at that point would be trying to analyse step responses and if at all possible trying to isolate inputs that cause issues (although it sounds like you've tried plenty of that already)
proven pier
Robotics that's super cool. I had a brief fascination with control theory back in college, but I didn't get to explore it much. That would be a fun area to go back into.
tall pewter
it is quite fun, very mathsy but it sits at the intersection of so many fields so you get a bit of everything (mechanical engineering, electronic engineering, computer science etc)
control theory especially is great for producing things that almost work by magic, in my advanced control theory class we simulated balancing double & triple pendulums which still feels like witchcraft haha
proven pier
Shit that's awesome.. you wouldn't happen to have any textbooks you'd recommend from your studies? I've been wanting to make an inverted pendulum for a while. And I enjoyed learning about modern control theory too. But it'd be cool to try that project out again
tall pewter
I'll have a look for you
 silk minnow
Hi guys
tall pewter
proven pier
Shit that's awesome.. you wouldn't happen to have any textbooks you'd recommend ...
I particularly liked Steve Brunton's book, he also made a corresponding series of lectures on youtube for part of it which I enjoyed
https://www.youtube.com/watch?v=Pi7l8mMjYVE&list=PLMrJAkhIeNNR20Mz-VpzgfQs5zrYi085m
the book's website is http://databookuw.com/

Overview lecture for bootcamp on optimal and modern control. In this lecture, we discuss the various types of control and the benefits of closed-loop feedback control.
These lectures follow Chapter 8 from:
"Data-Driven Science and Engineering: Machine Learning, Dynamical Systems, and Control" by Brunton and Kutz
Amazon: https://www.amazon.co...
DATA DRIVEN SCIENCE & ENGINEERING
silk minnow
I have a (probably stupid ) question regarding a curve fit in a small script that I try to write for work (irrelevant to coding). Could you please help me?
this is the set of data taken from site surveys ( raw data) and I want to imitate their equation and predict. I used curve_fit but I cannot fit it

there is any way to post my script here?
tall pewter
silk minnow
there is any way to post my script here?
if it's short you can surround the script with triple backticks ```
silk minnow
x = df["d1_d2"].values


y = df["E1"].values


defl_50 = (np.percentile(df['d1_d2'],50))
defl_15 = (np.percentile(df['d1_d2'],85))

# Exponential

def exponential(x,a6,b,a8):
    return  a6 *np.exp(b*x)+a8


p0=[1,1,1]

k,l = curve_fit(exponential, x, y,p0=p0,absolute_sigma=True,maxfev = 15000)

a6 = k[0]

b = k[1]

a8 = k[2]

expodata = exponential(x,a6,b,a8)```one thing to mention btw if it is for work one of the easiest way to do polynomial curve fitting one-off is to use excel trendlines like so:
 silk minnow
I know. I was doing it for years but I need to learn
something new 🙂
I was trying to automate my work more so I started the last weeks with python ( or at least I am trying )
tall pewter
is it that specific data it fails on or does the script not fit any data?
silk minnow
For a different dataset it was working. I tried to change some things, mainly to experiement and now its not working for set of data
tall pewter
hmm okay
any chance you could paste a csv of the data into https://pastebin.com/ for me and share the link? I'll try to set up a notebook with pandas and stuff and we can get it working
Pastebin
Pastebin.com is the number one paste tool since 2002. Pastebin is a website where you can store text online for a set period of time.
silk minnow
of course, one second to send you the link
Pastebin
Pastebin.com is the number one paste tool since 2002. Pastebin is a website where you can store text online for a set period of time.
silk minnow
tall pewter
hmm okay
I hope it is working
Here is the same script for a different dataset. The fit seems to be perfect for the exponential equation that I am using but

but for a smaller no. of raw data the results are wrong
silk minnow
No worries mate
as you can see I tried a lot of different function in order to see which one replicates best the relationship between the 2 variables ( any suggestion on the final decision will be appreciated too :))
tall pewter
hehe
I find polynomial is usually a good bet but there is high risk of overfitting the data
silk minnow
tried 2nd , 3rd etc power of polynomial
I know how to exclude the Linear relationship
( you cannot believe but if I exclude the data that seem to be a survey error, the relationship is close to be Linear in the reality)!
tall pewter
haha
tall pewter
another approach for choosing is thinking through the physics of the physical process, like in an ideal world without measurement error etc what would the distribution be, is there a nice exponential or log relationship or is the best we can do taylor approximation with higher and higher order polynomials
was this the error you were getting with the script?
 silk minnow
thats why I wrote a script for all of them to test them all
yes!
btu when I tried to rerun
I got results that they were avctually my initial hypothesis , the random 1,1,1 values
tall pewter
hmmm
I get that error each time
maybe the curve_fit function updates the p0 variable?
silk minnow
i added the maxfev =150000 ( i dont know what is it but I get it has something to do with the number of trials)
tall pewter
tall pewter
maybe the curve_fit function updates the p0 variable?
is the p0=[1,1,1] in the same notebook cell as the curve_fit call?
 tall pewter
hmm
 tall pewter
according to https://docs.scipy.org/doc/scipy/reference/generated/scipy.optimize.curve_fit.html if you don't provide p0 it will set them all to be 1 automatically
maybe best to do that so it's reproducible?

 tall pewter
hmm
wait maybe that makes sense
the exponential function you gave maybe only works for positive curvature?
let me think
what if it were
    return  a6 * np.exp(-b*x) + a8
``` instead? tall pewter
ok so I printed "l" and it's all infinity
as in the "l" that is output alongside k from the curve fit
so it won't converge with that
can you maybe do that exponential function I gave but with p0 defined as (1, 0, 1) instead? or (1, 1e-6, 1)?
 silk minnow
you are the best
tall pewter
glad to help 👍
silk minnow
You thing that with this initial p0 approach that I can predict all sets of data?
how you came up with this?
tall pewter
I was searching for negative exponential curve fitting and found this stack overflow answer https://stackoverflow.com/a/21421137/6045661

Stack Overflow
I have two NumPy arrays x and y. When I try to fit my data using exponential function and curve_fit (SciPy) with this simple code
#!/usr/bin/env python
from pylab import *
from scipy.optimize imp...
there's another answer on that same question that may also help, it talks about how the equation can be modified in case it's always centered on x=0
 tall pewter
yeah
silk minnow
I may change my script to something like this so I wont have any issues
Cool
Thanks alot mate. The community here is awesome.
Are you a data analyst/ eng?
tall pewter
I'm not actually, my field is robotics, although recently I've been doing some data analysis work for a power company while I'm studying for my masters degree
silk minnow
Cool. I guess you had a background in coding
tall pewter
yeah
silk minnow
Cool. I wish I knew earlier. Now I feeel so rusty and stiff but I try to learn new things
its never late 🙂
tall pewter
yep! honestly doing this data work has taught me the opposite way haha
I was always trying to do things with code when sometimes the easiest solution is excel
both useful skills to have haha
silk minnow
ahhahah. excel is working for me as an engineer for years, but the thing is to automate a lot of those useless calculations
I thought that with python I can escape not the procedure, the repetitive procedure that just waste my time
proven pier
I havent touched excel but a couple times for my job
But when I do, I usually use python to work with it. I'm sure there's benefits for using the app
silk minnow
proven pier
I havent touched excel but a couple times for my job
thats the correct approach
tall pewter
haha stelercus, yes pandas is the way, for me it was just faffing about with matplotlib trying to get plots looking just right for the business people, making them pretty is easier with excel
serene scaffold
tall pewter
haha stelercus, yes pandas is the way, for me it was just faffing about with mat...
faffing with matplotlib is like faffing with covid.
silk minnow
and I cannot understand that why my colleagues cannot see this
proven pier
Uhh everytime I use matplotlib I hate myself. Only a couple times did I make some "cool" graphs
serene scaffold
matplotlib is really annoying 
lapis sequoia
Does SVD reduce dimensions of a matrix?
 proven pier
I wonder what it's like to have that matplotlib intuition. Like the whole world makes sense to those people
desert oar
lapis sequoia
Does SVD reduce dimensions of a matrix?
not inherently, but you can use it for dimension reduction by "chopping off" some columns from the result
proven pier
This was something I made with matplotlib lol. I don't have it labeled here, but this is like a recursive dependency tracker for C libraries
 lapis sequoia
We were dealing with a very big sparse matrix. And teacher said we can use svd to reduce computational cost b
lapis sequoia
proven pier
This was something I made with matplotlib lol. I don't have it labeled here, but...
Smart
Didn't know matplotlib does normal graphs too. I thought it's just for statistical graphs.
proven pier
lapis sequoia
Didn't know matplotlib does normal graphs too. I thought it's just for statistic...
I think I required another pip module for the network graph
tall pewter
lapis sequoia
We were dealing with a very big sparse matrix. And teacher said we can use svd t...
you can use svd to order the dimensions along which has the most impact, you can take the first few and get rid of the rest
proven pier
But technically works with matplotlib
wooden sail
hmm the SVD is of order ~O(n^3) for a square matrix
depending on how sparse the matrix is and how naively you treat it, the most efficient way might be to just use a sparse COO matrix
the SVD is more for rank reduction than for dealing with sparse mats
proven pier
Think the module was called networkx
worthy hollow
hey there i have a problem :
desert oar
serene scaffold
faffing with matplotlib is like faffing with covid.
matplotlib is like git. the core data model is very sensible and practical, but it's wrapped up in several layers of ugly bad ideas. and much like git, the more you understand about it, the easier it is to work with.
worthy hollow
**i use this code to get my .csv date and open them as dataframe by their file name: **```py
Retrieve the path to the current folders
current_path = os.getcwd()
Get the path to the csv file folder - in this case the 'data' file
csv_path = os.path.join(current_path)
A EXPLIQUER ICI
for file in os.listdir(csv_path):
fd = pd.read_csv(os.path.join(csv_path, file))
globals()[file.rpartition(".")[0]] = fd
but when i want to deploy my code in a Web App
it gives me this error:
IsADirectoryError: This app has encountered an error. The original error message is redacted to prevent data leaks. Full error details have been recorded in the logs (if you're on Streamlit Cloud, click on 'Manage app' in the lower right of your app).

Traceback:
File "/home/appuser/venv/lib/python3.9/site-packages/streamlit/runtime/scriptrunner/script_runner.py", line 556, in _run_script
    exec(code, module.__dict__)
File "/app/streamlit/app.py", line 24, in <module>
    fd = pd.read_csv(os.path.join(csv_path, file))
File "/home/appuser/venv/lib/python3.9/site-packages/pandas/util/_decorators.py", line 311, in wrapper
return func(*args, **kwargs)```i've set all my .csv files into github tho in the same area than the app.py
 worthy hollow
**i use this code to get my .csv date and open them as dataframe by their file n...
worthy hollow
worthy hollow
**i use this code to get my .csv date and open them as dataframe by their file n...
anyone has a clue how could I adapt this code to my github repo so i can deploy my web app?
serene scaffold
IsADirectoryError: This app has encountered an error. The original error message is redacted to prevent data leaks. Full error details have been recorded in the logs (if you're on Streamlit Cloud, click on 'Manage app' in the lower right of your app).
One wonders what the full error message from the error logs is.
worthy hollow
here's the full error message
serene scaffold
looks like you're missing the end of it.
worthy hollow
IsADirectoryError: [Errno 21] Is a directory: '/app/streamlit/.git'
this is the critical information for solving the problem.
worthy hollow
IsADirectoryError: [Errno 21] Is a directory: '/app/streamlit/.git'

2022-09-12 19:14:58.965 Uncaught app exception

Traceback (most recent call last):

  File "/home/appuser/venv/lib/python3.9/site-packages/streamlit/runtime/scriptrunner/script_runner.py", line 556, in _run_script

    exec(code, module.__dict__)

  File "/app/streamlit/app.py", line 24, in <module>

    fd = pd.read_csv(os.path.join(csv_path, file))

  File "/home/appuser/venv/lib/python3.9/site-packages/pandas/util/_decorators.py", line 311, in wrapper

    return func(*args, **kwargs)

  File "/home/appuser/venv/lib/python3.9/site-packages/pandas/io/parsers/readers.py", line 586, in read_csv

    return _read(filepath_or_buffer, kwds)

  File "/home/appuser/venv/lib/python3.9/site-packages/pandas/io/parsers/readers.py", line 482, in _read

    parser = TextFileReader(filepath_or_buffer, **kwds)

  File "/home/appuser/venv/lib/python3.9/site-packages/pandas/io/parsers/readers.py", line 811, in __init__

    self._engine = self._make_engine(self.engine)

  File "/home/appuser/venv/lib/python3.9/site-packages/pandas/io/parsers/readers.py", line 1040, in _make_engine

    return mapping[engine](self.f, **self.options)  # type: ignore[call-arg]

  File "/home/appuser/venv/lib/python3.9/site-packages/pandas/io/parsers/c_parser_wrapper.py", line 51, in __init__

    self._open_handles(src, kwds)

  File "/home/appuser/venv/lib/python3.9/site-packages/pandas/io/parsers/base_parser.py", line 222, in _open_handles

    self.handles = get_handle(

  File "/home/appuser/venv/lib/python3.9/site-packages/pandas/io/common.py", line 702, in get_handle

    handle = open(

IsADirectoryError: [Errno 21] Is a directory: '/app/streamlit/.git'
``` yup sorry i didnt saw it at first sightdo you know what to do now?
tall pewter
worthy hollow
**i use this code to get my .csv date and open them as dataframe by their file n...
You have a folder in your current working directory called .git that it is trying to open as a file, os.listdir gives both folders and files. You'll want to check if it's a file before running pd.read_csv on it
worthy hollow
tall pewter
You have a folder in your current working directory called .git that it is tryin...
i don't really got you right, what should I do then? (sorry i'm really a pure noob with git stuff)
 zinc obsidian
hey guys so im really in a tight spot. So this is about data science. I already train and test my model and its currently sitting in an ipynb file. it basically classifies images by taking a path of an image. this part all works and is graet
but thing is, it needs to be a GUI app, and im VERY confused on how to turn it in to an app with a .ipynb file
would be grateful if someone could help here or by private messaging me
 gusty wedge
When I change a little bit of code, I first to have to stop the previous gui in the terminal, then recomile the code using py python matplotlib.py and then the gui starts again, Isn't there someway I can have live preview so that after saving, I can see the results in the gui without the need to stop and recompile
tall pewter
worthy hollow
i don't really got you right, what should I do then? (sorry i'm really a pure no...
you may be struggling to understand what I mean because by default the .git folder is a hidden folder. Search up how to view hidden folders in your os of choice
Then you will see, next to all of your data files you have this .git folder it is trying to read as a CSV file
worthy hollow
tall pewter
you may be struggling to understand what I mean because by default the .git fold...
it shall bypass this error right?
tall pewter
Yes that would be one solution
gusty wedge
gusty wedge
When I change a little bit of code, I first to have to stop the previous gui in ...
.
proven pier
Okay gui's also make me hate what I'm working on lol
It's a neat system, but so particular. Do you use Qt
gusty wedge
proven pier
It's a neat system, but so particular. Do you use Qt
What is Qt? Any full form? I'm new and not into data science, started matplotlib to export graphs to latex
gusty wedge
proven pier
Okay gui's also make me hate what I'm working on lol
So this means, there isn't any any way to live see the changes
proven pier
gusty wedge
What is Qt? Any full form? I'm new and not into data science, started matplotlib...
I was talking about a GUI framework, you don't need a gui to do data science. It's a very fancy framework of making graphical interfaces you can display things in, write things in, click buttons on, etc
gusty wedge
proven pier
I was talking about a GUI framework, you don't need a gui to do data science. It...
I am using tk
zinc obsidian
proven pier
I was talking about a GUI framework, you don't need a gui to do data science. It...
hey guys so im really in a tight spot. So this is about data science. I already train and test my model and its currently sitting in an ipynb file. it basically classifies images by taking a path of an image. this part all works and is graet
but thing is, it needs to be a GUI app, and im VERY confused on how to turn it in to an app with a .ipynb file
would be grateful if someone could help here or by private messaging me
proven pier
oof, I worked on that to start with as well. Tkinter is rough around the edges lol
gusty wedge
proven pier
oof, I worked on that to start with as well. Tkinter is rough around the edges l...
does QT shows live preview on save?
proven pier
gusty wedge
does QT shows live preview on save?
I see what you mean now. I never went deep enough looking for that sorta capability. So I don't know, maybe if you mixed it with python jupiter or something. Also, I hear web based gui's are another good option to try. Honestly learning markup will be good for you at some point
gusty wedge
proven pier
I see what you mean now. I never went deep enough looking for that sorta capabil...
markup?
gusty wedge
proven pier
markdown* language I think. Like XML, HTML
So You are saying I should learn a markdown lanugage instead of latex?
proven pier
HTML: HyperText Markup Language
Well only you know what's best for you. Whatever you need to get your job done
serene scaffold
gusty wedge
So You are saying I should learn a markdown lanugage instead of latex?
one usually uses latex for academic/technical papers. is that what you plan to do, or no?
gusty wedge
serene scaffold
one usually uses latex for academic/technical papers. is that what you plan to d...
I am using it for taking notes😅
serene scaffold
gusty wedge
I am using it for taking notes😅
up to you, then. I take notes on a handwriting tablet.
gusty wedge
proven pier
Well only you know what's best for you. Whatever you need to get your job done
Hmm!!
proven pier
Sounds like it's what you want to learn, part of the fun is learning what you like
gusty wedge
Another thing could you guys help me with centering axis in matplotlib
gusty wedge
proven pier
Sounds like it's what you want to learn, part of the fun is learning what you li...
yeah!! just for fun
gusty wedge
serene scaffold
up to you, then. I take notes on a handwriting tablet.
My handwriting sucks that is why
another reason is i like typing on keyboard
serene scaffold
gusty wedge
another reason is i like typing on keyboard
as opposed to a typewriter? 😄
I find I don't retain the information as well when I type notes, but again, personal preference.
proven pier
serene scaffold
as opposed to a typewriter? 😄
I find I don't retain the information as well wh...
For school, that was me. But working on a computer, I prefer to be able to reference my notes on the same screen I'm doing work on
Maybe more theoretical stuff pen and paper would make more sense though.
I like making flowcharts though which is CAD lol
proven pier
gusty wedge
Another thing could you guys help me with centering axis in matplotlib
sorry, I really only know matplotlib when I work on it
And right now the only work I'm doing with it is calling pandas' histogram function
gusty wedge
serene scaffold
as opposed to a typewriter? 😄
I find I don't retain the information as well wh...
I don't think they have support for math🙃
gusty wedge
proven pier
sorry, I really only know matplotlib when I work on it
Np
stackoverflow is showing very old answers which doesn't seem to work
serene scaffold
so sue them. LOL!
gusty wedge
serene scaffold
so sue them. LOL!
I really want to !! It sucks when you ask questions there
they just keep downvoting
serene scaffold
gusty wedge
they just keep downvoting
you might want to rethink your technique. the point of stack overflow is to create a catalog of questions and answers. if your question is too specific to you, it's not contributing to that catalog.
 shrewd grove
Ive heard of a dude, whom posted corporate source code on stackoverflow, asking for "help".
his manager cared about karma, so he played with him for a day or two before "letting him go".
 wooden forge
Hey there, simple question, I get the error cannot assign to f-string expression while doing this python for i in range(n): f"dot{i}" = ax.plot(inter1[i][0],inter1[i][1],c='black',marker='o')
I'd like to know how to use string formating to assign a value to a variable I want to create with a certain name with a formating, thanks in advance!
desert oar
wooden forge
Hey there, simple question, I get the error `cannot assign to f-string expressio...
- this isn't specific to data science
- this isn't possible*, don't bother trying
- use a dict or list to store multiple things, not a bunch of individual variables
* it's technically possible, but for the sake of keeping you away from doing things you aren't supposed to be doing, i won't tell you how. trust me, you'll thank me later.
wooden forge
desert oar
1) this isn't specific to data science
2) this isn't possible\*, don't bother tr...
omg my bad I thought I was in #python-discussion I'm so sorry
desert oar
i saw matplotlib so i figured i'd at least mention it. although you're probably better off asking here than in python-general because i don't go there but i hang out here 😉
wooden forge
Yeah I get it
well thanks then I'll try to figure out how to do that without f-string lol
desert oar
wooden forge
well thanks then I'll try to figure out how to do that without f-string lol
you can use an f-string, but use it as a dict key
plot_elements = {}
for i in range(n):
    plot_elements[f"dot{i}"] = ax.plot(inter1[i][0],inter1[i][1],c='black',marker='o')
it's as easy as that. do you know what a dict is?
wooden forge
yes yes don't worry ^^
 frank oriole
if I'm using spacy to analyze common words in a data set but the data set is a list of strings, should I just flatten the list of strings into one big string of words?
shrewd grove
gents, i am reading a book - "Deep learning for vision systems" - and it shows implementations of LeNet, AlexNet & VGGNet in keras. I noticed they are all similar & all using combo of convolution & pooling followed by fully-connected layers. The difference is in the params of these layers. Am I missing something or is the book oversimplifying it?
lapis sequoia
Is it super easy to get 100% accuracy in the Iris dataset? Just trying it out for the first time(used KNN) and got 100%, not sure how to validate if my predictions are correct or if this dataset really is that easy
this was my code: https://pastebin.com/wKyxTEPD
Pastebin
Pastebin.com is the number one paste tool since 2002. Pastebin is a website where you can store text online for a set period of time.
spare briar
shrewd grove
gents, i am reading a book - "Deep learning for vision systems" - and it shows i...
Nope you’re right, they are conceptually the same. But the details turn out to be important to making them work reliably, consistently
When you make the models ‘deep’ they become unstable in their optimization until you apply certain tricks
shrewd grove
spare briar
Nope you’re right, they are conceptually the same. But the details turn out to b...
are the tricks "theory before practice" or "practice before theory"?
plush jungle
I'm training a dcgan and it's always blurry, so I did a control to see if it could learn a single image and this is what I got
spare briar
they originated with practice before theory, but we now understand how they work/why they are important
plush jungle
 spare briar
examples are residual connections, batchnorm, relu activation, small kernel sizes
these are not just tricks that apply in one circumstance but general principles applied in many models once you understand how they work
plush jungle
is there some explanation for why this is happening? on one image it should very quickly converge to produce the original image pixel for pixel if I understand gans right
shrewd grove
I am still puzzled on one thing. They did show how an end-result with highlighting regions-of-interest and potential guesses for detection. Not really sure how it works.
spare briar

arXiv.org
We propose a technique for producing "visual explanations" for decisions from
a large class of CNN-based models, making them more transparent. Our approach -
Gradient-weighted Class Activation...
these methods are actually very problematic and can be misleading. there is a big literature about visual interpretations of these models (and it remains problematic)
shrewd grove
So if I were to take a mnist dataset and combo them up into "strings" on image... Would it be very difficult to take on a project to separate individual characters?
spare briar
shrewd grove
So if I were to take a mnist dataset and combo them up into "strings" on image.....
you would not use a pure cnn model, their assumption is a single class for the whole image
but yes with some details it is possible to detect and classify each character
and have the model highlight the character https://arxiv.org/abs/2104.14294
arXiv.org
In this paper, we question if self-supervised learning provides new
properties to Vision Transformer (ViT) that stand out compared to convolutional
networks (convnets). Beyond the fact that...
arXiv.org
State-of-the-art object detection networks depend on region proposal
algorithms to hypothesize object locations. Advances like SPPnet and Fast R-CNN
have reduced the running time of these...
lapis sequoia
I have a question, how can I print each predicted value and each actual value for this machine learning model I'm using? I would also like to see the input for each prediction preferably.
The very generic code if someone wants to see it:
X_train, X_test, y_train, y_test = train_test_split(X, y, test_size=0.2)
model = KNeighborsClassifier()
model.fit(X_train, y_train)
prediction = model.predict(X_test)
accuracy = accuracy_score(y_test, prediction)
print(accuracy)
Thanks
tidal bough
well, you can e.g. do
for x, y_pred, y_correct in zip(X_test, prediction, y_test):
    print(x, y_pred, y_correct)
probably limit that loop to some number of iterations though; I doubt you want to see every single test point :p
lapis sequoia
Of course, makes sense thanks I'll try that
I think that isn't working, I get data which isn't making sense to me
this is what it looks like
https://prnt.sc/IE4NdlQlUC8f
 tidal bough
what's not making sense here?
worthy hollow
hey guys i have a quick question
i have a dataframe like this:
Date    Earth    Mer    Ven    Mar    Jup    Sat    Ura    Nep    Plu
0    13/09/2022    350.52    319.26    145.44    28.51    2.46    322.82    46.27    354.0    297.62
1    13/09/2022    21.0 | Pi    19.0 | Aq    25.0 | Le    29.0 | Ar    2.0 | Ar    23.0 | Aq    16.0 | Ta    24.0 | Pi    28.0 | Cp
2    31/10/2008    4992.25    20683.36    8115.159999999996    2673.1399999999994    425.3600000000001    158.89999999999998    55.079999999999984    30.689999999999998    27.00999999999999
3    31/10/2008    13.0 | 312.0    57.0 | 163.0    22.0 | 195.0    7.0 | 153.0    1.0 | 65.0    0.0 | 159.0    55.0 | 55.0    0.0 | 31.0    0.0 | 27.0
4    01/03/2009    4927.439999999999    20462.690000000002    8013.309999999998    2638.4799999999996    419.8800000000001    156.68000000000006    54.39999999999998    30.30000000000001    26.639999999999986
5    01/03/2009    13.0 | 247.0    56.0 | 303.0    22.0 | 93.0    7.0 | 118.0    1.0 | 60.0    0.0 | 157.0    54.0 | 54.0    0.0 | 30.0    0.0 | 27.0
6    22/05/2010    4429.380000000001    18394.08    7205.019999999997    2369.2699999999986    375.21000000000004    139.48000000000002    48.98000000000002    27.25    23.710000000000008
7    22/05/2010    12.0 | 109.0    51.0 | 34.0    20.0 | 5.0    6.0 | 209.0    1.0 | 15.0    0.0 | 139.0    49.0 | 49.0    0.0 | 27.0    0.0 | 24.0
8    29/11/2013    3163.260000000002    13090.929999999993    5143.8399999999965    1687.3499999999985    260.1400000000003    97.86000000000001    35.129999999999995    19.47    16.50999999999999
9    29/11/2013    8.0 | 283.0    36.0 | 131.0    14.0 | 104.0    4.0 | 247.0    0.0 | 260.0    0.0 | 98.0    35.0 | 35.0    0.0 | 19.0    0.0 | 17.0
10    17/12/2017    1704.9500000000007    7051.459999999992    2772.8299999999945    921.0999999999985    145.01000000000022    52.75    19.110000000000014    10.530000000000001    8.669999999999987
and as you can see, in some row there is a lot of decimals value
i can't manage to round them or delete those decimals
anyone have a clue?
serene scaffold
worthy hollow
```py
Date Earth Mer Ven Mar Jup Sat Ura Nep Plu
0 ...
if you're going to post dataframes as text (and I require people to do this before I consider helping them), make sure that each value is delimited the same way. this can't be automatically parsed.
question is, do you want to actually overwrite the existing value with a less precise value, or do you just want fewer decimals to be displayed?
worthy hollow
serene scaffold
question is, do you want to actually overwrite the existing value with a less pr...
i just want like .round(1) just one decimal
worthy hollow
serene scaffold
if you're going to post dataframes as text (and I *require* people to do this be...
and sorry, its because there is too many entries
let me try to adapt it wait
worthy hollow
serene scaffold
if you're going to post dataframes as text (and I *require* people to do this be...
i tried to copy/paste it on visual and it looks fine?
 serene scaffold
worthy hollow
i just want like .round(1) just one decimal
serene scaffold
worthy hollow
i just want like .round(1) just one decimal
but are you asking how to overwrite or display?
worthy hollow
serene scaffold
but are you asking how to *overwrite* or *display*?
overwrite not display
bcuz i need to export the data in .csv file
in a clear way
serene scaffold
!docs pandas.DataFrame.to_csv
arctic wedgeBOT
DataFrame.to_csv(path_or_buf=None, sep=',', na_rep='', float_format=None, columns=None, header=True, index=True, index_label=None, mode='w', encoding=None, compression='infer', ...)```
Write object to a comma-separated values (csv) file.Look at the part for float_format=
serene scaffold
worthy hollow
shall i put STR then
you don't need to paste any more data or code into the chat. just click on the link to the docs and read about how to use the float_format parameter.
serene scaffold
worthy hollow
i tried to copy/paste it on visual and it looks fine?
the reason the text you provided originally is bad is because if I wanted to copy and paste it into some code, I'd have to reformat it by hand to be able to use it. A picture of the same text is strictly worse.
worthy hollow
serene scaffold
the reason the text you provided originally is bad is because if I wanted to cop...
ah sorry wasnt aware
hcc.to_csv(os.path.join('STREAMLIT//data//test','helio_main.csv'), index= False, float_format=str)
``` tried this way and give the same resultstr is the type that the value for float_format needs to belong to. you're not supposed to pass str itself. but admittedly, these docs don't give an example of how to use it correctly. let me find you one.
worthy hollow
serene scaffold
the reason the text you provided originally is bad is because if I wanted to cop...
Pastebin
Pastebin.com is the number one paste tool since 2002. Pastebin is a website where you can store text online for a set period of time.
should be fine this way?
worthy hollow
serene scaffold
`str` is the type that the value for `float_format` needs to belong to. you're n...
ok thx
serene scaffold
worthy hollow
ok thx
the only format I'll accept is print(df.to_dict()) and it's variants. usually, print(df.head().to_dict('list')) is sufficient. but that doesn't matter, at this point.
@worthy hollow take a look at the answer for this question: https://stackoverflow.com/questions/12877189/float64-with-pandas-to-csv
Stack Overflow
I'm reading a CSV with float numbers like this:
Bob,0.085
Alice,0.005
And import into a dataframe, and write this dataframe to a new place
df = pd.read_csv(orig)
df.to_csv(pandasfile)
Now this
worthy hollow
serene scaffold
<@192947464817475584> take a look at the answer for this question: https://stack...
well sadly
both py float_format='%.3f' & py float_format='%g'
didnt change anything
Stack Overflow
Consider the following code:
0.1 + 0.2 == 0.3 -> false
0.1 + 0.2 -> 0.30000000000000004
Why do these inaccuracies happen?
i see that it is a general problem in computer science community regarding round number precision
but I don't find a similar case or at least a working answer on stack overflow
craggy shadow
can anyone help with this monte carlo simulation using buffons needle ?
9.7 LAB: Buffon's needle
Write a computer program that finds an approximation for pi using the Buffon's needle simulation as described in the animation and participation activity. The program should take in an input value for the seed and output the approximation for pi.
If the input for the seed is:
123
Then the output should be:
3.178134
import math as mt
import random as rand # import the math and random modules

# sets seed to input
num = int(input())
rand.seed(num)

hits = 0

for i in range(10000):
    theta = rand.uniform(0,180)  # randomly generate an angle from 0 to 180 degrees
    D = rand.uniform(0.0, 0.5) # randomly generate a number from 0 to 0.5
    if D <= 0.5*mt.sin(theta) : # write condition for the needle hitting the line before the :
        hits += 1

approximation = 2*(10000/hits) # write a fromula for the approximation of pi

print(f'{approximation:.6f}')
Input
123
Your output
6.295247
Expected output
3.178134
 stuck socket
is there any different betwen usin ```py
train, val = train_test_split(df, test_size=0.23, shuffle=True)
and train[features], train['target'], val[features], val['target']
v/s
```py
train_x, val_x, train_y, val_y = train_test_split(X,y, test_size=0.23, shuffle=True)
??
serene scaffold
stuck socket
is there any different betwen usin ```py
train, val = train_test_split(df, test_...
Not that I know of.
plush jungle
does anyone know why my standard out of the box pytorch dcgan is not able to learn a dataset of a single image?

does it have something to do with the learning rate or something?
or is the discriminator learning too fast for the generator to catch up or something like that?
with a dataset of one image, it should be trivial for it to overfit on that image, right?
shell crest
Anyone able to run Stable Diffusion on Google Colab free without HuggingFace?
I can't even tell if I'm running into out-of-RAM error, but it could be
 ripe badger
Can anyone help me fix this openCV error; error: (-2:Unspecified error) The function is not implemented. Rebuild the library with Windows, GTK+ 2.x or Cocoa support. If you are on Ubuntu or Debian, install libgtk2.0-dev and pkg-config, then re-run cmake or configure script in function 'cvShowImage'? I have reinstalled opencv countless times and can't get it to work :I
 silent mesa
im using something like this to fit a [524288 list to a 1 var] data but im getting the same predicted values now

any idea how to fix this?
the range of outputs should be 60 to 100
this is the output
 stuck socket
serene scaffold
Not that I know of.
stuck socket
serene scaffold
Not that I know of.
no difference at all? thx bro
 whole monolith
how i handle million data in python in a short time if i don't have GPU?
plush jungle
whole monolith
how i handle million data in python in a short time if i don't have GPU?
you have any friends who work at google by any chance?
lapis sequoia
whole monolith
how i handle million data in python in a short time if i don't have GPU?
The trick is not to handle it yourself but to let your computer do it
whole monolith
plush jungle
you have any friends who work at google by any chance?
no, i don't have friend like that.
plush jungle
do you have money?
you can usually pay to use a company's cluster if you have money
whole monolith
lapis sequoia
The trick is not to handle it yourself but to let your computer do it
in pandas i read csv file with 10-12 million rows and i need 1 minute time to complete process.
shell crest
whole monolith
how i handle million data in python in a short time if i don't have GPU?
Does google Colab work for you?
shell crest
shell crest
Anyone able to run Stable Diffusion on Google Colab free without HuggingFace?
I ...
I can now do so via https://github.com/basujindal/stable-diffusion, so I think there should be other ways as well
 wet shard
how should I go about finding the coordinates of the centers of these stones? mainly the ones with the name above
I have the coordinates of every white text, so I could narrow down the search, but then how should I proceed? (ideally with opencv)
 gusty wedge
import matplotlib as mpl
import matplotlib.pyplot as plt
import numpy as np
fig, ax = plt.subplots()
ax.plot([1, 2, 3, 4], [1, 4, 2, 3]);  # Plot some data on the axes.
plt.tight_layout()

plt.show()```Lsp Pyright is showing this error for line 5 "cannot access member "plot" for type "ndarray", but why? I have copied code from the docs and it is also compiling without any errorAnyway I can suppress the wrong errors?
Does these errors occur for you?
wooden sail
the code as you wrote it works for me
gusty wedge
wooden sail
the code as you wrote it works for me
It works for me aswell but Idk why Lsp (Language server protocal) is showing disgnostic errors
Which editor are you using?
wooden sail
ah i hadn't seen the part about pyright, i don't use that
gusty wedge
wooden sail
ah i hadn't seen the part about pyright, i don't use that
Which Lsp do you use?
Or editor?
wooden sail
spyder, micro, sublime, ipython, python -i
works fine on all of those
though note that of all of those, only spyder has linting
gusty wedge
have you done any specific setttings on sublime becasue I think it uses the same lsp
wooden sail
nope
gusty wedge
Ok thanks for your time
gusty wedge
The graph shows alternate tick labels like 4,2,0, how do I show all the labels between -5 and 5?
I have set the limit
ax.set_xlim([-5, 5])
ax.set_ylim([-5, 5])```you can use this instead https://matplotlib.org/stable/api/_as_gen/matplotlib.axes.Axes.set_xticks.html since xlim and ylim only set the limits
gusty wedge
wooden sail
you can use this instead https://matplotlib.org/stable/api/_as_gen/matplotlib.ax...
am I supposed to add them like this?
ax.set_xticks([-6, -5, -4, -3, -2, -1, 0, 1, 2, 3, 4, 5, 6])
you have to pass the locations and the labels
ax.set_xticks([list of floats with locations], [list of strings to be used as labels])
gusty wedge
Ok thanks
 echo scaffold
PyTorch vs TensorFlow pls? 😄
gusty wedge
echo scaffold
PyTorch vs TensorFlow pls? 😄
"It depends" answer is always this 🙃 btw i haven't used any
desert oar
echo scaffold
PyTorch vs TensorFlow pls? 😄
people i think find torch easier to use and learn, but if you go with tensorflow at least start with keras
cinder schooner
Greetings everyone. I don't know if i'm asking the question in the right section as I didn't find a computer vision one (please guide me otherwise). I'm working for the first time on edge detection on microscope images of starch granules. I don't know where to start, what to try first so I thought maybe someone here can guide me as to what to try or look for first or where to begin. I can't use AI models as the superviser provided me with only one image to begin with and told me I needed to "code" edge detection so I thought of CV algorithms maybe using openCV or something. Any input as to where to start would be very helpful. Thank you
serene scaffold
cinder schooner
Greetings everyone. I don't know if i'm asking the question in the right section...
that question is fine for this channel, but you might try #media-processing
cinder schooner
serene scaffold
that question is fine for this channel, but you might try <#971142229462777926>
Okay thank you
echo scaffold
@gusty wedge , @desert oar Yeah, these answers are both great. I believe Tensor it is, I took a look at Keras and got hands on some Tensor projects, but the main question is that which one is more flexible. That I believe it is TensorFlow, but wasn't sure about that.
I also plan to launch my hardware and try to keep up a persistent model in future so I need right choices from the start as I intend to expense thousands of hours.
 raven quest
i want to ask something how to remove 2 element in 1 statement thanks
 serene scaffold
raven quest
i want to ask something how to remove 2 element in 1 statement thanks
serene scaffold
raven quest
i want to ask something how to remove 2 element in 1 statement thanks
Hello, please don't ask people to read screenshots of text. Here's how to share code:
!code
arctic wedgeBOT
Here's how to format Python code on Discord:
```py
print('Hello world!')
```
These are backticks, not quotes. Check this out if you can't find the backtick key.
raven quest
oh oke thanks
shrewd grove
Just remove the number from your del.
serene scaffold
shrewd grove
Just remove the number from your del.
the problem is more significant. it looks like they intended to create a dict and did not.
shrewd grove
Ouch, true.

In this Python dictionaries tutorial, you'll cover the basic characteristics and learn how to access and manage dictionary data. Once you have finished this tutorial, you should have a good sense of when a dictionary is the appropriate data type to use, and how to do so.
Realpython suggests using a pop. Wonder why
raven quest
        "chill zone", 20.0, "bedroom", 10.75,
         "bathroom", 10.50, "poolhouse", 24.5,
         "garage", 15.45]

# remove the element "bathroom" dan 10.50 in 1 statement code


print(areas)```do you understand the difference between lists and dicts?
raven quest
i know but just little
serene scaffold
raven quest
i know but just little
you needed to use a dict.
areas = {'hallway': 11.25, 'kitchen': 11.0}
- dicts use curly braces
{}instead of square brackets[]. - the key and the value are separated by a colon
:, and each key-value pair is separated by a comma,
do you know what areas['hallway'] would return?
raven quest
ooohh i seee
desert oar
echo scaffold
<@726085794414198924> , <@389497659087650836> Yeah, these answers are both grea...
if you want to do on-device inference, i think tensorflow is considered better because of tensorflow lite
echo scaffold
desert oar
if you want to do on-device inference, i think tensorflow is considered better b...
More like private hw servers. 😄
 mint palm
For training my model my professor offers university gpu.
He has asked for my ssh key, On generating it shows private key in text file. Is it ok or no?
 haughty marsh
what's a good general algorithm for early stopping? Is it something like if maximum validation accuracy hasnt improved in the last 10 epochs?
gusty wedge
is there a better way to do this in matplotlib? ```python
ax.set_xticks([-5, -4, -3, -2, -1, 0, 1, 2, 3, 4, 5],
['-5', '-4', '-3', '-2', '-1', '', '1', '2', '3', '4', '5'])
ax.set_yticks([-5, -4, -3, -2, -1, 0, 1, 2, 3, 4, 5],
['-5', '-4', '-3', '-2', '-1', '', '1', '2', '3', '4', '5'])
Ranges ?
 ebon widget
Hey peeps
Wanna learn mathematics from scratch for ML and DS
Where do I begin from ?
wooden sail
grab gilbert strang's linear algebra book
lapis sequoia
Is this where I can talk about xlsx and pandas?
ebon widget
wooden sail
grab gilbert strang's linear algebra book
Is algebra like maths 101?
wooden sail
"algebra" is a very broad term
it includes the stuff you see in grade school, but can also be something you specialize in in a phd in mathematics
lapis sequoia
So I have an excel with merged rows and inside those merged rows there are images. I want to read that excel and extract those images. And then later, classify them as categories as in each merged cell is a category that contains multiple rows. Thanks for any help in advance.
wooden sail
linear algebra is the first step into abstract algebra, let's say. the prerequisites are pretty low, but the abstraction is right up there
ebon widget
Thanks !!! @wooden sail
wooden sail
it's the place where you run into vectors and matrices, i should add
shrewd grove
Matrices and vectors ? These are evil.
rich olive
yeah i didn't understand what linear could even be that wasn't just grade 10 algebra but the abstraction of that proved to be very interesting
Guys I have a sample of salaries from an industry. I want to compare a subsample of that sample with a specific attribute to either the sample as a whole or another subsample of all data not in the first subsample. How would you go about this? Welch's test for the two subsamples? salaries aren't normally distributed, right?
serene scaffold
shrewd grove
Matrices and vectors ? These are evil.
they're just arrays 😛
shrewd grove
serene scaffold
they're just arrays 😛
I had to implement an arcball once in some ancient opengl app.
Not touching matrices again.
wooden sail
partly my mistake for saying "matrices" along with vectors, but
it's really vector spaces and linear transformations. what you think of as "arrays" is just one special case
echo scaffold
mint palm
For training my model my professor offers university gpu.
He has asked for my ss...
public its in .ssh folder and ends with .pub
gusty wedge
shrewd grove
Ranges ?
example would help
shrewd grove
gusty wedge
example would help
range(-10,-1)
shrewd grove
List(map(str, range(...)))
 bright sentinel
where can i learn python from the start like start start
shrewd grove
bright sentinel
where can i learn python from the start like start start
Like tutorials online ?
bright sentinel
yeah
shrewd grove
YouTube has some n-hours long tutorials, realpython has some stuff.
I suppose there might even be some books.
bright sentinel
shrewd grove
YouTube has some n-hours long tutorials, realpython has some stuff.
it's a site?
shrewd grove
bright sentinel
it's a site?
Aye
gusty wedge
shrewd grove
List(map(str, range(...)))
sorry for dumb questions, I started python yesterday
bright sentinel
shrewd grove
Aye
i dont know anything about python my teacher didnt teach anything the whole year
gusty wedge
shrewd grove
Like tutorials online ?
is there a "GOOD" book which goes over projects with python, no beginner shit, I know other languages (not so well) that is why that would be boring
shrewd grove
gusty wedge
is there a "GOOD" book which goes over projects with python, no beginner shit, I...
No idea. I knew cpp before python and just started a project, reading documentation and stack overflow on needs to be basis.
gusty wedge
shrewd grove
No idea. I knew cpp before python and just started a project, reading documentat...
I should do the same I think
mint palm
echo scaffold
public its in .ssh folder and ends with .pub
i opened the folder named ssh_public_key and its of following format
-----BEGIN OPENSSH PRIVATE KEY-----
...
-----END OPENSSH PRIVATE KEY-----
i dont think its public
shrewd grove
bright sentinel
i dont know anything about python my teacher didnt teach anything the whole year
I didn't attend any classes so similar situation, except for it was my fault. No worries, python is easy.
arctic wedgeBOT
Hey @gusty wedge!
It looks like you tried to attach a Python file - please use a code-pasting service such as https://paste.pythondiscord.com
gusty wedge
One last thing @shrewd grove could you help me with adding arrows on top of line on both sides in a line plot
shrewd grove
mint palm
i dont think its public
File should be .pub, the format you showed is private aka "do not show to anyone"
bright sentinel
shrewd grove
I didn't attend any classes so similar situation, except for it was my fault. No...
yeah i just want to start with basics rn
gusty wedge
bright sentinel
yeah i just want to start with basics rn
try freecodecamp, the course may be bit slow but it lay good foundation
bright sentinel
shrewd grove
If you prefer a challenge-based learning.
i would like that
shrewd grove

Codewars
A few selected Katas to be used in a basic Python workshop.
bright sentinel
thanks bro
bright sentinel
gusty wedge
try freecodecamp, the course may be bit slow but it lay good foundation
i am gonna try this too
gusty wedge
bright sentinel
i am gonna try this too
good luck
gusty wedge
gusty wedge
One last thing <@129937277550854145> could you help me with adding arrows on top...
.
echo scaffold
mint palm
i opened the folder named ``ssh_public_key`` and its of following format
```
---...
Are you on Windows or Linux?
 static mesa
Hello friends, when doing log transformations is there any reason I shouldn't use the one that gives my model the lowest MSE? Right now log1p gives me ~4.99 where log10 gives me ~.95, just wanted to make sure i'm not missing anything huge as this seems like a big jump.
steady basalt
static mesa
Hello friends, when doing log transformations is there any reason I shouldn't ...
The error is smaller because your numbers are smaller
wooden sail
in general the absolute error itself doesn't mean much
steady basalt
You’d need to have something to compare the error two, it’s not in and off itself a measure you can make anything of
(Like classification metrics are)
static mesa
So is there another way to evaluate the models performance? For reference it is a standard Linear Regression model. I thought that the closer to 0 you got the better the model did at predicting values?