#data-science-and-ml
1 messages · Page 13 of 1
 lusty dove
 serene scaffold
lusty dove
ye, that's why I thought, but I was reading that you need to install it in a vir...
serene scaffold
lusty dove
ye, that's why I thought, but I was reading that you need to install it in a vir...
you're never required to install things in a virtual environment, but it's a good practice if you're going to have more than one Python project on the same VM.
you're ssh'ing into the raspberri pi, right? so you either have to use a terminal-based editor (like vim) or an IDE that supports remove development.
lusty dove
serene scaffold
you're never *required* to install things in a virtual environment, but it's a g...
oh, so I can install scikit without need to use the pip virtualenv?
there will be no problem for having previously installed it in the virtual environment?
serene scaffold
lusty dove
oh, so I can install scikit without need to use the pip virtualenv?
pip and virtual environments are not the same thing. you still need to pip install it.
if you already installed it in a virtual environment, you can just use that virtual environment for what you're doing.

 brazen spire
How do you deploy ML models to desktop (C++) and mobile?
 desert oar
lusty dove
oh, so I can install scikit without need to use the pip virtualenv?
desert oar
lusty dove
oh, so I can install scikit without need to use the pip virtualenv?
you should at least use pip install --user instead of just pip install, and never use sudo with pip
 steady basalt
nice new pic lookin sharp bro
serene scaffold
steady basalt
nice new pic lookin sharp bro
I did "gay green programmer" in one of those query->image AIs.
I should probably figure out which one mina and Scofflaw are using.
steady basalt
looks like midjouirney
join the midjourney discord @serene scaffold
mine is made with mj
serene scaffold
steady basalt
join the midjourney discord <@253696366952316929>
it's not midjourney. also I was in that discord but I think I got kicked for not using it
 brisk apex
anyone used org.apache.hadoop:hadoop-aws: to connect to s3? which versions do I need to make it work without java.lang.NoSuchMethodError: 'void com.google.common.base.Preconditions.checkArgument(boolean, java.lang.String, java.lang.Object, java.lang.Object)' <-- this issue? Tried changing my java version to 1.8 and hadoop-aws version to 2.6.5 (worked in scala), pyspark and py4j latest and didn't work. java version to 1.17, hadoop-aws to 3.3.0, pyspark and py4j latest didn't work. java version back to 1.8, hadoop-aws to 2.6.5, pyspark to 3.1.0, py4j 0.10.9 (automatically changed when I installed pyspark 3.1.0) still didn't work.
steady basalt
serene scaffold
it's not midjourney. also I was in that discord but I think I got kicked for not...
u can get a midjourney bot, even in here and people can use it
but prob get spammed
serene scaffold
steady basalt
u can get a midjourney bot, even in here and people can use it
we don't let third-party bots in this server.
steady basalt
whats that one made with
serene scaffold
midjourney
 fiery dust
What Python libraries should I learn and until what point before learning PyTorch? Thanks in advance
serene scaffold
fiery dust
What Python libraries should I learn and until what point before learning PyTorc...
well, "learning libraries" is an entirely wrong approach.
fiery dust
oh
serene scaffold
at least in the context of data science/AI. none of them are end-to-end solutions.
fiery dust
So you would say there is no need of learning matplotlib, numpy, sklearn, scipy, pandas, etc?
serene scaffold
fiery dust
So you would say there is no need of learning matplotlib, numpy, sklearn, scipy,...
no, you do need to learn how to use them. but you shouldn't really do things that are focused only on learning about that library
fiery dust
Oh I see
serene scaffold
there's no natural progression between them.
learning each one in isolation will not help you be an AI dev.
fiery dust
I understand.
serene scaffold
and when it comes to using pytorch, learning about pytorch itself isn't going to be the difficult part. learning about neural networks in general will be.
fiery dust
I'll save the names of those libs since I read they are used a lot when doing AI
fiery dust
serene scaffold
and when it comes to using pytorch, learning about pytorch itself isn't going to...
I'm going through 3brown 1 blue neural network playlist and I agree with you, its difficult
that wont be enough for me
serene scaffold
his videos are good, but probably not enough on their own. you probably need to work through the math on your own, to make sure you understand it.
fiery dust
yeah I'll need to study a lot
and also I'll need something like roadmap.sh since I struggle a lot when I dont have a path to follow, if it makes sense
steady basalt
u can learn pytorch in like 1 week starting with the official documentation/tutorials and other sources
at least to do some basic neural nets
ud ned to be quite a good, almsot swe level coder to make big shit
serene scaffold
steady basalt
ud ned to be quite a good, almsot swe level coder to make big shit
the unfortunate reality is that terrible programmers with a sophisticated understanding of AI can make complex neural networks with pytorch. and then no one understands what they wrote.
fiery dust
But I think I'll do something like
understand what AI/ML neural network is
learn calculus, probability, statistics, linear algebra
overview to matplotlib - numpy - sklearn - scipy - pandas
learn PyTorch
practice on projects like Speech Recognition, Snake game, algo trading
now start with my project
fiery dust
serene scaffold
the unfortunate reality is that terrible programmers with a sophisticated unders...
unfortunate because they dont deserve creating good ai with little programming knowledge?
serene scaffold
fiery dust
unfortunate because they dont deserve creating good ai with little programming k...
because shitty code makes me angry.
fiery dust
hahah I see 😄
well then you probably wont like my code, since I never got my code reviewed by anybody
serene scaffold
let me know if you ever need a roast.
 arctic wedgeBOT
Pasting large amounts of code
If your code is too long to fit in a codeblock in Discord, you can paste your code here:
https://paste.pythondiscord.com/
After pasting your code, save it by clicking the floppy disk icon in the top right, or by typing ctrl + S. After doing that, the URL should change. Copy the URL and post it here so others can see it.
serene scaffold
oh god
what have I asked for
fiery dust
lmao then nvm hahah
serene scaffold
nah go ahead
fiery dust
dont feel obligated, please
fiery dust
https://paste.pythondiscord.com/agakavuvaw
this is just a "module" of something I've been working on
serene scaffold
fiery dust
https://paste.pythondiscord.com/agakavuvaw
this is just a "module" of something ...
every .py file is a module. and I expected worse 😅
 iron basalt
serene scaffold
because shitty code makes me angry.
iron basalt
serene scaffold
because shitty code makes me angry.
If you ever feel like getting angry, try reading OpenCV and then realize that pretty much everyone is using it on a massive scale including for things that are potentially life-threatening such as self driving cars, robotics, military weapons, and more.
fiery dust
serene scaffold
every `.py` file *is* a module. and I expected worse 😅
so I passed? 🤣
steady basalt
serene scaffold
the unfortunate reality is that terrible programmers with a sophisticated unders...
xd. i think ive seen some of that on github, ive never personalyl attempted it because im not yet good enough to code it well
fiery dust
iron basalt
If you ever feel like getting angry, try reading OpenCV and then realize that pr...
elon ☠️
steady basalt
serene scaffold
because shitty code makes me angry.
im guilty
fiery dust
gotta dinner
serene scaffold
iron basalt
If you ever feel like getting angry, try reading OpenCV and then realize that pr...
 steady basalt
iron basalt
If you ever feel like getting angry, try reading OpenCV and then realize that pr...
steady basalt
iron basalt
If you ever feel like getting angry, try reading OpenCV and then realize that pr...
actually?
iron basalt
steady basalt
actually?
I recently came into contact with the source of OpenAI's procgen and helped in trying to maintain / understand what it's doing (so that some paper's results could be reproduced which relied on it (current plan is a full rewrite, it can't be salvaged)). It's probably top 20 worst C++ code I have ever read.
Although OpenCV ranks (a lot) higher due to the shear amount of code and how it's impossible to follow it. Can't tell where anything happens and when you do get there you won't know what it's doing. No comments, no documentation, single letter variables (even for the function arguments), tons of C macros, etc.
It could win an obfuscated C/C++ code competition.
steady basalt
why did they do that though?
iron basalt
steady basalt
why did they do that though?
C++ gives devs a lot of toys / features to play with. A common thing among beginner C++ programmers, especially those straight out of school/universities is to use EVERY feature at the same time.
In addition, many just never learned basic things like having good variable and functions names.
In the case of procgen it seems that they got their interns to program it in a hurry. I can tell because the comment at the top of every file that includes the license also includes a description of what the file does. But the problem is is that the comment at the top of every file is the exact same. A description of how util (utilities file) works and the license, which means someone blindly copy pasted that comment in a hurry to all the other files.
In addition it contains many other beginner patterns / mistakes / things that happen when rushed.
 austere swift
fiery dust
But I think I'll do something like
understand what AI/ML neural network is
lear...
austere swift
fiery dust
But I think I'll do something like
understand what AI/ML neural network is
lear...
i'd switch the first two around, when you know the math beforehand you can get a lot better understanding of what's actually going on in the neural network
fiery dust
austere swift
i'd switch the first two around, when you know the math beforehand you can get a...
noted!!!
if I only had all day to study 😭
 lapis sequoia
do jupyter notebook variables die when the kernel turns off (like if I turn the pc off and on)? im having to rerun this notebook every time I open it in vscode, not sure if its a jupyter or vscode thing
serene scaffold
lapis sequoia
do jupyter notebook variables die when the kernel turns off (like if I turn the ...
when the kernel turns off, it's the same as a python program being terminated, and any data in the program that wasn't saved on disk somewhere is gone.
any outputs that are displayed in the notebook will still be there when you start it again, but whatever python objects created those outputs are gone.
 nooo ok thank you
 steady bronze
im doing this project where i have to detect custom objects using yolov7
but i keep getting this error saying

i have a folder called models already
and it has a file called experimental.py inside it already
lapis sequoia
any idea why matplotlib is doing this (clumping two dates)? I think maybe it's choosing to do this because the month changes. I'm not sure what to do about it, I already do:
plt.gca().xaxis.set_major_formatter(mdates.DateFormatter(DATE_FORMAT))
plt.gcf().autofmt_xdate()

(it wasnt doing this yesterday before the first this month)
 wooden sail
it looks like it's placing them on the axis based on the exact value. they're closer together because they are only 1 day apart. you can see at the left there is a bigger space, too, due to it being 10 days instead of 2
you can either ignore the spacing, like so https://stackoverflow.com/questions/39540730/how-to-make-xticks-evenly-spaced-despite-their-value
or define your own x ticks that are equispaced
 orchid crystal
can anyone please help me with a very basic task of reading a file in the pandas library?
serene scaffold
orchid crystal
can anyone please help me with a very basic task of reading a file in the pandas...
!docs pandas.read_csv
arctic wedgeBOT
pandas.read_csv(filepath_or_buffer, sep=NoDefault.no_default, delimiter=None, header='infer', names=NoDefault.no_default, index_col=None, usecols=None, squeeze=None, ...)```
Read a comma-separated values (csv) file into DataFrame.

Also supports optionally iterating or breaking of the file into chunks.

Additional help can be found in the online docs for [IO Tools](https://pandas.pydata.org/pandas-docs/stable/user_guide/io.html).this is the code I'm using :-
import pandas as pd
king = pd.read_csv("C:/Users/HP/Desktop/zomato.csv", encoding="latin-1")
king.head()
This the error message i'm getting:-
FileNotFoundError: [Errno 2] No such file or directory: 'C:/Users/HP/Desktop/zomato.csv'
 grave token
model.add(Conv2D(filters=32, kernel_size=(3, 3), strides=(1, 1), input_shape=(64, 64, 3)))
```How to decide how many filters to use? `filters = ?`
For example do I use `(image_size - filter_size) + 1`, which in this case `(64-3)+1 = 62`saving models after you train them is an incredibly standard practice.
lapis sequoia

 final field
orchid crystal
This the error message i'm getting:-
FileNotFoundError: [Errno 2] No such file ...
final field
orchid crystal
This the error message i'm getting:-
FileNotFoundError: [Errno 2] No such file ...
Check the location of the file or just add the file to your working folder and replace the path
 modest onyx
this is crazy
 lusty dove
Hey, I'm having troubles with this part of my code, using .fit
y = df[target_column].values
X_train, X_test, y_train, y_test = train_test_split(X, y, test_size=0.30, random_state=40)
print(X_train.shape); print(X_test.shape)

mlp = MLPClassifier(hidden_layer_sizes=(6,6,6), activation='relu', solver='adam', max_iter=500)
mlp.fit(X_train,y_train)```I got the next error
y = column_or_1d(y, warn=True)```I tried to use ravel, but it didn't work
lapis sequoia
I have a small question. it's related to NLP. is there a resource I can use to find stop words for a sentiment analysis model that operates on movie reviews?
 vale pasture
I'm using PyTorch and have a problem.
I have a tensor distances.
tensor([[0.3486],
        [0.4396],
        [0.4420],
        [0.4146],
        [0.4365],
        [0.4055],
        [0.4425],
        [0.4301],
        [0.4216],
        [0.4266]])
Doing distances == distances.min() returns the following.
tensor([[ True],
        [False],
        [False],
        [False],
        [False],
        [False],
        [False],
        [False],
        [False],
        [False]])
All fine and dandy so far. However, when I then do (distances == distances.min()).nonzero(), the following is output.
tensor([[0, 0]])
This doesn't make sense. Shouldn't tensor([[0]]) be output? I would appreciate any help!
steady basalt
modest onyx
this is crazy
Prompt?
 velvet birch
Okay so the best way to define p-value is that "it's a method that can help us in defining if an event is special or not"
Just because an event has a low probability of occurrence, it won't make it special if there are multiple other events with an equal or lower probability
Right?
wooden sail
one usually uses p values in the context of continuous PDFs. the PDF does not show probabilities, only probability density
so it's rather attached to "a value this extreme or more"
remember the probability of individual events in a continuous distribution is 0
wooden sail
vale pasture
I'm using PyTorch and have a problem.
I have a tensor `distances`.
```py
tensor...
you have a 2D array, so you get 2 coordinates. 0th row, 0th column
 tacit horizon
i am quite confuse the usage of batch size in tf.keras.preprocessing.imge.imageGenerater.flow_from_directory
when i set it high it make me overfitting
modest onyx
steady basalt
Prompt?
this wasn't a single prompt. I used the new dalle feature where I extend on the original image, now using different prompts while maintaining resolution https://help.openai.com/en/articles/6516417-dall-e-editor-guide
velvet birch
wooden sail
one usually uses p values in the context of continuous PDFs. the PDF does not sh...
So it basically tells me if a lot of the PDF is more extreme than the part I am choosing
steady basalt
modest onyx
this wasn't a single prompt. I used the new dalle feature where I extend on the ...
What we’re they?
Fox and mannequin etc
modest onyx
many many
for the central one, I used "A photograph of a humanoid and a planet" then I moved the window and used "A photograph of a humanoid and a fox"
it's a pretty high res image so I had to move the window quite a bit
The background prompts ranged from "roots extending into the soil" to "A vegetable poking out of soil" to "a plant growing from {soil or rock cracks}"
 silk drum
Hi, New here. Hope it's not off topic (if it is, I'd appreciate if you point me to a more suitable room)
General question, I really hope it's clear enough:
Currently watching cs229 (at lecture 6-7 in yt).
Until now, nowhere was the general concept of learning.
They just jumped right off to discussing algorithms.
In problem set 1, definitions like "learning" and "classifier" are mentioned which were nowhere mentioned in the lectures (so far).
For instance, in ps1 Q1(b) I'm required to code a logistic regression classifier using Newton's Method.
Where does the classifier ends and the learning process begins?
In general, what are the stages of learning in ml?
desert oar
silk drum
Hi, New here. Hope it's not off topic (if it is, I'd appreciate if you point me ...
"learning" is jargon for "model fitting". there is no "learning" as such, unless you consider convex optimization to be "learning" (which is a valid perspective).
this is an example of how teaching students "machine learning" from an overly-applied perspective can do them a disservice
@silk drum "a classifier" is a type of model. a model is a mathematical description of some process or characteristic of the real world, usually a simplified one in some way. usually models have several parameters that must be "fitted" (statistics jargon) or "learned" (ML jargon), usually by performing some optimization routine like newton's method.
nowadays the "algorithm" almost universally nowadays means "put the required inputs into the model and do something with the output"
i would avoid any stylized notions of "artificial intelligence" when learning this material and stick to the basic interpretation of "finding the parameters of a model that minimize prediction error." even if you plan to work on AI later, the foundations are still in mathematical model-fitting.
 cyan sierra
https://www.linkedin.com/pulse/when-scale-standardise-normalise-scikit-learn-tshephisho-sefara/
"StandardScaler does distort the relative distances between the feature values." What does this mean and how does it do that?
desert oar
cyan sierra
https://www.linkedin.com/pulse/when-scale-standardise-normalise-scikit-learn-tsh...
i believe they are talking about what happens to distance(transform(x), transform(y)) compared to distance(x, y)
 shell crest
desert oar
"learning" is jargon for "model fitting". there is no "learning" as such, unless...
shell crest
desert oar
"learning" is jargon for "model fitting". there is no "learning" as such, unless...
I think treating learning as setting the parameters in the optimization problem is fine, because all learning is finding parameters
velvet birch
desert oar
i believe they are talking about what happens to `distance(transform(x), transfo...
How can this be a problem though?
The whole point of normalizing the features is to make sure that they all have the same weightage in the predictions right?
desert oar
velvet birch
How can this be a problem though?
i'm not sure. i haven't actually seen this claim before, i would have imagined that it has the same properties as min-max scaling (since both are affine transformations in the real line)
shell crest
velvet birch
How can this be a problem though?
It's a problem because you actually don't know how the geometry actually should be for the different dimensions
desert oar
right, the problem would be that the transformed space is different enough from the original space that the model doesn't fit as well as it should
but like i said, i'm actually not convinced that claim is true
velvet birch
So you'll have to try fitting both the transformed and the raw data? Just to see which one does the best?
shell crest
velvet birch
The whole point of normalizing the features is to make sure that they all have t...
I mean specifying this as part of your model is fine - but I don't think there's a mathematically driven reason for this
desert oar
shell crest
I mean specifying this as part of your model is fine - but I don't think there's...
the thing about "weightage" in the predictions is correct
i don't know if there's any theory behind it in general, but i think there is some in the linear model case
velvet birch
For algorithms like RandomForest in regression it takes the mean of the values of the features to split a node
Right?
wooden sail
shell crest
I mean specifying this as part of your model is fine - but I don't think there's...
there is: convergence is slower when this is not the case
the step sizes you can take while achieving convergence depend on the lipschitz constant of your function, which depends on the singular values, which depends on the scale of the parameters
if one parameter has a larger weight than others, it means the admissible step sizes are much smaller and the problem is more difficult to solve
shell crest
makes sense when you are doing iterations and all your stepsizes are relative to norms
wooden sail
hmm?
shell crest
but is there a prediction performance reason?
shell crest
shell crest
makes sense when you are doing iterations and all your stepsizes are relative to...
well all solvers I know are iterative so I suppose this always applies
wooden sail
it just means it takes more iterations to achieve the same performance you could achieve for cheaper if the parameters were scaled differently
velvet birch
So the prediction process is faster
shell crest
ah
velvet birch
It doesn't affect the prediction accuracy?
wooden sail
if you iterate all the way to convergence, no
shell crest
velvet birch
It doesn't affect the prediction accuracy?
not if you use the same weights/transformed weights
velvet birch
wooden sail
if you iterate all the way to convergence, no
So in this case a max_iter parameter would be helpful
wooden sail
but it also affects how distance and direction are measured while solving the problem. that means you can land in a different local minimizer
shell crest
wooden sail
if you iterate all the way to convergence, no
without multiple local wells, this is right
wooden sail
indeed, i was just writing about that 😛
velvet birch
Okay so one more question. Am currently learning about t-test, chi-square test and Anova test but haven't been able to find a good source to understand them from
wooden sail
a statistics book
velvet birch
Any resources in mind where you learned them from?
shell crest
any good statistics course will teach them
velvet birch
wooden sail
a statistics book
ISLR?
wooden sail
it's probably in there
wooden sail
youtube is great, but keep in mind that even going to uni, going to class is not enough. classes just help you digest the content in books more easily. at the end of the day, you need to read a good resource
wooden sail
what are feature selection methods?
velvet birch
velvet birch
Okay so one more question. Am currently learning about t-test, chi-square test a...
These things
shell crest
wooden sail
what are feature selection methods?
I think more along the lines of cross validation
wooden sail
ah the things you mentioned. no, they aren't
those are maybe under "statistical significance" or "statistical tests"
velvet birch
Ah okay gotcha
shell crest
velvet birch
Okay so one more question. Am currently learning about t-test, chi-square test a...
T-test is whenever you are testing something with respect to normal/normal-approximation. (e.g. differences in means)
Chi-square is when there is a normal-distribution-squared term involved. They come up in variance testing
ANOVA is for testing differences in means, beyond just 2 means
I don't see ANOVA in here
https://www.dataschool.io/15-hours-of-expert-machine-learning-videos/
But hypothesis testing is at least a start
Data School
In January 2014, Stanford University professors Trevor Hastie and Rob Tibshirani (authors of the legendary Elements of Statistical Learning textbook) taught an online course based on their newest textbook, An Introduction to Statistical Learning with Applications in R (ISLR). I found it to be an excellent course in statistical learning
velvet birch
I thought they were feature selection methods so was looking into them. Right now for feature selection am using mutual information gain along with SelectKBest and SelectPercentile
shell crest
The course is quite applied, and seems to assume previous knowledge of standard year1 statistics
velvet birch
The only thing I know about mutual information gain is that it checks the information gain for each feature just like RandomForest does
But don't know what the "mutual" part in it is for
shell crest
That's information theory
velvet birch
The main issue right now am facing is how to apply all this theory I learn in real projects
Like I learned the logic behind ML algos and am yet to figure out how it's useful in the model building process
wooden sail
mutual info can be thought of as a check for how correlated two quantities are
shell crest
I'd say you only learn about mutual information nearer-to-graduate level
velvet birch
wooden sail
mutual info can be thought of as a check for how correlated two quantities are
Okay gotcha
wooden sail
hmm you learn about information and entropy in undergrad stats though
shell crest
wooden sail
hmm you learn about information and entropy in undergrad stats though
in a stats program sure
and in a math program too sure
velvet birch
My undergrad course rn is just covering the basic maths like expected probability. Altho it's only the first semester
shell crest
https://stats.stackexchange.com/questions/81659/mutual-information-versus-correlation
best I can find quickly. Basically anything relating to joint random variables/multivariate statistics isn't really that simple

Cross Validated
Why and when we should use Mutual Information over statistical correlation measurements such as "Pearson", "spearman", or "Kendall's tau" ?
wooden sail
i'm sure most engineering programs cover it too
velvet birch
Learning how these things works is nice and all and I am sure I'll learn them from somewhere
shell crest
I didn't do math stats, so I think it depends on the program
velvet birch
But how to apply them in real projects?
wooden sail
i would say it goes kinda like this
you run into a real world problem: there's data measured in some way, and you want to see if you can find something out using the data
you have knowledge of how the process that produced the data works, e.g. they are images of something, or measurements of something, etc. you also know statistics
now, you can use your knowledge of statistics and modeling to come up with a parametric model of some kind, and to pick a suitable estimator for it
 surreal dust

wooden sail
and then you pick your favorite optimizer. you put all of these together, and your optimizer implements the estimator, which requires a statistics-based cost function and a model that incorporate what you know about the process that produces the data
shell crest
velvet birch
But how to apply them in real projects?
Well, do you know why mutual information gain is used as the metric in the algorithms you are using? Once you know this, that would be a basic application to 'real projects'
velvet birch
So just gotta spend enough time and brains on these problems and learning
wooden sail
have you ever done linear regression, for example?
velvet birch
Yes
wooden sail
well
linear regression means: we know the process that produces the data is something that can be modeled as a straight line. if the data is afflicted by AWGN, and if we want to use the maximum likelihood estimator, then this turns into a least squares problem. then we pick our favorite optimizer. maybe gradient descent, maybe explicitly taking a pseudo inverse, to find the parameters of our model. and there we go
wooden sail
stuff like coherence and mutual info pop up in problems like independent component analysis, where you assume the observed data is a (usually) linear combination of some atoms, of which there are few. this gives you a model. then knowledge on the noise paired with the desire to find atoms with the smallest possible mutual information gives you an estimator
 daring sphinx
Suppose I do a cross_val on a model, set the scoring to 'neg_mean_squared_error'. Is it good if the cv score is high or is it good if the cv score is low?
velvet birch
wooden sail
stuff like coherence and mutual info pop up in problems like independent compone...
So knowing all the methods and all can help us in understanding which estimator to go with?
wooden sail
pretty much
all of the stuff you see where people suggest a specific network architecture, cost function, and optimizer for a particular task? that's exactly this
daring sphinx
you guys talking about all the machine learning models?
 pastel drift
Anyone, I'm having issue with cuda availablity in conda. Please assit ?
I'm on #help-burrito 🙂 please please help
steady basalt
What to do when have 20 page sized results tables
Move to appendix?
And try to use bar charts?
desert oar
steady basalt
What to do when have 20 page sized results tables
yes to both of these imo
my masters thesis was like 1/4 tables because my advisor insisted on printing the entire regression model in traditional economics fashion, even though the coefficients were mostly not interesting and not what i was trying to analyze
 plucky shell
what is needed at mathematics in order to understand clearly ml and dl (like discrete maths)
serene scaffold
plucky shell
what is needed at mathematics in order to understand clearly ml and dl (like dis...
Set theory and graph theory are both important, but they're almost just lists of vocabulary that you should learn. You need to know what a set is, what the intersection of two sets are, what a graph traversal is. There aren't any calculations you need to do. Just understanding what the words mean.
But you also need to learn probably, statistics, linear algebra, and calculus.
plucky shell
serene scaffold
Set theory and graph theory are both important, but they're almost just lists of...
How soon do you think can become ready theoretically for projects about ml and other staff which will be part of data science? Can you estimate a period, like a year or even more? Just about your experience.
orchid crystal
final field
Check the location of the file or just add the file to your working folder and r...
The Error just changes to permission errorr this is the error message & my code:-
import pandas as pd
location = r'C:\Users\HP\AppData\Local\Programs\Python\Python310'
df = pd.read_csv(location)
df.head()
PermissionError: [Errno 13] Permission denied: 'C:\Users\HP\AppData\Local\Programs\Python\Python310'
final field
Bro your working folder not the python env folder
orchid crystal
What's a working folder sir?
final field
Wait
serene scaffold
plucky shell
How soon do you think can become ready theoretically for projects about ml and o...
you can start doing projects whenever you want. how quickly you'd be able to learn everything you need to know to finish it depends on the scope of the project. and there are some projects where you can lean more on existing libraries and not have to understand how it works super deeply.
But people study for years to understand this stuff, so expect things to take a while.
desert oar
imo you should start doing hands-on work as soon as possible, but with the understanding that your projects will start very simple and gradually increase in sophistication as you learn more things.
ideally you would be learning intro-level statistics and/or machine learning on one hand and learning/practicing the foundations of data visualization on the other
silk drum
@desert oar
Great answer!
So just to be clear, the classifier in the case I described is the selected model (i.e. Logistic regression) and the learning process is applied by Newton method?
BTW, following your answer, can you recommend a book (or any other source of information) that explain these notions in a "cleaner" way?
That sticks more to the mathematical concepts?
 loud apex
what IDE you all suggest for DS and AI? jupyter notebook or vscode? why?
serene scaffold
loud apex
what IDE you all suggest for DS and AI? jupyter notebook or vscode? why?
notebooks are not an IDE. they're a different type of environment for running code. what IDE you use is up to you. I use pycharm or vim, depending on the situation. I pretty much never use notebooks and discourage beginners from using them, but I understand their appeal.
loud apex
serene scaffold
notebooks are *not* an IDE. they're a different type of environment for running ...
why discourage beginners from using them?
serene scaffold
loud apex
why discourage beginners from using them?
I don't have time to go into it at the moment, but you can google "case against jupyter notebooks" and see that the flame war has been raging for a while.
In short, jupyter notebooks are inherently at odds with best practices in software engineering. whether or not you think the same best practices should apply in both data science and software eng are up to you.
(to be honest, they don't need to have the same sets of best practices. but notebook natives are less likely to realize when they've crossed from data science to software eng territory.)
loud apex
serene scaffold
I don't have time to go into it at the moment, but you can google "case against ...
alright
thanks
 misty flint
loud apex
why discourage beginners from using them?
misty flint
loud apex
why discourage beginners from using them?
what stel said is true. you get into real trouble when you need to actually deploy ML models or integrate them into other pieces of software if its a notebook environment and not refactored
a good compromise, however, may be using vscode + the notebook extension at least at the beginning
then slowly start transitioning to more of a SWE approach
steady basalt
@serene scaffold recently tried returning multiple figures from a ipynb function and it doesn’t work, have to use pycharm
serene scaffold
steady basalt
<@253696366952316929> recently tried returning multiple figures from a ipynb fun...
you don't have to use pycharm. you don't have to use any IDE at all if you don't want to.
wooden sail
i like spyder quite a bit, reminds me a lot of matlab's IDE
desert oar
silk drum
<@389497659087650836>
Great answer!
So just to be clear, the classifier in the ...
So just to be clear, the classifier in the case I described is the selected model (i.e. Logistic regression) and the learning process is applied by Newton method?
you could say that, yeah.
BTW, following your answer, can you recommend a book (or any other source of information) that explain these notions in a "cleaner" way?
Probabilistic Machine Learning by Murphy goes into some formalism about what it means to "model" something, but i don't think you need to spend your mental energy on it, nor is there much to be gained by digging too deep here (unless you are interested in things like the philosophy of science). most people use the phrase "learning" as a synonym for "finding the optimal parameters of a model". again, statisticians tend to refer to this process as "fitting" a model, which i think is a less-loaded term than "learning".
the most important thing to take away is that there are two "components" to a working model: the model formulation itself, and the process by which it is fitted (or "trained")
terminology like "learn" and "train" is meant to be evocative metaphorically but not meaningful beyond that. much like how "neural networks" are not particularly "neural".
silk drum
@desert oar
Much appreciated 🙏🏼
 left yoke
How can I make short term forecast with ARIMAX model in python pls?
wooden sail
.latex [
\mathcal{S} = { { n, n+1, n+2 } : n = 3k, ,, 0 \leq k \leq 24 (\text{or whatever number you had in mind}), ,, k \in \mathbb{Z} }
]
 strange elbowBOT
 wooden sail
@steady basalt
steady basalt
Nice thanks
I’ll write that once and then change k?
Or nk will need to change when using 5 as group size
wooden sail
well if you want that kind of flexibility, better use intervals instead
.latex [
\mathcal{S} = { [kn, (k+1)n - 1] : ,, 0 \leq k \leq K (\text{whatever number you had in mind}), ,, n,k \in \mathbb{Z} }
]
strange elbowBOT
 steady basalt
Nice I’ll use that
Also, if I have precision and recall, how do you calculate auc of that
wooden sail
then you need only specify n and k, and S is a set of disjoint intervals whose union goes from 0 to (K+1)n - 1
auc?
steady basalt
Yeah I have precision and recall calculated and it plots the curve but doesn’t give me the aucprc
wooden sail
idk what auc is
wooden sail
no idea
some sort of integral or riemann sum of something. maybe someone else can help you out
steady basalt
I think it’s just a sum of tn over a bunch of other metrics
fiery dust
I want to learn these topics --> Linear Algebra - Calculus - Probability - Statistics
Where should I learn them from
I read in this channel the below book has everything I need in terms of math at least to start in AI
https://mml-book.github.io/book/mml-book.pdf
but maybe it's incomplete
arctic wedgeBOT
Hey @opal stag!
It looks like you tried to attach a Python file - please use a code-pasting service such as https://paste.pythondiscord.com
 opal stag
I need to create a plot that shows the runtime of three different algorithms (called cubic, quadratic and hashmap) as a function of n on a logarithmic scale.
But currently the output (threesum_plot.pdf) only shows one value of n and is thus a straight line up.
How can I make more than one datapoint (ie. more than one value of n with results)? Currently it only evaluated the algorithms at one value of n.
experiments.py file gives output results.csv, with the data shown on unknown.png.
postprocess.pyworks on the previously mentioned file to first create three tabular (only one data point though) of each algorithm that can be inserted into LATEX document ():
30 & 0.171406 & 0.080930\\
Then it makes it into a plot as shown on threesum_plot.pdf
Is it this code that needs to be changed in the postprocess.py file:
def compute_mean_std(raw: Dict[int, List[float]])-> \
    np.ndarray:
    result = np.zeros((len(raw),3))
    for i, n in enumerate(sorted(raw)):
        result[i,0] = n
        result[i,1] = np.mean(raw[n])
        result[i,2] = np.std(raw[n], ddof=1)
    return result
Hey @opal stag!
It looks like you tried to attach a Python file - please use a code-pasting service such as https://paste.pythondiscord.com
vale pasture
wooden sail
you have a 2D array, so you get 2 coordinates. 0th row, 0th column
Ohh, right. Makes sense!
 tidal bough
opal stag
I need to create a plot that shows the runtime of three different algorithms (ca...
tidal bough
opal stag
I need to create a plot that shows the runtime of three different algorithms (ca...
The issue is likely with your plotting, not your data, and you haven't posted your plotting code.
ooh, I see, nevermind
How many pairs are in raw?
steady basalt
fiery dust
I want to learn these topics --> Linear Algebra - Calculus - Probability - Stati...
Literally get books, text books
If u struggle supliment with videos I do
fiery dust
steady basalt
Literally get books, text books
but there has to be a recommended book, right? any book that you know it will prepare you to start learning ML AI
steady basalt
Any calculus textbook will teach unit
U it*
U can’t learn four gargantuan areas of maths in one book
fiery dust
so if I go with that book above I'll have a solid base of knowledge to start learning and understanding AI?
steady basalt
It looks good
But you’ll probably struggle actually being good at that math without learning topics individually
My calc book is 1.1k pages and has thousands of example problems
The one you have is a great refresher but won’t teach u
tidal bough
https://www.coursera.org/learn/machine-learning is a good course for basic ML - and it teaches you the linalg required, too
steady basalt
strange elbow
can i double check with u here k is the range and n is the set size
group*
 violet gull
How do I derive weird stuff like ReLu activation functions? I clearly can’t pass it into an autodiff
I’m on the back propagation step
And im calculating all the derivatives for chain rule
wooden sail
violet gull
How do I derive weird stuff like ReLu activation functions? I clearly can’t pass...
why not? that's exactly what pytorch and tensorflow do
if you're worried about the non differentiable point at 0, you can use a subderivative there
any value in the range [0,1] will do
violet gull
wooden sail
why not? that's exactly what pytorch and tensorflow do
PyTorch can take in (numpy.max(0, x) and derive that?
wooden sail
it has its own relu built in, use that
wooden sail
if that's cheating, then so is autodiff
violet gull
wooden sail
if that's cheating, then so is autodiff
I’m just using sympy’s diff function
wooden sail
that's completely different from auto diff
violet gull
Why
wooden sail
autodiff is done efficiently by constructing a lazily-evaluated computational graph
sympy is just CAS, which is slow and runs into problems with common functions and deep composition
violet gull
So I should use PyTorch?
wooden sail
i would say so, there's effectively no difference other than it won't be painfully slow
alternatively, you can compute the derivative of the relu yourself and put that into a function
but that also means you can't use sympy anymore for your derivatives, but actually do the chain rule yourself
which is really what making everything from scratch looks like
violet gull
I was already doing the chain rule by myself
wooden sail
why are you using sympy diff then
violet gull
Cause I thought I was just doing

This @wooden sail
Where I’m just doing diff() on a bunch of different things
wooden sail
all right
well, diff(max(0,x)) certainly won't work, but the (sub)derivative is easy to compute
violet gull
What can I do with PyTorch
violet gull
Yes but that easy trick wont work with everything
wooden sail
no, it won't. if you want automatic differentiation, then yes, use pytorch or something similar
if you're working with numpy up until now, i'd actually recommend jax for you
wooden sail
jax works exactly the same way as numpy, except it has JIT and autodiff
violet gull
Especially on a system without nvidia
violet gull
Show
violet gull
And that has an auto diff that will work with the weird non math functions
wooden sail
wdym "non math functions"
violet gull
max(x, 0)
wooden sail
that's a math function
violet gull
Sum(blah)
wooden sail
that's also a math function
violet gull
It’s not like something I can put into desmos
wooden sail
yes it is
violet gull
Ok then it’s not something I can derive using the rules like chain or product or power
wooden sail
they both are, if you know what you're doing
if you didn't have math functions at all, there would be nothing we could do about it. but you do, so there's an easy fix
all ML, AI, optimization, etc is math
violet gull
Ok you get what I’m trying to say why booli me
wooden sail
i'm not bullying you, this is important
make no mistake: if you wanna work with AI/ML, you're doing math
and the better you are at it, the better
fiery dust
omg never though I would need to study math by myself
amazing what programming can do lmao
wooden sail
you kinda got that backwards too, but ok 😛
fiery dust
wooden sail
you kinda got that backwards too, but ok 😛
how would it be, if you are talking to me
wooden sail
well, wdym by "amazing what programming can do"
fiery dust
what math can do
yeah, you were right
but what I meant was something like: "Amazing what programming can make me do"
wooden sail
oh lol
fiery dust
yeah mb
grave token
generator = datagen.flow_from_directory(...)
# Found 789 images belonging to 36 classes.
for i in range(789):
generator.next()
```Here they put all the images in one folder, I want them separated by classes. vague kindle
How do you make your own datasets for your own models? Do you just painstakingly enter in every value one by one?
 rigid bronze
Image
i use this code to extract the div ( highlighted by blue )
but its returning []
why ??
import pandas as pd
import numpy as np
import requests
import json
from bs4 import BeautifulSoup
url1 = "https://zerotomastery.io/testimonials/"
res = requests.get(url1)
blog_data = []
if (res.status_code == 200):
page = BeautifulSoup(res.content , "html.parser")
print(page.find("div" , {"class" : "divcomponent__Div-sc-hnfdyq-0 base-cardstyles__BaseCard-sc-1eokxla-0 testimonial-cardstyles__TestimonialCard-sc-137v3r9-0 dRXcRh ipQTEw"}))

 haughty marsh
hello just curious, when training a model. Do people usually save the last model? Or do we save the model with the highest validation_accuracy for example?
 serene scaffold
haughty marsh
hello just curious, when training a model. Do people usually save the last model...
serene scaffold
haughty marsh
hello just curious, when training a model. Do people usually save the last model...
up to you. if you know what all the settings were for the model that produced those results, you can just save that in a CSV
 mild dirge
haughty marsh
so there is no standard practice?
mild dirge
haughty marsh
so there is no standard practice?
You can save the parameters/weight values of the model with the best validation accuracy, and use that on the test set
stelercus was talking about hyper parameters I think, I wouldn't save model parameters in a csv 😛
haughty marsh
sounds good thank you! my autograder needs the model with val accuracy > 0.8 So that works!
mild dirge
You aren't use k-fold cross validation right? @haughty marsh
haughty marsh
no
mild dirge
Ah alrighty, yeah that seems fine then
haughty marsh
okok thanks!
violet gull
@wooden sail when I ran either of the pip3 install jax commands jt gave me a wall of red and errors
Nothing even helpful in it
 wooden sail
which os is this
opal stag
tidal bough
~~The issue is likely with your plotting, not your data, and you haven't posted ...
I think the problem is this code:
def plot_algorithms(res: Dict[str, np.ndarray],
    filename: str):
    (fig, ax) = plt.subplots()
    algorithms = ['cubic', 'quadratic', 'hashmap']
    for algorithm in algorithms:
        ns = res[algorithm][: ,0]
        means = res[algorithm][: ,1]
        stds = res[algorithm][: ,2]
        ax.errorbar(ns, means, stds, marker='o',
            capsize = 3.0)
    ax.set_xlabel('Number of elements $n$')
    ax.set_ylabel('Time (s)')
    ax.set_xscale('log')
    ax.set_yscale('log')
    ax.legend(['Cubic algorithm',
        'Quadratic algorithm', 'Hashmap algorithm'])
    fig.savefig(filename)
I just don't know how to change it so that it "Create a plot that shows the runtimes of the algorithms as a function of n on a logarithmic scale" 😒
arctic wedgeBOT
Hey @opal stag!
It looks like you tried to attach file type(s) that we do not allow (.zip). We currently allow the following file types: .gif, .jpg, .jpeg, .mov, .mp4, .mpg, .png, .mp3, .wav, .ogg, .webm, .webp, .flac, .m4a, .csv, .json.
Feel free to ask in #community-meta if you think this is a mistake.
violet gull
wooden sail
which os is this
Mac
steady basalt
violet gull
<@467435887236612106> when I ran either of the pip3 install jax commands jt gave...
why u need jax?
prety sure thats never going to grow outside of google
mild dirge
opal stag
I think the problem is this code:
```python
def plot_algorithms(res: Dict[str, n...
It might be that you only need to set the scale of the y values to log, not n
 serene stump
anyone know how to make an NLP model accessed through an API avoid certain words? i'm trying to make a chatbot and i'm trying to make it avoid generating new chat lines ( imagine the input is "[alice]:how's the weather" and the output is "[bob]:weather is nice \n[alice]:i agree" (basically the bot completes chat lines for me)). to do this i cut the chat line out of the line but the problem is it keeps generating these chat lines no matter what. though i still need a way to tell the bot that it's a chat line. anyone have done this before? also i am not using the model myself i am using an API
https://www.banana.dev/pretrained-models/python3/gptj
i could technically just let it say the one line it says before it starts a new one but then it gets kind of boring because the answers will be short a lot of the time

Try our GPT-J API with 100% free forever, unlimited usage. Use this production-ready machine learning model on Banana with one line of Python code.
brazen spire
How do you deploy a model in NXP?
serene scaffold
serene stump
anyone know how to make an NLP model accessed through an API avoid certain words...
This is a question about how the api for that model works. If they don't give you that ability in their API, then there's no way to do it.
serene stump
r.i.p lol
but it did do ok when i just did a cutoff and didnt generate more text
sometimes it got short but real humans can have short answers too
steady basalt
is nlp peaking? how much further can it go?
serene scaffold
steady basalt
is nlp peaking? how much further can it go?
a lot of people seem to be of the impression that GPT-3 is the conclusion of NLP, but generating text is one of many problems that fall under NLP.
steady basalt
serene scaffold
a lot of people seem to be of the impression that GPT-3 is the conclusion of NLP...
oh no, gpt4 is coming and will be better
and i wasnt rly shoehorning into generation, but all of it including interpretation
i feel as though nlp is gona max out within a few years surely?
im biased tho cause i like cv and dont do nlp
serene scaffold
steady basalt
i feel as though nlp is gona max out within a few years surely?
 I haven't run out of things to do.
steady basalt
nothing worse than running a script 500 times and filling in endless results
serene scaffold
steady basalt
nothing worse than running a script 500 times and filling in endless results
why are you running it 500 times
steady basalt
looooots of dataframes
i designed it to input one at a time 🙂
tht rly is my f up
cuda just said for file in file
files
into the arg
jk, its not 500, its about 100 and each takes 20 mins
serene scaffold
steady basalt
jk, its not 500, its about 100 and each takes 20 mins
can you at least automate it?
steady basalt
each time im stopping to save plots and input multiple metrics into my results table
tables*
i guess u can script that but
i didnt
serene scaffold
steady basalt
i guess u can script that but
don't burn yourself out doing things that could be automated
 karmic flicker
Hey so Im running a super complex program with huges arrays and my python goes into not respoding mode, is there anyway to stop that
or like make it run faster because I've already optimized it quite a bit, its just naturally very computionally expensive
Issue is theres thousands of millions of datapoints

this basically just removes all indicies whose values are outside a floor
serene scaffold
karmic flicker
Issue is theres thousands of millions of datapoints
I won't help with screenshots of code.
!code
arctic wedgeBOT
Here's how to format Python code on Discord:
```py
print('Hello world!')
```
These are backticks, not quotes. Check this out if you can't find the backtick key.
 north cliff
How could I use ai to generate questions based on complexity. I want to build something similar to who wants to be a millionaire. I know I would need a dataset but what would I do after that? The questions would be word problems.
For example:
What does the f mean in f(x) = 5x + 2? | Complexity: 1/10
5^2^2 = ? | Complexity: 2/10
Who was the first president of the US | Complexity: 4/10
I know I can generate questions from a paragraph. Another method I've thought of is generating a paragraph of text based on complexity and then generating questions from that but it doesn't seem as efficient as directly generating the questions
 simple mirage
Anyone know about ai for process control (chemical eng field)
karmic flicker
north cliff
How could I use ai to generate questions based on complexity. I want to build so...
why not pull number of results you get when you google said question
worth a try
north cliff
karmic flicker
why not pull number of results you get when you google said question
The problem is that I don't know how to generate the questions in the first place based on complexity
north cliff
I know
karmic flicker
probably
north cliff
I know I could make a dataset like so
Question, 3/10
Question, 5/10
etc
But I don't know which library can generate questions
karmic flicker
It making sense is probably the hardest part
karmic flicker
I mean, you can do it, it just needs to millions and millions of iterations to learn what makes sense
so really abouts what quantifying sense
north cliff
But what library can generate questions
karmic flicker
your own
north cliff
I was afraid you were going to say that
karmic flicker
I've done AI stuff but I imagine generating phrases is pretty niche
like theres very few applications
other than tech demos
north cliff
Yeah that's the problem
 severe karma
anyone has even worked with spacy and training a customize ner ? during preparation of training data, do we need to include the old labels ? or only including the new labels are good enough ? thanks
lapis sequoia
is this okay?

tf.keras.models.save_model(model, '.') does the same, im guessing since its just math functions it doesnt matter
grave token
val_accuarcy = [0.66, 0.67, 0,65, 0,68, 0.70, 0,65]
As seen here, something is causing val_accuracy to go down. what could it be?
num_classes = 36
model = Sequential()

# Adding the preprocessing layers.
model.add(Resizing(IMG_SIZE, IMG_SIZE))
model.add(Rescaling(1.0/255))

# convolutional layer 1
model.add(Conv2D(filters=64, kernel_size=(3, 3), activation='relu', input_shape=(IMG_SIZE, IMG_SIZE, 3)))
# max pooling layer 1
model.add(MaxPooling2D(pool_size=(2, 2)))
# convolutional layer 2
model.add(Conv2D(filters=64, kernel_size=(3, 3), activation='relu'))
# max pooling layer 2
model.add(MaxPooling2D(pool_size=(2, 2)))
# convolutional layer 3
model.add(Conv2D(filters=64, kernel_size=(3, 3), activation='relu'))
# max pooling layer 3
model.add(MaxPooling2D(pool_size=(2, 2)))
# convolutional layer 4
model.add(Conv2D(filters=64, kernel_size=(3, 3), activation='relu'))
# max pooling layer 4
model.add(MaxPooling2D(pool_size=(2, 2)))
# Dropout
model.add(Dropout(0.2))

model.add(Flatten())
#fully connected
model.add(Dense(units=128, activation='relu'))
#fully connected

model.add(Dense(units=num_classes, activation='softmax'))
 earnest widget
grave token
`val_accuarcy = [0.66, 0.67, 0,65, 0,68, 0.70, 0,65]`
As seen here, something is...
earnest widget
grave token
`val_accuarcy = [0.66, 0.67, 0,65, 0,68, 0.70, 0,65]`
As seen here, something is...
What's your train accuracy?
grave token
earnest widget
What's your train accuracy?
at 34 epoch from 0.11 to 0.87
The val accuracy keeps going upward then keeps going downwards in a loop.
 earnest widget
grave token
earnest widget
grave token
Looks like the model is overfitting though. Do you have enough training data?
grave token
earnest widget
Looks like the model is overfitting though. Do you have enough training data?
no, but i have augmented a lot.
earnest widget
grave token
no, but i have augmented a lot.
Well you can try to increase your training data or try and remove the augmentation and see how well it does without.
earnest widget
grave token
`val_accuarcy = [0.66, 0.67, 0,65, 0,68, 0.70, 0,65]`
As seen here, something is...
And for the model you can have different filters for each conv layer try to start from 32 and increase it downwards.
grave token
earnest widget
Well you can try to increase your training data or try and remove the augmentati...
Without augmentation at 100 epoch
accuray: 1.000, val_accuracy: 0.4722
Massive overfit 🐢
earnest widget
Yeah it's definitely a data issue.
 celest vine
Data scientists here. What is the most important skill according to you to become a good data scientist?
I am currently self learning data science
wooden sail
math
wooden sail
the first step in doing good data science is exploratory analysis, where you by and large do stats and linalg, so you certainly need at least those
to know which architectures and cost functions can solve your problem well, you need to know things about the data and be able to relate them to good solution approaches
you need a base level of math to do this
 ripe forge
The base level of math needed is a much lower bar than stating just "math" as the most important skill needed, though in this case, it's also because when someone says math, the message conveyed gives an impression that the level of math required is a lot tougher than it really is. I personally think the messaging around how much math is needed is not clear at all
wooden sail
well, as you pointed out, that's because it ranges from early undergrad maths to post doc
but id doesn't change the fact that all your work in the field is math. interpreting results and evaluating data and models boils down to you having to personally evaluate statistical metrics
you don't need to compute or derive them yourself if you don't want to, but you do need to interpret and understand them
that's your whole job
ripe forge
frankly, you don't need to know how these tools work, just know bigger number is better, and so on
wooden sail
not only. say you get a small number. the immediate question is "how do i fix this"
and no one can give you a one size fits all answer to that, because that depends on the model and cost you chose, and the data you have which you also often can't even share
ripe forge
Sure, but I don't need to know the math to know how to fix it, since this information can always be looked up. There's always a trial and error approach to fixing things
the amount of "math" needed for that really shouldn't become a gatekeeping mechanism for people who just want to use data science as a tool, which is essentially all you really need in the industry. Things that you need to learn you'll be able to pick up as you go
wooden sail
oh, but that's very different from being a data scientist
ripe forge
why? the job title says data scientist
wooden sail
you could also be hired as a programmer and get by only using stuff you find on github without knowing how it works
ripe forge
Well, it's not like you know nothing. You do need to know the "knobs" so to speak, but yes, exactly
 unique flame
celest vine
Data scientists here. What is the most important skill according to you to becom...
unique flame
celest vine
Data scientists here. What is the most important skill according to you to becom...
Ethics
ripe forge
that's still a programmer
wooden sail
i would really argue otherwise
ripe forge
While i can understand your stance, i think in this instance, you should also recognize it's not how the world uses the term.
wooden sail
well, you can call anything whatever you want. the point is, when you run into difficult problems, will you be able to solve them? are you willing to claim you have expertise?
your entire job will be easier if you cover your bases
ripe forge
No, all one needs to be willing to claim is that they will be able to look this info up and absorb it
sure, easier, makes you better etc etc. but that's not the same as saying "youre not a data scientist"
wooden sail
ripe forge
No, all one needs to be willing to claim is that they will be able to look this ...
which basically means you'll anyway end up learning it
ripe forge
indeed, as you go.
wooden sail
i didn't say they needed it from the start, though. i said it is an inescapable component/skill of it
if you don't know it, you will anyway have to learn it
it is THE main skill, because the code you can anyway copy paste from any repo
fixing specific problems for your implementation needs you to understand stuff
ripe forge
Shouldn't that make the ability to learn more important than math itself?
velvet birch
If I have 0 in my features that I want to perform log transformation on, can I just replace 0 with some really small value like 0.00001?
ripe forge
the clarification that you dont need it from the start is useful, I did not get that from the initial statement
wooden sail
that's fair, i did only grunt out "math" very sternly. as for the ability to learn being more important, that's kind of a separate skill that you anyway need for most jobs that require you to stay up to date on state of the art content
anyway, you'll be putting that skill to use toward the learning of maths
the coding lang, libraries, etc aren't even that important
wooden sail
velvet birch
If I have 0 in my features that I want to perform log transformation on, can I j...
this depends on what you're trying to do. keep in mind you will anyway get huge values. pytorch, tf, and jax have built in ways of handling the NaNs and -infs you get out of log(0)
ripe forge
yeah, agreed
velvet birch
Yeah fair point
Am not using any of the mentioned libraries for my project so what can I try?
wooden sail
what are you trying to do?
velvet birch
The house price prediction dataset on kaggle
This is how the numeric column distribution is like

And this is the numeric column vs target (SalePrice column) scatterplot
 wooden sail
and what are we trying to do with them? fit a model to the histograms?
velvet birch
This is the EDA bit, here am trying to understand which columns are in need for transformation
wooden sail
well, that depends 😛 are you trying only to visualize or will use use the transformed data?
for visualization purposes, it's fine to just leave columns as nan or use a placeholder.
velvet birch
Yh I do plan to use the transformed data to train the model
That's why I was trying to get rid of the inf I'll get after transformation
wooden sail
all right. then yes, you can use a small float. that becomes a hyperparameter then and it introduces bias in your estimate (you're probably using some sort of exponential model, i guess), but it should be fine
velvet birch
I'll be going with tree models like GradientBoostRegressor
I don't think that in tree models the numerical values are a problem
wooden sail
in that case the bias might do more interesting stuff
velvet birch
Ah okay any reason for why exponential models won't have this?
wooden sail
the also will, but exponential functions decay very quickly
velvet birch
Alrighty, so it'll be the best to not transform the column unless it has a high skewness
wooden sail
i think for example sklearns gradient boosting regressor uses something like an ensemble of mean estimators. you could end up with some of the weak regressors learning exactly the value you choice to put instead of 0
exponential models have different parameters that don't directly represent the observed values
you could ofc use some sort of exponential function with your gradient boosting though. how exactly are you planning to do yours?
velvet birch
wooden sail
i think for example sklearns gradient boosting regressor uses something like an ...
So they are bad at generalizing?
velvet birch
wooden sail
you could ofc use some sort of exponential function with your gradient boosting ...
No idea, am new to this thing lol
wooden sail
that's not it, i'm just saying your hyperparameters have an influence that depends on the model
velvet birch
I guess I should first learn the proper methods of model building first
wooden sail
let's wait and see if someone can give you a more down to earth explanation
 celest tendon
Hello guys, what machine learning algorithm should be used to find the optimal hospital placements?
I have the addresses of the inhabitants of a region and I have the location of the hospitals in this same region, and I would like to know if the hospitals are well located. If not, I would like to give the optimal location according to the density of the inhabitants. I have used the K-mean but I am not sure if it is the right algorithm
wooden sail
k means is good for this version of the problem, sure
the more difficult version minimizes euclidean distance, i think it's called the weber problem
celest tendon
ok thnx ! Do you know another algorithm ? I would to compare my k means results with another one
wooden sail
k means is rather standard, that should be fine
if you're interested though, do read about the weber problem. you could feed it into your favorite solver after formulating your problem that way
velvet birch
Sorry for asking this but how did you learn how to just make models and handle data?
wooden sail
that's the funny part where my discussion with Darr comes in 😛
i did a masters and am doing a phd just to be able to solve a small number of problems more or less ok
so my answer is again "by learning some maths"
doesn't have to be in uni, doesn't have to be BEFORE you try and do AI/DS/sigproc stuff. but you do it at some point, because that's the bread and butter
velvet birch
I see so it's all just the mathematical intuition that helps here
Books would be the best way to go through all this then?
celest tendon
wooden sail
if you're interested though, do read about the weber problem. you could feed it ...
Thank you, actually I am reading some research articles
wooden sail
some combination of books, lectures, youtube, papers, etc. in general books and papers are the most in depth and detailed, but often lack intuition and are difficult to digest. videos and lectures (and blogs) are a lot more intuitive, but are often superficial (plus videos and blogs often are plain wrong or contain mistakes). something like following a lecture while complementing it with a book is nice, or if you're very independent with your learning, yeah, just peruse books and papers and fish out what you need
the important part tends to be not really the medium of the info, nor how it is presented, just that you are interested. if your motivation easily wells up from within, great! if not, having a great teacher can motivate you from the outside
velvet birch
Thanks for this info! I guess I'll be getting a bit into books and papers from now
lapis sequoia
say i have a csv file like this. how could i use pandas so that i make a table where it only displays rows that have "lost" and then how do i check how many of those rows are over 100
 wooden sail
after loading it up into a df, you want to do something like sum(df['A.R'] == 'Lost' and df['N.o.T.'] > 100)
lapis sequoia
wooden sail
after loading it up into a df, you want to do something like sum(df['A.R'] == 'L...
i tried that but it didnt work
the csv file also has 3 other columns
but theyre irrelevant for what im trying to do
do you think i need to use them too somehow?
the most i could get was a table of all the entries where "A.R" was == "Lost"
wooden sail
what error did you get?
ah a stack overflow says it show be & instead of and when comparing cols, can you give that a shot?
lapis sequoia
wooden sail
ah a stack overflow says it show be & instead of and when comparing cols, can yo...
sorry so youre saying i should try sum(df['A.R'] == 'Lost' & df['N.o.T.'] > 100)
?
lapis sequoia
wooden sail
what error did you get?
 earnest widget
What does dying relu mean? How does leaky relu solve the issue? All I know is that it generates negative values when the input is less than zero, does that mean the labels as the input to the model?
wooden sail
lapis sequoia
sorry so youre saying i should try sum(df['A.R'] == 'Lost' & df['N.o.T.'] > 100)
In [12]: import pandas as pd

In [13]: df = pd.DataFrame({'a':['x', 'y', 'x'], 'b':[120,1,0], 'c': ['beep', 'boop', 'blergh']})

In [14]: sum((df['a'] == 'x') & (df['b'] > 100))
Out[14]: 1
this works. note that the extra parentheses are absolutely necessary because & has a higher precedence than == and >=
velvet birch
lapis sequoia
Use & instead of and enclose the condtions in paratheses
Instead of using and and or you have to use & and |
Idk why it's this way but it works
wooden sail
earnest widget
What does dying relu mean? How does leaky relu solve the issue? All I know is th...
so, the gradient of the relu is defined as 0 if x <= 0, and 1 otherwise. you can run into the issue that, at some point through the learning procedure, a relu turns to 0. at that point, it and its gradient stay at 0 for the rest of the learning, even if this is not the best solution (this depends on the trajectory the parameters take). to avoid this, leaky relus leave the gradient as some small value instead of 0, so the gradient can still change later on
lapis sequoia
wooden sail
```py
In [12]: import pandas as pd
In [13]: df = pd.DataFrame({'a':['x', 'y', '...
ahh i see
lapis sequoia
velvet birch
Instead of using `and` and `or` you have to use & and |
is it just because were using pandas?
velvet birch
Yhp
wooden sail
it's because we're comparing arrays elementwise, instead of comparing scalars
earnest widget
wooden sail
so, the gradient of the relu is defined as 0 if x <= 0, and 1 otherwise. you can...
Oh okay, this makes sense. I was finding it hard to understand the explanation online since they are all the same lol.
violet gull
def gradientDescent(listOfLayers, listOfActivationFunctions, lossCalculator):
dlda_dadz = listOfActivationFunctions[len(listOfActivationFunctions)-1].derivative() * lossCalculator.derivative()
for i in reversed(range(len(listOfLayers))):
weightDeriv, biasDeriv = listOfLayers[i].derivative()
listOfLayers[i].backward(weightDeriv * dlda_dadz, biasDeriv * dlda_dadz)
dlda_dadz *= listOfActivationFunctions[i-1].derivative() * listOfLayers[i].weights
``` can someone verify the math on this is correct? vast lily
Hey guys have you worked on the selenium grid needed help from you please
violet gull
violet gull
```py
def gradientDescent(listOfLayers, listOfActivationFunctions, lossCalculato...
and also why its doing this
ValueError: operands could not be broadcast together with shapes (1,1,3) (300,)```hi if i have a dataframe like this currently

how can i make a new dataframe where its just the sum of number.of.transactions depending on whtehter or not theyre the same year
if that makes sense
opal stag
experiments.py: https://gist.github.com/marouan-itu/9aebcacb907200f69933cf16a2f79325
experiments.py takes three java algorithms and run measurements on them to get a results.csvfile as output. See the photo: https://i.imgur.com/W1H34kk.png
postprocess.py: https://gist.github.com/marouan-itu/01382d56ff386704354e7c418f237c62
postprocess.py reads these results. First it makes LATEX documents for each algorithm with the average and standard devation. Three algoname.tex files are created, looking like this:
\begin{tabular}{rrr}
$n$ & Average (s) & Standard deviation (s)\\\hline
30 & 0.171406 & 0.080930\\
\end{tabular}
postprocess.py then uses the function plot_algorithms (matplotlib) to make a pdfthat plots the time and number of elements n as a figure graph. See photo: https://i.imgur.com/QooNj4O.png
My problem: I don't know why the postprocess.py only gets one data point (ie. one measurement for each algorithm).
My goal: I should create a plot that shows the runtimes of the algorithms as a function of n on a logarithmic scale.
It should be a simple parameter fix somewhere, but I have no idea how. I don't know Python but my professor says I should use this code to make the measurement.

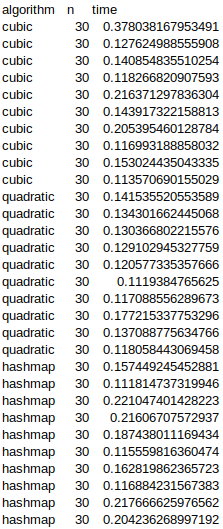
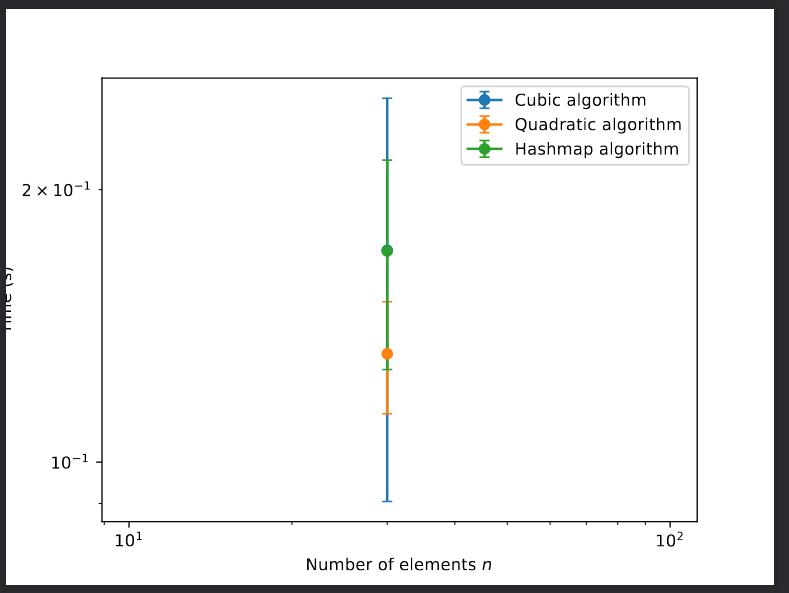 violet gull
```py
def gradientDescent(listOfLayers, listOfActivationFunctions, lossCalculato...
violet gull
violet gull
```py
def gradientDescent(listOfLayers, listOfActivationFunctions, lossCalculato...
Help pls
 untold bloom
lapis sequoia
hi if i have a dataframe like this currently
untold bloom
lapis sequoia
hi if i have a dataframe like this currently
hi, IIUC, you're looking for "sum of number-of-transactions per year"; this translates to
df.groupby("year")["number-of-transactions"].sum()
ahh i see
lapis sequoia
untold bloom
hi, IIUC, you're looking for "__sum__ of __number-of-transactions__ per __year__...
how could i use this and plot a line graph with it?
untold bloom
perhaps try .plot() at the end
lapis sequoia
oh wow thank you i didnt realise you could do that without manipulating it a bit more
 delicate lintel
why in the sklearn docs does it say that sklearn.LabelEncoder should only be used for target variables and not for input variables?
untold bloom
terminology "label" is used for the targets
delicate lintel
untold bloom
terminology "label" is used for the targets
is that it? isn't there a reason beyond terminology?
delicate lintel
ok so just for readability then?
untold bloom
indeed
delicate lintel
untold bloom
OrdinalEncoder is for features
ik but i don't really get why we need two of those that do basically the same thing
lapis sequoia
untold bloom
perhaps try `.plot()` at the end
is there anyway i could edit the x and y axis labels? i tried just putting .plot(x="year", y="annual) but it stays the same
untold bloom
xlabel= and ylabel= instead
lapis sequoia
untold bloom
`xlabel=` and `ylabel=` instead
legendd!!
untold bloom
you can pass legend=True, although you have 1 line plot, so...
title= is perhaps more appropriate but it's up to you
lapis sequoia
untold bloom
you can pass `legend=True`, although you have 1 line plot, so...
oh no i mean i was just calling you a legend
untold bloom
oh okay, undeserved, but okay :p
 foggy lava
ok so I'm doing some NLP stuff
I'm using sklearn's LogisticRegression
because I'm trying to predict the severity level of a medical condition based on certain keywords used
and I have a database of different keywords with their corresponding severities (currently it's a csv file which I will import as a pandas dataframe)
My target variable is the severity (which is a whole number and it is categorical because it's only the numbers 1-4)
my current single feature is the keyword itself (I feel like I need more features but I don't know what to use)
My aim is to analyse sentences in order to calculate the possible severity
but I don't know how to make the words in the database fit with the logistic regression model which requires numerical input
Am I using the wrong model for this or do I need to do some extra steps with the data?

 stuck schooner
you are trying to build a model that takes a world and predict severity. The word in itself could be one of the feature but cannot be the only feature. The only things a model would do with this feature is return the severity for known word.
foggy lava
true
stuck schooner
The set of features to predict severity should not necessarly even include the keyword but rather a set of caractheristic about the word
foggy lava
that makes sense
stuck schooner
does it have a rough pronunciation ? Maybe word that end with 'ing' are better in severity than 'ic'. Is it a technical word ?
It would then make sense with a set of features like this to use logistic regression but here not
foggy lava
um I don't think it's the word structure/spelling itself but its meaning instead
foggy lava
stuck schooner
does it have a rough pronunciation ? Maybe word that end with 'ing' are better i...
because it's medical related
foggy lava
stuck schooner
does it have a rough pronunciation ? Maybe word that end with 'ing' are better i...
in my prototype I might use the word structure a bit
but I'm not sure if it will be accurate
is there some way to tell the contextual meaning of the words
desert oar
foggy lava
ok so I'm doing some NLP stuff
I'm using `sklearn`'s `LogisticRegression`
becaus...
the basic entry point here is the "bag of words" model in which you ignore the order of the words and treat it as an unordered collection of tokens, a "bag"
the absolute simplest encodings are to count the number of times each word appears in each document, and to encode the data as 1 column per word, with the count of words in that word's corresponding column
velvet birch
Is such a plot acceptable? The orange one is the countplot for each group while the blue one is the boxplot for each group
 desert oar
velvet birch
Is such a plot acceptable? The orange one is the countplot for each group while ...
desert oar
velvet birch
Is such a plot acceptable? The orange one is the countplot for each group while ...
yeah this is actually a very nice visualization imo. packs a lot of info into one place. also interesting (possibly good) choice to omit y axis labels, since there would be 2 y-axes and it might clutter the chart too much visually
however you definitely should report on the actual numerical ranges of that data somewhere. and you should clarify whether these are sales prices or log sales prices
 desert oar
if this is matplotlib use fig.tight_layout() to try to fix the label overlaps
but i agree it adds a lot of clutter unless you make the figure area a lot bigger
i also might suggest using robust adjusted boxplots since prices are almost always skewed (as you see here) -- i'm not sure about a python implementation, but there is one in the r package robustbase that you can call using rpy2
velvet birch
I am using seaborn for this so it might work here. I predominantly use plotly for literally everything which becomes realllllly exhaustive
Yh sure it's interactive but a 4x4 subplot in plotly doesn't need to be interactive plus would take 30 lines of code to make
velvet birch
desert oar
i also might suggest using _robust adjusted_ boxplots since prices are almost al...
Can you give a gist of what these kinda boxplots do?
desert oar
you are doing cleveland, tufte, and tukey justice with this one. good job and i'm going to steal this idea (overlaying boxplots on top of frequency bars)
oh another suggestion: consider violin plots instead of boxplots (with alpha transparency so you can still see the count bar behind it)
velvet birch
Dunno any of the three things you mentioned but am happy that it's acceptable
Having two subplots was a real pain
desert oar
look them up 🙂
https://rdocumentation.org/packages/robustbase/versions/0.95-0/topics/adjbox this is the adjusted boxplot implementation in R, it comes from:
Hubert, M. and Vandervieren, E. (2008). An adjusted boxplot for skewed distributions, Computational Statistics and Data Analysis 52, 5186--5201. 10.1016/j.csda.2007.11.008
Produces boxplots adjusted for skewed distributions as proposed in
Hubert and Vandervieren (2008).
let me try to find a free copy (you can also use the "scientific hub" site)
i don't remember how it works anymore but i've been using them for years on skewed data 😆
velvet birch
So adjusted boxplots are helpful for skewed data?
That way not everything would be considered an outlier
I do have a lot of skewed columns so this would be helpfull
 desert oar
right, that's the point. it tries to set the "whiskers" more intelligently to avoid showing excessive outliers when the data is skewed. in general the field of "robust statistics" is dedicated to working with data that has extreme values, outliers, etc. and still getting good estimates of "central tendency".
🤫 don't ask where i got it
velvet birch
Damn reading papers really helps
desert oar
the fact that you realize this makes you significantly more effective than any code jockey who followed a pytorch tutorial
not that there's anything wrong with tutorials when you're first learning, but there comes a point when you need to start reading the real stuff otherwise you're just following other people's sloppy recipes
velvet birch
I haven't even touched any ANN libraries cause I still have yet to figure out how to properly use sklearn itself
desert oar
fwiw scikit-learn isn't a pre-requisite for e.g. pytorch. although its .fit/.predict api design has been widely copied and adopted e.g. by keras so it's worth at least exploring a bit.
also scikit-learn has really good "user guide" docs that are a very nice balance of demonstrating theory and practice. good reading for any practitioner imo, even if you don't plan to use scikit-learn much.

scikit-learn
User Guide: Supervised learning- Linear Models- Ordinary Least Squares, Ridge regression and classification, Lasso, Multi-task Lasso, Elastic-Net, Multi-task Elastic-Net, Least Angle Regression, LA...
velvet birch
desert oar
you are doing cleveland, tufte, and tukey justice with this one. good job and i'...
Coming back to these three from what I've gotten so far is that cleveland vis is having overlayed graphs and tukey vis is basically the boxplot
desert oar
and tufte for the insight of removing the (in this case unnecessary) y axis labels for visual clarity
velvet birch
desert oar
also scikit-learn has really good "user guide" docs that are a very nice balance...
Yh I was going through a few of these for feature selection and was really shocked how I didn't try this earlier
They explain things very nicely without going into too much depth and even tell us the particular usecases of certain things and where they are best used
velvet birch
desert oar
and tufte for the insight of removing the (in this case unnecessary) y axis labe...
So you go with tufte vis in cases where proportion is kinda more necessary than the actual y-axis values themselves
desert oar
velvet birch
So you go with tufte vis in cases where proportion is kinda more necessary than ...
heh i was more talking about their "essence" than anything specific
velvet birch
Well yh gotcha
Like in the case I removed the y-axis values
I did it cause there wasn't much point of knowing how much the exact count exactly is
I just need to know if some group is dominating the other with sheer number or not
So yh that's basically getting the essence of the countplot
desert oar
precisely
i strongly suggest buying and spending some quality time with a copy of each of their books:
-
Edward Tufte, The Visual Display of Quantitative Information. This one is beautiful and can absolutely be a "coffee table" book if you're a nerd like me. Apparently he typeset the whole thing by hand in his garage.
-
William Cleveland, The Elements of Graphing Data. It's a lot more technical and detailed than Tufte, but also has more practical advice for making "scientific" visualizations rather than things that will mostly be used in reports to non-scientists.
they're both cheap ($10?) and widely available
 desert oar
i was working on that message in my text editor 😛 (but i do type somewhat fast)
velvet birch
desert oar
i strongly suggest buying and spending some quality time with a copy of each of ...
Imma have to just add them to the list right now instead of going straight into them cause am having MASSIVE troubles with the intuition behind model building itself. What type of data to use, what transformation to do, what algorithm to go with and all of that
desert oar
velvet birch
this is what we use for adjusted boxplots?
this is from the paper intro? that is an older version developed by other people that they are saying is insufficient
velvet birch
No that is from another source I looked into
desert oar
oh, that's funny because they cite it as an example of something that isn't good enough
hubert's & vandervieren's technique is to use the "medcouple" (a robust measure of skewness) and set the bounds as some function of the medcouple
velvet birch
For my use case an adjusted boxplot would be "perfect" as a lot of the data is coming out as an outlier cause of the skewness
desert oar
if you dont want to use rpy2 you could probably implement it yourself from the paper, shouldn't be too hard
it's yet another pile of matplotlib code though... nothing like a 500 line plotting routine
velvet birch
I am a python one so can't use rpy2
Am just looking into any libraries that allow that
desert oar
rpy2 is a python library, it calls an r process from python
velvet birch
Ah okay never mind
desert oar
velvet birch
Imma have to just add them to the list right now instead of going straight into ...
i think the more you learn about how each model works, the more you build intuition
(rpy2 site: https://rpy2.github.io/)
but it's also good that you recognize that you lack intuition currently. you can then focus on the right things
velvet birch
that is the primary goal for now
I was thinking of looking into ISLR as Edd suggests stats books for better intuition
desert oar
i also suggest stats books
i haven't read through ISLR in years, but i remember ESL was more like a buffet of interesting techniques than anything. although it was a great starting point to learn about a variety of less-known tools.
do you understand how linear regression works? that's i think the most important place to start
desert oar
from there, i would suggest making sure that you understand the concept of a mathematical "vector space", without getting too deep into the linear algebra but recognizing the insight that any model is ultimately a function that maps points in one space to points in another space
desert oar
velvet birch
I do understand how Gradient Descent works
i suggest learning least squares regression, it will force you to contend more directly with convex optimization and the statistical side of model building
velvet birch
desert oar
from there, i would suggest making sure that you understand the concept of a mat...
Lucky for me I have vectors this semester itself
velvet birch
desert oar
i suggest learning least squares regression, it will force you to contend more d...
I was thinking of learning about OLS as well but no YT videos on it
They just mention it but never go into the matrix multiplication bit
desert oar
well if you're in school then take a stats class
youtube videos are really not great for learning this kind of thing
wooden sail
i can show you the ordinary least squares part if you give me a few mins
desert oar
i don't much anymore, but i used to a lot
wooden sail
how are you doing on multivariate statistics
velvet birch
desert oar
oh another suggestion: consider violin plots instead of boxplots (with alpha tra...
A violin plot can also help us in seeing which regions of our data are more densely populated just like histogram and kde right?
desert oar
velvet birch
A violin plot can also help us in seeing which regions of our data are more dens...
right, it's literally a kernel density plot turned on its side
velvet birch
Ah noice
desert oar
boxplots might be easier to read in this case however
opal stag
I found the problem with my project. My resulting .csv has only one n (30), but I need to get several ones (that grow like a logarithmic scale, see photo). I have no idea how to do this though, as I_MAX is a single value...
# how many different values of n
I_MAX : int = 30
# the different values of n
NS : List[int] = [int(30 * 1.41 ** i ) \
    for i in range(I_MAX)]
# how many repetitions for the same n
M : int = 5
# seed for the pseudorandom number generator
SEED : int = 314159
# the PRNG object
rng = np.random.default_rng(SEED)
# The generated input :
# The dictionary maps n to a list of lists
# each list contains M lists of n ints
INPUT_DATA : Dict[int, List[List[int]]] = {
    n : [rng.integers(1, 2**28, n) \
        for _ in range(M)] \
    for n in NS
}

def benchmark(algorithm: str, jar: str)-> \
    List[Tuple[int, float]]:
    results : List[Tuple[int, float]] = list()

    for n in NS :
        try :
            result_n : List[Tuple[int, float]] = list()
            for i in range(M):
                input: List[int] = INPUT_DATA[n][i]
                diff: float = measure(algorithm, jar,
                    input)
                result_n.append((n, diff))
            results += result_n
        except subprocess.TimeoutExpired:
            break
        return results

if __name__ == '__main__':
    with open('results.csv', 'w') as f:
        writer = csv.DictWriter(f,
            fieldnames = ['algorithm', 'n', 'time'])
        writer.writeheader()
        for algorithm, jar in INSTANCES:
            results : List[Tuple[int, float]] = \
                benchmark(algorithm, jar)
            for (n, t) in results :
                writer.writerow({
                    'algorithm' : algorithm,
                    'n' : n,
                    'time' : t
                })
 desert oar
especially if you use the "notched" kind https://stackoverflow.com/a/38795446/2954547

Stack Overflow
I tried to make a notched boxplot using matplotlib, but found the notched box tends to overextend and then fold back on itself. This does not happen when I make a regular boxplot.
This can be see...
velvet birch
desert oar
boxplots might be easier to read in this case however
If we use alpha correctly we can have all three...but I wonder if it's just overkill
desert oar
@opal stag i think we need some context for this. what is INSTANCES? is this your code or someone else's that you've adapted?
desert oar
velvet birch
If we use alpha correctly we can have all three...but I wonder if it's just over...
i wouldn't do all 3, probably overkill
opal stag
desert oar
<@305362010374406144> i think we need some context for this. what is `INSTANCES`...
It is a code that I have to adapt, because of my professor. My algorithms are in java, and this python code runs experiments on it by using the Jars
The whole experiments file is here (its not much longer, but it shows what INSTANCES is and how it takes java input, maybe slightly irrelevant)
velvet birch
desert oar
i wouldn't do all 3, probably overkill
I'll look into the adjusted boxplot you talked about there\
Oh yh one last thing, is it a good idea to know both Python and R?
opal stag
desert oar
<@305362010374406144> i think we need some context for this. what is `INSTANCES`...
I made a reddit post about it, and someone replied it was the number of n that I need to change. I just have no idea how: https://www.reddit.com/r/learnpython/comments/x40fhj/matplotlib_graph_error/
 desert oar
velvet birch
Oh yh one last thing, is it a good idea to know both Python and R?
desert oar
velvet birch
Oh yh one last thing, is it a good idea to know both Python and R?
meh, it's probably useful but not worth spending your energy on. focus on learning other things
 agile cobalt
velvet birch
Oh yh one last thing, is it a good idea to know both Python and R?
agile cobalt
velvet birch
Oh yh one last thing, is it a good idea to know both Python and R?
it definitely doesn't hurts to know more languages, specially if those around you are using R, but you can do most things in python just fine
velvet birch
Gotcha, so unless I really need to learn R I should'n't
desert oar
opal stag
I made a reddit post about it, and someone replied it was the number of `n` that...
eyeballing the code you posted here, that csv should have more than one row in its output
however you don't define INSTANCES here so it's hard to know for sure
opal stag
desert oar
however you don't define `INSTANCES` here so it's hard to know for sure
https://gist.github.com/marouan-itu/9aebcacb907200f69933cf16a2f79325
INSTANCES: List[Tuple[str, str]] = [
    ('cubic', 'threesum/app/build/libs/app.jar'),
    ('quadratic', 'threesum/app/build/libs/app.jar') ,
    ('hashmap', 'threesum/app/build/libs/app.jar')
]
My csv has more than one row in the output, but only for the n of size 30 (I_MAX). But it should have multiple runs, of growing n sizes
desert oar
opal stag
https://gist.github.com/marouan-itu/9aebcacb907200f69933cf16a2f79325
```python
I...
oh i see. that's because benchmark is only returning results for one n
opal stag
Right now the CSV is like this but it needs different sizes of n
 desert oar
you have return results inside the for n in NS loop!
you probably just need to un-indent it by one level
opal stag
desert oar
you have `return results` _inside_ the `for n in NS` loop!
Oh I see
I will reboot into linux and try to change it
desert oar
what code editor do you use? it's helpful in python to have visual "indent guides" so you can more easily see if something is indented incorrectly
opal stag
desert oar
what code editor do you use? it's helpful in python to have visual "indent guide...
visual studio code
desert oar
opal stag
visual studio code
this is what indented python code looks like in sublime text, i bet you can configure vs code to do similar

actually this demonstrates the indent guides better
 opal stag
desert oar
this is what indented python code looks like in sublime text, i bet you can conf...
opal stag
desert oar
this is what indented python code looks like in sublime text, i bet you can conf...
def benchmark(algorithm: str, jar: str)-> \
    List[Tuple[int, float]]:
    results : List[Tuple[int, float]] = list()

    for n in NS :
        try :
            result_n : List[Tuple[int, float]] = list()
            for i in range(M):
                input: List[int] = INPUT_DATA[n][i]
                diff: float = measure(algorithm, jar,
                    input)
                result_n.append((n, diff))
            results += result_n
        except subprocess.TimeoutExpired:
            break
        return results
the last line here right?
desert oar
opal stag
the last line here right?
yes, that return is inside the loop. in a curly-brace language it would look like this:
for (n in NS) {
  ...
  return results
}
Would you recommend sublime text for python then? its maybe more clear
desert oar
vs code is probably similar and i think has better IDE-like features out of the box
but sublime is super fast and stable, and does have LSP & REPL plugins as well as at least one package for "upgraded" python 3 syntax
it's also one of the only not-FOSS programs i use for work, it's really good software
nowadays i do most of my editing in neovim but i use sublime when i want a more gui-oriented editor, or i just want a change of pace (less keyboard-driven)
opal stag
desert oar
it's also one of the only not-FOSS programs i use for work, it's really good sof...
I am running the experiments, and this time it takes waaaay longer
maybe the indentation was the reason for only one single n value?
I still dont have results
desert oar
opal stag
maybe the indentation was the reason for only one single `n` value?
like i said, that's exactly why! you wrote:
for n in NS:
    ...
    return results
but you meant
for n in NS:
    ...
return results
AAH
It only loops through ONE n
XD
It returns immediately!
oh god
I wasted 14 hours on this or so XD
desert oar
LOL
welcome to programming!
a bit harder to make this mistake in idris than in python...
opal stag
desert oar
welcome to programming!
Oh yeah, I am also programming in Idris:D It is so nice and easy to write
very safe language
desert oar
i recognized you from the server 🙂
opal stag
Yep I thought you were familiar
desert oar
you have a very distinctive username
however i actually know something about python. every time i touch idris i feel like i am using alien technology that i only slightly understand
 strong sedge
I have a doubt regarding p values,
from what I understand, p values are the probability of a column being random (higher is bad, lower is good)
I was testing logistic regression on a made up dataset, I am getting really high pvalue, which doesnt make sense, since the madeup data is not random
def sigmoid(v):
    return 1 / (1 + np.exp(-v))

def random_sigmoid(v):
    return sigmoid(v) + random.uniform(-0.05, 0.05)

data_set = pd.DataFrame()
data_set['x'] = [i for i in range(-100, 100)]
data_set['y'] = [1 if random_sigmoid(i) >= 0.5 else 0 for i in range(-100, 100)]```
this is my made up data set,
I was using statsmodels.api.Logit for the logistic regressor
for a better look at the code please look at https://github.com/sivansh11/Regressions/blob/main/test/main.ipynb
GitHub
A repo for me to keep all my regressor practicing code - Regressions/main.ipynb at main · sivansh11/Regressions
opal stag
desert oar
however i actually know something about python. every time i touch idris i feel ...
Yup Idris is pretty advanced
My terminal is still running the code for generating the csv
jesus 😄
strong sedge
strong sedge
I have a doubt regarding p values,
from what I understand, p values are the prob...
I forgot to mention that I am new to machine learning in general, advice appreciated :D
desert oar
strong sedge
I have a doubt regarding p values,
from what I understand, p values are the prob...
p values are the probability of a column being random
nope, that is not at all what a p-value is! fortunately this is so totally wrong that you can just forget you ever learned this and start from scratch 😛
strong sedge
desert oar
> p values are the probability of a column being random
nope, that is not at all...
what is it then ?
desert oar
strong sedge
what is it then ?
what are you actually trying to test here?
strong sedge
:(
desert oar
the p-value is "assuming that the null hypothesis is true, the probability of seeing a test statistic at least as extreme as the one that was observed"
as you can see, it requires a bit of context and knowledge about stats concepts
 trail quarry
how much slower is working with images than working with numbers in tensorflow?
desert oar
and it's a bit of a tricky concept conceptually, so building up those concepts carefully and with correct intuition is very important
strong sedge
desert oar
what are you actually trying to test here?
I just wanna test if the model can correctly understand the data I "generated"
desert oar
trail quarry
how much slower is working with images than working with numbers in tensorflow?
images become big piles of numbers anyway, but "a bit" to "a lot" depending on the model you're using. mostly machine learning on images and text is slow and requires gpu acceleration because the models are huge, not because the input data is necessarily huge
agile cobalt
trail quarry
how much slower is working with images than working with numbers in tensorflow?
a image is "just" a 3D (or 2D, if greyscale) array of numbers usually
strong sedge
desert oar
and it's a bit of a tricky concept conceptually, so building up those concepts c...
do u have any resource you would recommend ?
desert oar
strong sedge
I just wanna test if the model can correctly understand the data I "generated"
okay, that's actually a very good strategy
desert oar
strong sedge
do u have any resource you would recommend ?
an intro stats textbook
https://leanpub.com/os this is one option that is pay-what-you-want if you don't have money
Leanpub
A complete foundation for Statistics, also serving as a foundation for Data Science. Leanpub revenue supports OpenIntro (US-based nonprofit) so we can provide free desk copies to teachers interested in using OpenIntro Statistics in the classroom and expand the project to support free textbooks in other subjects. More resources: openintro.org.
trail quarry
desert oar
images become big piles of numbers anyway, but "a bit" to "a lot" depending on t...
got it, thank you
strong sedge
desert oar
okay, that's actually a very good strategy
thanks 😅
I was actually trying to apply logistic regression to a personality dataset, and was getting weird results (the model always gave a false, no matter what the input was)
so I wanted to get a sanity check that sklearn or statsmodel packages are not broken 😅
strong sedge
desert oar
https://leanpub.com/os this is one option that is pay-what-you-want if you don't...
ill take a look 👍
desert oar
@strong sedge other options:
- http://mitran-lab.amath.unc.edu/courses/MATH768/biblio/introduction-to-prob-models-11th-edition.PDF
- https://faculty.ksu.edu.sa/sites/default/files/677_fr37hij.pdf
- http://egrcc.github.io/docs/math/all-of-statistics.pdf
- http://www.mim.ac.mw/books/Mathematical statistics, basic ideas and selected topics Vol 1, Second Edition.pdf
desert oar
strong sedge
thanks 😅
I was actually trying to apply logistic regression to a personality d...
the packages are almost certainly not broken. however it's actually a very good idea to test your model on simulated data before trying it on real data. if i can't fit to the simulated data, then the model is bad and will never work on real data!
opal stag
desert oar
however i actually know something about python. every time i touch idris i feel ...
Slightly unrelated but did u see my new compiler (WIP, missing function calls) I made in idris?
strong sedge
desert oar
the packages are almost certainly not broken. however it's actually a very good ...
yea, these packages are extensively tested, so no way are those broken
desert oar
opal stag
Slightly unrelated but did u see my new compiler (WIP, missing function calls) I...
i've been seeing your posts yes. i am probably one of the few idris users with very little interest in compiler development 😆
opal stag
desert oar
i've been seeing your posts yes. i am probably one of the few idris users with v...
Understandable 😂 but I found that developing compiler taught me a lot about how to program
opal stag
desert oar
i've been seeing your posts yes. i am probably one of the few idris users with v...
Oh god this was the actual reason for why it didn't work!! Can you imagine one indentation just made all the world difference. Now my 14 hour bug fixing is done XD
 desert oar
opal stag
Oh **god** this was the actual reason for why it didn't work!! Can you imagine o...
desert oar
opal stag
Oh **god** this was the actual reason for why it didn't work!! Can you imagine o...
great! looks like some clear results too
strong sedge
how big of a role does normalisation play for predictions ?
I just went from my model always predicting false, to actually making some sensible predictions with normalization
wooden sail
a big one, it affects how many iterations it takes to reach a minimizer
strong sedge
wooden sail
a big one, it affects how many iterations it takes to reach a minimizer
GitHub
A repo for me to keep all my regressor practicing code - Regressions/main.ipynb at main · sivansh11/Regressions
wooden sail
you can't link to a ton of data with no explanation and ask if it makes sense, none of the stuff makes sense to me at a glance 😛
strong sedge
wooden sail
you can't link to a ton of data with no explanation and ask if it makes sense, n...
I thought the file made sense 😅 gimme a min I'll add comments to it and tag u back
cyan sierra
https://ianlondon.github.io/blog/encoding-cyclical-features-24hour-time/
Why are we using sin and cos (and not anything else) to encode cyclical features?

Ian London's Blog
Some data is inherently cyclical. Time is a rich example of this: minutes, hours, seconds, day of week, week of month, month, season, and so on all follow cycles. Ecological features like tide, astrological features like position in orbit, spatial features like rotation or longitude, visual features like color wheels are all naturally cyclical.
wooden sail
i probably won't have a chance to check. going by the confusion matrices at the end, i get the impression the second one is after normalization and that looks ok. the one before needs more/better taining
wooden sail
cyan sierra
https://ianlondon.github.io/blog/encoding-cyclical-features-24hour-time/
Why are...
any periodic function would work, but as it turns out, most interesting periodic functions you will run into can be expressed as a sum of sines and cosines anyway (fourier series). they're very natural, well behaved functions
strong sedge
wooden sail
i probably won't have a chance to check. going by the confusion matrices at the ...
Ohh okok
strong sedge
lapis sequoia
How to code AI with python
Umm, ai is a very general term, you need to narrow down what you mean by ai
lapis sequoia
strong sedge
Umm, ai is a very general term, you need to narrow down what you mean by ai
Artificial intelligence
strong sedge
lapis sequoia
Artificial intelligence
You just expanded ai to its full form
I meant u wanna make a ai for beating a game
Or you wanna make a ai for predictions
Or for recommendation system
lapis sequoia
idk
 hasty grail
lapis sequoia
idk
hasty grail
lapis sequoia
idk
Then I'm afraid we can't really help you. It's like saying you want help with making a game but you don't know what the game is about.
strong sedge
lapis sequoia
idk
Explore the term artificial intelligence and machine learning in Google
Keep checking what stuff means
lapis sequoia
Hello
lapis sequoia
hasty grail
Then I'm afraid we can't really help you. It's like saying you want help with ma...
chicken sandwich with ketchup and mayo
lapis sequoia
strong sedge
Explore the term artificial intelligence and machine learning in Google
Keep che...
Thank's
 dusty valve
i wanna train a model on a google colab notebook and save the weights as an .h5 file, how do i save that .h5 file locally
wooden sail
locally on your pc or locally in colab
though in both cases the easiest way is to save it to google drive
dusty valve
wooden sail
like so https://stackoverflow.com/questions/48376580/google-colab-how-to-read-da...
thanks
 final onyx
Hey !! What's the best code editor for Deep Learning models - both creation and deployment ??
Or IDE ?
trail quarry
How can I make my model.fit() continue running, even if it errors?
is that possible?
dusty valve
final onyx
Hey !! What's the best code editor for Deep Learning models - both creation and ...
i really like google colab notebooks for that
dusty valve
trail quarry
How can I make my `model.fit()` continue running, even if it errors?
!pypi fuckit
arctic wedgeBOT

The Python Error Steamroller
dusty valve
although this would be a very bad idea
since that outlines an underlying issue with it
dusty valve
no
final onyx
@dusty valve thanks !
If there anything we can use on our systems though ?
A little more control would be welcome
trail quarry
i use VSCode and it works just fine
dusty valve
bruh i spent 3 hours training and debugging a model to find out i made a damn typo of TWO LETTERS
i typed min = instead of m = :\
cyan sierra
wooden sail
any periodic function would work, but as it turns out, most interesting periodic...
Thank yoU!
I was wondering, does it make sense to scale ordinal features (for e.g., Likert and a review score from 1 to 5)
final onyx
Gracias !
lapis sequoia
Hi. I don't know if this is the right place to ask but, does anyone know about how to create a temp view using pyspark? I have been researching online, but it keeps giving me error messages everytime I try to create it. I don't know what to do.
dusty valve
my model has a pretty high loss, im training it for 5 epochs rn, should i do more?
agile cobalt
unless your data is gigantic, 5 epochs is a pretty small amount of time iirc
mild dirge
dusty valve
my model has a pretty high loss, im training it for 5 epochs rn, should i do mor...
It depends on too many factors to tell
You should mainly be looking for if the loss is decreasing
With most projects (that I did at least) after a handful of epochs the performance is at least a lot better than random guessing
 bold timber
Hi, I have a question: How do backpropagation works in tensorflow?
 shrewd grove
Hi guys - I managed to create a semi-successful model, using cropped images. I wish I could train the model on a 1920x1080 dataset, but that eats all my ram, and then some. Is there something like a "crop" layer ?
mild dirge
Well it could just be part of pre-processing
I was just helping someone that indeed used a "cropping layer" coincidentally
shrewd grove
I see this, but not really sure how it works: https://keras.io/api/layers/reshaping_layers/cropping2d/
 mild dirge
But normally images are just numpy arrays, and you can do img = img[ymin:ymax, xmin:xmax]
Whenever you load the images
Or the batch
shrewd grove
oh, true that.
mild dirge
But cropping makes stuff kinda hard, since you still want all the important bits in the image
But sometimes the important bit is not in the center
shrewd grove
I am assuming that a simple array slicing would be faster than adding another layer ?
mild dirge
So most of the time a combination of scaling and cropping is used
mild dirge
shrewd grove
I am assuming that a simple array slicing would be faster than adding another la...
I'm sure that layer will be efficient as well
mild dirge
mild dirge
But normally images are just numpy arrays, and you can do `img = img[ymin:ymax, ...
It will probably just do this, but for the entire batch
mild dirge
shrewd grove
I see this, but not really sure how it works: https://keras.io/api/layers/reshap...
What do you not understand about this btw?
you can just add it as the first layer
And you give it appropriate arguments for the coordinates that you want to crop it to
shrewd grove
If tuple of 2 tuples of 2 ints: interpreted as ((top_crop, bottom_crop), (left_crop, right_crop))
is it in ... pixels ?
mild dirge
Yeah, probably how many pixels it removes from top, bottom, left and right, but it might be a bit different
shrewd grove
okay.
mild dirge
Having a very big image as input does mean the model will likely be bigger as well
shrewd grove
after the model is trained
mild dirge
1920x1080 is above a million pixels 😛
shrewd grove
is there a way to minimalize resource consumption ?
mild dirge
Are you loading all images at once?
shrewd grove
no, im intending to run a "as close to realtime as possible" application.
mild dirge
Yeah but for training
shrewd grove
yeah, I am
mild dirge
So you could always load in batches
Worst case scenario you load in 1 image at a time, i'm sure your ram could handle that, so you don't even need to crop/rescale it
But for your other question, you for sure need to load in the entire model and all the weights
So a smaller model means less memory that is needed
And doing 1 image at a time means you don't need as much memory at once
shrewd grove
I mean... theoretically all models could be evaluated by a bunch of for-loops and bits of maths
sooo... has noone tried that yet ?
mild dirge
Well yeah haha, but loading 1 layer at a time, evaluating, loading next etc.
not that efficient
So if you want it real-time, that's very likely a no-go
shrewd grove
oh, I mean for after-training.
mild dirge
Same situation
shrewd grove
and "real-time" in this scenario probably means 5-10 networks parsing an image in less than 500ms ?
mild dirge
You need to load the entire model at once, otherwise it will be much slower
less than 500 ms is do-able probably yeah
depends on the model still
Running on your gpu also helps a lot
 mild dirge
I don't regularly use tf, does the first layer have 16 channels and 1x1 kernel?
shrewd grove
aye
Im not really sure how it works here tbh.
does it try to "classify" 16 options for 1x1 kernels
and than takes that to the next convolution, which would do same for 2x2 kernels resulting in a smaller matrice ?
 shrewd grove
yeaaah... what should I alter to bring it down ?
mild dirge
Did you try and see what the output is after each layer
Oh, I guess the summary shows you that
I was just calculating it by hand
After the final conv/pool combo, you have 117056 "neurons"
That are then fully connected to 64 * 8 * 8 neurons
So that gives an enormous amount of parameters
And will likely also result in overfitting
Does this model not take a giant amount of time (and ram) to run btw?
shrewd grove
It does.
mild dirge
Alright, so why did you put 64 * 8 * 8 for the first dense layer?
It seems that you may think there is a special meaning to that
shrewd grove
Oh, no reason. I was fixating on 64 output chars... so I wanted to make it easier for the ascii-endoding and made the upper layer 64*8.
and than I just followed a pattern.
brisk apex
with ~5 gb of csv files, what's rough expected time to finish transformations (drop columns, cast column types, add columns, and repartition) and upload to dw while using cache on memory which result in 3 files for further analysis?
more specifically, is 10~20 mins accepted time frame?
shrewd grove
If something looks dumb it probably is, I am a newbro to machine learning.
mild dirge
shrewd grove
Oh, no reason. I was fixating on 64 output chars... so I wanted to make it easie...
So you probably want to add some more convolution/pooling layers
You could also use some other stuff, like making the stride of your convolution bigger than 1
Because the output is still very big after the feature extraction using the convolutional part of your model
And at a first glance, the choice of kernel sizes also seems a bit weird
shrewd grove
it is copied off an example.
mild dirge
There are plenty of weird examples out there 😛
shrewd grove
I was thinking of changing it, as my letters are quite big.
hence, bigger kernels would probably catch them easier.
mild dirge
I think the name for that is the "receptive field" of a convolutional layer iirc
So for the first layer your receptive field is 1 pixel, because it is a convolutional with a kernel if size 1
After that you maxpool and the image halves in both width and height
The second convolutional layer has a kernel of size (2,2) but remember that you halved the output of your previous conv with the maxpool
So the receptive field of the second layer is 4x4 pixels (in the original input image)
You can calculate the receptive field for each layer this way
Does that make sense?
shrewd grove
yes - I am looking for 2x2 patterns.
mild dirge
So if you are just trying to detect a pattern that is just 30x30 pixels, then at least try to get the final layer to be above that
shrewd grove
than 3x3 within these 2x2.
mild dirge
Not in kernel size, but receptive field
shrewd grove
my receptive field should be something like (32 * 12)x12
mild dirge
The amount of channels don't matter for receptive field
shrewd grove
384 x 12, that would be.
mild dirge
shrewd grove
my receptive field should be something like (32 * 12)x12
Also not completely sure if that math works out
shrewd grove
32 characters, each 12x12 ?
mild dirge
But it is important to keep it in mind, that it is a thing you can pay attention to
mild dirge
shrewd grove
32 characters, each 12x12 ?
The receptive field is just what area each "pixel" in the output feature map of a convolutional layer can be influenced by
mild dirge
And I'm not sure if there are many benefits for even kernel sizes, but I think uneven (1x1, 3x3, 5x5 etc.) are more common
It is also more intuitive, as each pixel is then determined by all 9 pixels in a grid around the pixel f.e.
Or 25 etc.
shrewd grove
I created a toy to experiment with, with slightly bigger letters.

so here... I effectivly want to convolute in huge chunks ?
mild dirge
You would want the receptive to be quite large yes
shrewd grove
shall I than pool by each convLayer receptive ?
shrewd grove
aye
mild dirge
Not necessarily
But for an initial model you can do that

Baeldung on Computer Science
Learn what the Calculate Receptive Field is and how to calculate it.
This is about receptive field
Maybe the images can give you a bit more intuition


 mild dirge
I don't know what the kernel sizes are, but that definitely seems more reasonable, maybe even a bit too small
But it also depends on your data, if it is really simple to classify, then the model can be smaller
shrewd grove
oh, I want something OCRy at the output - so letters.
mild dirge
All the letters?
shrewd grove
but I suppose it does not matter much.
mild dirge
Or just which letters are present?
shrewd grove
yeah, I want it to read a text from the picture.
mild dirge
You will need a bit more than a convolutional neural network then
Or at least the one you have right now
Because the one you have now will just tell you which letters are present in the image
shrewd grove
would it not care for order?
mild dirge
No
The loss you are using is also not meant for classification I think
It is used for regression
shrewd grove
it is not classification though
mild dirge
Well it's definitely not regression 😛
You are trying to classify which letters are present
mild dirge
shrewd grove
If you know the text will always be something like this, you could split the images on the spaces