#data-science-and-ml
1 messages · Page 12 of 1
 heavy crow
yeah, folding at home is legit 🙂
 misty flint
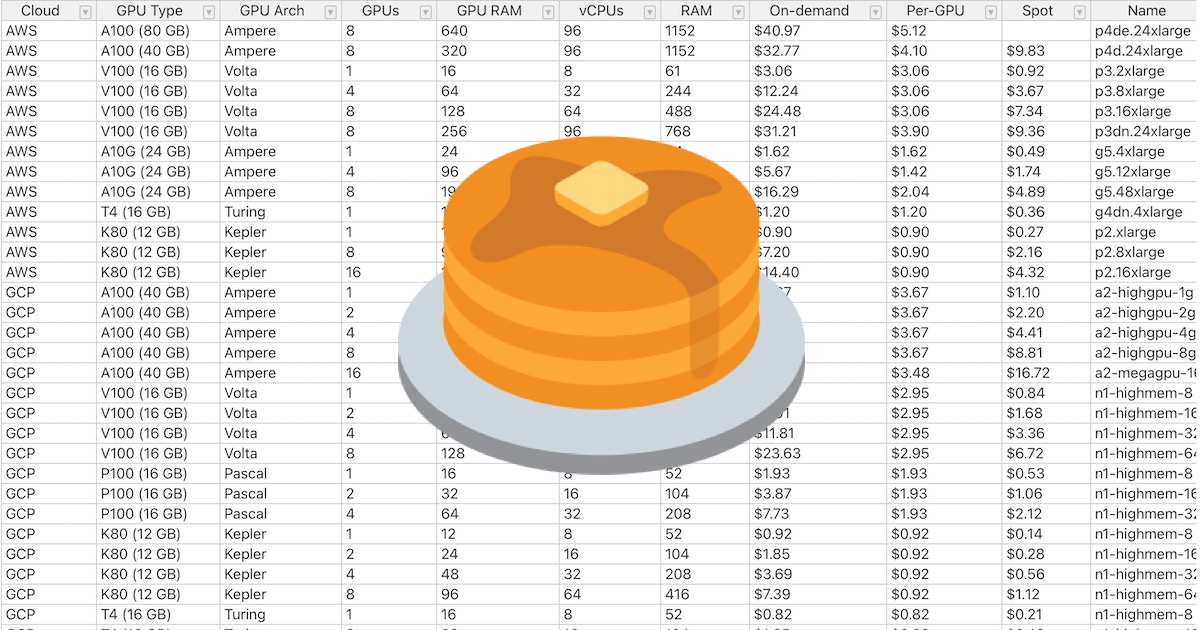
Detailed comparison table of cloud GPU providers for deep learning.
you can thank the fsdl folks
🥞
 steady basalt
I should probably learn how to utilise cloud Gpus for my own data, companies tend to want that
They get to see ur data tho right?
U send the data to them and it runs your code?
heavy crow
you get a vm that has a gpu attached
steady basalt
I thought it’s just executed in ur ide like an api, but then again I know nothing about cloud
heavy crow
so far i've only used aws gpu instances at work, works great but too expensive for a private project imo
steady basalt
I’ve used a crappy IBM one and u code within Watson I think ?
Not sure for Amazon or azure
misty flint
heavy crow
so far i've only used aws gpu instances at work, works great but too expensive f...
the fsdl folks recommend the non-big 3. much cheaper for gpu training
its the companies at the bottom of the spreadsheet
steady basalt
misty flint
the fsdl folks recommend the non-big 3. much cheaper for gpu training
do you execute code on amazons 'platform' or do you run things locally and conncet ot their gpu with an api or smtn?
misty flint
you use their service
steady basalt
with ur computers terminal?
misty flint
why dont you just try it yourself/look into it yourself. i have a note here that you dont listen to others.
steady basalt
Great thanks
im going to presume you run your own .py file on ur terminal thats running on their env
 eager wedge
I have a variable and I am trying to do data augmentation. It has a shape of (2, 128, 128, 128, 4), but when I call the variable inside a for loop, it has a shape of (128, 128, 128, 4). Why is this happening?
heavy crow
misty flint
the fsdl folks recommend the non-big 3. much cheaper for gpu training
where do you see that? if i sort by gpu price, either on-demand of spot i get jarvis labs as the cheapest option
misty flint
heavy crow
where do you see that? if i sort by gpu price, either on-demand of spot i get ja...

realize this heuristic #data-science-and-ml message
heavy crow
thanks, thats amazing!
misty flint
heavy crow
thanks, thats amazing!
no probs. thank the FSDL folks. they have some great info about ML in production stuff 🥞
 cyan sierra
https://scikit-learn.org/stable/modules/learning_curve.html#learning-curve
Hello 👋🏻 I don't understand training and validation scores. I know that if our estimator is a Linear Regression, then the default scoring is R2. However, how is the scoring done for train and test sets? For e.g., are those sets divided into subtrain and subtest sets just for the sake of scoring? 🙏🏻
scikit-learn
Every estimator has its advantages and drawbacks. Its generalization error can be decomposed in terms of bias, variance and noise. The bias of an estimator is its average error for different traini...
heavy crow
 steady basalt
cyan sierra
https://scikit-learn.org/stable/modules/learning_curve.html#learning-curve
Hello...
steady basalt
cyan sierra
https://scikit-learn.org/stable/modules/learning_curve.html#learning-curve
Hello...
for validation the scores based on multiple subsets of training data
misty flint
heavy crow
per gpu but you need to factor in training time is what theyre saying
heavy crow
yup, makes sense
cyan sierra
steady basalt
for validation the scores based on multiple subsets of training data
But then shouldn't there be only one score? Why is it called train and validation score?
steady basalt
cyan sierra
But then shouldn't there be only one score? Why is it called train and validatio...
are u talking about in neural network?
the data is split for example 90:10
 shell crest
cyan sierra
https://scikit-learn.org/stable/modules/learning_curve.html#learning-curve
Hello...
shell crest
cyan sierra
https://scikit-learn.org/stable/modules/learning_curve.html#learning-curve
Hello...
Direct answer to your question is yes?
steady basalt
test is test, no sub tests
validation is from train yes when ur cros svalidating most of the time
shell crest
misty flint
realize this heuristic https://discord.com/channels/267624335836053506/366673247...
Doesn't any heuristic need to basically predict training effort?
shell crest
steady basalt
test is test, no sub tests
This is right, did a reread
cyan sierra
steady basalt
validation is from train yes when ur cros svalidating most of the time
Thank you but how is the scoring done actually? I don't understand.
steady basalt
did u read an article on CV?
imaging taking the data and splitting it up and on a minroity of the data scoring how well model does
training data, that is
for you, i think
shell crest
cyan sierra
Thank you but how is the scoring done actually? I don't understand.
Scoring can be done with any scoring metric, which is in the previous section
https://scikit-learn.org/stable/modules/model_evaluation.html
scikit-learn
There are 3 different APIs for evaluating the quality of a model’s predictions: Estimator score method: Estimators have a score method providing a default evaluation criterion for the problem they ...
steady basalt
then take another random sample of equal size and do the same on that
k times
for k results
cyan sierra
So when I'm cross validation, I'm obtaining a score for each cv. Why are there two scores (train and test) obtained from learning curves? Sorry I'm new
 shell crest
cyan sierra
So when I'm cross validation, I'm obtaining a score for each cv. Why are there t...
shell crest
cyan sierra
So when I'm cross validation, I'm obtaining a score for each cv. Why are there t...
Because the train set is (supposed to be) disjoint from the test set
The test set is not seen during the training process - it's to simulate actually applying the model to the future
cyan sierra
Thanks
steady basalt
cyan sierra
Thanks
happy learning!
does anyone have a data science forucused server?
 dusty valve
it's either overfitting on data, or not enough fitting on the data
 shell crest
? 100% acc on test sets is no mere coincidence
steady basalt
 worn stratus
https://discord.gg/artificial-intelligence
worn stratus
https://discord.gg/artificial-intelligence
thanks!
 drifting snow
you'd like to insert data in another table, is that it?
 mild dirge
 mint palm
what should be batchsize for 100K examples??
mint palm
what should be batchsize for 100K examples??
It shouldn't just be based on your total amount of samples
mint palm
leaving efficiency
mild dirge

Cross Validated
When training a neural network, what difference does it make to set:
batch size to $a$ and number of iterations to $b$
vs. batch size to $c$ and number of iterations to $d$
where $ ab = cd $?
To...
mint palm
👍
mild dirge
It's probably also good to consider your hardware
if they are big images, and you don't have much memory, then maybe you can only load a few at a time
 little dagger
I've been trying to understand the maths behind backprogations for the past 3 hours and is giving me the biggest headache
mild dirge
I guess it might just be a hyper-parameter to fine tune
little dagger
any resources for me to use to make it easier
 mossy dragon
drifting snow
you'd like to insert data in another table, is that it?
mossy dragon
drifting snow
you'd like to insert data in another table, is that it?
ye, i figuredout the issue
both datasets have to be in the same location
mint palm
why did my multiclass model gave better accuracy with binary cross entropy, lol
drifting snow
mossy dragon
ye, i figuredout the issue
Good, congratulations man
 magic dune
!paste
 arctic wedgeBOT
Pasting large amounts of code
If your code is too long to fit in a codeblock in Discord, you can paste your code here:
https://paste.pythondiscord.com/
After pasting your code, save it by clicking the floppy disk icon in the top right, or by typing ctrl + S. After doing that, the URL should change. Copy the URL and post it here so others can see it.
magic dune
def main(X, epoch, learning_rate, activation_functions):
    y_hat_array = []
    table = np.empty((len(X), 3))
    output = {}
    weights0 = np.random.random()
    weights1 = np.random.random()
    weights2 = np.random.random()
    print(weights1, weights2)
    for i in range(epoch):
        for j, point in enumerate(X):
            z = weights0 + (point[0] * weights1) + (point[1] * weights2)
            if activation_functions == "step":
                if z >= 0.5:
                    y_hat = 1
                else:
                    y_hat = 0
                diriv_of_E = (y[j]-y_hat)
                print("Dirv",diriv_of_E, (y_hat - z))
            elif activation_functions == "sign":
                if z >= 0:
                    y_hat = 1
                else:
                    y_hat = -1
                diriv_of_E = (y[j]*y_hat)
                print("Dirv",diriv_of_E)
            elif activation_functions == "sigmoid":
                pass
            table[j] = [point[0], point[1], y_hat]
            weights1 = weights1 + (learning_rate * diriv_of_E)
            weights2 = weights2 + (learning_rate * diriv_of_E)
            weights0 = weights0 + (learning_rate * diriv_of_E)
            y_hat_array.append(y_hat)
        output[i] = table

    return output, y_hat_array
Can someone help me with the activation functions for a simple perceptron?
 honest plover
There are many questions and answer methods available. BIRT and GPT are popular. But those are text based. What are available method or model for voiced based questions and answers system? How person name filter and use it for conversation?
 lapis sequoia
honest plover
There are many questions and answer methods available. BIRT and GPT are popular....
lapis sequoia
honest plover
There are many questions and answer methods available. BIRT and GPT are popular....
Might want to check one of those cloud services for that
honest plover
Ok is there any Ai methods to do this or any available model for that?
 tacit basin
They probably convert voice to text, process text via BERT or similar and convert back to voice
misty flint
today i saw something i dont think i can unsee
and thats using python within powerbi
 strong sedge
for column in raw_df.columns:
    if column != 'SalePrice':
        if raw_df[column].dtype != 'O':
            temp_median = train_df[column].median()
            raw_df[column].fillna(temp_median, inplace=True)
        else:
            temp_mode = train_df[column].mode()
            raw_df[column].fillna(temp_mode, inplace=True)
am I dumb or python is broken
the expected output should be that na of all columns should be filled with mean or mode, but this code has no effect on raw_df
 short heart
In pandas I need to pick date index from 1 column and get a mean of values with [date index-3:date index+3] from other df, is there any way to do it correctly and easy
 young granite
short heart
In pandas I need to pick date index from 1 column and get a mean of values with ...
young granite
short heart
In pandas I need to pick date index from 1 column and get a mean of values with ...
so both df share same indexA?
short heart
young granite
so both df share same indexA?
yea
well, one df has time indexes like 0,1,0,0,0,1,2,2,3,4,4,5
and the other i want to get my data from has 0,1,2,3,4,5,6,7,8 and so on
young granite
can u post em here?
so df1 got index from [0:100] and df2 got em from [0:200]?
if they would share same index u could just filter index and then build the mean
otherwise u need to search in the df
u could merge/concat/append the dfs depending on ur needs also
 serene scaffold
young granite
u could merge/concat/append the dfs depending on ur needs also
serene scaffold
young granite
u could merge/concat/append the dfs depending on ur needs also
Append is getting deprecated

 worthy hollow
worthy hollow
worthy hollow
i try to pass those horizontal degrees value (the one very below) to the vertical dataframe "Degrees" part
but when i try to, i get this error :
```py
ValueError Traceback (most recent call last)
~\AppData\Local\Temp/ipykernel_2176/1498611773.py in <module>
1 Selected_Date = "31/10/2008"
2
----> 3 nat['Degrees'] = helio[helio.Date == Selected_Date]
4 nat
c:\Users\PEGON\AppData\Local\Programs\Python\Python39\lib\site-packages\pandas\core\frame.py in setitem(self, key, value)
3600 self._setitem_array(key, value)
3601 elif isinstance(value, DataFrame):
-> 3602 self._set_item_frame_value(key, value)
3603 elif (
3604 is_list_like(value)
c:\Users\PEGON\AppData\Local\Programs\Python\Python39\lib\site-packages\pandas\core\frame.py in _set_item_frame_value(self, key, value)
3727 len_cols = 1 if is_scalar(cols) else len(cols)
3728 if len_cols != len(value.columns):
-> 3729 raise ValueError("Columns must be same length as key")
3730
3731 # align right-hand-side columns if self.columns
ValueError: Columns must be same length as key
anyone know how can I bypass it
 wooden sail
you can make a full column of nans first and then assign values in the correct indices
worthy hollow
wooden sail
you can make a full column of nans first and then assign values in the correct i...
this columns "Degrees" is full of nan

and its where we want to assign the values in the correct indices (Earth, Mer, Ven, etc...)
wooden sail
mhm, so you want to give a date to each of these?
worthy hollow
no, the right degrees

we have a given date "31/10/2008"
i want it to convert all those horizontal degrees into the vertical "Degrees" column
wooden sail
aha. well, you know which planets you're using
worthy hollow
expected result
 wooden sail
you have to further index the result of helio[date ...]
maybe something like [:-2]
since you already know you don't need the last 2
worthy hollow
wooden sail
maybe something like [:-2]
how could i code that i see ur point but idk how to write it up
and u are right as we know we dont use the last 2
and the planet order is the same as the dataframe were we get those values
Selected_Date = "31/10/2008"

nat["Degrees"] = helio[:-2][helio.Date == Selected_Date]
nat
error it gives:
C:\Users\PEGON\AppData\Local\Temp/ipykernel_2176/1087780515.py:3: UserWarning:

Boolean Series key will be reindexed to match DataFrame index.

---------------------------------------------------------------------------
ValueError                                Traceback (most recent call last)
~\AppData\Local\Temp/ipykernel_2176/1087780515.py in <module>
      1 Selected_Date = "31/10/2008"
      2
----> 3 nat["Degrees"] = helio[:-2][helio.Date == Selected_Date]
      4 nat

c:\Users\PEGON\AppData\Local\Programs\Python\Python39\lib\site-packages\pandas\core\frame.py in __setitem__(self, key, value)
   3600             self._setitem_array(key, value)
   3601         elif isinstance(value, DataFrame):
-> 3602             self._set_item_frame_value(key, value)
   3603         elif (
   3604             is_list_like(value)

c:\Users\PEGON\AppData\Local\Programs\Python\Python39\lib\site-packages\pandas\core\frame.py in _set_item_frame_value(self, key, value)
   3727             len_cols = 1 if is_scalar(cols) else len(cols)
   3728             if len_cols != len(value.columns):
-> 3729                 raise ValueError("Columns must be same length as key")
   3730
   3731             # align right-hand-side columns if self.columns

ValueError: Columns must be same length as key
In [8]: x = pd.DataFrame({'beep': [1,2,3,4,5], 'boop':[6,7,8,9,0]})

In [9]: x['beep']
Out[9]:
0    1
1    2
2    3
3    4
4    5
Name: beep, dtype: int64

In [10]: x['beep'][:-2]
Out[10]:
0    1
1    2
2    3
Name: beep, dtype: int64
looks good to me, since helios[key] returns a series
wooden sail
yes, and the problem is that helio has too many elements in helio[key]
worthy hollow
helio is where i get the degrees values (the horizontal one) and nat is where i want to put those value in vertical manner
wooden sail
so you throw away the ones you dont need
worthy hollow
aight wait
wooden sail
which means what i shared does what you want
 worthy hollow
worthy hollow
worthy hollow
check what happen with [:-2] it doesnt show any data
wooden sail
what exactly does result have in it before the [:-2]? what shape and type is it
this would be a lot easier if you shared a minimum example of the data that i could play with
worthy hollow
ok lemme show u with small df and input/output
INPUT
!e ```py
import pandas as pd
df1 = pd.DataFrame({ "Date": ['31/10/2008', '03/01/2009', "13/03/2013"],
"Earth": ["218.27", "38.27", "11.15"],
"Mer": ["203,12", "155.91", "310.55"],
"Ven": ["339.11", "310.28", "5.11"]
})
print(df1)
@worthy hollow :white_check_mark: Your 3.11 eval job has completed with return code 0.
001 |          Date   Earth     Mer     Ven
002 | 0  31/10/2008  218.27  203,12  339.11
003 | 1  03/01/2009   38.27  155.91  310.28
004 | 2  13/03/2013   11.15  310.55    5.11
OUTPUT
!e ```py
import pandas as pd
Selected_Date = "31/10/2008"
output = pd.DataFrame({ "Planets": ['Earth', 'Mer', 'Ven'],
"Degrees": ['38.27', '115.91', '310.28']})
print(output)```
arctic wedgeBOT
@worthy hollow :white_check_mark: Your 3.11 eval job has completed with return code 0.
001 |   Planets Degrees
002 | 0   Earth   38.27
003 | 1     Mer  115.91
004 | 2     Ven  310.28
aha, it returns the planets and degrees
worthy hollow
wooden sail
what exactly does result have in it before the [:-2]? what shape and type is it
yess
associated degrees to associated planet
wooden sail
then that's why [:-2] didn't work. can it be taken for granted that the planets are in the same order in both data frames?
wooden sail
then you could do helio[datestuff]['Degrees'][:-2], though there is probably a more pandas-native notation for this
serene scaffold
couldn't you do helio.loc[datestuff, 'Degrees'].iloc[:-1]?
worthy hollow
wait look im sorry its my fault
wooden sail
that's the one, yeah
worthy hollow

we have 2 dataframe for the matter
helio is pretty much our big data one where there is degrees values for each days from 1930 to 2030
and "NAT" is the dataframe where there is the "DEGREES" column
wooden sail
that's fine
just do what stelercus said, which is the pandas flavor of the same thing i said
i think it should be iloc[:-2] though
worthy hollow
serene scaffold
couldn't you do `helio.loc[datestuff, 'Degrees'].iloc[:-1]`?
this code brings this error: ```py
KeyError Traceback (most recent call last)
~\AppData\Local\Temp/ipykernel_2176/1725481475.py in <module>
2
3 s_d = "31/10/2008"
----> 4 helio.loc[s_d, 'Degrees'].iloc[:-2]
KeyError: '31/10/2008'```
bcuz
the helio table doesnt have any column named "Degrees" columns
the "Degrees" column is named in the "NAT" dataframe which is this one:

 wooden sail
worthy hollow
!e ```py
import pandas as pd
Selected_Date = "31/10/2008"
output = pd.DataFram...
wooden sail
worthy hollow
!e ```py
import pandas as pd
Selected_Date = "31/10/2008"
output = pd.DataFram...
what's this then? which DF was this supposed to emulate
worthy hollow
we need to emulate in "NAT" dataframe based of helio degrees values at a given date (s_d = "31/10/2008")
wooden sail
cuz then the code should already work with just helio.loc[datestuff].iloc[:-2]
worthy hollow
wooden sail
cuz then the code should already work with just helio.loc[datestuff].iloc[:-2]
here's the error it gives
---------------------------------------------------------------------------
KeyError                                  Traceback (most recent call last)
~\AppData\Local\Temp/ipykernel_2176/1177674677.py in <module>
      2
      3 s_d = "31/10/2008"
----> 4 nat['Degrees'] = helio.loc[s_d, 'Degrees'].iloc[:-2]
      5 nat

c:\Users\PEGON\AppData\Local\Programs\Python\Python39\lib\site-packages\pandas\core\indexing.py in __getitem__(self, key)
    923                 with suppress(KeyError, IndexError):
    924                     return self.obj._get_value(*key, takeable=self._takeable)
--> 925             return self._getitem_tuple(key)
    926         else:
    927             # we by definition only have the 0th axis

c:\Users\PEGON\AppData\Local\Programs\Python\Python39\lib\site-packages\pandas\core\indexing.py in _getitem_tuple(self, tup)
   1098     def _getitem_tuple(self, tup: tuple):
   1099         with suppress(IndexingError):
-> 1100             return self._getitem_lowerdim(tup)
   1101
   1102         # no multi-index, so validate all of the indexers

c:\Users\PEGON\AppData\Local\Programs\Python\Python39\lib\site-packages\pandas\core\indexing.py in _getitem_lowerdim(self, tup)
    836                 # We don't need to check for tuples here because those are
    837                 #  caught by the _is_nested_tuple_indexer check above.
--> 838                 section = self._getitem_axis(key, axis=i)
    839
    840                 # We should never have a scalar section here, because

c:\Users\PEGON\AppData\Local\Programs\Python\Python39\lib\site-packages\pandas\core\indexing.py in _getitem_axis(self, key, axis)
   1162         # fall thru to straight lookup
   1163         self._validate_key(key, axis)
-> 1164         return self._get_label(key, axis=axis)
   1165
   1166     def _get_slice_axis(self, slice_obj: slice, axis: int):

c:\Users\PEGON\AppData\Local\Programs\Python\Python39\lib\site-packages\pandas\core\indexing.py in _get_label(self, label, axis)
   1111     def _get_label(self, label, axis: int):
   1112         # GH#5667 this will fail if the label is not present in the axis.
-> 1113         return self.obj.xs(label, axis=axis)
   1114
   1115     def _handle_lowerdim_multi_index_axis0(self, tup: tuple):

c:\Users\PEGON\AppData\Local\Programs\Python\Python39\lib\site-packages\pandas\core\generic.py in xs(self, key, axis, level, drop_level)
   3774                 raise TypeError(f"Expected label or tuple of labels, got {key}") from e
...
--> 388             raise KeyError(key)
    389         return super().get_loc(key, method=method, tolerance=tolerance)
    390

KeyError: '31/10/2008'
i use this code: ```py
nat = natal.copy()
s_d = "31/10/2008"
nat['Degrees'] = helio.loc[s_d, 'Degrees'].iloc[:-2]
nat
without the degrees key in helio
worthy hollow
wooden sail
without the degrees key in helio
same error: ```py
KeyError Traceback (most recent call last)
~\AppData\Local\Temp/ipykernel_2176/1803452427.py in <module>
1 nat = natal.copy()
2 s_d = "31/10/2008"
----> 3 nat['Degrees'] = helio.loc[s_d].iloc[:-2]
4 nat
c:\Users\PEGON\AppData\Local\Programs\Python\Python39\lib\site-packages\pandas\core\indexing.py in getitem(self, key)
929
930 maybe_callable = com.apply_if_callable(key, self.obj)
--> 931 return self._getitem_axis(maybe_callable, axis=axis)
932
933 def _is_scalar_access(self, key: tuple):
c:\Users\PEGON\AppData\Local\Programs\Python\Python39\lib\site-packages\pandas\core\indexing.py in _getitem_axis(self, key, axis)
1162 # fall thru to straight lookup
1163 self._validate_key(key, axis)
-> 1164 return self._get_label(key, axis=axis)
1165
1166 def _get_slice_axis(self, slice_obj: slice, axis: int):
c:\Users\PEGON\AppData\Local\Programs\Python\Python39\lib\site-packages\pandas\core\indexing.py in _get_label(self, label, axis)
1111 def _get_label(self, label, axis: int):
1112 # GH#5667 this will fail if the label is not present in the axis.
-> 1113 return self.obj.xs(label, axis=axis)
1114
1115 def _handle_lowerdim_multi_index_axis0(self, tup: tuple):
c:\Users\PEGON\AppData\Local\Programs\Python\Python39\lib\site-packages\pandas\core\generic.py in xs(self, key, axis, level, drop_level)
3774 raise TypeError(f"Expected label or tuple of labels, got {key}") from e
3775 else:
-> 3776 loc = index.get_loc(key)
3777
3778 if isinstance(loc, np.ndarray):
c:\Users\PEGON\AppData\Local\Programs\Python\Python39\lib\site-packages\pandas\core\indexes\range.py in get_loc(self, key, method, tolerance)
386 except ValueError as err:
387 raise KeyError(key) from err
--> 388 raise KeyError(key)
389 return super().get_loc(key, method=method, tolerance=tolerance)
390
KeyError: '31/10/2008'```
wooden sail
used a wrong key?
worthy hollow
wooden sail
used a wrong key?
idk honestly i think so if it saying KeyError
wooden sail
earlier you were doing date == s_d instead
worthy hollow
wooden sail
earlier you were doing date == s_d instead
nat = natal.copy()
s_d = "31/10/2008"
nat['Degrees'] = helio.loc[helio.Date == s_d].iloc[:-2]
nat
---------------------------------------------------------------------------
ValueError                                Traceback (most recent call last)
~\AppData\Local\Temp/ipykernel_2176/3706519061.py in <module>
      1 nat = natal.copy()
      2 s_d = "31/10/2008"
----> 3 nat['Degrees'] = helio.loc[helio.Date == s_d].iloc[:-2]
      4 nat

c:\Users\PEGON\AppData\Local\Programs\Python\Python39\lib\site-packages\pandas\core\frame.py in __setitem__(self, key, value)
   3600             self._setitem_array(key, value)
   3601         elif isinstance(value, DataFrame):
-> 3602             self._set_item_frame_value(key, value)
   3603         elif (
   3604             is_list_like(value)

c:\Users\PEGON\AppData\Local\Programs\Python\Python39\lib\site-packages\pandas\core\frame.py in _set_item_frame_value(self, key, value)
   3727             len_cols = 1 if is_scalar(cols) else len(cols)
   3728             if len_cols != len(value.columns):
-> 3729                 raise ValueError("Columns must be same length as key")
   3730
   3731             # align right-hand-side columns if self.columns

ValueError: Columns must be same length as key
 untold bloom
nat.Degrees = nat.Planets.map(helio.set_index("Date").loc["31/10/2008"])
this maps the Planets in nat via the values in helio except Date is set index and then queried
Date might better be index permanently...
worthy hollow
untold bloom
`nat.Degrees = nat.Planets.map(helio.set_index("Date").loc["31/10/2008"])`
work out just fine!!!!
 wooden sail
worthy hollow
```py
nat = natal.copy()
s_d = "31/10/2008"
nat['Degrees'] = helio.loc[helio.Da...
wooden sail
worthy hollow
```py
nat = natal.copy()
s_d = "31/10/2008"
nat['Degrees'] = helio.loc[helio.Da...
can you print again what helio.loc[helio.Date == s_d].iloc[:-2] returns? this is super difficult to walk you through lol
worthy hollow
thanks a lot @untold bloom, and also @wooden sail @serene scaffold -- i know it's hard to walk me through this ahah
worthy hollow
untold bloom
Date might better be index permanently...
i thought so too when i first started coding the project
i think i'll implement it to index for every other dfs
i use, thx guys
worthy hollow
untold bloom
`nat.Degrees = nat.Planets.map(helio.set_index("Date").loc["31/10/2008"])`
very neat way to implement 🙂 thx again
 untold bloom
np
 tacit horizon
i am new to ml, my boss asked me to train a model to detected sensor abnormal data, i would like to know am i need NNs?
worthy hollow
small shape problem i'm struggling to fix:```py
nat['0'] = (nat.Cycles + np.arange(1, 22).reshape(1, -1)) * (nat.Degrees + nat.Start_Date)
give this error:
---------------------------------------------------------------------------
ValueError                                Traceback (most recent call last)
~\AppData\Local\Temp/ipykernel_2176/3475403143.py in <module>
      7 nat.Cycles = (nat.Now - nat.Start_Date) / nat.Degrees
      8
----> 9 nat['0'] = (nat.Cycles + (np.arange(1, 10))) * (nat.Degrees + nat.Start_Date)
     10
     11 nat = nat.round()

ValueError: operands could not be broadcast together with shapes (7,) (9,)```nat.cycles is probably length 7?
going by what you did earlier
you can't add a length 9 array with a length 7 one
worthy hollow
wooden sail
you can't add a length 9 array with a length 7 one
yea im dumb i fixed it i forgot we use only 7

thx!!
wooden sail
coo
serene scaffold
wooden sail
coo
das coo
worthy hollow
worthy hollow
small shape problem i'm struggling to fix:```py
nat['0'] = (nat.Cycles + np.aran...
how can i apply it to the whole numbered columns?

like we did last time here with u guys
wooden sail
this is looking increasingly like something that would've been easier and more succinct in numpy instead of pandas
idk if there's a way to index columns by number here, maybe the others know a good way that doesn't require you writing out the names
 warm tree
Random NLP question - has anyone tried replacing Natural language with Python code? E.g. instead of training a model with text teach it to write/automate Python code?
Ah, found 'DeepCoder' so I guess the answer is yes
I've also just found out that's what CoPilot is as well, damn
worthy hollow
worthy hollow
how can i apply it to the whole numbered columns?
ok nvm i found the answer
ok so now my code is
nat = natal.copy()
s_d = "31/10/2008"

nat_h = nat.copy()

nat_h.Degrees = nat_h.Planets.map(helio.set_index("Date").loc[s_d])
nat_h.Start_Date = nat_h.Planets.map(helio_cum.set_index("Date").loc[s_d])
nat_h.Now = nat_h.Planets.map(helio_cum.set_index("Date").loc[today])
nat_h.Cycles = (nat_h.Now - nat_h.Start_Date) / nat_h.Degrees

nat_h['0'] = ((nat_h.Cycles + 0) * (nat_h.Degrees)) + nat_h.Start_Date
nat_h['1'] = ((nat_h.Cycles + 1) * (nat_h.Degrees)) + nat_h.Start_Date
nat_h['2'] = ((nat_h.Cycles + 2) * (nat_h.Degrees)) + nat_h.Start_Date
nat_h['3'] = ((nat_h.Cycles + 3) * (nat_h.Degrees)) + nat_h.Start_Date
nat_h['4'] = ((nat_h.Cycles + 4) * (nat_h.Degrees)) + nat_h.Start_Date
nat_h['5'] = ((nat_h.Cycles + 5) * (nat_h.Degrees)) + nat_h.Start_Date
nat_h['6'] = ((nat_h.Cycles + 6) * (nat_h.Degrees)) + nat_h.Start_Date
nat_h['7'] = ((nat_h.Cycles + 7) * (nat_h.Degrees)) + nat_h.Start_Date
nat_h['8'] = ((nat_h.Cycles + 8) * (nat_h.Degrees)) + nat_h.Start_Date
nat_h['9'] = ((nat_h.Cycles + 9) * (nat_h.Degrees)) + nat_h.Start_Date

nat_h = nat_h.round()
nat_h```which display:

I have already a for loop code to catch every degrees in the numbered columns (0, 1, 2, ....) and FIND the DATE based off each degrees
here's the for loop code
for planets in nat_h.columns[5:]:
    for num, i in enumerate(nat_h[planets]):
        df_copy = helio_cum.copy()
        target = df_copy[df_copy[planets] == float(i)]

        Date = []

        for date in target['Date']:
            Date.append(date)

        if len(Date) > 0:
            Date_ok = Date[-1]
            nat_h[planets].iloc[num] = Date_ok
        else:
            nat_h[planets].iloc[num] = " "
i tried to adjust it to my case but sadly it gives me this error:
---------------------------------------------------------------------------
KeyError                                  Traceback (most recent call last)
c:\Users\PEGON\AppData\Local\Programs\Python\Python39\lib\site-packages\pandas\core\indexes\base.py in get_loc(self, key, method, tolerance)
   3360             try:
-> 3361                 return self._engine.get_loc(casted_key)
   3362             except KeyError as err:

c:\Users\PEGON\AppData\Local\Programs\Python\Python39\lib\site-packages\pandas\_libs\index.pyx in pandas._libs.index.IndexEngine.get_loc()

KeyError: '0'
anyone know how can i fix this?
 limpid rain
ok
 earnest widget
Has anyone encountered an error like this during model training?
0 derived errors ignored. [Op:__inference_train_function_2136]

Function call stack:
train_function -> train_function
I checked online regarding it, seems like some memory issue but not in my case. This is my model config: https://hastebin.com/ijemanutub.py
 nimble sedge
damn thats cool
dusty valve
why can't i import keras.preprocessing.sequence.pad_sequences ?
i need the pad_sequences function
 agile cobalt
it seems to be under utils?
https://www.tensorflow.org/api_docs/python/tf/keras/utils/pad_sequences
the examples might be outdated
edit; nvm it's under two different things?.... idk
heavy crow
nimble sedge
damn thats cool
Thanks!
dusty valve
agile cobalt
it seems to be under utils?
https://www.tensorflow.org/api_docs/python/tf/keras...
Oh okay

 steady basalt
python things
 quaint loom
What does A stander for within round function? EX print('Area A = ',round(A,1),'in km^2')
 loud apex
hello
the following code outputs error:
import pandas as pd
url = 'https://en.wikipedia.org/wiki/World_population'
tables = pd.read_html(url)
ImportError: lxml not found, please install it
i use vscode as my code editor. i only face an error when it is in vscode. but when i run it in jupyter notebook it doesnt seem to have any problem
i also tried pip install lxml. it says requirement already satesfied
im guessing i use python installed by my machine instead of python installed by anaconda.
any solution?
 hoary current
loud apex
hello
the following code outputs error:
import pandas as pd
url = 'https://en.w...
hoary current
loud apex
hello
the following code outputs error:
import pandas as pd
url = 'https://en.w...
try pip3 install lxml
loud apex
hoary current
try pip3 install lxml
i got the same message
Requirement already satisfied: lxml in c:\users\anaconda3\lib\site-packages (4.8.0)
hoary current
loud apex
i got the same message
Requirement already satisfied: lxml in c:\users\anaconda3...
oh
mhm
lapis sequoia
I'm looking at the titanic solutions from kaggle and why is the std value taken from the test data while getting the mean value from the train data? Doesn't it work if they are both mean or std?
 mild dirge
they probably meant dataset for both
 fiery dust
 fair moss
Hello guy
 timid anchor
Hello guys,
How to create and prepare data for tensorflow? And how to know if the data is ready to be involved in the neural network?
Thanks in advance
serene scaffold
timid anchor
Hello guys,
How to create and prepare data for tensorflow? And how to know if t...
neural networks work in terms of arrays (called tensors in tensorflow), so each data point needs to be encoded as a sequence of numbers, basically.
 serene stump
RuntimeError: PytorchStreamReader failed reading zip archive: failed finding central directory
What to do to amend this?
 drowsy sage
Can anybody suggest me some module to convert pdf into excel
 tired igloo
Hey guys looking for someone to answer my questions about data science and technology. This is not about technical data science and ai but rather a general tech question which most likely a data scientist can answer. Would appreciate if anyone could pop up in my DMs so i could ask. Thanks
serene scaffold
tired igloo
Hey guys looking for someone to answer my questions about data science and techn...
please post the question in #data-science-and-ml. people won't want to DM you to figure out what the question is.
oh, that's where we are.
well, just ask the question.
 pulsar hull
Finally got my GAN to work, only took like a month, faces are a little creepy though

still have to fix checkerboarding
 dull elbow
Im pretty new to tensorflow so excuse the stupidity. I'm trying to train an ai model with a data set that has both strings, floats, and integers. I constantly get type errors if i try to run my code with this dataset as input, after doing some research i've found that i have to convert the strings and integers into floats in my numpy array for this to work. How do i go about doing this?
ValueError: Failed to convert a NumPy array to a Tensor (Unsupported object type float).
data set:
heavy crow
@spare briarhey, if you dont mind me asking do you have any other info on your projection head? did you finetune the backbone as well?
 drowsy timber
hey guys. I'm in desperate need of help for my assignment. I've got most of the code down and now I'm just troubleshooting. It's about a basic stochastic gradient descent. Somehow when I do the batch sampling, the algorithm trips up but when I do run the whole data set it outputs it right
quaint loom
Does this mean that the variable I want to plot is empty or have I dont something wrong? https://gyazo.com/aa9e9827abf97e0822e6bd2f13d5349e I am sure the variable should have some values
 steady basalt
drowsy timber
hey guys. I'm in desperate need of help for my assignment. I've got most of the ...
steady basalt
drowsy timber
hey guys. I'm in desperate need of help for my assignment. I've got most of the ...
Ur assignment is to SGD from scratch?
drowsy timber
steady basalt
Ur assignment is to SGD from scratch?
Kinda. We're using the diabetes dataset from scikit scipy learn
steady basalt
prima indian?
drowsy timber
steady basalt
prima indian?
I'm sorry, I'm not familiar with that. We're using python. It's just an exercise with how to do it
drowsy timber
steady basalt
prima indian?
np.random.seed(1)
m = 400
tau = 4000
lr_0 = 0.5
lr_tau = 0.01
alpha = 0.8
theta_k = np.array([1, 1])

def J(theta, x, y):
    return np.mean((y - (theta[0] + theta[1]*x))**2)

print('alpha = %.4f'%alpha)
for k in range(0,5001):

    bx = np.random.choice(x[0:441], m+1)
    by = np.random.choice(y[0:441], m+1)
    a = k/tau

    if k < 6:
        ek = ((1-a)*lr_0)+(a * lr_tau)
        print(f"k= {k} --ek= {ek:.4f} --theta[0]= {theta_k[0]:.4f} --theta[1]= {theta_k[1]:.4f} --J(theta)= {J(theta_k,bx,by):.4f}")
    theta_k = theta_k - ek*np.array([np.mean(2*((theta_k[0]+theta_k[1]*bx)-by)), np.mean(2*bx*((theta_k[0]+(theta_k[1]*bx))-by))])

    if k > 6 and k < tau and k % 100 == 0:
        ek = ((1-a)*lr_0)+(a * lr_tau)
        print(f"k= {k} --ek= {ek:.4f} --theta[0]= {theta_k[0]:.4f} --theta[1]= {theta_k[1]:.4f} --J(theta)= {J(theta_k,bx,by):.4f}")
    theta_k = theta_k - ek*np.array([np.mean(2*((theta_k[0]+theta_k[1]*bx)-by)), np.mean(2*bx*((theta_k[0]+(theta_k[1]*bx))-by))])

    if k >= tau and k % 100 == 0:
        ek = ek
        print(f"k= {k} --ek= {ek:.4f} --theta[0]= {theta_k[0]:.4f} --theta[1]= {theta_k[1]:.4f} --J(theta)= {J(theta_k,bx,by):.4f}")
    theta_k = theta_k - ek*np.array([np.mean(2*((theta_k[0]+theta_k[1]*bx)-by)), np.mean(2*bx*((theta_k[0]+(theta_k[1]*bx))-by))])
Code looks like this
 sharp frigate
Pandas question from a total noob: I have an excel file that I import into a dataframe. This excel file has a date column and a hour column. I want to write the dataframe (after conversion) to multiple files whose path will depend on the date and hour.
so if my first line has a date which is 13/01/2022 and an hour 01:00:00, I want to write the line to the path year=2022/month=01/day=13/hour=01/myfile.parquet
 spare briar
heavy crow
<@336524160509411328>hey, if you dont mind me asking do you have any other info ...
spare briar
heavy crow
<@336524160509411328>hey, if you dont mind me asking do you have any other info ...
should probably finetune the backbone with smaller models but the amazing thing about the jeba models is that when scaled they can few shot new data with a tiny number of examples (eg 95% of imagenet performance using 1% imagenet data), finetuning only a linear layer on frozen embeddings
heavy crow
jeba models?
spare briar
joint embedding architectures
heavy crow
i've tried training with and without finetuning the backbone and after 1.7million images the loss is almost the same (negligible)
spare briar
like vicreg, simclr, byol, etc
spare briar
yeah if you dont care about compute then finetune the whole backbone
the idea of linear layer is you can train one gigantic model one time
and train only the linear layer to get new classifiers
which is super general and compute efficient
heavy crow
after the second epoch the network with a frozen backbone actually performs slightly better. (15%, overfitting?)
spare briar
yeah thats an artifact of small back bone size though
heavy crow
im using 512-512-64 as the projector
with batch normalization and ReLU. can't go much bigger because of memory limitations. already had to go to float16 and a small batch size :/
heavy crow
ah
i feel like a 15% increase is an acceptable ammount of overfitting, especially because of the large dataset im not to worried about overfitting for now
spare briar
idk what acceptable overfitting means, it performs worse and generalizes worse
heavy crow
well im not sure if it is overfitting or just better
spare briar
try training longer
heavy crow
the large dataset would lead me to belive that such a small network can't easily overfit
spare briar
let it sit at constant loss for many epochs and it might descend again
heavy crow
i've done a slight mix of techniques from all 3 papers, mixing augmentations and collapse prevention
i think vicreg used a gaussian blur with a large kernel, that absolutely kills the input pipeline so i left that out but added some other augmentations
heavy crow
yes!
I have random resize crop, left/right flip, gamma, contrast, saturation, hue, grayscale and solarization
i though of using cutout/masking as well since i didnt see that in any of the papers
i'll investigate that once i have a few epochs of this baseline
spare briar
hard to give general advice on augmentations, need to see empirically
they should reflect some invariance/symmetry, st under the augmentation the image identity is the same
masking does work
heavy crow
have you heard of the google image embedding competition on kaggle? I stumbled across it while researching. They are doing exactly this! However they all seem to be using supervised approaches, might be interesting to see the difference 🙂
spare briar

arXiv.org
We propose Masked Siamese Networks (MSN), a self-supervised learning
framework for learning image representations. Our approach matches the
representation of an image view containing randomly...
heavy crow
spare briar
masking does work
good to know!
spare briar
here is vicreg + masking
heavy crow
where do you find all these papers?!
have you done any experiments using different backbones instead of a siamese setup? Both vicereg and boyl talk about this being possible but dont investigate further iirc
spare briar
haha idk, i read a lot of papers, friends, twitter, reading accepted papers at major conferences
what do you mean no siamese setup?
heavy crow
i.e using a efficientnet backbone and a vit-19 backbone as the two pillars
heavy crow
In practice, we pre-train a ViT-L/7 on as few as 18 AWS p4d-24xlarge machines.
Without masking, the same job requires over 42 machines.
hahah still out of my price range 😉
spare briar
only reason youd want to is preventing collapse, like EMA in byol
heavy crow
yup, atleast i don't think my model has collapsed haha
spare briar
its hard to reason about since each model learns different features
heavy crow
i left out the covariance and only used the std, seems to be working great but only time will tell
i guess if compute is irrelevant you can always use an ensemble of models with some kind of voting/fusing
steady basalt
are grads supposed to apply anywhere to all the positions that ask for 3+ yoe? there arent any junior DS roles
spare briar
why leave out covariance?
heavy crow
I was having some problems implementing it in tensorflow 😅
have you seen any research on the image size and its effect on performance?
spare briar
A library for state-of-the-art self-supervised learning from images
spare briar
heavy crow
have you seen any research on the image size and its effect on performance?
if all features are local then cnns should still be fine, problem is when you have long-context
then cnn fails to model them due to inductive bias and vit gets expensive due to quadratic self attention
heavy crow
hmm
spare briar
arXiv.org
Biological systems perceive the world by simultaneously processing
high-dimensional inputs from modalities as diverse as vision, audition, touch,
proprioception, etc. The perception models used in...
heavy crow
have there been any viable approaches to this?
spare briar
this is best solution im aware of
heavy crow
wow haha
spare briar
arXiv.org
A central goal of machine learning is the development of systems that can
solve many problems in as many data domains as possible. Current architectures,
however, cannot be applied beyond a small...
arXiv.org
Building models that can be rapidly adapted to numerous tasks using only a
handful of annotated examples is an open challenge for multimodal machine
learning research. We introduce Flamingo, a...
arXiv.org
We enhance auto-regressive language models by conditioning on document chunks
retrieved from a large corpus, based on local similarity with preceding tokens.
With a $2$ trillion token database,...
heavy crow
Do skip connections not help with this?
spare briar
its an open research area, very interesting progress last couple of years
with large images?
no why would they
they help you get deeper model
heavy crow
yeah, i remember nvidia doing progressive training from small images to large images
spare briar
make optimization more stable (perceiver uses skip connections)
oh right for generative models
that is more about stability not representation
the cnn model is intrinsically limited because of the choice of kernel size
this makes it data efficient for images but it gets punished when modeling long-range signals in the images
heavy crow
Interesting
spare briar
arXiv.org
The key distinguishing property of a Bayesian approach is marginalization,
rather than using a single setting of weights. Bayesian marginalization can
particularly improve the accuracy and...
see the intro in this paper
heavy crow
Have you done any research your self? It would seem you are pretty knowledgeable in this field!
spare briar
yeah i do this for work
heavy crow
thats pretty cool
little dagger
i've made a neural network from scratch, and atm its training. Its taking forever, is there a way to make it run faster or is that all dependent on my learning rate, learning rate decay and momentum hyper parameters
heavy crow
spare briar
https://arxiv.org/abs/2002.08791
looks like heir model is pretty large while not outperforming previous works by much though :(. 45million parameters compared to resnet50s 23 million.
spare briar
so this is more of a theory paper
what i was referring to is the intro
which gives a nice explanation of the idea of inductive bias and tradeoff with model expressiveness
heavy crow
ahh yeah fair enough
spare briar
like why cnns are a great idea with small/medium data but start to hurt you as you scale
its because the optimal solution is not in the support
spare briar
little dagger
i've made a neural network from scratch, and atm its training. Its taking foreve...
training on gpu?
heavy crow
i guess the solution is to get 512 TPUs and use a 4 billion parameter transformer 😉
spare briar
well heres the trick
train 4 billion parameter transformer 1 time
then finetune a linear layer for new tasks
on tiny tiny dataset
this crushes a dedicated 200 million parameter model trained on much more data
heavy crow
I always love it when the paper has a section with something like
"Training finished after xxxxx hours on our massive tpu cluster". It makes me wonder if there is any room left for individuals to run SOTA experiments
spare briar
this one always makes me laugh https://arxiv.org/pdf/2104.14421.pdf
they train a small feedforward model but fully bayesian with hamiltonian monte carlo
months on a thousand tpus
spare briar
its like a few layers
it actually was an important finding
since the fully bayesian model was actually better
now we need to find efficient approximate methods
heavy crow
spare briar
now we need to find efficient approximate methods
Thats way over my head!
spare briar
if the real thing is better but too much compute, can we approximate the real thing good enough with reasonable compute?
heavy crow
ah, i meant finding that out is over my head 😅
little dagger
spare briar
training on gpu?
im using jupiter books?
 tidal bough
heavy crow
I always love it when the paper has a section with something like
"Training fini...
tidal bough
heavy crow
I always love it when the paper has a section with something like
"Training fini...
I recently read this amazing post: https://hallofdreams.org/posts/hatetris/.
Relevant part:
 little dagger
how do i give it more cores
spare briar
there is a lot of work being done to reduce the compute for these models
heavy crow
tidal bough
I recently read this amazing post: <https://hallofdreams.org/posts/hatetris/>.
R...
i couldn't agree more, well said
spare briar
little dagger
im using jupiter books?
your jupyter notebook needs a gpu
heavy crow
Wow, that looks promising
 little dagger
spare briar
your jupyter notebook needs a gpu
little dagger
spare briar
your jupyter notebook needs a gpu
i have a gpu
spare briar
I know these figures are a huge flex
spare briar
little dagger
i have a gpu
what framework are you using? can you print something like Pytorch's torch.cuda.is_available()
heavy crow
most of the time my hyper-parameter search doesnt even look as good as the figure on the left! haha
spare briar
I admire greg yang a lot, he went very very deep on theory and came out the other side with real results
little dagger
spare briar
what framework are you using? can you print something like Pytorch's ```torch.cu...
im not using any ml libraries, ive builit this neural network only using numpy
spare briar
most people never return 😆
heavy crow
hehe
little dagger
i just want it to run a little faster
spare briar
little dagger
im not using any ml libraries, ive builit this neural network only using numpy
is numpy using your full cpu?
little dagger
spare briar
is numpy using your full cpu?
how do i check?
little dagger
?
 spare briar
so if you want to use gpu you could switch to jax
and just import jax.numpy as np
otherwise you need to get a better cpu
lapis sequoia
I asked ques here?
spare briar
(or possibly your numpy implementation could be improved)
little dagger
yeah mabye, ill try that.
heavy crow
going to add random masking and noise to the images and see what happens. ill keep the probabilities low for now
little dagger
how can you tell which hyperparameter (learning rate, learning rate decay and momentum) to increase or decrease? Im using stochiastic gradient descent
 wicked grove
Hello,i have a doubt in ensembling
Do we pass the the predictions the model gives from the test data
To build the data for ensemble mod3l
Im using the metjod of stacking
steady basalt
wicked grove
Do we pass the the predictions the model gives from the test data
Sklearn has some ensemble models u can use
heavy crow
spare briar
https://arxiv.org/abs/2204.07141
This is rather interesting, I added both noise and 64x64 cutout (images are 240x240) with a 10% chance. Loss is considerably worse after the first epoch! 0.425 compared to 1.68.
The only thing I can think of is that the cutout is too large? But this paper cuts out 70% of the image and gets great results!
Or i just have to wait for another 800 epochs like in their epoch?
I understand that since it is learning a more general embedding the training might be slower but that much slower? Doesn't seem right.
spare briar
masking didnt help for me until ViT-B scale
heavy crow
I'm also wondering if some kind of curriculum would help speed up learning. Something along the lines of slowly increasing the probability and strength of augmentations over time?
heavy crow
spare briar
masking didnt help for me until ViT-B scale
ahh. im using efficientnetB1, so quite a small model compared to that
spare briar
are you using different sets of augmentations for each view?
heavy crow
yes
spare briar
thats right
heavy crow
well the operations are the same but the probabilities are different
heavy crow
i'm using the same probabilities as vicereg but i added some extra augmentations like noise and saturation with low probabilities
i'll let this experiment run over night, that should get ~4 epochs in and see what happens
im actually not even compute limited but IO limited because the filesystem doesnt like reading many small files, so upgrading to cloud hardware would'nt even help :/
spare briar
how are images stored
heavy crow
on my pc im sitting at a nice 85-90% gpu util and 35% cpu across all cores.
two levels of directories, ~512 images per dir
spare briar
ok first i dont like lossily compressed images
hdf5 compresses on the fly losslessly
heavy crow
uncompressed im looking at ~1.25TB which i could only store on my hdd not ssd
interesting!
heavy crow
huh! let me try that 🙂
heavy crow
that will probably help me quite a bit!
can i read from hd5f as a generator?
like without reading the whole file into ram.
spare briar
yeah it behaves like a dict
and you can read only one image at a time to ram
you can also read with the file on disk not much slower than ram
and write straight to disk
loading nothing in memory
spare briar
yeah something like that
heavy crow
have you just used the h5py lib? not sure if there are multiple libs for that
spare briar
yeah h5py is fine
heavy crow
and i guess storing as uint8 is good enough for training a neural net
heavy crow
do i store each image as its own dataset?
 thick lily
hello
steady basalt
Hi!
 sudden canyon
Statistics question:
Suppose that I'm planning to spend some resources on tasks A, B, C and D.
For every task, I've calculated the best possible case, the expected case and the worst case. The best case occurs (for each task) with a 10% chance, the expected with a 70% chance, and the worst with a 20% chance.
What's a good way to graph the probability distribution of my spendings? Like, what's the most likely range of budgets, and with what probability I'll make ends meet if I have X money right now.
shell crest
Isn't the distribution known?
sudden canyon
wdym?
shell crest
Are there only 4 tasks or 4 types of tasks, each occurring n_i times?
If you only have 4*3 possibilities you can enumerate the whole thing and plot indeed, although a 12-point graph should be tabled rather than plotted
sudden canyon
Suppose I have two tasks: buy water and by potatoes.
With a 70% chance, water will cost $5. With a 20% chance, it will cost $10. With a 10% chance, it will cost $1.
With a 70% chance, potatoes will cost $20. With a 20% chance, it will cost $100. With a 10% chance, it will cost $16.
So my spendings will range from $17 to $110. I'd like to know how the distribution looks in between
sudden canyon
So this is what I have right now, maybe it makes it clearer:
https://paste.pythondiscord.com/tilifuvofe
This is what it looks like in uhh excel

does this look reasonably correct?
I have 3**4 possibilities
sudden canyon
All the tasks happen at once. It's like a shopping list, and I need to calculate how much I'm likely to spend
I just thought maybe there's some standard tool I can use?
CDF is like the integral of the thing above, right?
shell crest
Yup
shell crest
sudden canyon
I just thought maybe there's some standard tool I can use?
You might want to just list the probability of each exact total cost along with their probabilities
sudden canyon
yeah that's what I did in my implementation (I think)
well, as an intermediate step
shell crest
Yeah I think that's fine
Listing the standard summary statistics like expectation, and standard deviation might give people some idea too
shell crest
sudden canyon
So this is what I have right now, maybe it makes it clearer:
<https://paste.pyth...
Err I don't see the purpose of p_of_combination *= prob
sudden canyon
oh damn, you can integrate right in excel ||LibreOfice Calc but I call it Excel||
 sudden canyon
shell crest
Err I don't see the purpose of `p_of_combination *= prob`
sudden canyon
shell crest
Err I don't see the purpose of `p_of_combination *= prob`
Well, suppose I have a list of all combinations like (good, bad, bad, expected).
The probability that (good, good, good, expected) appears if I take one at random is 0.1 * 0.1 * 0.1 * 0.7
shell crest
sudden canyon
oh damn, you can integrate right in excel ||LibreOfice Calc but I call it Excel|...
After seeing both plots, I would also do a QQ-plot, if you heard of it.
It looks at how close the distribution is to normality. With that you can even simplify the whole 60-parameter distribution by 2 numbers, the mean and variance
 sudden canyon
hi
sudden canyon
sudden canyon
I could use <https://anydice.com> <:lemon_exploding_head:754441880141561958>
let's go

output (
    d{600,3500,3500,1500,1500,1500,1500,1500,1500,1500}
    + d{9000,15000,15000,10000,10000,10000,10000,10000,10000,10000}
    + d{1800,4250,4250,6000,6000,6000,6000,6000,6000,6000}
    + d{1000,3000,3000,6000,6000,6000,6000,6000,6000,6000}
)
why didn't I think of that first
this is a dice rolling problem
shell crest
That's still the same thing though, a CDF but looks different
shell crest
Sum of dice is only doable for small numbers, after a point it's probably better to use approximations
sudden canyon
how would one approximate such a thing?
shell crest
This is the continuous analog
https://en.wikipedia.org/wiki/Irwin–Hall_distribution
but basically, normdist hahaha

A lot of sums are norm-dist approximations. Even binomial distribution which technically has a closed form would probably be better calculated with normal approximations (at certain parameters)
sudden canyon
shell crest
This is the continuous analog
https://en.wikipedia.org/wiki/Irwin%E2%80%93Hall_d...
that sounds really over my head 👀
sounds like I need some more math-tery
shell crest
Well, I think you'll notice it if you look into source codes of statistical distributions - since they should be worried about complexities and not just theoretical results
 shrewd grove
Hello! I tried to get help on basic channels and I was sent here.
I am trying to create something OCR'y, after dipping my toes with predicting math functions - but I have little to no clue how to do this, so my attempts are mainly bruteforce-programming tries. I did some reading, and here is what I came up with:
I have 6 texts (planning to add more at some point) with almost 500 data samples. Do I need more? How much more?
I am aiming to get bits of C-string as an output from neural network (is there a better solution?)
I attached my model with some stuff commented out as I tried to experiment with it. Im tempted to add more hidden layers after the convolutions, but so far it did not improve much.
I also attached my output conversion functions.
Would appreciate someone having a look/suggesting something. Right now I am able to get around 0.17 mae (which is weird, as it gets trained in just a few epochs...)

 steady basalt
serene scaffold
<@461097636791844865> welcome to DS/AI
steady basalt
serene scaffold
<@461097636791844865> welcome to DS/AI
yall know each oth er
serene scaffold
steady basalt
yall know each oth er
We're both mods. All the mods know each other
serene scaffold
 kind herald
what does model free mean?
kind herald
what does model free mean?
Do you know what a model is? It's presumably where you don't have one.
 stuck schooner
Hi,
Question regarding the right tool
I am building a jupyter dashboard and would like a way for user to set a constant for many country and to save it after. I was thinking of ipywidget + dataframe that I save as CSV but I feel like it's not the right tool. I may have other type of setting that I want to add later.
kind herald
serene scaffold
Do you know what a model is? It's presumably where you don't have one.
no
stuck schooner
It would be okay but not ideal and best if user have to directly modify notebook cell
Is there any python library that could help with that ?
maybe JSON > CSV
 finite kayak
Hello everyone, I had a question.
Where people find the data to train their AI? Is it free and easy to find?
Thanks
steady basalt
serene scaffold
We're both mods. All the mods know each other
where?
stuck schooner
finite kayak
Hello everyone, I had a question.
Where people find the data to train their AI...
There is many website where you can get dataset. SKlearn have some dataset you can play with : https://scikit-learn.org/stable/datasets/toy_dataset.html

scikit-learn
scikit-learn comes with a few small standard datasets that do not require to download any file from some external website. They can be loaded using the following functions: These datasets are usefu...
finite kayak
Thank you for your answer. I am pretty new in this sector. One more thing, do all people use the data from the internet or is it also possible to do the measurements and create your own data?
stuck schooner
I don't see why you wouldn't be able to 🙂
finite kayak
Alright thanks a lot!
stuck schooner
What are the right tool in Python to store more than 40 variables and let user modify them in a notebook ?
steady basalt
data structure?
serene scaffold
stuck schooner
What are the right tool in Python to store more than 40 variables and let user m...
Can't you just put them in the first cell?
Also why that many?
stuck schooner
I would rather avoid letting a user modify within a cell the values. It would directly show in dashboard and a mistake may be responsible for 100K of money loss
steady basalt
oh god
stuck schooner
serene scaffold
Also why that many?
a threshold per country
stuck schooner
steady basalt
oh god
was being slightly over dramatic ^^ but my model will still be directing quite a lot of money
serene scaffold
stuck schooner
a threshold per country
Don't do a separate variable per country. Put it all in a config file or a csv and load it at runtime.
stuck schooner
Sure but how to manage the edit it and see the result of that change in dashboard ?
steady basalt
my data with only 2 variables is as useful as 10 variables
serene scaffold
stuck schooner
Sure but how to manage the edit it and see the result of that change in dashboar...
I guess you could have a drop down menu that lets you pick what country's value you want to change, and enter a new value. And then when the user enters it, it can re run the calculations that depend on it.
Disclosure: I don't make dashboards
stuck schooner
Thank ! That sounds really logical when you mention it ! 🙂
 kind herald
hey i'm confused. I want to get into machine learning but i suck at python and i don't know the math for it. What should i start doing to get the prerequisites to get into it?
kind herald
steady basalt
learn python
i know a little bit of python but idk how to get better at it
little dagger
kind herald
i know a little bit of python but idk how to get better at it
do a project
that involves machine learning
steady basalt
probably a bit much for a beginner
shell crest
steady basalt
probably a bit much for a beginner
Given how much there is out there, not really
shrewd grove
steady basalt
probably a bit much for a beginner
I do programing for a living and thought "Oh, how hard can a machine learning project be".
Oh boy, how wrong was I.
shell crest
That depends on the scope of your 'project', and how much you want it to be original.
shrewd grove
by "project" im assuming "not a classifier"
shell crest
That's a small class of problems
And classifiers aren't also necessarily simple
Not if you're trying to beat SOTA anyway
shrewd grove
This way or another. "Machine learning" so far for me was "oh, stuff works on simple stuff".
than "random shit doesnt work".
now imagine that you are a begginer and extend that sentence to "not only random shit does not work, but also I do not know the syntax"
shell crest
There is a lot of things which 'just work'
shrewd grove
that so?
shell crest
Yes because a huge infrastructure has sprung up making the whole idea easier and easier
shrewd grove
First tutorial I followed for installing conda in wsl
gave me a broken env - I tried to fix it. Soooo than I decided its easier to start from scratch
nth try rendered something semi-usable. I do not utilize my gpu, but I am afraid to touch a setup that "just works".
little dagger
bit of a long shot, but anyone know how to make a function where you can draw something on a 28 by 28 pixel grid and itll output a vector/list of grey scale values for each pixel?
kind herald
shrewd grove
Oh boy, how wrong was I.
thats your fault. I'm 14 as of right now and i plan to spend all my time and effort till i get a job in machine learning, learning machine learning. every second of my free time i'm gonna spend learning something new.
for machine learning.
shrewd grove
little dagger
bit of a long shot, but anyone know how to make a function where you can draw so...
could u explain it a bit more?
im puzzled on "draw something" within a function. Do You want a gui or something ?
little dagger
basically, the function will allow me to draw a digit for example and the function will return the pixel values of the grid
so if it was a 28 by 28 pixel grid
itll output a vector of 784 values
little dagger
is that a module?
shrewd grove
than get it to a numpy array
numpy array is a 2/3d array - so flatten it with itertools.
little dagger
is there a tutorial or documentation on how to use opencv?
shrewd grove

Stack Overflow
I want to put some text on an Image.
I am writing the code as:
cv2.putText(image,"Hello World!!!", (x,y), cv2.CV_FONT_HERSHEY_SIMPLEX, 2, 255)
It gives ERROR, saying 'module' object has no attrib...
This I think u want.
little dagger
thank you
 haughty anvil
In Spacy, how would I tag a new or very unknown company with the ORG entity label? For example, everyone knows Google but what if I have text with a lesser known company.
Would I have to train a new model or can I use something like the EntityRuler?
serene scaffold
haughty anvil
In Spacy, how would I tag a new or very unknown company with the ORG entity labe...
let's assume that your company is called Wolfbagelcia. Because that's what new companies are called in 2022. Can you assume that any occurrence of "Wolfbagelcia" or "wolfbagelcia" is certainly a mention of that company? (and if it isn't, are you willing to accept it being mistagged?)
for your awareness, I am a spaCy contributor. One commit, baby!
serene scaffold
no seriously. I only have one commit. fucking autosquash merge.
haughty anvil
Still better than most 🙂
serene scaffold
I mean 99% of people don't even know python.
serene scaffold
serene scaffold
let's assume that your company is called Wolfbagelcia. Because that's what new c...
anyway, what do you think?
it's called EntityRuler because it's a "pipeline component for rule-based named entity recognition"
haughty anvil
So, I ended up using the EntityRuler but not sure it makes the most sense in my case?
serene scaffold
so if you can use rules to accomplish this, yay! if not, you have to train something, I guess.
haughty anvil
I'm assuming the person knows what they want to find in the text is not known
When is it better to train a model?
versus using EntityRuler
serene scaffold
 tbh you probably don't have enough training data about this one ORG to do that.
serene scaffold
wooooooooooooooo
haughty anvil
Thank you for your help! 🙂
lapis sequoia
this seemed kinda weird to me to just add on the new estimator, but I guess if they took the average instead that would end up being random forest, is that right?
 lapis sequoia
Hey my kaggle account blocked while importing deepfacelab 😦 TT
@tacit basin you told me using it for this 🥺
wav2lip≈deepfacelab
tacit basin
lapis sequoia
<@490342783572246538> you told me using it for this 🥺
I didn't know you were going to break their TOS, never used deepfacelab.
It's probably software you should not use?
 desert oar
lapis sequoia
this seemed kinda weird to me to just add on the new estimator, but I guess if t...
desert oar
lapis sequoia
this seemed kinda weird to me to just add on the new estimator, but I guess if t...
kind of, but in the case of boosting the new estimator is train on a modified version of the data. whereas in random forest, each estimator is basically the same, just randomized
specifically each successive model is fit to the residual of the previous model. it says that on the wikipedia page you're reading!
lapis sequoia
In notebook -> https://github.com/chervonij/DFL-Colab

GitHub
DeepFaceLab fork which provides IPython Notebook to use DFL with Google Colab - GitHub - chervonij/DFL-Colab: DeepFaceLab fork which provides IPython Notebook to use DFL with Google Colab
And kaggle blocked me 😿
 surreal dust
B has a higher range and median here, right?
 steady basalt
Kagglers so suck hard and make me mad. Achieving “99% accuracy!” By predicting one class in an imbalanced binary dataset
Hundreds of them..
Why spend so long making a sexy notebook that effectively does nothing
shrewd grove
To make a notebook. Achieving anything usually has a very low priority 🙂
lapis sequoia
hi im only just learning data science im doing an intro subject for it
dumb question but say we are given a csv file and it asks "How many data instances and variables exist in the given dataset as indicated by the rows and columns". what exactly does data instances and variables mean and how are they different
wooden sail
sounds like it's asking you to figure out what the rows and columns of the data represent, since you could arrange the data either with the variables along the columns, or along the rows. then the other axis tells you how many "observations" or "samples" you have for each variable


 vale pasture
I'm trying to make a tensor of tensors in PyTorch.
I have the MNIST dataset and what I want to do is to create a tensor that contains 10 sub-tensors. Then each subtensor contains the images of each digit respectively (for example, the subtensor at index 0 contains all 0 digit images; the subtensor at index 1 contains all 1 digit image). The images are stored as tensors.
How would I go about doing this?
tidal bough
Is there a reason you want this, as opposed to just a list of 10 tensors?
vale pasture
I currently have this, and the outcome leads to all images being stored in a single continuous tensor:
the_tensor = tensor([])
for number in range(10):
    current_tensor = torch.stack([tensor(Image.open(image)) for image in (path/'training'/str(number)).ls()])
    the_tensor = torch.cat((the_tensor, current_tensor))
I need a tensor of tensors so that I can work with them more easily and create datasets/dataloaders and such.
tidal bough
Not sure it will work well, since unless you have an equal number of pictures of every class, it'd have to be a ragged tensor.
vale pasture
tidal bough
Not sure it will work well, since unless you have an equal number of pictures of...
This is what I'm trying to aim for, with a simple example.
t1 = tensor([[[1, 1], [1, 1]]])
t2 = tensor([[[2, 2], [2, 2]]])
t3 = torch.cat((t1, t2)); t3
Output:
tensor([[[1, 1],
         [1, 1]],

        [[2, 2],
         [2, 2]]])
so t3[0] would output t1
tidal bough
Anyway, you'd need to use stack instead of cat, and it's also very inefficient to repeatedly stack the same tensor since it involves copying it (tensors can't be resized after all).
So append all the subtensors to a list instead, then do the_tensor = torch.stack(lst).
actually, looks like torch, unlike numpy, just doesn't allow ragged tensors at all. The docs for stack say:
All tensors need to be of the same size.
So unless you have an equal number of examples of each class, what you're trying is impossible in pytorch.
vale pasture
tidal bough
So unless you have an equal number of examples of each class, what you're trying...
Oh yes, you are right.
Did the following and got an error:
t1 = tensor([[[1, 1], [1, 1], [1, 1]]])
t2 = tensor([[[2, 2], [2, 2]]])
t3 = torch.cat((t1, t2)); t3
RuntimeError: Sizes of tensors must match except in dimension 0. Expected size 3 but got size 2 for tensor number 1 in the list.
I don't have an equal number of examples for each class.
So I suppose I can only have one long tensor with all the images together, right?
tidal bough
Yes, generally you have one long tensor of inputs (for example, if you're doing images it might be of shape (N_images, width, height, channel_count)) and a tensor of correct outputs (for classification tasks, that'd be the correct labels) of the same length (of shape, say, (N_images,)).
vale pasture
Alright, I see.
Was like if I could organize the tensor a bit, it would be easier to work with it. But it would lead to problems with transformations and computations. I suppose I could try working with a list of tensors instead.
Thank you for the help.
 ripe forge
Sounds like it should be a dictionary of lists, each list containing the tensors. And its still not clear why you need to collect them like this, because model training doesn't need this kind of setup
shrewd grove
am I correct to understand that the convolution layers here wont cover a character? 2x2 * 3x3 gives 6x6 pixels
 vale pasture
ripe forge
Sounds like it should be a dictionary of lists, each list containing the tensors...
vale pasture
ripe forge
Sounds like it should be a dictionary of lists, each list containing the tensors...
Ooo, that's another way I could approach it. I understand that training a model doesn't need such a set up. However, it would make exploring the data and testing out stuff more easy.
 rapid cedar
does ml use log?
wooden sail
shrewd grove
am I correct to understand that the convolution layers here wont cover a charact...
convolutional layers apply a small linear transformation several times. each one covers only few pixels, and the result is a new pixel. then you "slide" the convolution kernel over the image to produce a brand new image
shrewd grove
wooden sail
convolutional layers apply a small linear transformation several times. each one...
is the resulting image different in size or is it more like "blurring" effects?
wooden sail
shrewd grove
is the resulting image different in size or is it more like "blurring" effects?
those two questions are not mutually exlusive
the answer to both is "it can be" lol
strong sedge
how does 1 remove outliers in multiple columns
I understood how its done on a single column with percentiles, but how would it be done for multiple columns
should I loop thru the columns and individually remove them ?
wooden sail
filters with a low pass effect behave as blurs in a sense, yes. depending on how you compute the convolution, the resulting image can be the same size, bigger, or smaller, too
shrewd grove
I figgured the convolution could make it easier to recognise my text here, but now as i think of it, i am not so sure.
wooden sail
it should, yes
shrewd grove
is there anything I can make better in my model to make chances of success higher?
wooden sail
you can try different optimizers and cost functions. you can also try changing the number of filters per layer, their size, and the number of layers
shrewd grove
so principally, it should work ?
wooden sail
to some extent, sure. i'm not all that savvy on the recognition of texts to be honest, so i'm not aware of what the state of the art is regarding architectures for it
shrewd grove
i suppose im going to find out in a few hours 😄
gave it 10k samples so I couldnt blame lack of training data.
wooden sail
recognizing whole strings is a very different problem from just identifying a char though. wouldn't be surprised if you need something more sophisticated
shrewd grove
isnt recognising whole strings same category of problems though, just extended?
if it was to return a char + rest of image, it could be called recursivly.
wooden sail
not really because it is not known a priori how to segment the image
so identifying one char immediately affects whether you find the others
shrewd grove
true
wooden sail
it's a joint estimation problem, which means it is more difficult
in general, knowing ahead of time how many of something you're looking for means the problem is easy. not knowing that immediately makes the problem much more difficult
shrewd grove
thats why i simplified my toy problem to 4 characters.
I suppose I could simplify it further - to 1, to get something working... and than try 2?
wooden sail
with 1 your network will work just fine
with 2 already i'm not sure which architectures would work well off the top of my head
shrewd grove
Okay - assuming I have one... I could also return the position of the character, could I not?
wooden sail
what do you mean by the position
shrewd grove
"I found character 'a' at coords : 0,0"
wooden sail
oho, localization is also a completely different problem 😛
to locate something you need to know how it looks, which you don't ahead of time
that turns it into a blind deconvolution problem
wooden sail
do they always look exactly the same?
shrewd grove
more or less - they are in my toy problem!
wooden sail
also note that to train such a network, your training data needs to have the coordinates in it too
shrewd grove
which makes it a pain to collect data
wooden sail
right, you need to write some code that generates proper rigid transformations of your images to produce coordinate - image pairs. the raw images aren't enough to train this
shrewd grove
oh, right now i kind of solved it.
wooden sail
you would also have to parse the coordinates afterwards to turn them back into strings. i think this is not the best way of solving the problem
shrewd grove
 shrewd grove
wooden sail
you would also have to parse the coordinates afterwards to turn them back into s...
shrewd grove
wooden sail
you would also have to parse the coordinates afterwards to turn them back into s...
probably not
Im tempted to make ascii-bits an output from the network, rather than ascii-floats.
Im assuming If i were .... for example - classifying a large amount of categories - it is all right to return them as binary index?
wooden sail
binary index like 1-hot encoding?
wooden sail
shouldn't make any difference, but you'll have a hard time getting a network with output like that
enforcing the quantities to be discrete means also that they're not differentiable
so you'll anyway end up working with approximations in the network
shrewd grove
how is it done for large quantities of categories than ?
wooden sail
you don't like base 10?
shrewd grove
oh, i thought that nerworks work better if output can be in 0-1 ranges.
wooden sail
it helps avoid exploding gradients, sure. you'd need a custom activation function in the last layer though
people usually just assign an int to each category or use one-hot
shrewd grove
is it better if these ints are more spaced-apart, or it makes no difference ?
wooden sail
probably worse, if anything
the reason people like one-hot is that all classes are equidistant, so it doesn't cluster the results
serene scaffold
wooden sail
the reason people like one-hot is that all classes are equidistant, so it doesn'...
what if I don't want that
wooden sail
that's fine if you do it on purpose
it's equivalent to enforcing a prior distribution on the results
shrewd grove
is decreasing learning rate as I train it a good approach ?
wooden sail
it's one of the conditions under which stochastic gradient descent converges when one considers the expected value of the error, sure. you can look up hyperparameter schedules that are known to converge
but most optimizers take care of this for you automatically
 brisk apex
uh i'm pretty sure intellij had webpage dedicated to converting scala to python yet it seems i can't find one. did they remove that ability?
huh i thought there was automatic conversion... i guess i did manual conversion on my previous scala project
 lapis lake
Hello! This is my code for the Jacobi method. Can someone help me plot against error and residual norm?

This is my attempt and I'm not sure if it is correct
 wooden sail
give me one second to refresh the jacobi method. that's the one for diagonally dominant matrices where you hold an entry constant, right
lapis lake


 wooden sail
yep. what's x_s in your code?
lapis lake
 serene scaffold
!code
arctic wedgeBOT
Here's how to format Python code on Discord:
```py
print('Hello world!')
```
These are backticks, not quotes. Check this out if you can't find the backtick key.
wooden sail
ah you give the exact solution for comparison
that's kinda weird, but ok for testing. the code looks ok. i'd just note that there exists a function called zeros, you can use that instead of 0 * ones()
lapis lake
lapis lake
about plotting the error and residual norm. Is my code correct?
wooden sail
did you try it?
btw the escape condition looks weird
why do you compare the norm of the residual to the norm of x?
lapis lake
My bad what I was supposed to do is to plot iteration against error and residual norm
wooden sail
well, i guess that makes sense, just a little unusual. but note that it may make more sense to stop once the residual stops changing much from one iteration to another, and to put a maximum number of iterations too. it can be that the algorithm does not work for your matrix, or that it converges very slowly
at any rate. yeah, looks fine
lapis lake
Thanks for the help 👌
wooden sail
the jacobi method is pretty sweet. you can interpret it as a specially weighted flavor of gradient descent that considers how large each column is. pretty cool for an algorithm so simple, but the same can be said for vanilla gradient
 arctic cliff
Why do we divide by p in inverted dropout?
 wild sluice
what jobs can I do after learning artificial intelligence
dusty valve
i wanna classify something as 0 or 1, what tf.keras.optimizers should i use?
arctic cliff
dusty valve
i wanna classify something as 0 or 1, what tf.keras.optimizers should i use?
I think you should check this out:
https://youtu.be/c36lUUr864M?t=6441

In this course you learn all the fundamentals to get started with PyTorch and Deep Learning.
⭐ Check out Tabnine, the FREE AI-powered code completion tool I use to help me code faster: https://www.tabnine.com/?utm_source=youtube.com&utm_campaign=PythonEngineer *
Find Python and ML jobs: https://pythonengineer.pallet.com
Get my Free NumPy Handb...
1:47:21
dusty valve
arctic cliff
I think you should check this out:
https://youtu.be/c36lUUr864M?t=6441
im using tensorflow
arctic cliff
My bad xD
desert oar
dusty valve
i wanna classify something as 0 or 1, what tf.keras.optimizers should i use?
don't worry too much about the choice of optimizer when you're first starting with machine learning. adam is a sensible default that you can mostly "forget" and not have to think too hard about it.
i've seen some results showing that some optimizers work better on some problems, but that's for much later when you are tuning models that already are known to work well
dusty valve
imma use tf.keras.optimizers.Adamax, seems to work well with what im doing
desert oar
sure, like i said don't think about it too much. as long as you understand what sgd is and how it works, you are fine
brisk apex
I'm trying to cast a few columns in dataframe into string, and rest into int. How do I achieve this? I tried following:
    for c in df.columns:
        if c == "_c0" or c == "_c1":
            cast_df = df.withColumn(c, df[c].cast('string'))
        else:
            cast_df = df.withColumn(c, df[c].cast('int'))
but wouldn't this cast everything in cast_df to integer in the end?
using pyspark
desert oar
brisk apex
I'm trying to cast a few columns in dataframe into string, and rest into int. Ho...
is this pyspark? you should be clear about what library you're using...
and no, why would it?
brisk apex
i'm trying to convert scala spark codes into pypark so been looking up a way to cast columns...I just found a link so I'm going to try that
And I thought it'd cast everything to int since I'm re-assigning result of withColumn to same variable
desert oar
brisk apex
And I thought it'd cast everything to int since I'm re-assigning result of withC...
of course not, withColumn only modifies or appends one column. it doesn't touch the other columns
tidal bough
in pandas you can do something like
df = df.astype({col:(str if col in some_cols else int) for col in df.columns})
Not sure if pyspark is different
desert oar
@brisk apex spark (and pyspark) in general is best thought of as a compiler for rdd and dataframe operations. withColumn doesn't actually "do" anything, it just adds to a chain of operations that will be applied whenever the df is collect-ed or some other collecting operation occurs
withColumn essentially returns a new dataframe with a withColumn operation at the end of the operation chain, but the underlying data is the same and has not yet been modified
it might be nice if they were "in-place" operations, but i guess that's an artifact of scala attempting to be "functional". i don't know if there are other reasons, maybe it's useful in some cases to have access to older "steps" in the chain
brisk apex
Thanks!
steady basalt
                                            class_weight = "balanced",
                                            classes = np.unique(y_train),
                                            y = y_train
                                        )
    class_weights = dict(zip(np.unique(y_train), class_weights))
    class_weights
    model = Sequential()
    model.add(Dense(256, input_dim=14, activation='sigmoid',kernel_constraint=maxnorm(3)))
    model.add(Dropout(0.2))
    model.add(Dense(64,'sigmoid',kernel_constraint=maxnorm(3)))
    model.add(Dropout(0.2))
    model.add(Dense(64,'sigmoid',kernel_constraint=maxnorm(3)))
    model.add(Dropout(0.2))
    model.add(Dense(1, activation='sigmoid'))
    optimizer = tf.keras.optimizers.Adam(0.0003)
    model.compile(loss='binary_crossentropy', optimizer=optimizer, metrics='AUC')
    history = model.fit(X_train, y_train, validation_split=0.1, epochs=5, batch_size=8,class_weight=class_weights)``` anyone know why i get the following
and also my process starts stopping after a certain amount of epochs, it just freezes dead
jupyter wont even interrupt
can fix that tho
tacit horizon
hello guys, how do i do if i want to convert the following df?
key value other info
0 A 1 2
1 B 2 2
2 C 3 2
3 A 3 4
4 B 4 4
5 C 5 4
V
other info A B C
0 2 1 2 3
1 4 3 4 5
desert oar
tacit horizon
hello guys, how do i do if i want to convert the following df?
key value...
you want to "spread" the key column to be separate columns?
what do you want to do with the value column?
it's helpful that you posted an example, but it's a bit hard to read. can you edit your post to use code formatting?
!code see below
arctic wedgeBOT
Here's how to format Python code on Discord:
```py
print('Hello world!')
```
These are backticks, not quotes. Check this out if you can't find the backtick key.
tacit horizon
import numpy as np
import pandas as pd

# %%
test = [['A', 1, 2],['B', 2, 2],['C', 3, 2],['A', 3, 4],['B', 4, 4],['C', 5, 4]]
df = pd.DataFrame(test, columns=['key', 'value', 'other info'])
target = [[2, 1, 2, 3],[4,3,4,5]]
df2 = pd.DataFrame(target, columns=['other info', 'A', 'B', 'C'])
yes, the source is something like 6NF, I want to convert the key from row to column
is it possible?
desert oar
tacit horizon
yes, the source is something like 6NF, I want to convert the key from row to col...
yes it is possible. there are two options here: 1) use the .pivot method, 2) add the key column to the data frame index, then use unstack
!e ```python
import pandas as pd
rows = [
['A', 1, 2],
['B', 2, 2],
['C', 3, 2],
['A', 3, 4],
['B', 4, 4],
['C', 5, 4]
]
df = pd.DataFrame(rows, columns=['key', 'value', 'other_info'])
print(
df.pivot(columns='key', values=['value', 'other_info'])
)
@desert oar :white_check_mark: Your 3.11 eval job has completed with return code 0.
001 |     value           other_info
002 | key     A    B    C          A    B    C
003 | 0     1.0  NaN  NaN        2.0  NaN  NaN
004 | 1     NaN  2.0  NaN        NaN  2.0  NaN
005 | 2     NaN  NaN  3.0        NaN  NaN  2.0
006 | 3     3.0  NaN  NaN        4.0  NaN  NaN
007 | 4     NaN  4.0  NaN        NaN  4.0  NaN
008 | 5     NaN  NaN  5.0        NaN  NaN  4.0
what do you want to do with the duplicated rows?
hm, i think i see what you want here
tacit horizon
tacit horizon
```py
import numpy as np
import pandas as pd
# %%
test = [['A', 1, 2],['B', 2, ...
my target is want to convert it to df2
desert oar
!e ```python
import pandas as pd
rows = [
['A', 1, 2],
['B', 2, 2],
['C', 3, 2],
['A', 3, 4],
['B', 4, 4],
['C', 5, 4]
]
df = pd.DataFrame(rows, columns=['key', 'value', 'other_info'])
print(
df[['key', 'value']]
.pivot(columns='key')['value']
.join(df['other_info'])
.groupby('other_info', as_index=False, sort=False)
.first()
)
there's probably a more elegant way to do this
arctic wedgeBOT
@desert oar :white_check_mark: Your 3.11 eval job has completed with return code 0.
001 |    other_info    A    B    C
002 | 0           2  1.0  2.0  3.0
003 | 1           4  3.0  4.0  5.0
!d pandas.DataFrame.pivot_table
arctic wedgeBOT
DataFrame.pivot_table(values=None, index=None, columns=None, aggfunc='mean', fill_value=None, margins=False, dropna=True, margins_name='All', observed=False, sort=True)```
Create a spreadsheet-style pivot table as a DataFrame.

The levels in the pivot table will be stored in MultiIndex objects (hierarchical indexes) on the index and columns of the result DataFrame.Amazing, thank you! I will try to improve it
desert oar
!e ```python
import pandas as pd
rows = [
['A', 1, 2],
['B', 2, 2],
['C', 3, 2],
['A', 3, 4],
['B', 4, 4],
['C', 5, 4]
]
df = pd.DataFrame(rows, columns=['key', 'value', 'other_info'])
print(
df.pivot(index='other_info', columns='key', values='value')
)
@desert oar :white_check_mark: Your 3.11 eval job has completed with return code 0.
001 | key         A  B  C
002 | other_info
003 | 2           1  2  3
004 | 4           3  4  5
there @tacit horizon ☝️ however there are some issues with this
tacit horizon
?
desert oar
it depends on what other_info is
are there several columns there? or just 1?
is that column an "index" of some kind? will it uniquely identify rows in the result?
tacit horizon
there are serveral column of other info
desert oar
and does one of them represent some kind of unique identifier for the new rows?
note that in data science jargon, data like this is called "long data" and you are creating "wide data"
tacit horizon
desert oar
note that in data science jargon, data like this is called "long data" and you a...
You give me a new idea, i can split them to different dataframe base on their key and do data analyst, it is not nessccary to join them up
 quick eagle
I'm getting this warning:
The frame.append method is deprecated and will be removed from pandas in a future version. Use pandas.concat instead.
The code I run is basically:
rms_table = pd.DataFrame(columns = ['offset'])
and in a for loop:
rms_table = rms_table.append({'offset' : offset_sec, 'RMS*10000' : rms}, ignore_index=True)
I'm trying to convert it so it doesn't warn anymore, but not sure how... I didn't understand this solution:
https://stackoverflow.com/questions/70837397/good-alternative-to-pandas-append-method-now-that-it-is-being-deprecated
Anyone care to help?
Stack Overflow
I use the following method a lot to append a single row to a dataframe. One thing I really like about it is that it allows you to append a simple dict object. For example:
Creating an empty dataf...
desert oar
quick eagle
I'm getting this warning:
The frame.append method is deprecated and will be remo...
rms_items = []
for ...:
    rms_items.append({'offset': offset_sec, 'RMS*10000': rms})
rms_table = pd.DataFrame(rms_items)
this will be much faster anyway compared to appending
if you really had a list of dataframes or series objects, you would pd.concat the list at the end
quick eagle
thanks!!!
earnest widget
Why does my loss and mse become such values?
183/183 [==============================] - 27s 147ms/step - loss: 0.0078 - mean_squared_error: 0.0078 - val_loss: 0.0039 - val_mean_squared_error: 0.0039
Epoch 2/10
183/183 [==============================] - 24s 134ms/step - loss: 0.0019 - mean_squared_error: 0.0019 - val_loss: 9.0209e-04 - val_mean_squared_error: 9.0209e-04
Epoch 3/10
183/183 [==============================] - 24s 133ms/step - loss: 0.0012 - mean_squared_error: 0.0012 - val_loss: 6.7260e-04 - val_mean_squared_error: 6.7260e-04
I am using VGG16 model, with normalized data as well.
wooden sail
earnest widget
Why does my loss and mse become such values?
```
183/183 [======================...
wdym by "such values"?
earnest widget
wooden sail
wdym by "such values"?
Well I have not gotten values like 6.7260e-04 for my loss or mse. Usually, my loss values go down from 0.0170 to 0.0160 something like that. I just want to know if this is wrong or correcf.
wooden sail
that's impossible to say because loss and mse mean very little on their own
that depends entirely on your data and model
you'll have to check the test and validation accuracy, and if that's not feasible, then you'll have to inspect visually
or if you have good reason to believe the MSE should be close to some value, that loss and MSE are fine. but without extra knowledge to make that decision, those two usually don't mean anything important
earnest widget
wooden sail
you'll have to check the test and validation accuracy, and if that's not feasibl...
I don't have accuracy as a metric cause it's a regression task.
wooden sail
all right. then the MSE and loss make sense if you have a unit to attach to them
do the values you're fitting mean anything? some unit attached to them or otherwise some sense of how large they are?
earnest widget
wooden sail
do the values you're fitting mean anything? some unit attached to them or otherw...
Yeah I just trained my model and checked the prediction rate, which is suprisingly good. However, when I try to add another metric like mean average precision, I get 0.0000e+00 for each epoch.
Epoch 2/250
183/183 [==============================] - 24s 134ms/step - loss: 0.0019 - mean_average_precision_metric: 0.0000e+00 - val_loss: 0.0013 - val_mean_average_precision_metric: 0.0000e+00
Epoch 3/250
183/183 [==============================] - 25s 135ms/step - loss: 0.0011 - mean_average_precision_metric: 0.0000e+00 - val_loss: 6.7997e-04 - val_mean_average_precision_metric: 0.0000e+00
Epoch 4/250
183/183 [==============================] - 25s 136ms/step - loss: 8.3016e-04 - mean_average_precision_metric: 0.0000e+00 - val_loss: 5.0470e-04 - val_mean_average_precision_metric: 0.0000e+00
isn't map for classification?
earnest widget
It's for object detection.
wooden sail
but you said you're doing regression
earnest widget
Isn't object detection part of a regression problem?
wooden sail
no
not in general
what are you calling regression here, for starters
you have a parametric model and you find its parameters?
earnest widget
Basically what I am trying to do is simple prediction.
wooden sail
so you have input params and outputs, and you want to predict outputs given inputs. sure, that's a regression problem
no detection involved
then the MSE and loss only make sense if you attach a meaning to them by comparing them to what the true solution should have been. or if you parameterized your model in such a way that the network finds the parameters of that same model, then you can see how good the estimates of those parameters are
earnest widget
wooden sail
then the MSE and loss only make sense if you attach a meaning to them by compari...
Oh alright. I understood now. Clear now. Cheers.
 inland zephyr
I have an issue when using keras tensorflow. I using looping to convert my image size to 240x240 and using Albumentation pipeline. I have 144 train image and 36 test as below:
python
train: (144, 240, 240, 3)
test: (36, 240, 240, 3)
however, when i try to call my classifier fitting
python
classifier.fit(aug.flow(train_data,train_labels,batch_size=32),epochs=100)
Error occured ValueError: could not broadcast input array from shape (241,241,3) into shape (240,240,3)
tacit basin
How do I create and open a new jupyter notebook file from command line similar to vim new_file.py. possible? jupyter lab new_notebook.ipynb does not work.
 solar tiger
can anyone help me to fix this error
ValueError: Classification metrics can't handle a mix of binary and continuous targets
I think your input arr is of 241 241 size.
tidal bough
my guess is that your augmentations also increase the image size by 1 along each axis, for some reason.
 brave sand
does anyone know why my code for a custom environment opens and and doesn't render in a singular window?
https://hastebin.com/lupudicozo.properties
Hastebin is a free web-based pastebin service for storing and sharing text and code snippets with anyone. Get started now.
inland zephyr
tidal bough
my guess is that your augmentations also increase the image size by 1 along each...
i dont increase the image size by 1
however the culprit is the augmenter
def preprocess(img):
    aug=A.Compose([
        A.Equalize(),
        A.VerticalFlip(),
        A.RandomShadow(),
        A.VerticalFlip(),
        A.HorizontalFlip(),
        A.ShiftScaleRotate(),
        A.RGBShift(),
        A.Emboss(),
        A.Sharpen(),
        A.ChannelShuffle()
        ])
    aug_img = aug(image=img.astype(np.uint8))['image']
    # aug_img = np.array(aug_img, dtype="float") / 255.0
    aug_img = cv2.resize(src=aug_img , dsize=(250,250), interpolation=cv2.INTER_CUBIC)
    return aug_img
i need to forced to resize the image to fit the model
aug = ImageDataGenerator(preprocessing_function=preprocess)
...
classifier.fit(aug.flow(train_data,train_labels_conv,batch_size=32),epochs=100)
Then i called it like this
However i need to collect more data, for atleast 40 images per class (i only have 60 per class for now)
 somber sphinx
hello there.
quick question, how does one calculate these?
 wooden sail
what are 01 and 02 supposed to be in the diagram?
the outputs?
you'd take the given computation graph and turn it into functions, then apply the chain rule twice
if you like, this can be done easily by turning the layers into matrix-vector products
somber sphinx
wooden sail
you'd take the given computation graph and turn it into functions, then apply th...
ah i see
somber sphinx
wooden sail
if you like, this can be done easily by turning the layers into matrix-vector pr...
how do i do that?
wooden sail
gimme one second

i wrote down how to matricize the first half of the matrix, along with a refresher on how to compute the MSE given a vector. there on the first line, the x vector should be substituted with the error of your estimate
tbh in your image it's not clear whether the biases are trainable or not, and if they are trainable, whether they are trainable as vectors with independent entries or only trainable via a scalar factor
somber sphinx
ah interesting thx; and no the biases are not trainable
wooden sail
ok you can remove the b1 vector then
and you can immediately see that the next layer is simply multiplying by another matrix with the other weights followed by a sigmoid
once you have that, the error is the y vector minus the output of the network. you plug that error into the MSE and use the chain rule to compute the gradients
heavy crow
a little progress update on my experiments:
Non-of my changes seemed to really change anything so as a sanity check I removed the std part of the loss and it indeed collapsed pretty quickly. I also played around with the LR but my initial value seems to be a ok value. Network size and depth also have little to no effect.
I'm not really sure what else to try out. The loss converges to ~0.3 pretty quickly after only around 5k batches.
dusty valve
this is my first project that i tried to make without any help or tutorials, how is it?https://github.com/HRLO77/wordle-ai/
it's not complete yet tho
if anyone has suggestions feel free to say
whoops forgot to train it
agile cobalt
why LSTM?
isn't 0.9 way too high of a dropout?
you forgot to define largest on the test.py or remove the line that uses it
dusty valve
whoops
steady basalt
Slow chat today!
brisk apex
trying to use pyspark, I'm getting following error. What am I supposed to do?
at org.apache.spark.deploy.SparkSubmitUtils$.resolveMavenCoordinates(SparkSubmit.scala:1447)
at org.apache.spark.util.DependencyUtils$.resolveMavenDependencies(DependencyUtils.scala:185)
at org.apache.spark.deploy.SparkSubmit.prepareSubmitEnvironment(SparkSubmit.scala:308)
at org.apache.spark.deploy.SparkSubmit.org$apache$spark$deploy$SparkSubmit$$runMain(SparkSubmit.scala:898)
at org.apache.spark.deploy.SparkSubmit.doRunMain$1(SparkSubmit.scala:180)
at org.apache.spark.deploy.SparkSubmit.submit(SparkSubmit.scala:203)
at org.apache.spark.deploy.SparkSubmit.doSubmit(SparkSubmit.scala:90)
at org.apache.spark.deploy.SparkSubmit$$anon$2.doSubmit(SparkSubmit.scala:1043)
at org.apache.spark.deploy.SparkSubmit$.main(SparkSubmit.scala:1052)
at org.apache.spark.deploy.SparkSubmit.main(SparkSubmit.scala)```
Do I need to download and save that commons dependency separately? desert hawk
Hey, sorry noobie question here. I am learning Python and was also interested in learning some software like Power BI but I am on Ubuntu. Just wondering what the equivalent would be for Linux users? thanks
misty flint
why dont you just use any number of python visualization libraries instead
that type of visualization software would be more needed if you are looking for a job, etc.
(my job requires power bi) 
im over it
but the non-technical folks like it
heck, even some non-technical folks think power bi is too much for them so they use "smart sheet" instead 
desert hawk
misty flint
that type of visualization software would be more needed if you are looking for ...
Well this is the point lol, I am a beginner in Python but have been learning to code for 4-5 months (JS prior) I some some entry level/intern positions that mentioned Python and Power BI and I just thought I'd play around with the software.
misty flint
desert hawk
Well this is the point lol, I am a beginner in Python but have been learning to ...
powerbi and tableau are the two big players
maybe tableau has a linux version
ive only used the windows version of both
desert hawk
I will have a google, thanks for the info
misty flint
gl
dont forget to learn sql if you are going for entry level data analyst positions
your sql skills need to better than the average dev btw
since you are usually responsible for direct querying; no ORMs here

desert hawk
misty flint
dont forget to learn sql if you are going for entry level data analyst positions
Thanks, yes at the moment I am just seeing what options are out there. I'll keep all of that in mind. Thanks again
 iron basalt
desert hawk
Hey, sorry noobie question here. I am learning Python and was also interested in...
iron basalt
desert hawk
Hey, sorry noobie question here. I am learning Python and was also interested in...
You may be able to get it running via WINE.
desert hawk
iron basalt
You may be able to get it running via WINE.
Thanks, I'll look into this. I was also thinking I might be able to do it on AWS.. I haven't looked into it, but I think it might be a possibility also since I think they have virtual desktops
iron basalt
desert hawk
Thanks, I'll look into this. I was also thinking I might be able to do it on AWS...
A way that is easy to do and works surprisingly well for many applications is to add them to your steam library and then run them through steam's proton (WINE with lots of config and extra stuff).
magic dune
import numpy as np
import matplotlib.pyplot as plt
import sklearn.datasets as make_classification

def compute_grad_with_respect_to_M(x, y):
    return -(1*x)*(y)


def compute_grad_with_respect_to_B(y):
    return -1*y

def score(y_hat, y):
    return np.mean(y == y_hat[:len(y)])

def activation_function(activation_functions, z,lr,point,current_y,y_hat_array,weights):
    if activation_functions == "sign":
        if z >= 0.5:
            y_hat = 1
        else:
            y_hat = -1
        y_hat_array.append(y_hat)
        weights[0] = weights[0] + (lr * compute_grad_with_respect_to_B(y_hat))
        weights[1] = weights[1] + (lr * compute_grad_with_respect_to_M(point[1],y_hat))
        weights[2] = weights[2] + (lr * compute_grad_with_respect_to_M(point[0],y_hat))
    return y_hat_array, weights,y_hat

def main(lr, y, X, activation_functions):
    y = np.where(y == -1, 0, y)
    print(y)
    y_hat_array = []
    weights = np.random.random(3)
    print(weights)
    print("_" * 10)
    for i in range(10):
        for j, point in enumerate(X):
            print(f"point:{point}\nnumber:{y[j]}")
            z = weights[0] + (point[0] * weights[1]) + (point[1] * weights[2])
            y_hat_array, weights,y_hat = activation_function(activation_functions, z,lr,point,y[j],y_hat_array,weights)
            print(f"epoch:{i}\nw0:{weights[0]}\nw1:{weights[1]}\nw2:{weights[2]}")
            print(f"point:{point}\nz:{z}\ny_hat:{y_hat}")
            print("_" * 10)
    return weights,y_hat_array

if __name__ == '__main__':
    X, y = make_classification.make_classification(n_samples=100, n_features=2, n_redundant=0, n_informative=2,n_clusters_per_class=1)
    learning_rate = 0.001
    activation_functions = "sign"
    weights,y_hat_array=main(learning_rate, y, X, activation_functions)
    score = score(y_hat_array, y)
    print(f"score:{score}, weights:{weights}, y_hat_array:{y_hat_array},y:{y}")
    print(score)
Why is my perceptron super inaccurate?
lapis sequoia
Hey guys
i have a question
Can custom haar features be made?
I'm a beginner in this stuff
And also
how does training and making custom haar cascade xml file work?
steady basalt
misty flint
why dont you just use any number of python visualization libraries instead
alot of companies literally demand DAs to use them software in the description and ask if you can use them
 hazy hamlet
Hey, are there any good guides on principal architecture and internal workings of Pandas and Numpy?
wooden sail
what do you mean by "internal workings"?
do you want to know how to use them, or really know how they work under the hood?
 grave token
    datagen = ImageDataGenerator(
    featurewise_center=True,
    featurewise_std_normalization=True,
    rotation_range=20,
    width_shift_range=0.2,
    height_shift_range=0.2,
    horizontal_flip=True,
    validation_split=0.2)

# ↓ ↓  Instead of ImageDataGenerator, I want to augment in the model ↓ ↓
resize_and_rescale = Sequential()
resize_and_rescale.add(Resizing(IMG_SIZE, IMG_SIZE))
resize_and_rescale.add(Rescaling(1.0/255))

data_augmentation = Sequential()
data_augmentation.add(RandomFlip("horizontal_and_vertical"))
data_augmentation.add(RandomRotation(0.2))

model = Sequential()
# Adding the preprocessing layers.
model.add(resize_and_rescale)
model.add(data_augmentation)
model.add(Conv2D())```Is this the right way?How do i perform Augmentation in the mdoel (not while preprocessing).
this way, when I save the model, the Augmentation layer will also be saved.
wooden sail
that wouldn't really be augmentation, though
grave token
wooden sail
that wouldn't really be augmentation, though
the main purpose is to remove overfitting.
wooden sail
is there any special reason you would do it this way though?
sure, during the training it behaves as augmentation. but then during inference, once it's trained, it means you never see the true data anymore
you're trying to infer on the data you randomly transform
doesn't make much sense tbh
grave token
wooden sail
you're trying to infer on the data you randomly transform
it should predict based on the input_image and not 5 of its copy right?
wooden sail
if you put the augmentation into the network, it will never see the images you feed into it
that also means if you later want to pass in a specific image, tough luck, you actually can't
you can only infer on whatever your network augments the actual image into
grave token
ImageDataGenerator```It uses GPU right?it can
grave token
then I guess Its better to separately augment the train_data.
wooden sail
note that augmentation never actually makes copies btw
grave token
wooden sail
note that augmentation never actually makes copies btw
I dont understand.
It just copies and applies transformations right? (from given parameters).
wooden sail
it doesn't copy
it takes the image and applies transformations to it as part of the pipeline
you can think of it as function composition
if your image is x and your network is N, inference is applying the function N to x, i.e. N(x)
when you augment, you apply an augmentation function A to x before passing it to N
N(A(x))
no copy every made, you just do extra operations
grave token
wooden sail
it takes the image and applies transformations to it as part of the pipeline
they do it for memory right?
wooden sail
as a pipeline, you can think of it as x -> A(x) -> N(A(x))
wooden sail
grave token
they do it for memory right?
memory and storage both
now the thing is, you want to remove A from the pipeline in production
so now you observe images y, and you do y -> N(y)
if you leave the augmentation there, then you see you get y -> A(y) -> N(A(y)), which means your network is not seeing the images you think it is seeing
it's also flipping, shearing, etc. whatever you put into your augmentation procedure
this isn't necessary and it makes testing difficult (well, there are cases where it does make sense, but i doubt this is one of them)
grave token
wooden sail
this isn't necessary and it makes testing difficult (well, there are cases where...
The non-augmented data i have makes the model overfit. The accuracy is high and the val_accuracy is low.
wooden sail
i'm not saying not to use augmentation, i'm saying to do it correctly 😛
don't make it part of the network, make it part of the training procedure
grave token
wooden sail
don't make it part of the network, make it part of the training procedure
alright...btw any advice if the input dataset size is low?
lets say 30 image per classes.
wooden sail
30 is kinda few, yeah. gonna need lots of augmentation, but it's always better to get more real data
grave token
wooden sail
30 is kinda few, yeah. gonna need lots of augmentation, but it's always better t...
The dataset is quite old, 64x64 image size, do you think higher image_pixel size will perform better?
wooden sail
upscaling can never yield new info, so it depends on the size of your target images
if the images are originally similarly sized, it's fine. images can usually tolerate some subsampling without losing too much info
especially if you do this in a well-chosen domain
should be fine for relatively large images, but if they get too large, higher res training data will be better
grave token
wooden sail
upscaling can never yield new info, so it depends on the size of your target ima...
ok... i will keep changing parameters for now... btw which model might perfrom best for hand gesture? (vgg16/resnet)?
grave token
np, everywhere i see, they run vgg16...gotta reasearch about it. 😅
 silk drum
Hi, new here..
is it okay if I ask a question regarding a coding problem in cs229 course by Andrew Ng?
wooden sail
i think so
misty flint
steady basalt
alot of companies literally demand DAs to use them software in the description a...
literally my next sentence addresses this
arctic wedgeBOT
Hey @silk drum!
It looks like you tried to attach a Python file - please use a code-pasting service such as https://paste.pythondiscord.com
wooden sail
do they not provide some code? sounds like they give you some code and you're supposed to import it
silk drum
This import is in the code they attached.
It says import util
And then use method util.load_dataset
somber sphinx
Hey there.
Does anyone know what is the usual minimum number of hidden layers in deep networks?
lapis sequoia
!code
arctic wedgeBOT
Here's how to format Python code on Discord:
```py
print('Hello world!')
```
These are backticks, not quotes. Check this out if you can't find the backtick key.
silk drum
lapis sequoia
!code
Sorry! New here
lapis sequoia
np!
steady basalt
misty flint
literally my next sentence addresses this
its a problem that u gotta pay for tableau tho in order to get comfortable with it as demanded by entry levle jobs
lucky i get it for free
somber sphinx
Hey there.
Does anyone know what is the usual minimum number of hidden layers in deep networks?
grave token
somber sphinx
Hey there.
Does anyone know what is the usual minimum number of hidden layers in...
From Google
The Number of Neurons in the Hidden Layers
The number of hidden neurons should be between the size of the input layer and the size of the output layer.
The number of hidden neurons should be 2/3 the size of the input layer, plus the size of the output layer.
misty flint
tableau public is free
steady basalt
misty flint
tableau public is free
huh, didnt know about that. differ alot from tablaue?
strong sedge
what is collinearity, why is it bad, how to detect it and remove it
from what I understood, collinearity is when 2 variable essentially explain the same thing, I didnt really understand why this may be bad ?
and how can 2 detect this ?
removal is trivial right (removing 1 of the collinear columns ?)
wooden sail
correlated variables are more difficult to estimate
when they're perfectly correlated, it's actually impossible to estimate them, too
cyan sierra
A follow up question:
Is it better to remove one of the collinear columns for all correlated features first and then do a permutation feature importance?
wooden sail
as a simple example, imagine you are given data that follows the model y = (a+b)x. you observe examples of x and y. it's fairly simply to estimate m = (a+b). but once you have m, it's impossible to find a and b separately
you can end up with an underdetermined system for which either there are infinitely many solutions, or none at all
wooden sail
cyan sierra
A follow up question:
Is it better to remove one of the collinear columns for al...
better than?
cyan sierra
better than just doing the second one
wooden sail
well, the idea is that you wanna figure out which parameters to remove, so it seems reasonable to check feature importance first
then you can repeat the test and see what changed
strong sedge
wooden sail
well, the idea is that you wanna figure out which parameters to remove, so it se...
I am super new to this
How exactly do you check/test for in columns multicollinearity
strong sedge
wooden sail
as a simple example, imagine you are given data that follows the model y = (a+b)...
Don't you need multiple columns for this ?
Or is this an example of perfect collinearity ?
wooden sail
.latex if you matricize the model, you'll see that it follows
[
\bm{y} = [\bm{x} ,, \bm{x}]
\begin{bmatrix}
a \ b
\end{bmatrix} ,
]
where the matrix $[\bm{x} ,, \bm{x}]$ has two identical columns and is therefore rank-deficient
 strange elbowBOT
 wooden sail
for the type of stuff i work with, matrix condition numbers are usually what is used. there are other tests depending on what you're doing
steady basalt
do PR curves usually have a spike at the start?
 brisk apex
I'm getting following exception:
java.lang.NoSuchMethodError: 'void com.google.common.base.Preconditions.checkArgument(boolean, java.lang.String, java.lang.Object, java.lang.Object)'
which, from google search, I need to do something with dependencies (in java you can just mess with dependency file or sbt for scala). How do you do that in python? This has something to do with guava. Would it be something like
spark-submit --package com.google.guava
``` this? Never imported package using spark submit so any help/tip would be appreciated. Thanks in advance.ahh, okok, I understand it a bit '
lapis sequoia
Hi. I was wondering if there's a way that I can get feature importances in prediction a specific label. Rather the the general feature importances we get based on train data from algorithms like decision trees.
iron basalt
wooden sail
sure, during the training it behaves as augmentation. but then during inference,...
@grave token Augmentation being part of a NN only really makes sense in the context of online learning which i'm assuming you are not doing (or you are trying to make an extreme learning machine or liquid state machine, etc (which is sort of already heading towards online learning)). And in that context the models are very different and work correctly with such live augmentation. Doing it in a non-online learning model is not giving what you think it gives (i'm guessing) compared to just doing it before feeding it to the model (learning pipeline). Also as Edd mentioned it makes testing difficult, which in online learning it already is, and there is no need to make offline learning more difficult to test as well.
(The worse testing is throwing away one of the main advantages of offline learning)
iron basalt
wooden sail
if the images are originally similarly sized, it's fine. images can usually tole...
@grave token About image scaling I thought I would just add that which image scaling you use matters a lot and switching to another can break your results. Unfortunately every library implements it differently (the supposedly same algorithms) as image scaling is more of a "it looks fine to me" than an exact science.
iron basalt
iron basalt
<@639893833039216650> About image scaling I thought I would just add that which ...
New models are not as affected by the switch in scaler (not typical DL), but most of the current results out there rely on a specific scaler, so if you want to compare, make sure the same scaling library is used (probably OpenCV).
 lusty dove
Hi guys, do you have any guide to install scikit in a raspberry pi?
serene scaffold
lusty dove
Hi guys, do you have any guide to install scikit in a raspberry pi?
raspberry pis run linux, yes? do you already have python (and pip) installed on it? it should be the same as installing anything else.