#data-science-and-ml
1 messages · Page 11 of 1
 steady basalt
 rain horizon
Ok, so it looks like that worked, now it is telling me accuracy_score is not defined. So what sort of metric should I use for Regressor? If you don't know I can do some digging
steady basalt
Try using an error
rain horizon
Like RMSE?
steady basalt
Maybe use sklearn metrics
Yeah something like rmse
You imported metrics but you didn’t specifics accuracy score comes from metrics
So u can say from metrics import this that and the other
And they will then work as functions
If you don’t u need to still say metrics.accuracy
rain horizon
Thank you so much for helping!
 rain horizon
Lol definitely helped me figure out a week+ long problem! Now I just need to figure out how to properly tune this stupid model. These things give me a headache
 fringe turtle
is there a good book or resource on python web scraping with apis
I am trying to use Walmart/Amazon api for placing orders and getting product data.
Just trying to read up on some best practices before I start the project
steady basalt
rain horizon
Lol definitely helped me figure out a week+ long problem! Now I just need to fig...
We all start somewhere. Try looking into halving grid search to save yourself some time
 iron basalt
Both rooms are correct as improving upon those kinds of search algorithms for games leads one toward current ML methods.
It's also a classic algorithm / it's at the border.
This is also a DS/ML/AI room. And it counts as classic style AI (forward planning with an exact known model).
It could even have been asked in the game dev channel. It kind of matches all of them.
steady basalt
True..
 serene scaffold
By the power vested in me by lemon, I declare that that question was on-topic for this channel. We can now permanently put the question about its topicness to rest.
steady basalt
serene scaffold
By the power vested in me by lemon, I declare that that question was on-topic fo...

better than the previous one
 earnest widget
I am trying to create a model using Keras with the Functional API but I get this error:
ValueError: Operands could not be broadcast together with shapes (56, 56, 32) (112, 112, 32)
My model: https://hastebin.com/pirorukuma.ini
Hastebin is a free web-based pastebin service for storing and sharing text and code snippets with anyone. Get started now.
I get the error for this line:
block_2 = Add()([x, block_1])
 brave sand
does anyone have any experience with creating environments?
 lapis sequoia

GitHub
implementation of stable diffusion with klms + diffusers - GitHub - merasu/stable-diffusion-klms: implementation of stable diffusion with klms + diffusers
 agile cobalt
(for context: https://stability.ai/blog/stable-diffusion-public-release)
 ebon hazel
model.add(Conv2D(64,kernel_size = (5,5).activation == "relu".input_shape == (150,150,3)))
model.add(MaxPooling2D(pool_size = (2,2)))
model.add(Conv2D(128,kernel_size = (5,5).activation == "relu"))
model.add(MaxPooling2D(pool_size = (2,2)))
model.add(Conv2D(128,kernel_size = (5,5).activation == "relu"))
model.add(MaxPooling2D(pool_size = (2,2)))
model.add(Flatten())
model.add(Dense(256,activation = "relu"))
model,add(Dense(1,activation = "sigmooid"))

in <module>
    model.add(Conv2D(64,kernel_size = (5,5).activation == "relu".input_shape == (150,150,3)))
AttributeError: 'tuple' object has no attribute 'activation'
I attached the .activation to it but it doesn't want to register for some reason
what am I missing?
I can post more of the code if need be
this ones my fault, I put . instead of ,
lapis sequoia
random seeds not working for now neither batches past 1 but everything else does (above vid is old formatting)
agile cobalt
I think that it uses 42 instead of generating a random seed if you do not set it? (saw something like that in a github issue/pr or something in the huggingface community, not sure what exactly it was)
you can just set it to a random value yourself though
lapis sequoia
yep random.org
 velvet birch
Why do we always try to have normally distributed data during model building?
 wooden sail
that doesn't sound right. normally distributed data is nice to work with, but your model should be built using all the info you have on your data. if the data follows a different distribution, your model (and especially the cost function) should reflect that
 tacit basin
brave sand
does anyone have any experience with creating environments?
tacit basin
brave sand
does anyone have any experience with creating environments?
with conda yes 🙂
 quaint loom
Is there anyone who have the time to help me? : )
wooden sail
your question is too broad and general. if you ask specific questions, surely someone will help out
quaint loom
wooden sail
your question is too broad and general. if you ask specific questions, surely so...
Thanks. I guessed more information would help and make it more clear
 barren snow
Would anyone be able to explain what the Gaussian mixture model refers to, if it is not in the middle?

Thanks
 shell crest
Are you asking if what you plotted is a GMM?
barren snow
No, it's a gmm now
shell crest
Uhh what>?
barren snow
shell crest
Are you asking if what you plotted is a GMM?
Sorry, what do u mean?
shell crest
I have no idea what you are trying to ask
 shell crest
barren snow
shell crest
barren snow
What is the relevance to this?
barren snow
Oh, Gaussian distribution, I mean
shell crest
What are you trying to ask?
 shell crest
This is not going anywhere, so I guess I should not respond.
velvet birch
shell crest
This is not going anywhere, so I guess I should not respond.
They are probably not fluent in English
wooden sail
barren snow
same as always. normal distributions have a mean and a variance. if you change the mean, it moves to the left or right on the axis
wooden sail
barren snow
it's on this plot you shared yourself, too. the value of mu is the mean of the distribution and corresponds to a horizontal offset
barren snow
barren snow
Thanks Edd! So this one means the mean is high?
wooden sail
"high" depends on your data and application. i'd just say "close to 1"
barren snow
Got it! BTW, Is it necessary to set x.slim in a specific range
something like between -2.5 and 2.5
wooden sail
if you like
barren snow
and the distribution will be in the middle
shell crest
Showing if the distribution is in the middle is not a requirement (unless your course/decision maker demands it), but it does make sense to have more of the distribution you are showing take up more of the relevant space, as the space for x<-1 has no data and it would not make sense to graph them
brave sand
how would I approach creating an environment like OpenAI?
barren snow
Thanks too! Yes x doesn't have negative value.
I have one more Qs, hope someone could answer it. A quick one, i think
I am looking for this document. But I don't know what''s the meaning of mean and cov in two dimension. I thought they have just one dimension.
 wooden sail
in a multivariate gaussian, the mean is a vector and the covariance is a symmetric matrix
the PDF describes a random vector
in this example, they use a random vector with 2 entries, and this vector follows a bivariate gaussian dist
moreover, the mean of each of the 2 variables is 0, and the covariance tells you the variables are uncorrelated (the covariance terms on the off-diagonal are 0)
the elements on the diagonal are then the variance of each of the 2 variables (1 and 100)
barren snow
Thanks for explaining! I appreciate it
 versed gulch
Hi is there a python version of using 3D filtering using ellipsoidal neighborhood, on 3D images which is the same as ImageJ https://imagej.net/plugins/3d-imagej-suite/filters ?

ImageJ Wiki
The ImageJ wiki is a community-edited knowledge base on topics relating to ImageJ, a public domain program for processing and analyzing scientific images, and its ecosystem of derivatives and variants, including ImageJ2, Fiji, and others.
 fiery dust
yesterday I was thinking. Is it possible to create a bot that creates songs for you? lyrics lr the song (mp3) itself. so you give the bot for example 500 lyrics and 500 audios from a music genre and then the bot tries to create lyrics/songs off that. Obviously it should rhyme
 proven bobcat
quaint loom
proven bobcat
quaint loom
Can someone help me explain how I plot different elements in Jupyter Notebook?
 slim lark
can someone walk me through comparing two sentences in NLP? I need help understanding which value to retrieve after I have trained the model. I want to:
- provide two sentences to the model
- display 1 if the sentences match
- display 0 if the sentences do not match
serene scaffold
slim lark
can someone walk me through comparing two sentences in NLP? I need help understa...
in what way are you comparing them?
semantic similarity ("the sentences are basically saying the same thing") is usually calculated by making embedded representations of each sentence (which returns two vectors) and calculating their cosine similarity.
also what's this about displaying 1 and 0? this isn't C 😄
slim lark
serene scaffold
also what's this about displaying 1 and 0? this isn't C 😄
lmao just an example, 1 or 0 would be replaced by it's a match, or it's not a match!
slim lark
serene scaffold
semantic similarity ("the sentences are basically saying the same thing") is usu...
okay, how do I do that?
 spare briar
fiery dust
yesterday I was thinking. Is it possible to create a bot that creates songs for ...
spare briar
fiery dust
yesterday I was thinking. Is it possible to create a bot that creates songs for ...
yes you would want a generative model of the joint distribution of text and audio. This problem area is called ‘multimodal generation’. This is not so far from models like dalle or flamingo (which do images + text). I’m not aware of a model doing exactly what you describe but check out https://openai.com/blog/jukebox/, https://www.deepmind.com/blog/tackling-multiple-tasks-with-a-single-visual-language-model, https://openai.com/dall-e-2/, https://arxiv.org/abs/2103.03206

arXiv.org
Biological systems perceive the world by simultaneously processing
high-dimensional inputs from modalities as diverse as vision, audition, touch,
proprioception, etc. The perception models used in...
serene scaffold
slim lark
okay, how do I do that?
there are libraries that do it. but the only way to get a "match" is if the two sentences are literally exactly the same, at which point you should just use str_a == str_b
slim lark
serene scaffold
there are libraries that do it. but the only way to get a "match" is if the two ...
so obtain the vector embedding by reading the data, store it in an array, compare this with another sentence whose embeddings are stored in another array.
serene scaffold
slim lark
so obtain the vector embedding by reading the data, store it in an array, compar...
a vector is a one-dimensional array.
there are libraries that will do the whole thing. you need a model that has already been trained to create the embeddings.
Medium
Sentence similarity using transformer models like BERT is incredibly easy to implement. We'll learn how (in Python), and exactly why it works so well.
slim lark
serene scaffold
try reading this https://towardsdatascience.com/bert-for-measuring-text-similari...
oh yeah, I've heard of BERT. It seems a little complicated to me im ngl
serene scaffold
this is one of the first towards data science articles I've ever seen that isn't making my eyes bleed
serene scaffold
slim lark
oh yeah, I've heard of BERT. It seems a little complicated to me im ngl
you can know literally nothing about bert except "sentence string goes in, vector comes out"
you don't need to know what the vector has to do with the sentence.
but suffice to say that semantically similar sentences will have shorter cosine distances to eachother when represented with BERT embeddings.
this diagram is describing some really sophisticated shit. if you want to be a professional/academic NLP person, you will eventually need to understand it. but you don't need to right now.
 slim lark
serene scaffold
this diagram is describing some really sophisticated shit. if you want to be a p...
slim lark
serene scaffold
this diagram is describing some really sophisticated shit. if you want to be a p...
funnily it makes some sense
serene scaffold
slim lark
funnily it makes some sense
great 
slim lark
slim lark
funnily it makes some sense
words are assigned values based on their position? Then they're fed to a bunch of circuits that generate numbers from these tokens, based on certain mysterious criteria. We get a bunch of values in a matrix as output
serene scaffold
slim lark
words are assigned values based on their position? Then they're fed to a bunch o...
it ultimately doesn't have to do with their position
fiery dust
spare briar
yes you would want a generative model of the joint distribution of text and audi...
tysm!!!!!
 blissful perch
Hello, I'm a college student and I took up a course in artificial intelligence and machine learning. I still have a few weeks before college starts and I wish to spend it usefully. I've been wondering if I could start learning stuff about AI&ML early. Any good places to start? I know python, SQL and a few more.
wooden sail
you can review your linear algebra and multivar statistics
serene scaffold
blissful perch
Hello, I'm a college student and I took up a course in artificial intelligence a...


steady basalt
wooden sail
you can review your linear algebra and multivar statistics
c-calculus?
wooden sail
familiarity with gradients and hessians, sure, but that's the sort of stuff that is reviewed early on in an ML course
funnily enough the linalg and stats aren't reviewed, but are more important in day to day ML than calculus is, since that can be largely relegated to automatic differentiation
 worn stratus
steady basalt
c-calculus?
worn stratus
steady basalt
c-calculus?
Didn't you say you were studying for a masters in this stuff?
steady basalt
worn stratus
Didn't you say you were studying for a masters in this stuff?
almost finished now, got my grades for all modules just got a theiss
thesis*
worn stratus
steady basalt
almost finished now, got my grades for all modules just got a theiss
I'm curious - do you mind saying what university you studied at?
blissful perch
wooden sail
you can review your linear algebra and multivar statistics
I do know a bit of high school level linear algebra.
steady basalt
worn stratus
I'm curious - do you mind saying what university you studied at?
I do mind
blissful perch
wooden sail
familiarity with gradients and hessians, sure, but that's the sort of stuff that...
Uhm, that's a lot of take in. I'll take a look into it! Thanks a lot!
wooden sail
blissful perch
Uhm, that's a lot of take in. I'll take a look into it! Thanks a lot!
from linalg, you want vector spaces, vector norms, and if possible, induced norms. you might also wanna review the definition of "linear transformation" and understand why Ax + b is not linear, but Ax is (with A a matrix and x and b vectors)
as for stats, review your joint probability density functions, expected values, variance, covariance matrices, and correlation
likelihood functions too
steady basalt
blissful perch
Uhm, that's a lot of take in. I'll take a look into it! Thanks a lot!
also mid way through a simila rlevel of calculus should bring you to where u want to be (and its the only fun area of mathematics), but edds right in that its probably more important to study linalg and stats
i personally just find linalg rly boring and have put it on pause for now
wooden sail
the thing is that calc is very much like high school maths in flavor. you're given a recipe and you follow it (though integrals do have super clever tricks)
blissful perch
steady basalt
also mid way through a simila rlevel of calculus should bring you to where u wan...
i uhm. I'm just starting out. I don't really know what rlevel means. I'm sorry 😓
steady basalt
wooden sail
the thing is that calc is very much like high school maths in flavor. you're giv...
depends how and where you learn
from a text book you can read into what things are actually doing rather than copy paste method
wooden sail
linalg is one of the first maths where you have to deal with formal proofs, and statistics is just a whole thing of its own
wooden sail
steady basalt
from a text book you can read into what things are actually doing rather than co...
this can't be done in full until you take real analysis, sadly
linalg is pretty selfcontained, in contrast
steady basalt
wooden sail
this can't be done in full until you take real analysis, sadly
looking at that analysis book, im at least 2 years away from such proofs
even the basics tbh
steady basalt
I got through page 1 though of why adding numbers in any order works ; )
wooden sail
those 2 courses are very similar in flavor
blissful perch
wooden sail
linalg is one of the first maths where you have to deal with formal proofs, and ...
Oh yeah. I think my prof mentioned that once. I'm currently taking bridge courses where they would tell me the basic outlines of the AI and so on.
steady basalt
i think theres no need to worry about much past that though for applied ml, esapecially if you avoid books which are literally just recap for experts that only provide equations
 leaden tusk
Hey guys, I am thinking about learning machine learning, and humble bundle got this 25 books deal for 17 euros. Are they any good, and if so at what order should I approach these books

Humble Bundle
We’ve teamed up with Packt for our newest bundle. Get books like The Machine Learning Solutions Architect Handbook & Transformers for Natural Language Processing. Plus, pay what you want & support charity!
 arctic cliff
Is there a built-in model for Logistic regression in pytorch?
lapis sequoia
anyone know off hand what command + s does in a jupyter notebook in vscode?
i keep hitting it by accident
arctic cliff
lapis sequoia
anyone know off hand what command + s does in a jupyter notebook in vscode?
Save and checkpoint
arctic cliff
lapis sequoia
i keep hitting it by accident
I think it's a good habit :)
lapis sequoia
wish it didnt jump around when i did it
steady basalt
arctic cliff
Is there a built-in model for Logistic regression in pytorch?
pytorch is for neural nets
i recommend you sklearn
arctic cliff
steady basalt
i recommend you sklearn
Thanks for your recommendation!
I think I will check on the difference between their usage because I genuinely thought they were the same
lapis sequoia
why this warning here.

df2["Type"] can't be a copy
{'Id': ['77707777', '77717777', '77727777', '77737777', '77747777'], 'Job Title': ['Lead CRA UK', 'Possession Manager', 'NVQ Assessor Banking/Financial Services Salary to **** Car Allowa', 'HEAD OF CARE (RGN/RMN) Poole', 'SQL Server DBA'], 'Location': ['Berkshire', 'Bristol', 'Coventry', 'Poole', 'Woking'], 'Organisation': ['SEC Recruitment', 'Navartis Limited', 'Pertemps', 'Team 24 Ltd', 'Matchtech'], 'Full-Time Equivalent (FTE)': [1.0, 1.0, 1.0, 1.0, 1.0], 'Type': ['non-specified', 'permanent', 'permanent', 'non-specified', 'non-specified'], 'Category': ['Health', 'Engineering', 'Hospitality', 'Health', 'Information Technology'], 'Monthly Payment': [54999.96, 33750.0, 21500.04, 35000.04, 37500.0], 'Opening': [Timestamp('2012-01-08 12:00:00'), Timestamp('2013-08-07 12:00:00'), Timestamp('2013-02-01 00:00:00'), Timestamp('2013-07-26 15:00:00'), Timestamp('2012-11-21 12:00:00')], 'Closing': [Timestamp('2012-03-08 12:00:00'), Timestamp('2013-09-06 12:00:00'), Timestamp('2013-05-02 00:00:00'), Timestamp('2013-09-24 15:00:00'), Timestamp('2012-12-21 12:00:00')]} In case someone wants it
serene scaffold
lapis sequoia
why this warning here.
can you just do print(df2['Type'].head()) before that line runs?
in either case, try using replace instead of map
lapis sequoia
serene scaffold
can you just do `print(df2['Type'].head())` *before* that line runs?
No. Tht line has already ran 
serene scaffold
lapis sequoia
No. Tht line has already ran <:lemon_angrysad:817323592693841961>
if you can't/don't want to "rewind", then what difference does eliminating the warning make?
 untold bloom
warning implies you generated df2 as a subset of another dataframe
but didn't explicitly say you were requesting a copy (assuming that was the intention)
lapis sequoia
ah
untold bloom
e.g., you did df2 = some_other_frame[...]
untold bloom
at this point it's not 100% clear if df2 is a view or a copy
lapis sequoia
i did df2=df2[[cols]]
untold bloom
you can chain .copy() there
untold bloom
indeed but it's not clever enough to figure that out apparently
false positive in this case...
lapis sequoia
do I add copy before. like df2.copy()[cols]
untold bloom
after rather
lapis sequoia
or df2[cols].copy() will work too?
untold bloom
df2 = df2[cols].copy() or equivalently df2 = df2.filter(cols)
(.filter is a specific solution in your case)
steady basalt
arctic cliff
Thanks for your recommendation!
I think I will check on the difference between ...
You can use PyTorch to build neural networks tailor made to your problem, with sklearn you have prebuilt functions which are implementations of statistical models, does your task require something specifically?
Iirc you said regression. Just use sklearn for now
Unless it’s time series maybe…
arctic cliff
steady basalt
You can use PyTorch to build neural networks tailor made to your problem, with s...
I am currently learning the theory behind Deep learning and I find myself in need to apply what I've learned
But as you know linear models are the very basic models, so I found myself a nice dataset to play with and apply what I have learned but I need to apply Logistic regression and I didn't know that it's not part of deep learning specifically
Well, For now I am trying to apply binary classification in general
steady basalt
arctic cliff
I am currently learning the theory behind Deep learning and I find myself in nee...
Deep learning is deep with layers of nodes in neural networks
Logistic regression is not deep learning it’s logistic
For example, you wouldn’t consider linear regression a deep learning structure, or binary tree
You learn the theory behind neural networks yeah?
Did you learn the theory behind logistic regression too?
 potent field
Anyone know a good place to start with AI ? Anything will help(including but not limited to udemy courses YouTube channels and books)
wooden sail
steady basalt
Logistic regression is not deep learning it’s logistic
how deep is deep for you? you can make a single layer network that exactly matches logistic regression
steady basalt
wooden sail
how deep is deep for you? you can make a single layer network that exactly match...
Deep learning was coined as a new buzz term to revitalise interest in neural networks
It’s not really useful to argue to someone who’s new that logistic regression is the same as deep learning
wooden sail
you're the one using the term though, that's why i'm asking you 😛
steady basalt
I think it’s best they learn both in terms of theory
arctic cliff
steady basalt
It’s not really useful to argue to someone who’s new that logistic regression is...
This doesn't sound pretty nice
steady basalt
arctic cliff
This doesn't sound pretty nice
what edd said is technically correct in that you can achieve logistic regression with a single layer neural network, but you probably wont find logistic regression taught in detail in basic deep learning videos
thats why id recommend you study it independently as a concept
arctic cliff
Oh!
steady basalt
unless this course is asking you to apply it in pytorch as a way to learn the code? then sure but otherwise its way easier to use sklearns logistic or whatever stats package you have
they make it easier than coding it up as a neural network lol..
so yeah definitely try not to get confused when youre new to deep learning in that logistic is a deep learning technique or something, it is its own thing thats been around before neural nets i think
arctic cliff
steady basalt
Did you learn the theory behind logistic regression too?
I know that logistic regressions may require an activation function like Relu but the model itself can be a linear model since it falls under the linear equation subject
I have learned some loss functions that work well like log loss and some other that work but aren't the best for such model
steady basalt
https://en.wikipedia.org/wiki/Logistic_regression as you can see its not as simple as it seems

In statistics, the (binary) logistic model (or logit model) is a statistical model that models the probability of one event (out of two alternatives) taking place by having the log-odds (the logarithm of the odds) for the event be a linear combination of one or more independent variables ("predictors"). In regression analysis, logistic regressio...
steady basalt
arctic cliff
I know that logistic regressions may require an activation function like Relu bu...
activation functions in that sense are for neural networks, logistic uses the sigmoid function
arctic cliff
Don't sigmoid return 0 or a higher number but less than 1?
steady basalt
anyway id recommend you to read on logistic regression
steady basalt
yeah sigmoid limit is 0 and 1
arctic cliff
Will surely do!
steady basalt
classification is kinda different and depends on probabilities that you see in logit
im personally more experienced with LR in inference and not ML but its not much further in concept
steady basalt
arctic cliff
Don't sigmoid return 0 or a higher number but less than 1?
the y axis between 0,1
arctic cliff
Will probably ping you again after I read about it and have further questions xD
I appreciate your collaboration!
steady basalt
arctic cliff
Will probably ping you again after I read about it and have further questions xD...
arctic cliff
Thanks!
 bold timber
can we use different activation function in the output layer between encoder and decoder in autoencoder?
brave sand
how can I edit this code to add control to the enemy team? do I create a defenderStep function?
https://hastebin.com/feporojema.properties
Above is my code right now
https://hastebin.com/recalahuki.properties
this is what I'm using to test it
Hastebin is a free web-based pastebin service for storing and sharing text and code snippets with anyone. Get started now.
Hastebin is a free web-based pastebin service for storing and sharing text and code snippets with anyone. Get started now.
arctic cliff
steady basalt
http://faculty.cas.usf.edu/mbrannick/regression/Logistic.html
I think I am not ready for that yet :D
I didn't understand a lot of mathematical concepts
Hope It's not a big deal to delay it until I am ready
 fair moss
Hello
 lone halo
high performance computing
 modest juniper
Does numpy/sympy allow for using matrix multiplication with symbols somehow
the documentations I studied didn't mention anything except maybe substituting the diagonal entries with a symbol of my liking
 velvet turtle
modest juniper
Does numpy/sympy allow for using matrix multiplication with symbols somehow
velvet turtle
modest juniper
Does numpy/sympy allow for using matrix multiplication with symbols somehow
try using @ sign
modest juniper
in sympy?
velvet turtle
numpy
serene scaffold
modest juniper
Does numpy/sympy allow for using matrix multiplication with symbols somehow
numpy lets you do it with the @ operator. which was added to python (the whole language) specifically for that
idk what other libraries have adopted it.
velvet turtle

modest juniper
I am not looking for just a matrix multiplication operator
I am looking for something that lets me define matrices with symbols inside it + lets me manipulate them e.g. M = [[2, 2, a], [1, b, c]] rather than something with just numbers
serene scaffold
I think that would fall under sympy
 tidal bough
modest juniper
I am looking for something that lets me define matrices with symbols inside it +...
tidal bough
modest juniper
I am looking for something that lets me define matrices with symbols inside it +...
e.g
import sympy
a,b,c,d = sympy.symbols("a b c d")
mat = sympy.Matrix([[a,b],[c,d]])
mat.det() # ad−bc

 worthy hollow
hey guys!
So I made this simple function/for loop for some calculation, it worked fine for some part of codes```py
cum = helio_cum.copy()
def mod360(df, date):
return pd.DataFrame(
{
"Date": [date],
"Earth": (df["Earth"] % 360),
"Mer": (df['Mer'] % 360),
"Ven": (df['Ven'] % 360),
"Mar": (df['Mar'] % 360),
"Jup": (df['Jup'] % 360),
"Sat": (df['Sat'] % 360),
"Ura": (df['Ura'] % 360),
"Nep": (df['Nep'] % 360),
"Plu": (df['Plu'] % 360),
}
)
def rev360(df, date):
return pd.DataFrame(
{
"Date": [date],
"Earth": (df['Earth'] / 360),
"Mer": (df['Mer'] / 360),
"Ven": (df['Ven'] / 360),
"Mar": (df['Mar'] / 360),
"Jup": (df['Jup'] / 360),
"Sat": (df['Sat'] / 360),
"Ura": (df['Ura'] / 360),
"Nep": (df['Nep'] / 360),
"Plu": (df['Plu'] / 360),
}
)
mod360_dfs = []
rev360_dfs = []
data = [
(cumulative_1, '31/10/2008'),
(cumulative_2, '03/01/2009'),
(cumulative_3, '22/05/2010'),
(cumulative_4, '29/11/2013'),
(cumulative_5, '17/12/2017'),
(cumulative_6, '15/12/2018'),
(cumulative_7, '26/06/2019'),
(cumulative_8, '12/03/2020'),
(cumulative_9, '25/04/2021'),
(cumulative_10, '20/07/2021'),
(cumulative_11, '20/10/2021'),
(cumulative_12, '10/11/2021'),
(cumulative_13, '18/06/2022'),
]
for i, (df, date) in enumerate(data):
mod360_dfs.append(mod360(df, date))
for i, (df, date) in enumerate(data):
rev360_dfs.append(rev360(df, date))
rev360_dfs = pd.concat(rev360_dfs)
mod360_dfs = pd.concat(mod360_dfs)
ROUNDDOWN
rev360_dfs = rev360_dfs.iloc[::, rev360_dfs.columns !='Date'].apply(np.floor)
mod360_dfs = mod360_dfs.iloc[::, mod360_dfs.columns !='Date'].apply(np.floor)
rev360_dfs
** but here when i try to apply it on this part of the code,, this error keep popping up:** py
ValueError Traceback (most recent call last)
~\AppData\Local\Temp/ipykernel_2108/773637674.py in <module>
53
54 for i, (df, date) in enumerate(data):
---> 55 mod360_dfs.append(mod360(df, date))
56
57 for i, (df, date) in enumerate(data):
ValueError: array length 1 does not match index length 34422```
idk why mod360 & rev360 doesnt get filled with data - i mean i clearly see it's an array length problem but i've been struggling to overcome it

 vast goblet
Hello, I have pharmacy dataset, my goal is to find patterns between medicines.
So I've made them like transactions dataset, to use association rules algorithms.
The problem here the min.supp is way too low it's (0.0001 ), am I doing something wrong?
I've 59k transactions, do I choose some of the transactions or all transactions are fine?
shell crest
@serene plume Numpy-only cosine similarity
https://stackoverflow.com/questions/41905029/create-cosine-similarity-matrix-numpy
If you need that efficiency, this could be better.

Stack Overflow
Suppose I have a numpy matrix like the following:
array([array([ 0.0072427 , 0.00669255, 0.00785213, 0.00845336, 0.01042869]),
array([ 0.00710799, 0.00668831, 0.00772334, 0.00777796, 0.
lapis sequoia
worthy hollow
hey guys!
I'm sorry, what exactly are you trying to do here? I think we may tell you a simpler way.
dfs don't work this way.
 serene plume
shell crest
<@458440277548335125> Numpy-only cosine similarity
https://stackoverflow.com/que...
serene plume
shell crest
<@458440277548335125> Numpy-only cosine similarity
https://stackoverflow.com/que...
That looks like a specialized case for cosine similarity between m and itself, but not for a m and n iiuc?
worthy hollow
ok nvm fixed it thx
shell crest
serene plume
That looks like a specialized case for cosine similarity between `m` and itself,...
You can row-normalise each of m, n separately instead then take @
worthy hollow
using pd.concat I managed to put it all together
hddel = pd.concat([result, mod0, cumm_hel, puant], join='inner')
hddel
but HOW can i have something that display

the "cumm_hel" and "puant" df --- We needs to have one data after another, say: cumm_hel[1] : puant[1] - then - cumm_hel[2] : puant[2] - etc....
This should show the values of "cumm_hel" and "puant" which have the same date, one after the other
serene plume
shell crest
You can row-normalise each of `m`, `n` separately instead then take `@`
Like this?
d = u @ v.T

l2_norm_u = (u * u).sum(axis=0, keepdims=True) ** .5
l2_norm_v = (v * v).sum(axis=0, keepdims=True) ** .5
l2_norm = l2_norm_u @ l2_norm_v.T

result = d / l2_norm
No 1's on the diagonal when u == v, so I did it wrong 😕
shell crest
Uhh doesn't seem right
If you look at the cosine similarity formula, it is literally just 2 unit vectors being dot producted
serene plume
@shell crest The numerator is my d = u @ v.T
In the denom, I row-normalize u and v separately then dotproduct them together, like ||A||.||B||...what am I missing

The formula pertains to vectors
I'm trying to extend its application to two matrices u and v, where it's just a repeat of that formula across matrix rows/columns
wooden sail
note that matrix multiplication is already an extension of this
when you multiply two matrices AB = C, each element in the resulting matrix C can be expressed as the product of a row of A times a column of B, which is identical to a dot product
that means if you normalize the columns of B and the rows of A, then the elements of AB already obey the cauchy schwarz inequality
serene plume
I...think I got it from that. I'll try implementing it right this time 🙂
wooden sail
then if you want to take the similarity among the columns of a matrix, you need only do
In [7]: import numpy as np

In [8]: A = np.random.normal(size=(5,5))

In [9]: A = A/np.linalg.norm(A, axis=0)

In [10]: A.T.dot(A)
Out[10]:
array([[ 1.        , -0.59382266, -0.13506767, -0.34836878, -0.2178968 ],
       [-0.59382266,  1.        , -0.14013589,  0.76003049, -0.34757884],
       [-0.13506767, -0.14013589,  1.        , -0.38028347, -0.50574618],
       [-0.34836878,  0.76003049, -0.38028347,  1.        , -0.19470134],
       [-0.2178968 , -0.34757884, -0.50574618, -0.19470134,  1.        ]])
 cyan sierra
Hi everyone. I am wondering in sklearn OneHotEncoder, what is sparse = True? And what is the difference between sparse = True and False? I tried and I don't see any difference.
tidal bough
https://scikit-learn.org/stable/modules/generated/sklearn.preprocessing.OneHotEncoder.html
sparse bool, default=True
Will return sparse matrix if set True else will return an array.
the type of the returned matrix should differ.
scikit-learn
Examples using sklearn.preprocessing.OneHotEncoder: Release Highlights for scikit-learn 1.1 Release Highlights for scikit-learn 1.1 Release Highlights for scikit-learn 1.0 Release Highlights for sc...
cyan sierra
tidal bough
https://scikit-learn.org/stable/modules/generated/sklearn.preprocessing.OneHotEn...
I read the docs as well before asking but it doesn't make any difference.
What is the use of a sparse matrix?
tidal bough
cyan sierra
I read the docs as well before asking but it doesn't make any difference.
What i...
They store and handle only the nonzero elements. This can be a massive difference in memory and performance if you have a very big but very sparse matrix.
Consider having a 1 million by 1 million matrix, but with only a million nonzero elements. A dense representation would use (let's say 8 bytes per element) 8 * 10^6 * 10^6 = 8*10^12 = 8 terabytes of RAM to store it, which you likely don't have. A sparse representation will use more than 8 bytes per element, realistically at least 3-4 times more - but only on the nonzero elements, for a memory usage of around 8 * 10^6 * 4 = 32 megabytes. Quite the difference.
cyan sierra
tidal bough
They store and handle only the nonzero elements. This can be a massive differenc...
Amazing, thanks!
shell crest
>>> from scipy.sparse import coo_array
>>> from numpy import array
>>> row  = np.array([0, 3, 1, 0, 6, 8])
>>> col  = np.array([0, 3, 1, 2, 4, 2])
>>> data = np.array([4, 5, 7, 9, 1, 1])
>>> x = coo_array((data, (row, col)), shape=(40, 40))
>>> print(x.data.nbytes)
24
>>> y = x.toarray()
>>> print(y.nbytes)
6400
The sparse matrix of 6 non-zero elements takes 24 bytes, while the full array takes 6400
tidal bough
technically you only measured the data part here, I think, and not the other two arrays - so it's 72 bytes
iron basalt
cyan sierra
Amazing, thanks!
For the speed difference you can imagine a one-hot vector dot product with another vector. Most of the products are zero and contribute nothing to the sum, so they can be skipped. If the one-hot is stored in a sparse way then there is only 1 multiplication done, O(n) -> O(1).
A binary one-hot vector can be represented with a two numbers, the number of dimensions and the index of the 1.
shell crest
tidal bough
technically you only measured the `data` part here, I think, and not the other t...
Oh yeah, 3x I suppose.
I should also have spread the numbers more evenly around it which is how an actual sparse input could be like
serene plume
wooden sail
that means if you normalize the columns of B and the rows of A, then the element...
norm_u = u / norm(u, axis=0)
norm_v = v / norm(v, axis=0)
new = norm_u @ norm_v.T
Still not getting a diagonal of 1s when u==v so that's wrong...
I normalized the rows of u, then normalized the rows of v and transposed v which means it has normalized columns
shell crest
Remember what I said about mixing up matrix and column-vector norms?
shell crest
serene plume
Like this?
```py
d = u @ v.T
l2_norm_u = (u * u).sum(axis=0, keepdims=True) ** ...
This is closer to what you need
serene plume
shell crest
This is closer to what you need
norm_u = u / (np.square(u).sum(axis=0) ** .5)
norm_v = v / (np.square(v).sum(axis=0) ** .5)
new = norm_u @ norm_v.T
Also no. Feels like I'm just going around in circles at this point. I'll take a walk
 dusty valve
serene plume
```py
norm_u = u / (np.square(u).sum(axis=0) ** .5)
norm_v = v / (np.square(v).s...
dusty valve
serene plume
```py
norm_u = u / (np.square(u).sum(axis=0) ** .5)
norm_v = v / (np.square(v).s...
Take a walk in a roundabout
serene plume
... 🥲
lapis sequoia
is there a particular reason this keras example im reading:
np.array([[1.0], [2.0]], dtype=np.float32)
changes the type to float32?
serene plume
Sigh, that walk worked.
u /= (u**2).sum(axis=1, keepdims=True) ** .5
v /= (v**2).sum(axis=1, keepdims=True) ** .5
result = u @ v.T
I wasn't summing along the right axis before
@shell crest I was sure it was a supposed to be row sums, which is why I was summing across axis=0, but this apparently worked with axis=1 😕
wooden sail
lapis sequoia
is there a particular reason this keras example im reading:
`np.array([[1.0], [2...
cuz gpus like them better. float 32 is the usual float size and 64 is a double. numpy like everytging being a double, but gpus often use 32 orr 16 bit floats. lets you do more in parallel due to memory and speed
serene plume
Does axis 0 refer to rows or columns in numpy?
 mild dirge
rows
lapis sequoia
wooden sail
cuz gpus like them better. float 32 is the usual float size and 64 is a double. ...
ah I see very good thanks
serene plume
!e
import numpy as np

print(np.sum([[0, 1], [0, 5]], axis=0))
 arctic wedgeBOT
@serene plume :white_check_mark: Your 3.11 eval job has completed with return code 0.
[0 6]
I visualize that matrix as
0  1
0  5
So summing along axis=0 i.e. rows, I was expecting [1 5]
What's wrong in my mental model? Should I see them as column vectors instead?
mild dirge
You "sum over the rows"
Like summing the top two rows, and then summing the result of that with the next row, etc.
Summing over rows thus means you are left with 1 row
serene plume
...Not following
iron basalt
>>> x = np.array([[0, 1], [0, 5]])
>>> x
array([[0, 1],
       [0, 5]])
>>>
Summing over rows means 0 + 1 then 0 + 5 to me, because those are the rows
mild dirge
You aren't summing the elements of each row separately
You are adding the rows together
iron basalt
The first axis is rows, you are summing along that given axis.
serene plume
Ohhh
That is so counterintuitive
At least to my intuition
axis=0 goes over the rows in a way that is really reducing over each column 🤦♂️
mild dirge
It really is not, it also makes more sense in 3d and 4d case
You can also sum over multiple axes
Like summing over rows and columns
earnest widget
Can someone help me understand why my graph looks like this when I train my model?
 mild dirge
earnest widget
Can someone help me understand why my graph looks like this when I train my mode...
mild dirge
earnest widget
Can someone help me understand why my graph looks like this when I train my mode...
No chance at all without the code or more info
iron basalt
>>> x = np.array([[[0, 1], [0, 5]], [[0, 4], [0, 9]]])
>>> x
array([[[0, 1],
        [0, 5]],

       [[0, 4],
        [0, 9]]])
>>> np.sum(x, axis=0)
array([[ 0,  5],
       [ 0, 14]])
>>> np.sum(x, axis=1)
array([[ 0,  6],
       [ 0, 13]])
>>> np.sum(x, axis=2)
array([[1, 5],
       [4, 9]])
>>>
My mind just blew. Ok. This explains why I was having so much trouble normalizing a matrix correctly, I had the wrong idea of how applying operations along axes worked
iron basalt
(z, y, x)
mild dirge
serene plume
My mind just blew. Ok. This explains why I was having so much trouble normalizin...
You could also see it as "reducing the amount of rows/col" to one
For axis=0/1 respectively
iron basalt
The axis is iterated over and the rest indices held constant during that.
 thin stag
i made a small ai program that knows if a client in a bank will make a term deposit , can i do a desktop app and put ai in it?
serene plume
mild dirge
You could also see it as "reducing the amount of rows/col" to one
Yeah I got that it was a reduction or folding operation, I just didn't get which direction it was applied along. Now I do, thank you 🙂
iron basalt
So axis = 0 for 2d: ```
sum(
(0, 0)
(1, 0)
)
sum(
(0, 1)
(1, 1)
)
The axis 1 is held constant in each sum loop.
Holding all constant except the axis being moved "along" (during each sum).
earnest widget
mild dirge
No chance at all without the code or more info
Well I am trying an object detection task with box labels (xmin,ymin,xmax,ymax). I am sure it has nothing to do with my model directly but everything to do with my labels, however when I double check, the labels definitely seem correct and localizes the object. But when I put it in the model, I get this crazy mAP value with huge target values as well in the prediction. I can send a part of the target preprocessing code, it's fairly simple. I adjust them according to the image resize values. I got it from here: https://stackoverflow.com/questions/49466033/resizing-image-and-its-bounding-box
for index, row in train_labels_csv_3.iterrows():
    (filename, width, height, class_name, xmin, ymin, xmax, ymax) = row
# Read all the images according to filename.
    pic = cv2.imread(os.path.join(train_path2,filename))
# Take the image dimensions.
    x = pic.shape[0]
    y = pic.shape[1]

    img_Target_size = 224
    x_scale = img_Target_size / x
    y_scale = img_Target_size / y

# Resize the images to 224x224.
    pic = cv2.resize(pic, (img_Target_size, img_Target_size))

    xmin = int(xmin * x_scale)
    ymin = int(ymin * y_scale)
    xmax = int(xmax * x_scale)
    ymax = int(ymax * y_scale)

    train_images.append(pic)
    train_targets.append((xmin, ymin, xmax, ymax))
Hopefully you get the idea.😃
mild dirge
Maybe it's the calculating of mAP then
 orchid cosmos
when i run : plt.plot(df.timestamp, df.close) on IPython it drops a file named python but never opens , cant see the data. I'm using vscode
Can anyone help ??
earnest widget
mild dirge
Maybe it's the calculating of mAP then
I am using a direct function from TF ranking.
from tensorflow_ranking.python.keras.metrics import MeanAveragePrecisionMetric
mild dirge
Can you show where you call it
earnest widget
I even have the images and labels as numpy arrays with float32 types.
Also normalized the images.
mild dirge
Alright well, I doubt the model is perfect
So the program somehow gives the correct labels to the metric function
earnest widget
This is my model, just made using functional API of Keras. I also have another Sequential one but same result.
https://hastebin.com/ekeheceriy.apache
mild dirge
Maybe the format of the labels need to be different?
earnest widget
Like different data type?
mild dirge
Maybe they need to be normalized to be between 0 and 1 or something? (the bounding boxes)
Doubt it would give a mAP of 1 though..
earnest widget
mild dirge
Maybe they need to be normalized to be between 0 and 1 or something? (the boundi...
But won't normalizing mess up with the values?
mild dirge
In some examples I see, they normalize it by dividing by image width/height
earnest widget
Okay I can try that, but I think I did that before and it messed up with the values cause of resizing the image which changed the position of the boxes to localize the image due to the image resizing. Let me try it with this new code.
earnest widget
mild dirge
In some examples I see, they normalize it by dividing by image width/height
I did try out this but it messed up the results and now the box is nowhere to be seen on the image lol.
for index, row in test_labels_csv.iterrows():
    (filename, width, height, class_name, xmin, ymin, xmax, ymax) = row

    pic = cv2.imread(os.path.join(test_path,filename))

    x = pic.shape[0]
    y = pic.shape[1]

    img_Target_size = 224
    x_scale = img_Target_size / x
    y_scale = img_Target_size / y

    pic = cv2.resize(pic, (img_Target_size, img_Target_size))

    xmin = int(xmin * x_scale)
    ymin = int(ymin * y_scale)
    xmax = int(xmax * x_scale)
    ymax = int(ymax * y_scale)

    # Normalize the bounding box coordinates between 0 and 1
    xmin = xmin / 224
    xmax = xmax / 224
    ymin = ymin / 224
    ymax = ymax / 224

    test_images.append(pic)
    test_targets.append((xmin, ymin, xmax, ymax))
The result before without the normalize:
(80, 103, 91, 111)
The result after:
(0.35714285714285715, 0.45982142857142855, 0.40625, 0.4955357142857143)
This is for one image's labels.
mild dirge
Well yeah, you need to undo the normalizing if you want the correct values again
earnest widget
Oh okay, so does that work within the model or something beforehand?
mild dirge
I don't think this is the issue anyhow
I'm not sure how it handles your model output and true labels, and if it is in the correct format
earnest widget
Thing is, I have done the normalization before but the values do not match according to the image size and therefore I don't get the right predictions for a 224x224 image.
mild dirge
You need to normalize using the original image size
Could you check for some samples what the prediction is, and the actual label
And maybe print them here
dusty valve
earnest widget
Can someone help me understand why my graph looks like this when I train my mode...
😑
earnest widget
mild dirge
Could you check for some samples what the prediction is, and the actual label
Well I did get the predictions for the images after training the model once and this is it:
Predicted: 19546835, 6852107, 21685097, 8354692```This might actually be the issue because I was just normalizing the image by 255.
mild dirge
earnest widget
Well I did get the predictions for the images after training the model once and ...
Why would target ever be that high?
Your images can't be that high res
Well anyways, it definitley seems to be some problem with calculating mAP, maybe it takes input in a different format
You could try calculate it manually, or using some other function
earnest widget
mild dirge
Why would target ever be that high?
Yeah it's not, I just have it as 224x224. I am using the same code for evaluating the model by Keras: https://keras.io/examples/vision/object_detection_using_vision_transformer/#evaluate-the-model
mild dirge
Not sure exactly what is wrong, i'd probably have to go over more code, and I don't have that time right now
earnest widget
mild dirge
You need to normalize using the original image size
I will definitely try this out, it might be this issue.
mild dirge
In that example you showed, they use mean IoU, not mAP
earnest widget
Yeah they calculated that manually.
The IOU.
I am just using the evaluation part of it to check how well it does.
Not the previous parts.
serene plume
iron basalt
Holding all constant except the axis being moved "along" (during each sum).
I'm not sure I get the intuition you're getting at here...the original matrix doesn't change anyway, wdym by all axes remain constant except the one being summed along?
iron basalt
serene plume
I'm not sure I get the intuition you're getting at here...the original matrix do...
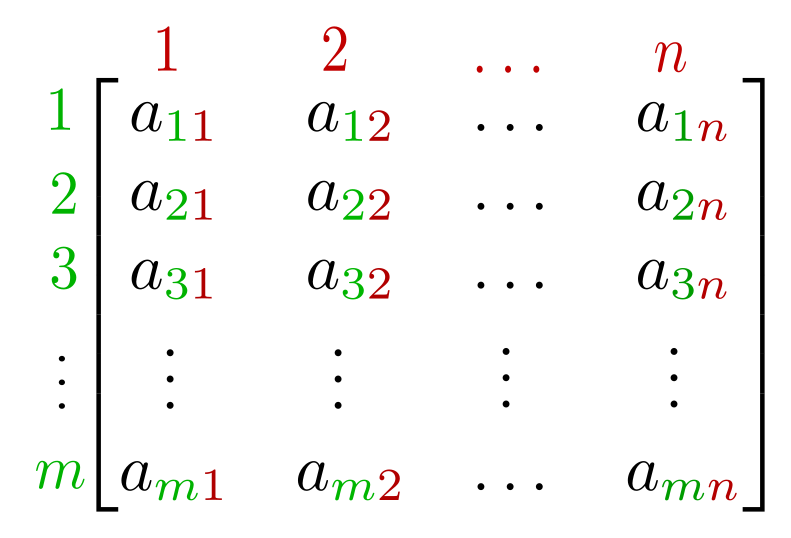
If you move along axis 0, you move along the green. If you move along axis 1 you move along the red.
If you are starting at a_1,1, then move downward along the first axis, the first index changes while the second (the red) remains constant.
So the axis being moved along corresponds to which index changes while the rest remain constant.
 desert oar
it's the axis that gets "eaten" as pacman moves along the array
 stuck socket
How to enable widgets in vscode?
Jupyter jupyter command 'jupyter-nbextension' not found
Nvm I did it
shell crest
serene plume
<@996870091419422750> I was sure it was a supposed to be row sums, which is why ...
Might be my error, hmm
To me only the idea of normalisation mattered, so I didn't really check the direction
wooden sail
the matter is that they explicitly insisted on using A B^T instead of A B or A^T B or whatnot. the choice of normalization depends directly on which things you transpose
 hoary wigeon
!IPython Loaded what does it means? Why do I get this while running the script? Whenever I execute the script nothing happens for 14sec then I get !IPython Loaded on terminal and then program starts executing.
What is it?
 stuck schooner
IPython is a library that allow Python to display
desert oar
hoary wigeon
`!IPython Loaded` what does it means? Why do I get this while running the script...
what script?
agile cobalt
stuck schooner
IPython is a library that allow Python to display
IPython is a command shell for interactive computing
it's much more than just "to display"
it is pretty much the backend of Jupyter notebooks, as well as being usable separately
 grave token
What would be the best way to pre-process these?

 grave token
In a tensorflow model, we pass in train+test data. Do I augment images first and then split it into train+test? or do I augment after splitting the dataset?
mild dirge
You only want to augment your training data
Otherwise you are testing on synthetic data that you modified yourself, which would not give a good representation of your model's performance
serene plume
iron basalt
So the axis being moved along corresponds to which index changes while the rest ...
Awesome explanation, I see it now thank you!
serene plume
shell crest
To me only the idea of normalisation mattered, so I didn't really check the dire...
I much prefer this to scipy's double loop for doing it, thank you 🙂
mild dirge
mild dirge
You only want to augment your training data
Did that make sense? @grave token
grave token
mild dirge
Did that make sense? <@639893833039216650>
Yes, got it. I also want to do a KFold on training set.
But What Comes after KFold though?
mild dirge
After?
You use kfold to design the model, and test the performance
And change some hyper-parameters around until performance is good
grave token
yes, I see everyone printing the average score with KFold, but dont see any use of it in the actual model building process.
mild dirge
Why not
How else would you know how good the model is?
kfold is good because it uses the entire training data for training/testing at some point in the kfold process
So it is not biased on using only a tiny slice for testing f.e.
grave token
will it run the KFold on a single model?
mild dirge
You perform kfold on a single model yes
And you do it for each set of hyper parameters you want to try out
grave token
mild dirge
You perform kfold on a single model yes
I thought they try all the combination and see which model perform most.
mild dirge
Well for each combination, you use kfold to test out the performance
Kfold is just a process for training and testing the model to get a fair performance measure
That hopefully represents the performance on new and real data
grave token
If i find out the combination that works best, I use it to train the actual model right?
mild dirge
Yeah, then you can use the entire training data for training
And finally you test it on the test data ONCE
You can't go back and fidget around with hyper-params to get a better result on the test data specifically
Because then you might overfit anyways (without knowing)
lapis sequoia
#imputing mean in the bad values
df.loc[(outliers|minus_1|zero),"Salary"]=impute_mean[df.loc[(outliers|minus_1|zero)][["Category","ContractType"]]]``` How can I achieve something like thisThis is how impute mean looks

I want to impute mean in specific rows based on their job category and contract type
lapis sequoia
lapis sequoia
This is how impute mean looks
This is what I was trying to pass as an index to that grouped by series
 worthy hollow
hey there i have this issue:
INPUT
!e ```py
import pandas as pd
df1 = pd.DataFrame({"Date": ['31/10/2008', '01/03/2009', '04/10/2013'],
"Earth": 0,
"Mer": 0,
"Ven": 0})
df2 = pd.DataFrame({"Date": ['31/10/2008', '01/03/2009', '04/10/2013'],
"Earth": 0,
"Mer": 0,
"Ven": 0})
print(df1)
print(df2)
@worthy hollow :white_check_mark: Your 3.11 eval job has completed with return code 0.
001 |          Date  Earth  Mer  Ven
002 | 0  31/10/2008      0    0    0
003 | 1  01/03/2009      0    0    0
004 | 2  04/10/2013      0    0    0
005 |          Date  Earth  Mer  Ven
006 | 0  31/10/2008      0    0    0
007 | 1  01/03/2009      0    0    0
008 | 2  04/10/2013      0    0    0
** OUTPUT **
!e```py
import pandas as pd
#output = pd.concat([df1, df2])
output = pd.DataFrame({"Date": ['31/10/2008', '31/10/2008', '01/03/2009', '01/03/2009', '04/10/2013', '04/10/2013'],
"Earth": 0,
"Mer": 0,
"Ven": 0})
print(output)
@worthy hollow :white_check_mark: Your 3.11 eval job has completed with return code 0.
001 |          Date  Earth  Mer  Ven
002 | 0  31/10/2008      0    0    0
003 | 1  31/10/2008      0    0    0
004 | 2  01/03/2009      0    0    0
005 | 3  01/03/2009      0    0    0
006 | 4  04/10/2013      0    0    0
007 | 5  04/10/2013      0    0    0
how can I pair through a "pd.concat" the matching dates, one after another?
 verbal bison
pd.concat([df1,df2],axis=0) ?
worthy hollow
verbal bison
```pd.concat([df1,df2],axis=0)``` ?
sadly this doesnt change anything
 verbal bison
pd.concat([df1.set_index('Date'),df2.set_index('Date')],axis=0)
axis =1 may be what you're looking for as well
worthy hollow
verbal bison
```pd.concat([df1.set_index('Date'),df2.set_index('Date')],axis=0)```

doesnt work
serene plume
In a matrix, what is the purpose of normalizing by dividing components by their row sum?
It has the property of rescaling components within ]0, 1], with the pre-condition of them being positive
If that is correct, anything else?
mild dirge
It depends on the context ig
Normally for a matrix we give as input to a ML model*, each row would be a sample, and each column a feature
And most of the times we try to normalize each separate feature value to be between 0 and 1
Or a mean of 0, and variance of 1
arctic cliff
What does Target mean in PyTorch documentation? Is it y_predict?
I am trying to figure out which comes first, the ground truth or the prediction

 wooden sail
the loss alone means nothing
serene plume
mild dirge
It depends on the context ig
Context: I want to derive positive row scores from [-1, 1] entries, so I figured I'd rescale the matrix to [0, 1] instead, and I do that by dividing its entries by their row sum
arctic cliff
wooden sail
the loss alone means nothing
Can you please elaborate?
wooden sail
there's nothing else to it, because you didn't give any context 😛
what did you even show lol
arctic cliff
Oh right
quaint loom
Do anyone see what is wrong here? https://gyazo.com/a488c3a9ea8f47b6110dd4cb2f7a4e7f
 arctic cliff
 serene plume
Context: I want to derive *positive* row scores from [-1, 1] entries, so I figur...
serene plume
serene plume
Context: I want to derive *positive* row scores from [-1, 1] entries, so I figur...
I think...this is ok.
arctic cliff
This is how the data looks like
 wooden sail
and what you showed is the loss at different epochs? if so, the alg converged*
still, convergence does not imply it reached a good/the best solution
wooden sail
are you getting good predictions from the model?
as i said, the value of the loss func alone means nothing
spare briar
model collapsed, you're getting no gradients at all
serene plume
serene plume
Context: I want to derive *positive* row scores from [-1, 1] entries, so I figur...
@deal.pre(lambda _: (_.matrix >= 0).all())
def normalize(matrix: NDArrayFloat16) -> NDArrayFloat16:
    row_sums = matrix.sum(axis=1)
    row_sums[row_sums==0] = 1
    return matrix / row_sums
So this is my ]0, 1] rescaling function of a positive matrix. Not a fan of the name normalize though, it's so vague and so overloaded.
arctic cliff
So loss function values don't mean the model is doing good or bad??
That's something I need to add to my notes
🤔So I still need to evaluate it then..
wooden sail
arctic cliff
🤔So I still need to evaluate it then..
right, because it will often be the case that the model fit has no exact solution. you won't be getting the loss to 0 unless you have overfitting, since noise will be present
you'll get some arbitrary value. on top of that, if the cost func is non convex (as they often are), you can hardly guarantee you'll reach the global minimum in the first place
so you check that it converges by studying the loss, you check that it converges to a local minimum by studying the local curvature, and you test it on validation data to make sure it is working sensibly
 mint palm
Need some advice,
For application of CNN on non image based data how should i arrange input to apply CNN?
For X:
My data set has about
100k rows
22 columns
For Y:
Ranges from 1 to 5
BUT theres a CATCH,
the size of y is 1* 50
SO, Y IS OUTPUT FROM ABOUT 2000*22.
ACTUALLY THESE 2000 ARE ELECTRICAL READING from brain during activity.
serene plume
!e
import numpy as np

matrix = np.random.randint(1, 10, (3,3))
print(matrix)

normalized_matrix = matrix / matrix.sum(axis=1)
print(normalized_matrix)

print(normalized_matrix.sum(axis=1))
Which normalization ensures that row sums equal 1? I thought it was this one but I'm clearly wrong
arctic wedgeBOT
@serene plume :white_check_mark: Your 3.11 eval job has completed with return code 0.
001 | [[1 3 1]
002 |  [4 8 6]
003 |  [7 4 8]]
004 | [[0.2        0.16666667 0.05263158]
005 |  [0.8        0.44444444 0.31578947]
006 |  [1.4        0.22222222 0.42105263]]
007 | [0.41929825 1.56023392 2.04327485]
the one you did works for positive numbers. probably along the other axis though
serene plume
Yeah, negative entries would need exponentiation first, but my use case for now is indeed just positive numbers
I...think I got the axes right this time though?
I'm summing along axis 1, so I'm producing the sums of each row
wooden sail
In [9]: x = np.random.randint(1,10,(3,3))

In [10]: scale = np.sum(x, axis=1)

In [11]: scaled = x/scale[:, np.newaxis]

In [12]: scaled
Out[12]:
array([[0.36, 0.28, 0.36],
       [0.35, 0.2 , 0.45],
       [0.4 , 0.45, 0.15]])

In [13]: np.sum(scaled, axis=1)
Out[13]: array([1., 1., 1.])
[:, np.newaxis] This looks weird
wooden sail
why?
serene plume
Because it looks weird syntactically and I have no idea what it does lol
wooden sail
it's making the vector into a true column vector. otherwise numpy divides along the wrong axis
since your matrix is square, matrix/vector can be done in two ways
numpy is doing the one you don't want, so we explicitly tell it that the vector is of size 3 x 1. then there is only one way the division can be done
serene plume
!e
import numpy as np

x = np.random.randint(1,10,(3,3))

scale = np.sum(x, axis=1)
print(scale.shape)
column_scale = scale[:, np.newaxis]
print(column_scale.shape)
@serene plume :white_check_mark: Your 3.11 eval job has completed with return code 0.
001 | (3,)
002 | (3, 1)
Oh huh. So numpy vectors aren't column vectors by default, and I need this syntax to be explicit about it...I'll have to remember that
Would've preferred a np.as_column() though. Much easier to remember than [:, np.newaxis] which I'm having trouble intuiting how it translates to "I want a column vector"
wooden sail
yes, numpy is very dumb in this sense. it lets you do stuff that is ill defined and enforces a default behavior that is not what one would expect
it should really just error out under ambiguity
wooden sail
serene plume
Would've preferred a `np.as_column()` though. Much easier to remember than `[:, ...
that's true, i wasn't aware that existed tbh. but newaxis works with arbitrarily many dimensions, which is always nice
serene plume
Ohh I think I see it, the : just goes over all axes, and then np.newaxis adds another one to wrap them in?
wooden sail
well. -1 goes over all axes and vectorizes them. np.newaxis adds in new axes
serene plume
!e
import numpy as np

m = np.ones((3, 3, 3))
print(m.shape)
print(m[:, np.newaxis].shape)
@serene plume :white_check_mark: Your 3.11 eval job has completed with return code 0.
001 | (3, 3, 3)
002 | (3, 1, 3, 3)
: goes over all the elements of one axis
serene plume
Oh
wooden sail
in what you wrote, it automatically assumed you meant to leave the other axes untouched, which you can make explicit by writing ...
serene plume
: goes over all the elements of one axis
Ok this is consistent with python slicing
serene plume
!e
import numpy as np

m = np.ones((3, 3, 3))
print(m.shape)
print(m[:-1, np.newaxis].shape)
I wrote a library for which takes context and generates model, on Importing Library it takes pause of 14sec the !IPython Loaded. Even if I dont use jupyter notebook.
arctic wedgeBOT
@serene plume :white_check_mark: Your 3.11 eval job has completed with return code 0.
001 | (3, 3, 3)
002 | (2, 1, 3, 3)
What would the syntax with -1 for going over all axes look like?
I can google this
wooden sail
In [22]: x
Out[22]:
array([[8, 5, 4],
       [6, 4, 5],
       [3, 1, 8]])

In [23]: x.reshape(-1)
Out[23]: array([8, 5, 4, 6, 4, 5, 3, 1, 8])
involves reshaping
serene plume
That looks like flattening
hoary wigeon
yep, no doubt
serene plume
!e
import numpy as np

m = np.ones((3, 3, 3))
print(m.shape)
print(m[:, :, :, np.newaxis].shape)
@serene plume :white_check_mark: Your 3.11 eval job has completed with return code 0.
001 | (3, 3, 3)
002 | (3, 3, 3, 1)
How can I achieve the same with arbitrarily many axes, without explicitly typing : for each one 🤔
wooden sail
In [27]: x = np.random.randint(1,10,(3,3,3,3))

In [28]: x.reshape(3, -1, 3).shape
Out[28]: (3, 9, 3)

In [29]: x.reshape(-1).shape
Out[29]: (81,)

In [30]: x[..., np.newaxis].shape
Out[30]: (3, 3, 3, 3, 1)
Grokking that...
wooden sail
like that
serene plume
Yeah...I don't think I like that
wooden sail
it's exactly what you asked for though 😛
serene plume
I looks like reshaping into lower ranks collapses some rank with a sum operation
reshape is an extremely confusing name for that
serene plume
Oh wait, I was looking at the shapes as components, thinking 9 was 3 + 3 + 3 🤦♂️
wooden sail
9 is 3 * 3 there
wooden sail
rank is a bad word for that, since rank is used for dimensions of subspaces
serene plume
axes?
wooden sail
and dimension is an invariant
axes and "ways" is common, since you can interpret this as a specific "unfolding" of a "4-way array"
serene plume
But this seems to go the opposite way of what I asked for 🤔 reshape, at least in your examples, seems to be about collapsing axes
wooden sail
you can add them in, too
untold bloom
[you can do np.c_[arr] instead of arr[:, None] for (n,) to (n, 1).]
wooden sail
In [35]: x.shape
Out[35]: (3, 5, 7, 10, 3)

In [36]: x.reshape(*x.shape, 1).shape
Out[36]: (3, 5, 7, 10, 3, 1)
for example
serene plume
!e
import numpy as np

m = np.ones((3, 3, 3))
print(m[:, :, :, np.newaxis].shape == m.reshape(3, 3, 3, 1).shape)
In [1]: import numpy as np

In [2]: x = np.arange(81)

In [3]: x.shape
Out[3]: (81,)

In [4]: x.reshape((3, 3, 3, 3)).shape
Out[4]: (3, 3, 3, 3)
In [5]: x.reshape((3, 3, 3, 3, 1, 1, 1, 1)).shape
Out[5]: (3, 3, 3, 3, 1, 1, 1, 1)
I see
wooden sail
you can add in arbitrarily many axes with np.newaxis and reshaping, and other methods that i never use
iron basalt
Product of new shape == product of old shape.
(aka flat-length or total elements is equal)
serene plume
So, to get a true column vector, I can do v[:, np.newaxis] or v.reshape((n, 1))...I think I prefer the latter. The former looks like a mandatory "go google what this does" or requires a comment
iron basalt
reshape takes 1 argument though, the shape tuple.
serene plume
Corrected
wooden sail
you sure?
i'm pretty sure you can do reshape(x,y,z,other_params)
!e
import numpy as np
x = np.array([1,2,3])
x = x.reshape(3,1,1,1,order='F')
print(x.shape)
i forgot to store the result lol
arctic wedgeBOT
@wooden sail :white_check_mark: Your 3.11 eval job has completed with return code 0.
(3, 1, 1, 1)
Hmm, did they change it? Docs says a tuple.
serene plume
 wooden sail
it has been this way for as long as i have used it
serene plume
Yeah doc does say tuple 🤔
I would expect *args for it to work the way Edd is using it
wooden sail
that's numpy.reshape tho, probably has a different interface from that of array.reshape
serene plume
Ohh right
iron basalt
Ah yeah, looking at the wrong thing.
wooden sail
array.reshape has worked this way for at least 5 years
serene plume
https://numpy.org/doc/stable/reference/generated/numpy.ndarray.reshape.html#numpy.ndarray.reshape
Unlike the free function numpy.reshape, this method on ndarray allows the elements of the shape parameter to be passed in as separate arguments. For example, a.reshape(10, 11) is equivalent to a.reshape((10, 11)).
TIL
iron basalt
I guess I just assumed it all required tuple this whole time since even the examples in the docs use tuples: ```py
a = np.arange(6).reshape((3, 2))
I think the doc examples are right to remain consistent
This discrepancy is weird
Either they should both take tuples or neither should
Now it's just an obscure "did you know" clever thing to remember
iron basalt
They are assuming the *args are ints for the array one, and the freestanding they can't because the first argument is an array_like.
Probably calls the freestanding reshape just passing *args as the shape tuple.
And self as the first argument.
serene plume
Then the array one should just take a tuple instead of *args 🤷♂️
Oh well, not that important
wooden sail
sorry for cursing you with arcane knowledge lol
serene plume
I hate this kind of knowledge 😄 But it's ok, you've taught me good things too
iron basalt
Numpy's Python code is pretty cursed.
The C code kind of too because of metaprogramming.
wooden sail
it's 3 eels in a trench coat, but it does work pretty well
serene plume
array.reshape(*array.shape, 1) Damn it, this is useful
wooden sail
i was about to say, pretty sure that doesn't work with matrices
matrices no likey more than 2 axes
serene plume
When you can't be explicit about the shape because it's in some generic context, but you just want to add axes to it
Yeah I corrected that as I realized it lol
wooden sail
i showed that in an example above tho
wooden sail
wooden sail
```py
In [35]: x.shape
Out[35]: (3, 5, 7, 10, 3)
In [36]: x.reshape(*x.shape, 1...
.
serene plume
Oh. Right. Doing the same with freestanding reshape would be quite a bit uglier
!e
print( (3, 3, 3) + (1, ))
@serene plume :white_check_mark: Your 3.11 eval job has completed with return code 0.
(3, 3, 3, 1)
Well, maybe not that much uglier. np.reshape(arr, arr.shape + (1, )). Just less terse
desert oar
hoary wigeon
I wrote a library for which takes context and generates model, on Importing Libr...
you will have to actually show your code, it's impossible to help otherwise
serene plume
!e
import numpy as np

m = np.array([[1, 0, 1], [2, 0, 2], [3, 0, 3]])
n = m.copy()

m[m==0] = 1
np.place(n, n==0, 1)

assert (m == n).all()
@serene plume :warning: Your 3.11 eval job has completed with return code 0.
[No output]
m[m==0] = 1 and np.place(n, n==0, 1) look equivalent...are they really?
Yeah, I think so. the conditional n==0 applies a mask over n, which resolves to [[False, True, False], [False, True, False], [False, True, False]] and the components corresponding to True are replaced with the 1 I'm giving.
This is useful to me because I want to go from
row_sums = matrix.sum(axis=1)[:, np.newaxis]
row_sums[row_sums==0] = 1
normalized_matrix = matrix / row_sums
To
row_sums = matrix.sum(axis=1)[:, np.newaxis]
normalized_matrix = matrix / np.place(row_sums, row_sums==0, 1)
Which I think is a better expression of why I'm replacing 0's with 1's, because you see the division on the same line
 low bloom
I am using pandas
reading an excel sheet into a df, then iterating through the rows
the values can be either a word, a number, or float
some cells dont have a value, how do I check for an empty cell?
I am currently getting nan when I try to print out the empty cell
feel free to @ me
serene plume
low bloom
I am using pandas
reading an excel sheet into a df, then iterating through the r...
how do I check for an empty cell?
https://pandas.pydata.org/docs/reference/api/pandas.DataFrame.isna.html
low bloom
but since I am iterating through the rows with iterrow, it would no longer be a df but a series I think
I am new to pandas
untold bloom
serene plume
So, to get a true column vector, I can do `v[:, np.newaxis]` or `v.reshape((n, 1...
other at least 2 more options are np.c_[v] or v.shape += (1,) where the latter is in-place...
serene plume
!e
import numpy as np

a = np.arange(9).reshape((3, 3))
a.shape += (1,)
print(a.shape)
@serene plume :white_check_mark: Your 3.11 eval job has completed with return code 0.
(3, 3, 1)
This is disgusting
I had a...naive mental model that a.shape was read-only. Shouldn't it be a property or something
I think I don't even want to know what np.c_ is. I'm good, thank you 🙂
desert oar
untold bloom
other at least 2 more options are `np.c_[v]` or `v.shape += (1,)` where the latt...
is .c_ the "C order" accessor?
like ravel(a, order='c')
serene plume
Stop, say no to drugs cursed knowledge
desert oar
huh
untold bloom
though, np.s_ is a distant-cousin
most verbose (but direct) way of column-vector making way is perhaps np.column_stack((a,)) :|
desert oar
!d numpy.c_
arctic wedgeBOT
numpy.c_ = <numpy.lib.index_tricks.CClass object>```
Translates slice objects to concatenation along the second axis.

This is short-hand for `np.r_['-1,2,0', index expression]`, which is useful because of its common occurrence. In particular, arrays will be stacked along their last axis after being upgraded to at least 2-D with 1’s post-pended to the shape (column vectors made out of 1-D arrays).

See also

[`column_stack`](https://numpy.org/devdocs/reference/generated/numpy.column_stack.html#numpy.column_stack "numpy.column_stack")Stack 1-D arrays as columns into a 2-D array.

[`r_`](https://numpy.org/devdocs/reference/generated/numpy.r_.html#numpy.r_ "numpy.r_")For more detailed documentation.

Examples...interesting little DSL
serene plume
DSL?
desert oar
.reshape((-1,1)) is how I normally write it
desert oar
serene plume
DSL?
"domain-specific language"
desert oar
i agree that overwriting .shape is cursed
desert oar
serene plume
What does `reshape((-1,1)) `? The -1 bugs me
"fill with as many items as needed to consume the array"
serene plume
desert oar
i agree that overwriting `.shape` is cursed
Yes...but the in-place-ness of it is so very tempting
serene plume
desert oar
"fill with as many items as needed to consume the array"
So it doesn't matter if it had 60 axes, just go over them all and add a 61st?
desert oar
ndarrays are just views over flat contiguous arrays anyway so "in place" doesn't make much of a difference unless you specifically re-order the array with np.ascontiguousarray
desert oar
serene plume
So it doesn't matter if it had 60 axes, just go over them all and add a 61st?
you would need to write the sizes of all the others
 red sphinx
worthy hollow
how can I pair through a "pd.concat" the matching dates, one after another?
red sphinx
worthy hollow
how can I pair through a "pd.concat" the matching dates, one after another?
!e
import pandas as pd

df1 = pd.DataFrame({"Date": ['31/10/2008', '01/03/2009', '04/10/2013'],
                   "Earth": 0,
                   "Mer": 0,
                   "Ven": 0})
df2 = pd.DataFrame({"Date": ['31/10/2008', '01/03/2009', '04/10/2013'],
                   "Earth": 0,
                   "Mer": 0,
                   "Ven": 0})
df_out = pd.concat((df1, df2))
df_out.Date = pd.to_datetime(df_out.Date)
df_out = df_out.sort_values("Date", ignore_index=True)
df_out.Date = df_out.Date.dt.strftime("%d/%m/%Y")
print(df_out)
# +this seems working
@red sphinx :white_check_mark: Your 3.11 eval job has completed with return code 0.
001 | <string>:12: UserWarning: Parsing '31/10/2008' in DD/MM/YYYY format. Provide format or specify infer_datetime_format=True for consistent parsing.
002 |          Date  Earth  Mer  Ven
003 | 0  31/10/2008      0    0    0
004 | 1  31/10/2008      0    0    0
005 | 2  03/01/2009      0    0    0
006 | 3  03/01/2009      0    0    0
007 | 4  10/04/2013      0    0    0
008 | 5  10/04/2013      0    0    0
np.arange(2*3*4).reshape((-1,3,4))
serene plume
desert oar
ndarrays are just views over flat contiguous arrays anyway so "in place" doesn't...
TIL. And that's a relief. Writing to .shape is bad.
desert oar
!e ```py
import numpy as np
x = np.arange(234).reshape((-1,3,4))
print(x.shape)
print(x)
So it's "Figure out this axis by yourself, I just care about those I'm specifying"?
desert oar
serene plume
So it's "Figure out this axis by yourself, I just care about those I'm specifyin...
yes
serene plume
!e
import numpy as np
x = np.arange(2*3*4).reshape((-1,3,4))
print(x.shape)
print(x)
@serene plume :white_check_mark: Your 3.11 eval job has completed with return code 0.
001 | (2, 3, 4)
002 | [[[ 0  1  2  3]
003 |   [ 4  5  6  7]
004 |   [ 8  9 10 11]]
005 |
006 |  [[12 13 14 15]
007 |   [16 17 18 19]
008 |   [20 21 22 23]]]
but apparently it can be a lot slower than the newaxis version because in general it needs to actually figure out the size of the resulting array, rather than just slapping a new axis layer on like newaxis
untold bloom
serene plume
TIL. And that's a relief. Writing to `.shape` is bad.
it's possible that .reshape gives you a copy, and a.reshape(2, 3) returns a new "thing" in either case; writing to shape is truly in place in that sense.
desert oar
untold bloom
it's possible that `.reshape` gives you a copy, and `a.reshape(2, 3)` returns a ...
when does reshape return a copy? when you set order=?
!d numpy.reshape
arctic wedgeBOT
numpy.reshape(a, newshape, order='C')```
Gives a new shape to an array without changing its data.It is not always possible to change the shape of an array without copying the data. If you want an error to be raised when the data is copied, you should assign the new shape to the shape attribute of the array:
untold bloom
desert oar
when does reshape return a copy? when you set `order=`?
i don't think order affects that directly; it's that NumPy makes no guarantee 100% that reshape gives you a view all the time.
desert oar
aha, so overwriting the shape will not be possible if data must be copied to reshape it
desert oar
untold bloom
i don't think `order` affects that directly; it's that NumPy makes no guarantee ...
makes sense. and ty, i just confirmed this in the docs, the order is just the "view order"
serene plume
desert oar
but apparently it can be a lot slower than the `newaxis` version because in gene...
How would you replicate that example with newaxis?
desert oar
serene plume
How would you replicate that example with `newaxis`?
you wouldn't as far as i know
indexing with np.newaxis (which btw is just an alias for None) only ever adds an axis, .reshape is more general
serene plume
I see
steady basalt
anyone know why its plotting over itself
 serene plume
desert oar
> It is not always possible to change the shape of an array without copying the ...
serene plume
desert oar
> It is not always possible to change the shape of an array without copying the ...
And so you can handle the error with some other in-place strategy if you truly care about not copying. Nice
steady basalt
    axes = axes.flatten()
    x=combined_train['ethnicity'].astype(str)
    sns.barplot(data=combined_train, x=x, y='stroke', palette="viridis",ax=axes[0])
    sns.barplot(data=combined_train, x=x, y='stroke', palette="viridis",ax=axes[1])

    a=fig.get_figure()
return a```you can generalize np.newaxis-based enlarging with np.expand_dims and perhaps write more succintly if more than 1 new axis is required
therefore the 6th way of making a 1D array to be a column vector is np.expand_dims(arr, 1)...
shell crest
Is this the zen of python, if there is one way to do something, ensure there are at least 3 ways of doing the same thing?
steady basalt
anyone good at plotting?
serene plume
untold bloom
therefore the 6th way of making a 1D array to be a column vector is `np.expand_d...
I think I prefer this
steady basalt
😅
untold bloom
that zen is broken, i guess...
serene plume
shell crest
Is this the zen of python, if there is one way to do something, ensure there are...
I thought only C++ this. I was wrong.
untold bloom
TIMTOWDI, for the win
shell crest
TBH I've never actually seen the 'do it the only and obvious way' Zen everrrrr actually being applied
The other zens are more or less arguable, and can be argued for and are in practice
steady basalt
fixed it!
tick.set_rotation(45)``` doenst work tho for j in range(len(axes)):
axes[i][j].tick_params(axis='x', rotation=90)``` got itmatrix /= (matrix**2).sum(axis=1, keepdims=True)**.5
self_sim_matrix = matrix @ matrix.T
This is a self cosine sim so the result matrix should be within [-1, 1]. But there seems to be some floating point-calc-related overage that goes to 1.0000005. How would you handle this?

This fails a post-condition test that checks that all entries are within [-1, 1]
I could rescale self_sim_matrix within [-1, 1] but that's extra work and this is a hot function
Maybe np.clip(self_sim_matrix, -1, 1) would be a bit cheaper
shell crest
I'd go with clip
serene plume
I don't see a way to avoid the overages in the first place :/
untold bloom
maybe try with float64 and also if you're in control of the comparison to 1, change the tolerance there?
serene plume
It also goes over 1 as float64.
https://docs.python.org/3/library/math.html#math.isclose
math.isclose(a, b, *, rel_tol=1e-09, abs_tol=0.0)
Return True if the values a and b are close to each other and False otherwise.
This seems like a good way to compare floats
 pure plover
Does anyone have exp with PANDAS? I'm working with a problem - timeseries data but the replicates weren't started at the same time (30 second lag, between start points but data collection once per minute). I think that I need to calculate a trend-line and plot against interpolated values in order to compensate for the discrepancy but I'm not exactly sure how to do it in a statistically valid way.
serene scaffold
pure plover
Does anyone have exp with PANDAS? I'm working with a problem - timeseries data b...
to get pandas help, always start by giving a copy/pastable example (no screenshots) with print(df.head().to_dict('list'))
you want to ask questions in a way that people can read it and start answering right away. I'm about to leave, so I might not be able to answer your question now, but I could have if you had fully asked it.
arctic wedgeBOT
Hey @pure plover!
You either uploaded a .txt file or entered a message that was too long. Please use our paste bin instead.
pure plover
pure plover
Changed tolerance 🙂
@deal.post(lambda sim_mat: ((sim_mat > -1) | np.isclose(sim_mat, -1, 5e-07)).all())
@deal.post(lambda sim_mat: ((sim_mat < 1)  | np.isclose(sim_mat, 1, 5e-07)).all())
def self_cosine_sim(matrix: NDArrayFloat16) -> NDArrayFloat16:
    # NOTE: Is the sqrt necessary in ranking space?
    matrix /= (matrix**2).sum(axis=1, keepdims=True)**.5 # Pre-normalization
    self_sim_matrix = matrix @ matrix.T
    return self_sim_matrix
Took me a while to figure out that I needed to bit-or comparisons with isclose 😮💨
untold bloom
indeed... and and or doesn't "work" with NumPy arrays as they query truthfulness which is deemed ambigous as you probably faced, and since they are not really overridable (if at all), they went for & and |...
serene plume
untold bloom
indeed... `and` and `or` doesn't "work" with NumPy arrays as they query truthful...
Alternatively:
@deal.post(lambda sim_mat: ((sim_mat >= -1) & (sim_mat <= 1)).all())
def self_cosine_sim(matrix: NDArrayFloat16) -> NDArrayFloat16:

    matrix /= (matrix**2).sum(axis=1, keepdims=True)**.5 # Pre-normalization
    self_sim_matrix = matrix @ matrix.T

    # Narrowing back to f16 for memory efficiency + clipping e.g. 1.00000005
    return self_sim_matrix.astype(np.float16)
The matmul promotes dtype to float32, so narrowing it back down to float16 deals with the floating overages 🙂
I'm a bit too tunnel-visioned atm though, I want to say I prefer this but I'm not sure if it's better
untold bloom
yeah it's like clip :p
serene plume
Oh. Yeah. But cooler.
Plus it's semantically more meaningful, [-1, 1] doesn't need float32, and float16 is more scalable memory-wise in parallel computation
 fiery dust
I'd like to see a video or maybe better videos that explain in depth what AI is, how it works, etc. No how to code AI, but the fundamentals, what it is. Any recommendations?
mild dirge
A video won't go too in-depth most likely, there is a lot of math involved if you want to go in-depth
Maybe watch an introductory video, like the series on neural networks by 3-blue-1-brown, and see if you understand that
And if not, you probably want to prepare yourself with some stuff like calculus, statistics, probability, linear algebra as some examples
desert oar
steady basalt
how would you go by implimenting this on mixed data in python?
you need to define "distance" on the non-continuous variables and plug that in, instead of | x - z |
lapis sequoia
this tutorial is saying it's using unrolled MNIST images, but the type is float for the image pixels which I don't understand, anyone know what format MNIST images are in? (the load_data function just opens a numpy zip)

they are greyscale if that helps
mild dirge
Mnist imsges are 28x28 images that are prob grayscale uint8 values between 0 and 255
Oh hmm, 20x20 in your case ig
I'm not sure what your question is @lapis sequoia it seems that they explain the format of the images quite well
each pixel has a value between 0 and 1, 1 being white, and 0 being black (or other way around, not sure which)
lapis sequoia
I was thinking that too but some of the values are negative?
 mild dirge
I'm not sure why that would be the case, that is not very typical*
Maybe they standardized the pixel values
To have a mean of 0, and stdev of 1
lapis sequoia
 ok I guess it's just something odd
mild dirge
jup pretty odd
It suggests they have been pre-processed already somehow
Because image pixel values are almost always uint8 and between 0 and 255
or float and between 0 and 1
fiery dust
mild dirge
And if not, you probably want to prepare yourself with some stuff like calculus,...
ok, good answer. Thanks so much !
and why is that math needed exactly? for example will I need calculus, stats, probability and linear algebra while coding AI models?

 runic heron
I'm assuming this goes here -- but if this isn't the place then I'll happily move to the appropriate area
Anyone know any good Markov Chain libraries for python?
And any good tutorials for it? Just getting into it and I believe I have my head wrapped around how the chains work at a basic level, but I would like a place to go for actually coding with the Library
 misty flint
runic heron
*I'm assuming this goes here -- but if this isn't the place then I'll happily mo...
misty flint
runic heron
*I'm assuming this goes here -- but if this isn't the place then I'll happily mo...
havent used it myself but i heard good things about pymc
runic heron
Will check it out — what about tutorials on markov chains in general?
serene plume
self_sim_matrix = matrix @ matrix.T
return self_sim_matrix.astype(np.float16, copy=False)
self_sim_matrix = np.matmul(matrix, matrix.T, ndtype=np.float16)
return self_sim_matrix
1 or 2?
Leaning towards 2 :/
 mossy dragon
Hey y'all , I'm trying to use airflow and google big query operators to set up a pipeline that inserts the results of one query into a table
The problem I'm having is that the query pulls from several different datasets on different projects and I can't seem to get it to work like I did for a query from a single dataset
mossy dragon
;_;
misty flint
if it makes you feel better this happens a lot
 drifting snow
mossy dragon
The problem I'm having is that the query pulls from several different datasets o...
drifting snow
mossy dragon
The problem I'm having is that the query pulls from several different datasets o...
do you want to play any tasks in parallel to get data at the same time?
arctic cliff
Loss values reaches inf??

That doesn't look like a good sign xD
Is there an explanation for this?
 void sail
Hi guys
Question from me:)
Given sequences that should get a dynamic price and Id like to use meaningfull embeddings of said sequences
Is it better to go supervised (train whether or not said sequence needs to get a dynamic price, instead of a specific price. Labels exist for this) and use the embeddings from this model
OR
Go unsupervised completely with encoding / decoding
OR
Similarity learning, using distance metrics during training to make the ones that need a dynamic price move away in the embedding from those that dont
How do these embeddings differ from a high level?
Please ping me if u reply:)
 lavish condor
Question
We've got neural nets for pattern recognition
Ontologies for conceptual world modelling
With respect to AGI especially, what's the next big thing in AI?
void sail
lavish condor
With respect to AGI especially, what's the next big thing in AI?
One of things people often forget in this topic is out-of-distribution detection. Which in models is very important and especially for AGI. Its been getting more and more attention now that DL is moving more and more into production(compared to ML)
void sail
Meh those usually suck and rarely leave the academic field
There hasnt been anything really NEW for over 2 decades
Just alterations which is still impressive but not new
steady basalt
desert oar
you need to define "distance" on the non-continuous variables and plug that in, ...
How? Would it be fair to use one hot encoded values?
quaint loom
Do anyone see the mistake I have done? https://gyazo.com/1be73eb93c7692e40b8c7e26f0e2995a

 mossy dragon
drifting snow
do you want to play any tasks in parallel to get data at the same time?
mossy dragon
drifting snow
do you want to play any tasks in parallel to get data at the same time?
create_new_table_task = BigQueryInsertJobOperator(
  dag=dag,
  task_id='create_new_table',
  configuration={
    'query':{
      'query':"SELECT * FROM project1.dataset1.table1"
       'destinationTable':{
          'projectId':'project2',
          'datasetId':'dataset2',
          'tableId':'table2'
      },
      'timePartitioning':{'type':'DAY','field':'date'},
      'writeDisposition':'WRITE_TRUNCATE',
      'create_disposition':'CREATE_IF_NEEDED',
       'useLegacySql':False,
     }
  }
)
Heres my code, this task would work if the query pulls data from the same project/dataset of the destination table, but not when its different
One way to work around this that I can think of is to pull data from the tables/queries I need in a different task and save them in python variables/dictionary or w/e
and then make a new task to upload this data to the destination table
but thats super inefficient and the data is huge so im not even sure it would fit into python
mint palm
Is jupyter suitable for larger ml projects?
wooden sail
mint palm
Is jupyter suitable for larger ml projects?
you shouldn't use jupyter for development nor deployment, no. you can certainly use it to have your visualization, comments, and equations in one place, but you probably agree that for complex tasks, it makes more sense to arrange your code into separate files/modules
you can then import those into your jupyter notebook
mint palm
wooden sail
you shouldn't use jupyter for development nor deployment, no. you can certainly ...
i currently use pycharm
do you have any specific recommendation for tools(auxiliary tool to make it easier/high quality)?
my work would include computer vision
steady basalt
mint palm
Is jupyter suitable for larger ml projects?
depends how large
it can handle more than people give it credit for, a single cell can contain as much as almost any .py file
i find pycharm kinda annoying sometimes
mint palm
steady basalt
i find pycharm kinda annoying sometimes
my work will include implementing and researching on CVPR/ICCV/ECCV papers, i think they are quite large sometimes and often require 20ish modules
steady basalt
okay then u probably need multiple .py files for your functions
thats some good shit
mint palm
so pycharm suitable right
wooden sail
whichever ide you like :p
mint palm
ok
potent field
Where would one learn data science and what can you do with it.
steady basalt
potent field
Where would one learn data science and what can you do with it.
u can do alot i guess
potent field
steady basalt
u can do alot i guess
I don't know to much about the field and I'm trying to figure out what I should go to college for.
velvet birch
https://stats.stackexchange.com/questions/586823/can-we-use-standard-deviation-for-feature-selection

Cross Validated
I am working on the House Price Prediction dataset on Kaggle and am trying to identify the good features for our price predictions. For numerical variables, I have gone with a high correlation with...
I hope this question makes sense
shell crest
potent field
I don't know to much about the field and I'm trying to figure out what I should ...
I'd actually advise you to not join just because of the hype.
steady basalt
lol, the hypes basically gone outside of cutting edge deep learning
in my city its very tough to find a job as a normal DS
void sail
steady basalt
in my city its very tough to find a job as a normal DS
Which city is that?
void sail
velvet birch
https://stats.stackexchange.com/questions/586823/can-we-use-standard-deviation-f...
It might be the case for a single categorical variable but this method fails to capture any interactions between variables
velvet birch
That is what I am after for now
interaction between variables comes next
For now it's just one feature and the target
void sail
velvet birch
interaction between variables comes next
In that case yes it will hold some information and it is kind of dependt on your model
velvet birch
This would provide be a good set of features I should be working on
velvet birch
Once I have this set, then I can try label encoding all the features with ordinal data and get their correlation with the price
velvet birch
void sail
However std does not describe a distribution as you intend to tbh
the main motive of using it is to see if the medians for each group are the same or not
Cause if they are then that's not a very good feature
But yh there are other things too which might cause this similarity
void sail
Side note, correlation def does not capture every relationship
velvet birch
Thought so
What would be a good thing to try out then?
Plain old scatterplot for each feature against the target?
void sail
Thats the most simple way, if you are lazy like me you can take a look at iterative feature selection (basically grid searching feature combinations)
 severe shadow
Anyone here using Jupyter on M1 macOs familiar with this error:
Jupyter server process exited with code 133 rosetta error: /var/db/oah/279281327407104_279281327407104/438da966fff0f6aab18d0627f2bbe82fd8ee21e6e49e22d47a887298bfb7e97e/libmkl_rt.1.dylib.aot: attachment of code signature supplement failed: 1
How can that work with like 80 features tho?
Too many combinations
A guy on commented on that post saying that my method is similar to what Annova does
Am so happy
I got brains too T_T
steady basalt
void sail
Which city is that?
London
void sail
steady basalt
London
Oh thats surprising, I always head fellow graduates moving there for a job or ex collegies (DS or MLE)
steady basalt
void sail
Oh thats surprising, I always head fellow graduates moving there for a job or ex...
A lot of people I know are trying to move to the US where the wages are doubled and there’s far less competition
 haughty anvil
Am I allowed to ask a non-technical question here related to data science and Machine Learning?
steady basalt
Yes
haughty anvil
Ok thank you @steady basalt
A question for Machine Learning Engineers and/or Data Scientists.
What type of technical content do you like to consume? How do you like to consume it? By reading blog posts, watching YouTube videos, listening to podcasts, something else?
Do you like articles and blog posts more straight forward that get to the point? Or do you like to read something technical in story format?
Also, do you prefer visuals or images in the technical content you read?
 unique flame
haughty anvil
Ok thank you <@119592011207540740>
unique flame
haughty anvil
Ok thank you <@119592011207540740>
-Books and academic papers for technical stuff
-articles+blogpost ofc straight to the point, but more societal related.
-Mixture of all
oh wait I'm no MLE or DS tho...just an enthusiast
haughty anvil
Thank you for your response @unique flame !
@unique flame when you say societal related what do you mean by that?
Thank you @lapis sequoia !
unique flame
haughty anvil
<@609456294134284317> when you say societal related what do you mean by that?
just that i rather read blogposts that concerns itself on what society thinks about AI, instead of technical details.
steady basalt
It’s kinda sad no?
Unless you’re extremely enjoying of these contents
I don’t think I cud keep going without other outlets
It got to the point where I have to watch stats videos in the shower - too much of anything is bad
desert oar
steady basalt
How? Would it be fair to use one hot encoded values?
not ideal, unless you are interested in treating each one-hot encoded value as a separate feature
you can probably just do "0-1" distance on the binary features
distance = 0 if same feature, 1 otherwise
steady basalt
desert oar
you can probably just do "0-1" distance on the binary features
And add that to the aggregation exactly the same as the original equation as j?
desert oar
steady basalt
And add that to the aggregation exactly the same as the original equation as j?
in principle yes, although i'm not sure how you'd define standard deviation on a categorical variable
steady basalt
I think I’ll just ask my supervisor about that , has me confused
desert oar
tldr: you can do it on one-hot-encoded features, but you might want to scale the distance down by the number of categories in the feature. otherwise any feature with high cardinality will overwhelm the dataset
misty flint
data science scarcity exercise. choose only 4

prevent tooling sprawl 
ill probs choose sql, pandas, pytorch and (ugh) excel
desert oar
misty flint
data science scarcity exercise. choose only 4
same. excel pandas sql torch.
except no "ugh", excel is fucking great
misty flint
im coming around to it
steady basalt
desert oar
tldr: you can do it on one-hot-encoded features, but you might want to scale the...
Interesting. So make it proportional
Not sure how to code it rn
steady basalt
misty flint
data science scarcity exercise. choose only 4
We keep torch sql GitHub and jupyter
desert oar
steady basalt
Not sure how to code it rn
should be pretty basic with numpy
github is just a git host... as long as you have git you can make your own github
desert oar
you can't, but someone else can. you also don't need a website, you can just have a git clone and read the README like in the old days
jupyter also, blech. not essential post-apocalypse
actually you probably don't even need torch if you have cuda, although good luck rebuilding everything from that. without gpu computing we'd be in bad shape
steady basalt
True
misty flint
we use azure devops instead
steady basalt
Makes u realise how much fucking tools we need to have learnt
Can make 90k driving a train all day
😂
desert oar
driving a train isn't exactly easy either
spare briar
misty flint
ill probs choose sql, pandas, pytorch and (ugh) excel
need cuda or torch sucks haha
id do cuda, torch, sql, kube
misty flint
spare briar
need cuda or torch sucks haha
im going to pretend torch includes cuda 
misty flint
spare briar
id do cuda, torch, sql, kube
kube interesting

i think i would rather use a managed kube service if i end up needing it. i heard debugging pods is not a fun endeavor
spare briar
without kube you dont get managed kube service haha
i would burn jupyter even if i didnt need to
misty flint
tbf i believe many peeps would
serene scaffold
@spare briar we should make a jupyter notebook burn tape
 brisk apex
iirc scala was developed specifically with big data in its purpose. And I've been told companies are switching from scala to python in these days. What made them to change from scala to python?
desert oar
brisk apex
iirc scala was developed specifically with big data in its purpose. And I've bee...
i don't know if it was developed specifically for that purpose, but i think its first (only?) big popular application was jvm-based big data systems
python is a lot more popular among data people and scientists, and is generally a lot easier to learn
i think scala as a language became burdened with a lot of problems and people soured on it in general
scala is/was a very ambitious and bold experiment in language design, and it's not surprising that they didn't get it right the first time. also computing and language design itself changed a lot in the years since scala came out
serene scaffold
desert oar
i don't know if it was developed specifically for that purpose, but i think its ...
I thought it was just meant to be "a JVM language that's less shitty than Java", but "scala" apparently means "scalable language".
desert oar
not just "less shitty than java" but also "a functional programming language that lets you use haskell/ML-like abstractions in a java-like syntax that runs on the jvm and is also more practical than haskell/ML"
we probably wouldn't have kotlin if it wasn't for scala, and people generally seem to think kotlin is indeed "java but less shitty/outdated-feeling"
and apparently java itself now is quickly accumulating more modern features that bring it closer to kotlin in "modernity", like lambdas
serene scaffold
Java has had lambdas for as long as I've known it (which is about five years)
but they're still esoteric and OO
desert oar
i wouldn't know, i have used java exactly once to write hello world in ~2011
serene scaffold
desert oar
i wouldn't know, i have used java exactly once to write hello world in ~2011
when you do a lambda in Java, you're implementing a class that has one static method, and then that's what gets called. because yay forcing OOP into literally everything.
and by "yay forcing OOP into everything", what I really mean is "fuck you"
desert oar
serene scaffold
when you do a lambda in Java, you're implementing a class that has one static me...
alas
serene scaffold
desert oar
we probably wouldn't have kotlin if it wasn't for scala, and people generally se...
is your thinking that scala proved the viability of alternative JVM languages?
desert oar
serene scaffold
is your thinking that scala proved the viability of alternative JVM languages?
probably, although again i'm not what you'd call an "expert" in that area. i'm sure that clojure also helped
serene scaffold
desert oar
probably, although again i'm not what you'd call an "expert" in that area. i'm s...
you're always an expert, salt rock lamp bb 💚
 frozen marten
any open source repos to contribute to in the field of ai/ml for beginners?
also what kind of contributions can we make?
steady basalt
serene scaffold
<@336524160509411328> we should make a jupyter notebook burn tape
So what’s the gripe with jupyter
shell crest
haughty anvil
A question for Machine Learning Engineers and/or Data Scientists.
What type of...
not ml engi or 'ds'
Best kind of technical content gets to the point, and typically are official enough. e.g. docs, docs, and more docs.
if not docs, then really well-written ad-less blogs. I especially dislike the hype-based websites which refuse to share their knowledge for free and want registrations etc. YT vids are a no unless you have 3b1b production quality.
Visuals are good, but are a pain to make
agile cobalt
frozen marten
any open source repos to contribute to in the field of ai/ml for beginners?
the closest thing to that I can imagine would be messing around on your own with whatever you find interesting and uploading to GitHub/Kaggle, or partaking in Kaggle competitions
serene scaffold
steady basalt
So what’s the gripe with jupyter
I don't really care if experienced Python users (ie, those who understand state and reproducibility) choose to use them, but I think that teaching them to python beginners is pedagogically unwise and creates landmines.
steady basalt
serene scaffold
I don't really care if experienced Python users (ie, those who understand state ...
Beginners as in python beginners? Or data science
shell crest
Jupyter is great, especially if you use the Ju=Julia side of it :^)
steady basalt
I agree that python itself shouldn’t be learnt in jupyter of course
shell crest
serene scaffold
I don't really care if experienced Python users (ie, those who understand state ...
I think relying on Google Colab is usable and your stance on it seems to disagree. I'd like to know why
serene scaffold
steady basalt
Beginners as in python beginners? Or data science
both? because data science students are also often learning Python for the first time.
steady basalt
Not sure who learns python in jupyter
Maybe I can see it being common learning numpy and pandas via tutorials in jupyter though, I did quite a bit
serene scaffold
steady basalt
Not sure who learns python in jupyter
I've met people who thought that jupyter is just how you write python 
shell crest
serene scaffold
I've met people who thought that jupyter is just how you write python <:tangerin...
This is more a proof of python beginner friendliness than anything. You don't get people doing this for the Ju and R, which are Julia and Rproject
steady basalt
It could make for@bad habits or misunderstanding
Especially for modules and the way things execute and store
serene scaffold
shell crest
I think relying on Google Colab is usable and your stance on it seems to disagre...
if google colab is ones best way to access GPU computation, I'm not going to tell them not to use it. but I don't think python beginners are in a position to understand the pitfalls of cell-based execution. and I think that's bad.
steady basalt
I got so sick of having cell based execution I’ve put about 1/3rd my entire thesis (a function which takes an input data and spits out results) in a single cell, may as well just use an actual ide
shell crest
There are definitely equivalents which force notebooks to 'work' on one pass through all cells sequentially
steady basalt
The weird thing is the boss has demanded we put all code in the word document and no code files allowed. How weird
serene scaffold
however, I do really like IPython, which I think is best of both worlds, in some ways. you can still get rapid feedback about what you're trying to do, but it doesn't come with the pretense of permanence.
shell crest
steady basalt
I got so sick of having cell based execution I’ve put about 1/3rd my entire thes...
How is a function 1/3 a thesis?
serene scaffold
shell crest
How is a function 1/3 a thesis?
they said one cell, not that they put all the code for their thesis in one function. there could be any number of function definitions in that cell.
steady basalt
its about 200 lines minimum
iron basalt
serene scaffold
however, I do really like IPython, which I think is best of both worlds, in some...
Closer to Wolfram Mathematica (we need to copy it more).
 zealous token
Hello
shell crest
steady basalt
and about 5 files of data prep
Why is it needed in the thesis? Appendix? Or even just refer to it indirectly
steady basalt
basically @iron basalt pre processing and modelling occurs in a single function and spits out metrics and plots
so you can say function(this_df) and it will do it
so you have not much code and can put any dataframe inside it
its way. better than having a shit load of un needed code
 mossy vortex
hello guys is anyone here familiar with pytorch??
steady basalt
shell crest
Why is it needed in the thesis? Appendix? Or even just refer to it indirectly
they want u to put in appendix all the important code, but i wrote too much to fix in a 50 page document so im only including the best bits...
iron basalt
Another option is functional programming rather than Python, it all recomputes upon change.
zealous token
My dataframe was originally like this:
 iron basalt
(Lazy-eval)

Enso is an award-winning interactive programming language with dual visual and textual representations. It is a tool that spans the entire stack, going from high-level visualisation and communication to the nitty-gritty of backend services, all in a single language.
shell crest
steady basalt
they want u to put in appendix all the important code, but i wrote too much to f...
Strange that a thesis is code-heavy...
steady basalt
shell crest
Strange that a thesis is code-heavy...
my thesis is 70% code mate
at least in terms of effort and time
zealous token
And then it turned into this
 steady basalt
a few thousand words outlining what i did is not that difficult, lol, coding it is
as im sure is the case for most similar papers
shell crest
Isn't the hot stuff in NeuRIPs about out of distribution stuff
steady basalt
i dont keep up with such
steady basalt
pandas
 unborn quartz
S
steady basalt
shell crest
Isn't the hot stuff in NeuRIPs about out of distribution stuff
actually its closer to a practical ml paper in the sense that its testing modelling and outcome on a dataset, nothing cutting edge (masters not postdoc)
zealous token
I have a question about pandas and sklearn in #help-lemon if anyone can help
shell crest
steady basalt
i dont keep up with such
In case you want to keep up
https://guoqiangwei.xyz/neurips2021_stats/neurips2021_submissions.html
steady basalt
interesting 😅 but im not currently plannign on entering acedmia
shell crest
lol I don't read most of them either
steady basalt
this the stuff id read if i was on a phd tbh
shell crest
But helpfully the stats themselves rank the papers
steady basalt
just finding and working a job has lower requirements ; )
that top paper is cheat codes for civ 5?
not gona read it all but from the abstract they didnt really mention how it works
shell crest
?
steady basalt
holy shit thats alot of maths
shell crest
TL;DR: We prove a poly-logarithmic regret bound for no-regret learners in general-sum games.
steady basalt
not gona lie, i cudnt understand it if i tried based on the equations
shell crest
Uhhhhh tbh IDK what's the implications of the paper. I understand most of the words but I'm not a game theorist
steady basalt
trying to skim read and find which game they played xd
shell crest
lol it's game in game theory
steady basalt
this a stats paper not a deep learning paper
how do you define a multi player general sum game?
its arbitrary ?
shell crest
Limitations And Societal Impact:
Looks good.
LOL
shell crest
steady basalt
how do you define a multi player general sum game?
Zero-sum game means the game sums to zero
For example rock paper scissors
The result of the game is that one winner one loser
steady basalt
yeah but in their paper dont they need to state exactly what they mean by that
rock paper scissors isnt coin toss
The m players play the game G for a total of T rounds.
they did
 shell crest
https://bcourses.berkeley.edu/courses/1454200/files/69784567/download
^ general sum games
steady basalt
i like how they just didnt give an actual english conclusion but just gave more equations
LOL
is that common?
shell crest
In general-sum games, there might be many Nash equilibria, with different payoffs.
^ why mathematically hard
shell crest
steady basalt
i like how they just didnt give an actual english conclusion but just gave more ...
The strength of the paper was clearly its technical contribution
steady basalt
yeah but, for people like me who would like a nicely written conclusion it helps alot when bombared with shit loads of notation
shell crest
Well that's why the reviewers also gave up on societal impact descriptions
steady basalt
 shell crest
Oh
steady basalt
how did no1 already write this paper 10 years ago?
shell crest
bcuz maff
 heavy crow
do you guys have any tips on where to get cheap GPU compute? I'm at a stage in my project where I would like to find some nice hyperparameters but training takes ~6h on my gpu!
serene scaffold
heavy crow
do you guys have any tips on where to get cheap GPU compute? I'm at a stage in m...
there's google colab
steady basalt
heavy crow
do you guys have any tips on where to get cheap GPU compute? I'm at a stage in m...
co lab id recommend against cause u get cut off after inactivity or running too long unless u pay 40 a month (also their gpus arente ven good)
i think u can get better served by aws or azure but ive nefver used them
heavy crow
yeah, I need something a bit more powerfull than google colab
im mostly memory bound atm
heavy crow
i was thinking lambda labs? they charge 1.1$/h for a V100
heavy crow
are there any compute sharing services out there? like folding at home but for deep learning?
steady basalt
I’ve never heard of folding at home
heavy crow
The Folding@home software runs while you do other things. While you are going about your everyday activities, your computer will be working to help us find cures for diseases like…