#data-science-and-ml
1 messages · Page 9 of 1
 wooden sail
 exotic thicket
Yup n inputs
wooden sail
i'm asking what do you mean by n inputs
exotic thicket
 wooden sail
the general idea is that if you have a function f : B -> A, then the number of functions f one can define is |A|^|B|. the codomain A here has cardinality 2, since we get a single boolean output. the cardinality of B is 2^n for n inputs, since those are all the possible binary inputs you can get out of n bits
 steady basalt
I’m sure this guy doesn’t need to be able to engineer neural networks in C tho, I’d say learning to use something like tensorflow would be a better start than learning 2 massive areas of maths
wooden sail
so that gives 2^(2^n)
steady basalt
It literally takes years to learn that in school
wooden sail
steady basalt
It literally takes years to learn that in school
learning math connected to an application is helpful for many, but as already discussed earlier today, learning math through coding is terrible
you'll do both slowly
steady basalt
No one shud learn math thru coding
wooden sail
that's diametrically opposite of what you just suggested though
steady basalt
I also think stuff like online courses are terrible too
 serene scaffold
steady basalt
I’m sure this guy doesn’t need to be able to engineer neural networks in C tho, ...
serene scaffold
steady basalt
I’m sure this guy doesn’t need to be able to engineer neural networks in C tho, ...
I never said anything about C? or programming languages in general?
steady basalt
wooden sail
that's diametrically opposite of what you just suggested though
I never said someone should learn maths thru coding
serene scaffold
neural network libraries assume that you know what you're trying to do. they're not intended to help you learn neural network theory.
wooden sail
then did you mean not to learn math at all?
steady basalt
I meant to the guy who wanted to start out, should probably learn the tools to use them BEFORE spending two years learning the entirety of calculus and linear algebra
wooden sail
you can hardly use the tools well if you don't understand them, that's backwards
steady basalt
At least you’ll be in a position to use them for something while you learn
serene scaffold
you don't need to learn "the entirety of calculus and linear algebra". these things don't have well-defined boundaries. and I even limited it to "derivative calculus".
steady basalt
wooden sail
you can hardly use the tools well if you don't understand them, that's backwards
Anyone could use these tools for a lot of tasks
Especially novice level takes
Without studying vector calculus
Or whatever
serene scaffold

steady basalt
It’s true though
wooden sail
to limited success
i'm not sure how you don't see this is exactly the position you're in
steady basalt
I’d say at least 50% of my class had zero math background when they took the final semester deep learning course and used neural networks just fine
That is why for starting out if you can at least use the tools first while you’re studying you aren’t in a position when you’re studying and unable to go code something to work
serene scaffold
and did the course teach them the principles from calculus and linear algebra that are pertinent to building and training a neural network, and understanding how it is that the weights are adjusted to approximate a function?
because if it did, then we're all talking past each other. and if it didn't, then they're eventually going to hit a wall in their progress.
steady basalt
Not at all, it went over it briefly but it wasn’t required to produce the coursework where they used neural nets to predict time series, computer vision or NLP
 mild dirge
My deep learning course just showed a bunch of formulas for finding the output shape after a convolutional layer
steady basalt
Yep lmao
mild dirge
Did not explain at all why the output shape is like that, or how it worked
Knowing how to use it is something different from understanding
steady basalt
And that’s why I said know how to use FIRST because it only takes a few weeks of learning to use. It takes months and months to years to understand fully for people
I’d never recommend anyone to be stuck like that until they truely understand as you say
mild dirge
I normally think bottom up works better than top down though
steady basalt
Bottom up is too slow and will leave people unemployed for multiple years
mild dirge
May be good to have used it once or twice to get why you are learning all this, but I think starting at the maths would be better than other way around
serene scaffold
you're saying that it would take "months and months and years" to learn derivatives and array arithmetic? I don't agree with this.
and if you get a CS degree, all these things are covered.
steady basalt
Ok so the average person who works 5 days a week and has let’s say 8-10 hours a week to study it - you realise this requires going thru precalc, optimisation, differentiation etc and that’s JUST calculus?
That’s literally about 500 pages of a test book with thousands of practise problems
I’d know because I am doing it
wooden sail
yes supermoon, but people study full time to learn this well.
steady basalt
I’m sure most people asking where to start being pointed at maths already have studied or have jobs
wooden sail
and the reality is that you're not gonna be amazing at AI without learning it well, so you have 2 options. stick to basic usage and slowly cover the content as you need it over the span of several years, or study it very heavily over the span of fewer years. you can't avoid having to study for years to be fluent at it and understand it well
steady basalt
I’m not saying you shouldn’t do it or I’d be a hypocrite, I’m just saying it may be more productive to introduce yourself to the tools first and what you can do
mild dirge
Yeah but you' d be bad at solving problems if the tools don' t do exactly what you expect
steady basalt
What you said is true, but option1 allows you to work as a DS at the very least while option2 doesn’t
wooden sail
i would really strongly suggest not to do DS if you don't know what you're doing. as it is, most results are wrong, not reproducible, or both, and the reason is exactly this
steady basalt
I’d rather spend 2 years as a bad data scientist then forever as a good one than 1 years as not a data scientist then forever as a good one
Simply due to the job market here
serene scaffold
how are you expecting to get a job as a bad data scientist?
steady basalt
Not bad to me, but bad to edd for example
I’m just trying to frame it for his perspective
wooden sail
if the market is competitive, all the more reason to be good at it first
steady basalt
What do you suggest? I hand my thesis in 3 weeks, work full time in an office doing nothing but excel and phone calls while trying to grind this shit at night and weekends until I can get a job?
Because that’s all I got right now
mild dirge
your bachelor thesis?
steady basalt
Masters
wooden sail
to get a job in something closer to what you studied and actually know, and keep practicing this on the side until you're good
mild dirge
You can probably do something that fits your master then surely'
steady basalt
That’s the problem, I’d have to spend that time on the side unrusting SQL and python for interview exams as well as machine learning stats - which wouldn’t exactly leave any room for the maths I’m also expected to know
 lapis sequoia
hi. I want to plot data in 4 dimensions....X,Y,Z and time. Please suggest me best python library for the task. I need it for my college project. Sorry to disturb your serious chat with my childish question.
mild dirge
Also don' t really get the "grind this shit", isn' t this something that you find fun to learn about and practice with?
steady basalt
Not to mention that it’s exhausting as it is and would probably stretch my relationship
wooden sail
my question is still, why are you looking for something so unrelated to what you studied
steady basalt
mild dirge
Also don' t really get the "grind this shit", isn' t this something that you fin...
When you get home from work things do stop becoming fun when you’re tired
 civic flame
Hello data science people.
mild dirge
Not saying every part about it is fun, but you should at least have some kind of passion if you are really motivated to work as DS
wooden sail
or why did you study something you didn't wanna do/ wasn't gonna help you reach your desired job
steady basalt
wooden sail
my question is still, why are you looking for something so unrelated to what you...
I have a part time job right now I’m going to take full time until I land one
steady basalt
mild dirge
Not saying every part about it is fun, but you should at least have some kind of...
Yeah I do
serene scaffold
lapis sequoia
hi. I want to plot data in 4 dimensions....X,Y,Z and time. Please suggest me bes...
your question is fine. but the problem is that you can't make a four-dimensional plot, as we are three-dimensional beings. but you can plot up to three dimensions at a time.
mild dirge
Then it shouldn' t feel as grinding
steady basalt
steady basalt
That’s the problem, I’d have to spend that time on the side unrusting SQL and py...
This is the crux of it really
mild dirge
serene scaffold
your question is fine. but the problem is that you can't make a four-dimensional...
Maybe 3d plot with colors?
Or a slider for the 4th dimension
serene scaffold
mild dirge
Maybe 3d plot with colors?
hmm, that could work
mild dirge
You can make interactive plots with matplotlib, so if one of the dimensions is time f.e., you make a slider to look at a specific time
lapis sequoia
but I read in an article that ML algorithms like K nearest neighbour etc use n dimesntional graph for classification problem. Cn't I use the same method?
steady basalt
Do you think it’s a smarter decision to go unemployed for a few months so I can get a data science job if I can afford to?
Studying and practising full time
mild dirge
lapis sequoia
but I read in an article that ML algorithms like K nearest neighbour etc use n d...
You're talking about a plot though
visualizing the data
wooden sail
the maths can be done in arbitrarily many dimensions. plotting it is a different matter 😛
serene scaffold
lapis sequoia
but I read in an article that ML algorithms like K nearest neighbour etc use n d...
in data science (and computer science in general), a graph is a model for entities and relationships. and a plot is a data visualization.
steady basalt
I’d legit do that if it didn’t raise questions on my cv like “why are u not employed” looks really bad
lapis sequoia
mild dirge
You can make interactive plots with matplotlib, so if one of the dimensions is t...
see the problem is I am trying to plot a trajectory so...
mild dirge
steady basalt
Do you think it’s a smarter decision to go unemployed for a few months so I can ...
What master are you completing now
steady basalt
mild dirge
What master are you completing now
DS related
mild dirge
Which is?
wooden sail
you could also compute a projection of the trajectory in 4D onto a 2D plane
steady basalt
There’s only 3 unis that have it here and I’m not willing to divulge that
Do u think if I spent full time preparing for interviews it would be worth doing when my linkedin and cv will be unemployed and I’ll have to explain to HR that I’m not working since graduating which they all get snobby about
The only reason I’m at this deadend job is because they allowed me to title data analyst which lets me get in the door to DS with the experience
wooden sail
gaps in CVs are fine as long as they are explainable. an explanation like "i had some gaps from uni that i decided to patch myself before looking for a job" is a perfectly valid explanation
steady basalt
I hope ur right, do you have a take on whether or not I should do it or continue working full time
lapis sequoia
wooden sail
you could also compute a projection of the trajectory in 4D onto a 2D plane
see I will need the x y z coordinates for distance and time for keeping track of time so that I could compute velocity, acceleration etc. So is it possible using 2D method?
wooden sail
that's up to you. one option is ofc riskier than the other, idk how much you believe in yourself or how difficult it is to find a job closer to what you studied instead of DS
wooden sail
lapis sequoia
see I will need the x y z coordinates for distance and time for keeping track of...
if one dimension is time, why not make an animation
lapis sequoia
data may look somethink like this (1.5,6.5,2.0,0.01)
steady basalt
wooden sail
that's up to you. one option is ofc riskier than the other, idk how much you bel...
I studied DS, I want to work in DS
wooden sail
it... doesn't sound like you studied DS tbh
lapis sequoia
wooden sail
if one dimension is time, why not make an animation
i want to. but dunno how to
 mint palm
but when applying without referral they can cause problem if gap is noticeable
steady basalt
wooden sail
it... doesn't sound like you studied DS tbh
I did so without math background, yup
mint palm
other candidate might be higher priority
steady basalt
Only stats
wooden sail
stats is math background
steady basalt
Ok, without linalg and calculus hence why I’m learning calculus now
Maybe I shud negotiate with my boss to work only 4 days a week to leave a full day for interview prep?
wooden sail
that sounds like a good option
steady basalt
I promised full time but I think it’s the BEST option for me
An entire day a week for coding and math
It’s adequate
Yeah, ok I’m gona do it, I’ll dump it on the boss when I start 😅
Hope he isn’t mad
lapis sequoia
@wooden sail can you please tell me the best library for my need. I googled it and it seems there are many animation libraries. https://kandi.openweaver.com/collections/python/python-animation
I do want a 3d graph structure that gives coordinates given out by the equations of a parabola's solution. (x,y,z will be the solutions of the equations)
Build interactive Python applications, animate elements, elegant UI effects. Get ratings, code snippets & documentation for each library.
Sorry for mentioning you. Hope you wouldn't mind. 😄
exotic thicket
steady basalt
I’m sure this guy doesn’t need to be able to engineer neural networks in C tho, ...
Just got confused I'm taking a course on Deep learning which has kinda same curriculum prerequisites are same almost is that a worth learning it?
exotic thicket
wooden sail
learning math connected to an application is helpful for many, but as already di...
Through coding. Means?
steady basalt
exotic thicket
Just got confused I'm taking a course on Deep learning which has kinda same curr...
Lol, entirely depends on how many of them you meet
If you don’t I’d recommend against the course at all and go for a normal ML or stats course else you’ll have to spend a large amount of effort learning just prerequisites
Unless what steralcus said is possible, skipping just to the meat
Maybe it is if you’ve done precalc and algebra
@desert oar

@serene scaffold ur names a twister
exotic thicket
steady basalt
Anyone could use these tools for a lot of tasks
What are the drawbacks if we learn to use only those tools and libraries or whatever without knowing mathematics
steady basalt
i think edd outlined that before
serene scaffold
exotic thicket
What are the drawbacks if we learn to use only those tools and libraries or what...
you'll eventually reach a point where you can't meaningfully progress without understanding the math that underpins what you are doing.
there are domains of programming where "learn by doing" is the way to go, but unfortunately, data science isn't really one of those.
@worldly haven you already posted this. this server really isn't the place.
exotic thicket
serene scaffold
there are domains of programming where "learn by doing" is the way to go, but un...
Which one of those, is for DS in ur POV?
serene scaffold
exotic thicket
Which one of those, is for DS in ur POV?
I don't think I understand the question.
 wind citrus
hi i have an question , im newbie in python . i created my own space invaders game but i want to do now something what is beyond my understanding . I want to create an python program that wil play my space invaders game and keeps improving own skill
is there some one who can help me
exotic thicket
Sorry I mean u said to learn by doing in programming. But How can we approach learning in DS
wind citrus
hi i have an question , im newbie in python . i created my own space invaders game but i want to do now something what is beyond my understanding . I want to create an python program that wil play my space invaders game and keeps improving own skill
is there some one who can help me
steady basalt
in what world do data analyst jobs ask you to do that
thats alot of work for a take home
 worldly haven
steady basalt
in what world do data analyst jobs ask you to do that
worldly haven
steady basalt
in what world do data analyst jobs ask you to do that
in my world , i guess
yes it is
steady basalt
I’d flat out refuse
worldly haven
i have a deadline untile friday 3 pm
steady basalt
Apply elsewhere
If any take home takes more than 3 hours I’d say no thank you
Else, what if all 50 positions I apply to that week ask for a take home?
steady basalt
You have to do it alone sadly, you chose to say yes to that
serene scaffold
!warn 843129353247916042 Please stop posting this survey. This server is not the place.
 arctic wedgeBOT
:incoming_envelope: :ok_hand: applied warning to @worldly haven.
 prime kite
How do I make a loop/if statement to change the multiplier (1 & 2) based on the residual mean and deviaiton?
 steady basalt
serene scaffold
!warn 843129353247916042 Please stop posting this survey. This server is not the...
steady basalt
serene scaffold
!warn 843129353247916042 Please stop posting this survey. This server is not the...
it was a survey? lmfao?
thought he said it was a takehome
serene scaffold
steady basalt
it was a survey? lmfao?
whatever it was, this channel is not a community notice board for data scientists.
serene scaffold
prime kite
How do I make a loop/if statement to change the multiplier (1 & 2) based on the ...
!code
arctic wedgeBOT
Here's how to format Python code on Discord:
```py
print('Hello world!')
```
These are backticks, not quotes. Check this out if you can't find the backtick key.
prime kite
    #return datetime.strptime(s, '%m/%d/%Y %H:%M') old dating
    return datetime.strptime(s, '%Y-%m-%d %H:%M:%S EDT')


main_data = pd.read_csv('Data Report.csv', parse_dates=[0], index_col=0, date_parser=parser)

coltwo.index = pd.to_datetime(coltwo.index) #indexes the time
coltwo = coltwo.asfreq(pd.infer_freq(coltwo.index)) #period between each time recording (so 15 mins)
main_data.columns
x = main_data.Research_I_AHU_4_COOL_VALVE
stl = STL(x, period=12)#period is very important here! STL function

stl_data = stl.fit()
seasonal, trend, resid = stl_data.seasonal, stl_data.trend, stl_data.resid
redsidual_mean = resid.mean() #mean of the residual graph
residual_dev = resid.std() #stdev of the residual graph

upper_bounds = redsidual_mean + 2*residual_dev #for room temps
lower_bounds = redsidual_mean - 1*residual_dev

anomalies = x[(resid < lower_bounds) | (resid > upper_bounds)]
print(anomalies) ```here is the full code
My data has multiple columns with data I want to apply my anomaly detection to, but the upper/lower bounds multiplier to see anomaly changes on the dataset I observe
 prime kite
not really, I just removed the name since it contains Research stuff
but it does contain a space yes
wind citrus
why everyone ignores me 😦
mild dirge
yh jeez, I wonder..
 echo oracle
hey, anyone knows any good content to learn API for data science?
or is anyone good at it here?
mild dirge
what API?
echo oracle
how to use APIs in general, mostly spotify's api it looks interesting
mild dirge
Doesn' t really seem data science and AI related, but there is probably a guide on that specific API somewhere
 harsh stump
Guys, i'm searching for a reliable resource where i could learn ML and Ai basic concepts for a starter, any help please?
 candid garnet
currently plotting how magnetic susceptibility changes with resonance frequency.
Right now i've got frequency without demagnetising effects (ignoring imaginary component for the sake of this message):
omega_0 = gamma * mu0_H
It generates a nice plot, which is the first image where the bright lines touch nicely.
Then I add demagnetising effects:
omega_0 = gamma * np.sqrt(mu0_H**2 + mu0_H*mu0_M)
big ugly white gap appears (second image) - must be to do with addition of arrays or something
mu0_H is just np.linspace(-0.3,0.3,1000)
curious to know if anyone has seen this issue before where adding an array to itself within square root causes a shift in the x axis?


also - mu0_M is just the value 0.1
mild dirge
Free solve for a variable calculator - solve the equation for different variables step-by-step
 earnest widget
candid garnet
currently plotting how magnetic susceptibility changes with resonance frequency....
earnest widget
candid garnet
currently plotting how magnetic susceptibility changes with resonance frequency....
This looks similar to yours: https://stackoverflow.com/questions/70719018/how-to-fix-white-gaps-in-spectrograms-when-converting-wav-files-to-spectrograms

Stack Overflow
I'm trying to convert .wav files to spectrograms using matplotlib (plt.specgram). It worked, but there are some big white lines passing vertically through the spectrogram. I looked at the samples a...
steady basalt
mild dirge
https://www.symbolab.com/solver/solve-for-equation-calculator/solve%20for%20x%2C...
Shiet
Ok I got it
Keep forgetting the ln rule
How about @mild dirge
7^x+2 = e^17x
I got stuck at (x+2)ln7 = 17x
I keep getting 0.29 instead of 0.26
Now 0.125
2ln7 = 17x-xln7
 normal hazel
Hello
I'm looking for a help to plot a graph with these data set https://pastebin.com/raw/5PExbmg4 Any help would be highly appreciated.
mint palm
where can i read about negative learning?
I have gone through the medium's article but it only discuss about multiclass problems and wont work on binary classification
normal hazel
Could anyone help me to plot this on x and y axis https://pastebin.com/raw/KfwtCwzS
 zealous badger
hey so i have an image dataset, and pretrained models for that dataset. I want to use that model to recognize/classify an image i give, based on that dataset. (the dataset contains images of plants, so basically a plant recognition system). How do i do that?
 sacred narwhal
hi guys any tips on this?
 sweet skiff
Yo I'm getting started with Data Science in python. Is there a road map/ books/ courses you would wanna recommend me
I'm clueless
steady basalt
@desert oar

what do u think? I am not leaking data either
0.883317 0.606296 0.805674 -0.187055 0.850981 0.868287 -0.799168 0.877632 0.743357 -0.235376 pearson correlation from features for the outcome lol
        1.        ,  0.04960882,  0.01724806, -0.89202949,  0.02987733,
        0.02846023,  0.05685683,  0.82523878,  0.13970921,  0.13110077,
        0.02987733,  0.01724806,  0.01724806,  0.02987733,  0.07981701,
        0.02313463,  0.01675319,  0.05176375,  0.05176978,  0.06335478,
       -0.89202949,  0.7938064 ,  0.18332827,  0.14817702,  0.10113569,
        0.14632494,  0.06013562, -0.00548147,  0.01176825,  0.81869842,
       -0.89202949,  0.02846023,  0.02840824,  0.18628404,  0.19189974,
        0.01675319, -0.89202949,  0.38060212,  0.34422077,  0.36645048,
        0.21624932,  0.29920935,  0.25797119,  0.58005985,  0.03297744,
-0.89202949, 0.17292039, 0.1701276 , 0.00812562, 0.5119641 ])``` after get dummiesfound the problem
 desert oar
steady basalt
<@389497659087650836>
desert oar
steady basalt
<@389497659087650836>
that is quite a big difference from before. what changed?
steady basalt
I fixed that problem in my pre wo rk
I will post results now

this is on a new dataset
significantly better imo
To calculate relation between two entities, can you think of any measurement other than distance? how would you answer this interview question
do they mean correlation?
wooden sail
my answer would be "your question is ambiguous" because there isn't a single definition for distance, and many useful metrics are precisely that, metrics, meaning they satisfy the conditions one usually associates to distance
steady basalt
sick of these companies tbh
wooden sail
correlation, since you brought it up, is a weighted version of the usual l-2 norm
steady basalt
so trhat is
wooden sail
they're both inner products, and the same one at that, just setting the weighting function to 1
steady basalt
distance
wooden sail
that's euclidean distance, one form of distance
steady basalt
thats a hard question to answer then, and a company will soon interview me and ask this kinda shit after 2 rounds of python live exams
the HR person kept asking me if i had experience with bayesian statistics too
wooden sail
heh, then the answer really is along the lines of what i just gave you
wooden sail
it's not that there isn't an answer, it's that the question is super broad and poorly worded, and has many answers
steady basalt
what sort of bayesian statistics interview questions can they ask me?
im scared af
wooden sail
state bayes' theorem and apply it given some info
 fiery dust
should I learn PyTorch from here https://www.youtube.com/watch?v=GIsg-ZUy0MY or from here https://pytorch.org/docs/stable/index.html
or from where?
wooden sail
or interpret it in your own words
steady basalt
so like, card and dice questions?
wooden sail
i was thinking more along the lines of "what is a pdf? what is a likelihood function? what are prior and posterior probabilities? what's maximum a posteriori"
steady basalt
really gona need a pen and paper ready they gona ask me actual quetsions
pdf = portable document format
or probability density function
wooden sail
what do you think lol
steady basalt
tn 389 fp 355 fn 95 tp 151
how would you go about reducing false positives without increaseinf alse negatives
use a probability threshold?
 glad heath
steady basalt
how would you go about reducing false positives without increaseinf alse negativ...
glad heath
steady basalt
how would you go about reducing false positives without increaseinf alse negativ...
You need to see how far are from the threshold to understand why there are so many false positives.
You can move the threshold or you can make another model focused on these cases making an ensemble (a sort of adaboost).
 steady basalt
glad heath
You need to see how far are from the threshold to understand why there are so ma...
steady basalt
glad heath
You need to see how far are from the threshold to understand why there are so ma...
ive used xgboost and random forest and logistic
whats the best tool to get this done?
desert oar
steady basalt
I fixed that problem in my pre wo rk
what was the problem?
desert oar
steady basalt
```To calculate relation between two entities, can you think of any measurement ...
i would ask for more clarifying information. what kinds of entities are they and what information do i have on them? what do i want to do with these distances?
steady basalt
desert oar
what was the problem?
can you see i have too many FP's
need to reduce that alot without increase FN
sklearn binary uses 0.5 threshhold
desert oar
steady basalt
sklearn binary uses 0.5 threshhold
use predict_proba to get the prediction scores (i hesitate to call them "probabilities" with a random forest) and then you can look at how the confusion matrix quantities change as you vary the threshold
fiery dust
what do you think is better, pytorch or tf?
desert oar
you might also want to use a "proper scoring rule" like brier score to evaluate the prediction scores themselves, to see if the scores at least make sense
steady basalt
ill have to look how to check the threshold within my pipeline to ab test this and then set it as a specific threshold for each dataset. lol.
steady basalt
desert oar
you might also want to use a "proper scoring rule" like brier score to evaluate ...
im using matthews
desert oar
are you using matthews now instead of f1? that's probably a good choice
desert oar
matthews is still computed on the confusion matrix, i.e. the result of classification
i am talking about a proper scoring rule computed on the class scores before choosing a specific predicted class
steady basalt
if you have 2 datasources each with 9 csv's its gona require some good coding within my pipeline function to change thresholds for each to optimum
desert oar

In decision theory, a scoring rule provides a summary measure for the evaluation of probabilistic predictions or forecasts. It is applicable to tasks in which predictions assign probabilities to events, i.e. one issues a probability distribution
    F


{\displaystyle F}
as prediction. This includes probabili...
desert oar
steady basalt
if you have 2 datasources each with 9 csv's its gona require some good coding wi...
if you use predict_proba instead of predict, you will get an array of class prediction scores and you can just compute the quantities you need in a loop
steady basalt
the problem is its likely going to require differnt threshgolds for all 18 datasets
and im doing this in 1 single coverall function
desert oar
18 datasets?
steady basalt
yeah.....
steady basalt
2 datasets turned into 18
im workong on the first one right now
i mean theyre all from the same place
a=shap.plots.waterfall(shap_values[0])
return display(a)
btw, do u know how to make thjis work?
i can show matplot libs just fine
with return fig
mint palm
after reading the paper deeply, i feel enlightened, lmao
It seemed a fuss at start BUT 🧠.
normal hazel
Hello anyone around?
mint palm
normal hazel
Hello anyone around?
yup
normal hazel
I need a help in plotting a data using pandas. Basically i would like to make an interval from 1 to 1048577 on Yaxis. here is the details https://pastebin.com/raw/KfwtCwzS
I have used this constant_df.plot(y='n',ylim=(0,1048577), ylabel ="Input", x ='times',xlim=(-2,5), kind = 'line')
But i'm unable to figure it out which parameter would be to divide Y axis on certain interval https://pandas.pydata.org/docs/reference/api/pandas.DataFrame.plot.html
yticks ?
desert oar
@steady basalt i suggest reading this question and its comments https://stats.stackexchange.com/questions/585109/evaluating-smote-performance

Cross Validated
I have a multi-class problem with highly imbalanced data. The 1st and 2nd classes are 4-5x greater than the 3rd class. Since I am planning to run predictive models, I am using smote technique to up
steady basalt
@desert oar again im having the issue where precision is reflecting the class ratio
so if theres 30% class1 im getting 0,3 precision fori t
sacred narwhal
Hey guys any tips on this?
normal hazel
any solution guys?
steady basalt
@desert oar brier score 0.25
 unique flame
sacred narwhal
Hey guys any tips on this?
unique flame
sacred narwhal
Hey guys any tips on this?
If you just want "spot/no spot" then a classification algorithm. If you want the pixels than image segmentation.
steady basalt
tried changing the prediction threshold, no good
tn 11446 fp 4829 fn 120 tp 146
dammnnn
it doesnt really know much of the difference c
clearly theres alot of 0s that look like 1s
or 1s tha tlook liek 0s rather
 north laurel
hi. pythonistas who work as blockchain data analysts what tools do you use?
 torn shell
yo
serene scaffold
north laurel
hi. pythonistas who work as blockchain data analysts what tools do you use?
That's a thing?
earnest widget
fiery dust
what do you think is better, pytorch or tf?
I have only used TF for my GPU and I can say it's a pain because of the setup. Idk about pytorch, not used it.
 misty flint
@serene scaffold hes not wrong 

nbdev apparently is a counterpoint to these arguments though

i heard some interesting about quarto previously
mostly that it allows for 4 languages to be used
python, R, julia, and observable.js (lol)
mfw you cant escape hidden javascript frameworks
not even in DS
serene scaffold
misty flint
nbdev apparently is a counterpoint to these arguments though <:kekHands:94869794...
"counterpoint: we're so addicted to being able to see various intermediate states that we insist on notebooks, even though all these issues are necessarily part of how they work."
(I guess out-of-order execution artifacts aren't an issue if you reset the kernel every time and start over. but who does that?)
desert oar
misty flint
<@253696366952316929> hes not wrong <:kekHands:948697940711587900>
- true
- meh, don't be an animal
- nbdime does a good job, this is also the fault of the notebook format and is a lot easier with e.g. rmarkdown
- literally the same as a python script, unless you're building interactive things in your notebook in which case you're talking about testing a gui app, which is hard no matter what
desert oar
serene scaffold
"counterpoint: we're so addicted to being able to see various intermediate state...
addicted? maybe, but so are generations of lisp programmers
i have no idea what nbdev is
oh, i see. it kind of turns jupyter lab into an ide with a test runner etc. https://nbdev.fast.ai/
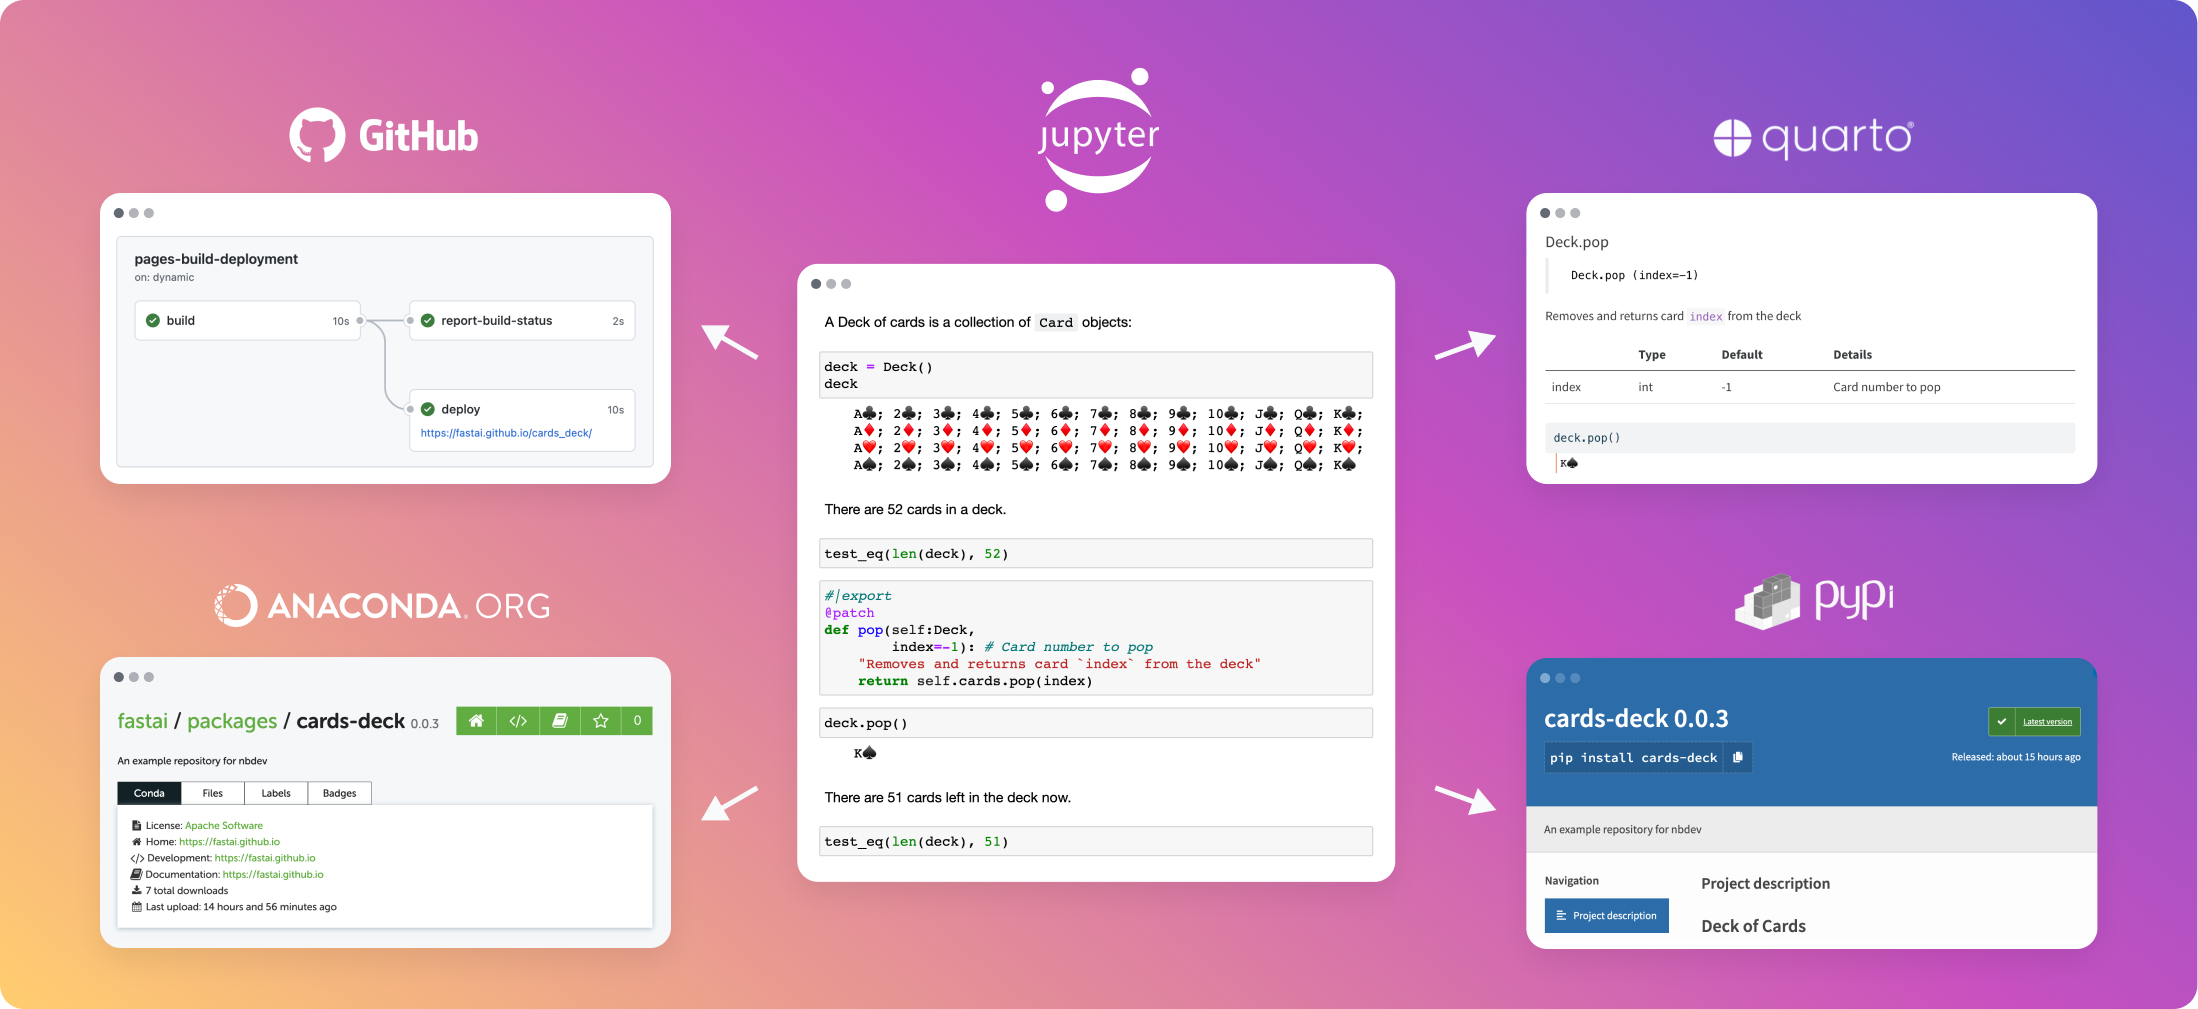
Write, test, document, and distribute software packages and technical articles — all in one place, your notebook.
serene scaffold
desert oar
addicted? maybe, but so are generations of lisp programmers
I grew up in a culture that framed a lot of things as "addictions".
desert oar
it is an interesting perspective
one could argue that being too dependent on interactive feedback is a bit like being too dependent on gps for navigation, and it kind of encourages you to avoid thinking about things like "design" and "structure"
but i think the benefits greatly outweigh the costs. there's a reason that pretty much all compiled languages at some point end up with some kind of interactive compiler or repl
 iron basalt
I would prefer a good debugger over notebooks. Then I can see all the intermediate states.
misty flint
desert oar
oh, i see. it kind of turns jupyter lab into an ide with a test runner etc. http...
yeah
serene scaffold
I pretty much always have an IPython repl open. but for anything that matters, I don't want it in a notebook. At pycon, I heard someone mention looking for the notebook they used to train the model they were using in production, and that sounds disasterous.
desert oar
to be clear, i wouldn't use a notebook for software development. but for day-to-day data science i can't imagine a better tool for the way my brain works. although i do agree that jupyter is a really primitive ugly interface. i will definitely be keeping my eye on quarto because i think r markdown is/was objectively better than the ipynb format. a gui frontend to r markdown would be ideal for me
misty flint
oh i forgot to mention the FSDL folks recommend just using the vscode extension so you get the best of both worlds
 desert oar
intellij has that too
desert oar
serene scaffold
I pretty much always have an IPython repl open. but for anything that matters, I...
again, a notebook is literally just a script with intermediate outputs
misty flint
its good for debugging too yeah
desert oar
notebooks are only bad because non-programmers use them
iron basalt
Jupyter notebook is just a bad debugger, change my mind, sips tea.
desert oar
it's a fucking great debugger
iron basalt
Relative to GDB, yes.
misty flint
iron basalt
Jupyter notebook is just a bad debugger, change my mind, **sips tea**.
oh i meant you can debug with vscode extension
 serene scaffold
desert oar
again, a notebook is literally just a script with intermediate outputs
serene scaffold
desert oar
again, a notebook is literally just a script with intermediate outputs
sure, but if I want to just treat it like a script (being able to view it at the terminal, edit it with vim, import it into something else), I don't want to have to do extra work to accommodate the fact that it's an ipynb.
iron basalt
misty flint
oh i meant you can debug with vscode extension
vscode's debugging experience is VERY primitive.
desert oar
the killer feature for notebooks with me is not that i need intermediate output, but that all of my previous results/outputs are sitting right there for me to refer back to later. literally the "notebook" metaphor.
and no other format that i know of has this feature
 iron basalt
desert oar
the killer feature for notebooks with me is not that i _need_ intermediate outpu...
iron basalt
desert oar
the killer feature for notebooks with me is not that i _need_ intermediate outpu...
Which good debuggers do, you can even save snapshots, and even revert back to them, replace the memory with that and rerun exactly as it was.
misty flint
desert oar
the killer feature for notebooks with me is not that i _need_ intermediate outpu...
yeah its good for sharing/explaining to others sometimes
desert oar
iron basalt
Which good debuggers do, you can even save snapshots, and even revert back to th...
true, and i would gladly abandon the notebook interface if someone made something better
iron basalt
desert oar
true, and i would gladly abandon the notebook interface if someone made somethin...
Yeah, right now it's what is there for Python at least.
I'm surprised that we are not always flooded with new debuggers from the OSS community.
desert oar
misty flint
yeah its good for sharing/explaining to others sometimes
and yeah i do that all the time. for informal presentations i don't bother making slides anymore, i just have my output cells highlighted and i can skip around in the table of contents, then easily do live coding if needed with all my stuff loaded
desert oar
iron basalt
I'm surprised that we are not always flooded with new debuggers from the OSS com...
my impression is that they're not easy to write. there was the time-travel debugger for python but idk if it's still maintained, i think it was a pet project at some tech company
iron basalt
iron basalt
I'm surprised that we are not always flooded with new debuggers from the OSS com...
Seems like it would be a huge priority given it affects the speed and quality of everything else.
iron basalt
desert oar
my impression is that they're not easy to write. there was the time-travel debug...
For compiled languages, not so bad, just annoying, but someone could write a good backend once and everyone could use that as an engine.
misty flint
good debuggers would be a good OSS project
iron basalt
Right now GDB is used for that, but it's not really good at all for that.
misty flint

iron basalt
And not for something like Python ofc.
desert oar
iron basalt
Yeah, right now it's what is there for Python at least.
not just python, but for data science in general. the rstudio 4-panel model is okay for poking around, but i really do need a way to connect "chunks of code" to "chunks of output" in a sensible manner. notebooks are the only tool i know of that lets me do that
iron basalt
What I want for Python is https://whitebox.systems/

Code debugging with instant feedback, visualise code behaviour alongside your favourite editor. Streamlined development - Try the Alpha today.
desert oar
oh that is cool
iron basalt
Can live poke / view memory, rewind, count iterations, view images that are in memory, etc.
desert oar
it is interesting that all the really powerful language tooling is still commerical and proprietary
maybe dataspell is the tool i really want
but ugh i do not enjoy working with the clunky intellij ide
misty flint
desert oar
not just python, but for data science in general. the rstudio 4-panel model is o...
this seems like it allows for many different formats https://quarto.org/
Quarto® is an open-source scientific and technical publishing system built on Pandoc.

weird. idk if i like this
iron basalt
(What is interesting about whitebox is that it can compile just the function you are trying to debug (in isolation) so it's fast and feels like scripting in Python with no compile times)
desert oar
iron basalt
(What is interesting about whitebox is that it can compile just the function you...
lisp can do that natively 😎
misty flint
iron basalt
What I want for Python is https://whitebox.systems/
oh this looks dope
desert oar
(but lisp kind of cheats because its compilation unit is the equivalent of a top-level statement)
desert oar
misty flint
this seems like it allows for many different formats https://quarto.org/
tbh this looks like r markdown but with a fancy web view and i guess support for multiple "source formats" is nice
iron basalt
What I don't understand is how whitebox did not exist a long time ago from the OSS community, for some reason Linux never got the good debugger (beyond 90s "good") memo.
misty flint
yeah it def has a certain use case for certain workflows i guess
desert oar
there's still no affordance for pairing chunks of input with chunks of output, and saving outputs to be easily recalled on-demand later
desert oar
misty flint
yeah it def has a certain use case for certain workflows i guess
it's for publishing, like writing blog posts and books
desert oar
iron basalt
What I don't understand is how whitebox did not exist a long time ago from the O...
oss gui apps in general suck (with some notable exceptions)
misty flint
ahh that would be a good use case
maybe quick presentations or something (to senior leadership)
desert oar
honestly whitebox is a steal for $70. i was expecting it to be $370
shit, i once considered paying for allegro lisp purely for hobby purposes and that shit is $600 base price, and it doesn't even include the odbc connector or the gui framework which cost extra $$$ in the enterprise packages
i even bought regexbuddy! you know you're getting old when you start paying for software
(although i regret regexbuddy because i can't run it on my work macbook)
i wonder if this is any good, looks like wine but for macos https://www.codeweavers.com/crossover

CodeWeavers
Don't buy a Windows license, don't reboot and don't use a Virtual Machine. Try a free trial of CrossOver to run your Windows software on Mac, Linux and Chrome OS.
misty flint
desert oar
(although i regret regexbuddy because i can't run it on my work macbook)
oooof
desert oar
hey, it runs great in wine at least
i've come to appreciate commercial software because it's not janky. i never want to pay for intellij because it all feels so janky, like it's about to just fall apart at any second
hence i'm not really interested in trying dataspell even though it might be exactly what i want re: notebooks
lapis sequoia
Alright! I am interested in developing a basic AI, using PyCharm. Where do I start?
iron basalt
lapis sequoia
Alright! I am interested in developing a basic AI, using PyCharm. Where do I sta...
By defining the problem. What is the problem you are trying to solve? Does it even require AI?
lapis sequoia
iron basalt
By defining the problem. What is the problem you are trying to solve? Does it ev...
My end-goal is to have an AI similar to J.A.R.V.I.S. So, at the moment, learning the user's routine and accommodating for slight variation
iron basalt
lapis sequoia
My end-goal is to have an AI similar to J.A.R.V.I.S. So, at the moment, learning...
Have a goal that is not creating a fictional character. Something much more grounded.
A more specific task. Just one thing.
lapis sequoia
iron basalt
A more specific task. Just one thing.
Learning the user's browsing routine. For example, when I open Microsoft Edge, the AI will automatically load an assortment of tabs (quantity decided by the user) that fit my interests
iron basalt
lapis sequoia
Learning the user's browsing routine. For example, when I open Microsoft Edge, t...
So a recommendation system?
lapis sequoia
iron basalt
So a recommendation system?
Something more assertive, but along those lines, yes
iron basalt
lapis sequoia
Something more assertive, but along those lines, yes
Targeted advertising system?
Not sure what is meant by more assertive. Do you want it to force it upon you like some kind of advertisement virus?
desert oar
lapis sequoia
Alright! I am interested in developing a basic AI, using PyCharm. Where do I sta...
unfortunately "basic" AI is still quite "basic". and we are not yet at the point where you can just fire up a code editor and create one in a short amount of time.
we have absolutely nothing like jarvis from iron man in real life, at all, anywhere, let alone something you can whip up on your own (as opposed to in a well-funded research lab filled with brilliant people)
however, you can definitely write a tool that will recommend browser tabs based on things like time of day, what other tabs the user has open, etc.
iOS notably has features like this, e.g. it recommends opening spotify when you have headphones plugged in
iron basalt
lapis sequoia
Something more assertive, but along those lines, yes
A non-assertive recommendation system for sites to open on startup would be a very nice and realistic project to do.
lapis sequoia
desert oar
we have absolutely nothing like jarvis from iron man in real life, at all, anywh...
Google is getting closer each year
desert oar
lapis sequoia
Google is getting closer each year
i would avoid reading pop-sci and tech news hype articles about it
iron basalt
lapis sequoia
Google is getting closer each year
To give a frame of reference here. Making a robot that can walk on any terrain and learn / adapt to do so is REALLY hard and the current state of the art is pretty good, but it was done by multiple people that all have many years of experience (and with a 4 legged robot which is easier than bipedal).
desert oar
if you want to see an actual example of what we can do nowadays with relatively simple code, look at the "mcfly" tool
https://github.com/cantino/mcfly it's a shell history search tool that learns based on your recently-typed commands and the current working directory
GitHub
Fly through your shell history. Great Scott! Contribute to cantino/mcfly development by creating an account on GitHub.
iron basalt
iron basalt
To give a frame of reference here. Making a robot that can walk on any terrain a...
Basically, we are not in that future yet where we can all just whip up an AI to do anything. We are currently working on getting there.
 lapis sequoia
desert oar
we have absolutely nothing like jarvis from iron man in real life, at all, anywh...
lapis sequoia
desert oar
we have absolutely nothing like jarvis from iron man in real life, at all, anywh...
Doesn't IBM have some advanced AI?
 barren wedge
How to increase accuracy using catboost?
 bold timber
What is the meaning of img.reshape(1, )?
 exotic thicket
 exotic thicket
exotic thicket
exotic thicket
How it's 8 for 3 input function? How'd it taken 8
wooden sail
bold timber
What is the meaning of img.reshape(1, )?
looks like it is appending an extra dimension of size 1
bold timber
wooden sail
looks like it is appending an extra dimension of size 1
Why when I change to img.reshape (2, ) it get an error?
wooden sail
bold timber
Why when I change to img.reshape (2, ) it get an error?
because you can reshape, e.g. a matrix of size m x n into a matrix of size 1 x m x n, this has the name number of samples (m * n)
however reshaping into size 2 x m x n requires 2mn samples
bold timber
wooden sail
however reshaping into size 2 x m x n requires 2mn samples
Does it means because I only generating 1 image, it should be used img.reshape (1, )?
wooden sail
that's one way of interpreting it, yes
bold timber
wooden sail
that's one way of interpreting it, yes
But why it also use + img.shape?
wooden sail
so, (1,) is a tuple
if you use + with a tuple, you append to it
img.shape is a tuple containing the size of your image, i.e. (m,n)
so (1,) + (m,n) = (1,m,n)
bold timber
wooden sail
so, (1,) is a tuple
Ok, thank you so much!
exotic thicket
exotic thicket
How it's 8 for 3 input function? How'd it taken 8
Someone plz help me out to clear this session
bold timber
wooden sail
so (1,) + (m,n) = (1,m,n)
does it means it only have 1 channel?
 subtle spoke
doing some data scraping on LinkedIn and the code seems to be flawless, but for some reason, this line doesn't work
Here's the part of the code in question:
# creating a list where the descriptions will be stored
desc_list = []
for i in range(1, 41):
    # click button to change the job list
    driver.find_element('xpath', f'//button[@aria-label="Page {i}"]').click()
    # each page may show a different amount of jobs
    jobs_lists = driver.find_element(By.CLASS_NAME, 'jobs-search-results-list') # creating a list with jobs
    jobs = jobs_lists.find_elements(By.CLASS_NAME, 'jobs-search-results__list-item') # selecting each job to count
    sleep(1)
    # the loop below is for the algorithm to click exactly on the number of jobs showing in the list
    # in order to avoid errors that will stop the automation
    for job in range (1, len(jobs)+1):
        # job click
        driver.find_element(By.XPATH, f'//div/div/div[1]/div[2]/div[1]/a').click()
        sleep(1)
        # select job description
        job_desc = driver.find_element(By.CLASS_NAME, 'jobs-search__job-details')
        #get text
        soup = BeautifulSoup(job_desc.get_attribute('outerHTML'), 'html.parser')
        # add text to list
        desc_list.append(soup.text)
the problematic line is this one:
driver.find_element('xpath', f'//button[@aria-label="Page {i}"]').click()
it goes fine for about 15 pages or so, but after a while the process stops and the following error shows up:
selenium.common.exceptions.NoSuchElementException: Message: no such element: Unable to locate element: {"method":"xpath","selector":"//button[@aria-label="Page 15"]"}```
the code worked for the first 14 pages, not sure what's up now. if anyone could shed some light on this it would help out a lotbut it's definitely there... the first time I ran this, I got the same problem with page 18... Idk what's wrong
 steady basalt
desert oar
to be clear, i wouldn't use a notebook for software development. but for day-to-...
steady basalt
desert oar
to be clear, i wouldn't use a notebook for software development. but for day-to-...
Not to mention the baggage that comes with browser
subtle spoke
subtle spoke
doing some data scraping on LinkedIn and the code seems to be flawless, but for ...
I made this change, hopefully it works now (how didn't I notice that before?)
driver.find_element(By.XPATH, f'//button[@aria-label="Page {i}"]').click()
 gloomy anvil
Does anyone of you speak German by any chance and can tell me what the mathimatical word for "difference-stationary" is in German when looking at timeseries?
subtle spoke
it went all the way up to page 30... tbh I think I'll just reconfigure the loop to run 30 pages instead of 40
selenium.common.exceptions.NoSuchElementException: Message: no such element: Unable to locate element: {"method":"xpath","selector":"//button[@aria-label="Page 30"]"}
maybe you'd like spyder
subtle spoke
turns out the issue was with the xpath...
this one works perfectly:
driver.find_element(By.XPATH, f'//li[contains(@id, "ember")]').click()
basically calling the button by its id instead of label
 stuck schooner
I am working on prediction model. It represent the amount generated by a merchant over a period of time. Either you can look at it through quantity and avg(gross_profit_per_quantity) or the factor of both gross profit.
Is there any advice on whether I should do a mutil-target model or a single target model ?
The features includes metric such as avg(gross profit per unit in the past xx months) which help to predict avg(gross profit per unit) but the model is not doing that great with quantity.
mint palm
When using reconstruction to detect anomaly detection, the output is classified as anomalous if reconstruction error surpass certain value.
but the value that is set as cut-off to decide anomolous/normal is equal to mean + standard deviation of reconstruction error of that data.
why is it mean + standard deviation ??
author says following but i dont get it:
 bold timber
Hi, I'm beginner to use tensorflow for process image data. What the meaning of 'metadata' in this code?
 torn shell
hello yall
i just modelled something very important that the world needs
this is called linoob

it is important
very powerful
what do you think?
 agile cobalt
torn shell
what do you think?
agile cobalt
torn shell
what do you think?
uhhh, that's offtopic at best
agile cobalt
no, more like, "here is not the place for that"
torn shell
oh ok i just saw coding stuff so i just wanted to show the world what i have done
sorry lol
agile cobalt
this channel is
For discussion of scientific python, matplotlib, statistics, machine learning and related topics.
(copy-pasting from the channel topic on the top of the screen)

 crimson walrus
Anyone here has complete road map for Data science from scratch
please share it in DM
 neat crescent
torn shell
i did this this tho and this is python
neat crescent
torn shell
i did this this tho and this is python
This is still off-topic for this channel. If you want to discuss Python more generally, you can visit #python-discussion. If you have a specific question want help with, you can ask in #python-discussion or open a Help channel via #❓|how-to-get-help .
serene scaffold
crimson walrus
Anyone here has complete road map for Data science from scratch
please share it ...
there's a book called "data science from scratch"
 proven mica
are there any libraries for creating chat bots . As in they have been already trained and are ready to spark a normal convo??
serene scaffold
proven mica
are there any libraries for creating chat bots . As in they have been already tr...
the problem with having a "general purpose" chat bot is that bots don't have any life experiences to draw from. it's more practical to make chat bots that "do something".
(and when you talk to people, you're pretty much always drawing from your life experiences. I'm having this conversation with you because I've spent years studying programming and human language tech.)
torn shell
neat crescent
This is still off-topic for this channel. If you want to discuss Python more gen...
i want to SHOW it not learn or ask questions not rude ment but i like to show the stuff ive done
neat crescent
Not on topic for this channel, still. As explained to you this channel is for a specific topic.
serene scaffold
torn shell
i want to SHOW it not learn or ask questions not rude ment but i like to show th...
this channel is for talking about data science and AI (that is, scientific computing), so please make sure that all of your messages are about that.
torn shell
serene scaffold
this channel is for talking about data science and AI (that is, scientific compu...
but where do i show my coding stuff?
steady basalt
serene scaffold
this channel is for talking about data science and AI (that is, scientific compu...
Or when edd is around, math
lapis sequoia
hi guys ive seen this code
not python
    // RGB to LMS matrix conversion
    float OnizeL = (17.8824f * input.r) + (43.5161f * input.g) + (4.11935f * input.b);
    float OnizeM = (3.45565f * input.r) + (27.1554f * input.g) + (3.86714f * input.b);
    float OnizeS = (0.0299566f * input.r) + (0.184309f * input.g) + (1.46709f * input.b);

    // Simulate color blindness
    float Daltl, Daltm, Dalts;

    if (Type == 0) // Protanopia - reds are greatly reduced (1% men)
    {
        Daltl = 0.0f * OnizeL + 2.02344f * OnizeM + -2.52581f * OnizeS;
        Daltm = 0.0f * OnizeL + 1.0f * OnizeM + 0.0f * OnizeS;
        Dalts = 0.0f * OnizeL + 0.0f * OnizeM + 1.0f * OnizeS;
    }
    else if (Type == 1) // Deuteranopia - greens are greatly reduced (1% men)
    {
        Daltl = 1.0f * OnizeL + 0.0f * OnizeM + 0.0f * OnizeS;
        Daltm = 0.494207f * OnizeL + 0.0f * OnizeM + 1.24827f * OnizeS;
        Dalts = 0.0f * OnizeL + 0.0f * OnizeM + 1.0f * OnizeS;
    }
    else if (Type == 2) // Tritanopia - blues are greatly reduced (0.003% population)
    {
        Daltl = 1.0f * OnizeL + 0.0f * OnizeM + 0.0f * OnizeS;
        Daltm = 0.0f * OnizeL + 1.0f * OnizeM + 0.0f * OnizeS;
        Dalts = -0.395913f * OnizeL + 0.801109f * OnizeM + 0.0f * OnizeS;
}```For daltonism
and i wonder if u can help me find a way to have x number of variables user can control
instead of having presets
to lets them adjust like they want
so like having another if
elif Type == 3:
# do something```first thing is since i need Dalt l,m,s, and each of them has different weights of Onize L,M,S
i need a total of 9 vars
but idk, seem too many. Cant it be done with less?
serene scaffold
steady basalt
Or when edd is around, math
math is part of that.
serene scaffold
torn shell
but where do i show my coding stuff?
crimson walrus
serene scaffold
there's a book called "data science from scratch"
Can you provide me pdf if you have it then?
serene scaffold
crimson walrus
Can you provide me pdf if you have it then?
no. the author deserves to be paid.
serene scaffold
crimson walrus
author name
!resources data science
arctic wedgeBOT
Resources
The Resources page on our website contains a list of hand-selected learning resources that we regularly recommend to both beginners and experts.
serene scaffold
it's on here
crimson walrus
Okai bro
north laurel
serene scaffold
That's a thing?
yes 🙂
steady basalt
Anyone can help me find the inverse of f(t)=1.04^t
agile cobalt
isn't it just math.log(y, 1.04)?
 hasty grail
steady basalt
Anyone can help me find the inverse of f(t)=1.04^t
hasty grail
steady basalt
Anyone can help me find the inverse of f(t)=1.04^t
this is kinda off topic, but it's literally just math (see above)
steady basalt
I’m very aware it’s math
I keep re arranging for x to get log(y)/log1.04
But it’s wrong
torn shell
serene scaffold
<#267624335836053506>
i cant send screenshots, sorry for disturbing and im not trying to be rude im really really sorry
 granite cloak
Hey guys, could i get someones help who knows rpy2?
 alpine nexus
steady basalt
I keep re arranging for x to get log(y)/log1.04
alpine nexus
steady basalt
I keep re arranging for x to get log(y)/log1.04
.latex
y=1.04^t
\
ln(y)=ln(1.04)^t=t*ln(1.04)
\
t=\frac{ln(y)}{ln(1.04)}
\\
t=log_{1.04}(y)
\
granite cloak
hard to find someone with rpy2 experience
torn shell
granite cloak
hard to find someone with rpy2 experience
agreed
alpine nexus
am I doing latex wrong
serene scaffold
alpine nexus
.latex
y=1.04^t
\\
ln(y)=ln(1.04)^t=t*ln(1.04)
\\
t=\frac{ln(y)}{ln(1.04)}
\\\\
...
looks like you're not using math mode with $ $
alpine nexus
.latex
$y=1.04^t\\
ln(y)=ln(1.04)^t=t*ln(1.04)\\
t=\frac{ln(y)}{ln(1.04)}\\\\t=log_{1.04}(y)\\$
 strange elbowBOT
 steady basalt
Oh. So lny/ ln1.04 is the same as log1.04y?
TIL
58logt is the answer according to my book
steady basalt
does anyone know how to show SHAP plots within a function? im getting NoneType when im trying to get_figure
show(0 doesnt work either
'NoneType' object has no attribute 'get_figure'
serene scaffold
steady basalt
'NoneType' object has no attribute 'get_figure'
do you know what this error message means?
steady basalt
shaps sourcecode isnt returning a matplotlib obj?
i rly need help on this one. try def(anything) and inside that returning a shap plot so you can see it
ive tried looking at their sourcecode to no avail
i can return a matplob lib plot i make, but not a shap.bar
'NoneType' object has no attribute 'show'
how annoying
serene scaffold
steady basalt
shaps sourcecode isnt returning a matplotlib obj?
it means that some prior expression in your code returned None. try stepping back through your code and figure out where that happens.
This is a common error message that you should be able to understand if you've been using Python for at least a few months.
steady basalt
a=shap.plots.waterfall(shap_values[0])
how tf isnt this returning a figure
shap.plots.waterfall returns a figure
do you know how to fix this?
or does this require js
serene scaffold
I don't have enough information to replicate how you got this error in the first place, and I don't really have time to.
steady basalt
GitHub
A game theoretic approach to explain the output of any machine learning model. - shap/_bar.py at master · slundberg/shap
its quite literally shap.plots.waterfall or .bar
but from within a function
i need to return it
let me try and return their function
lapis sequoia
Guys
I did ~(df.col.isna())
But still there's some Nan values that sprang up in the result
What might be the reason
 frosty current
Using TensorFlow, how can I normalize all the columns except one in a dataset with 12 columns.
In the docs, it seems I can only do one row at a time: https://www.tensorflow.org/api_docs/python/tf/keras/layers/Normalization
TensorFlow
A preprocessing layer which normalizes continuous features.
lapis sequoia
lapis sequoia
But still there's some Nan values that sprang up in the result
it is nan and not NaN
lst=df[~(df["Salary"].str.replace(".","").str.isdigit()|df["Salary"].isna())]["Salary"]```IS something wrong here
granite cloak
So does anyone know how to run an R script in python? using rpy2 or not
torn shell
granite cloak
So does anyone know how to run an R script in python? using rpy2 or not
no sorry im very new i started yesterday
 twin ravine
any good resources for neural networks? im trying to understand the implementation side of things
mild dirge
If you already understand how neural network work theoretically, and mathematically, you could use numpy to implement it
Numpy can do all the linear algebra operations you need
steady basalt
just use pytorch
twin ravine
mild dirge
If you already understand how neural network work theoretically, and mathematica...
maybe i need a refresher 😅 its not going well, any good resources you know for learning?
 twin ravine
steady basalt
just use pytorch
twin ravine
steady basalt
just use pytorch
i want to implement it myself
 white fable
I had a problem with filling Null values too
steady basalt
good luck
white fable
def fix_missing(df,col,name,nan_dict,is_train):
if is_train:
if is_numeric_dtype(col):
if pd.isnull(col).sum():
df[name+"_na"]=pd.isnull(col)
nan_dict[name] = col.median()
df[name] = col.fillna([nan_dict[name]])
else:
    if is_numeric_dtype(col):
        if name in nan_dict:
            df[name+"_na"]=pd.isnull(col)
            df[name] = col.fillna([nan_dict[name]])
        else:
            df[name] = col.fillna(df[name].median())
u can do it in python quite easily
white fable
white fable
def fix_missing(df,col,name,nan_dict,is_train):
if is_train:
if is_n...
TypeError: "value" parameter must be a scalar or dict, but you passed a "list"
mild dirge
twin ravine
i want to implement it myself
Do you know how numpy works?
You could make a class that is the "Network", then you have an initialization method in which you can specific the layer sizes
Then you make a forward pass method, that calculates an output for a given input
And a backwards pass, hopefully this backwards pass is the only method which you have to look up how to do exactly
The forward pass is pretty ... straight forward
And for starters you could just use Sigmoid or Relu only for all the hidden layers, and then sigmoid or softmax for the last layer
iron basalt
twin ravine
any good resources for neural networks? im trying to understand the implementati...
A machine learning craftsmanship blog.
mint palm
So i been noticing that my theoretical knowledge on ML is improving but, after recently attending ML discussions i have realized i dont quite understand the CPU/GPU configurations and stuff also the usage of threads and bit
Where can i learn more on that
 sleek tapir

UNSW Sites
MATH3191 covers the theoretical foundations that are required for the in-depth understanding of modern optimisation methods for data science.
wat do u gusy think of this
serene scaffold
sleek tapir
https://www.unsw.edu.au/science/our-schools/maths/student-life-resources/undergr...
can you give some context, please?
lapis sequoia
How do I get streaming privileges?
 dusty valve
lapis sequoia
How do I get streaming privileges?
dusty valve
lapis sequoia
How do I get streaming privileges?
if mr.hemlock is feeling particularly merciful today, he may bestow you with the video role for 3 seconds
serene scaffold
lapis sequoia
How do I get streaming privileges?
you pretty much can't get them.
also this is the data science channel
 gusty smelt
I have a data set of medium articles that I am trying to clean up (remove links and author names etc) I'm pretty new to python so I'd love some advice on how it is best to do this? Any help would be awesome!!
serene scaffold
gusty smelt
I have a data set of medium articles that I am trying to clean up (remove links ...
you'd want to use html parsing
which is a thing that I hate doing. but I'm sure you'll be great at it.
you can use beautifulsoup
 visual sphinx
ok so basically this is a .json file and say i want to update 6552254 under values and change what it is equal to which is "+0" right now to "+10" then save the json file can anyone help
 gusty smelt
serene scaffold
which is a thing that I hate doing. but I'm sure you'll be great at it.
gusty smelt
serene scaffold
which is a thing that I hate doing. but I'm sure you'll be great at it.
Even if the articles are already saved as plain text without any of the HTML tags?
serene scaffold
gusty smelt
Even if the articles are already saved as plain text without any of the HTML tag...
If the article is already plain text, then what cleaning even is there to do?
Like what does the plain text look like?
gusty smelt
serene scaffold
If the article is already plain text, then what cleaning even is there to do?
Sorry I didnt explain what I meant very well, here is an example of an article:https://pastebin.com/eBv9Zjpj
They are all littered with lines of text like "Photo by[Name] on Unsplash" or "Photo Credit to [Name]". Is there a way to scan through the article for rows of text starting with "Photo by" and just delete the one row of text?
Or any other fancy way of doing this? It dosent have to work on 100% of them but if I could remove most that would be aweosme
Pastebin
Pastebin.com is the number one paste tool since 2002. Pastebin is a website where you can store text online for a set period of time.
sleek tapir
serene scaffold
can you give some context, please?
sorry did a test
basically what do u think of htis course
serene scaffold
sleek tapir
basically what do u think of htis course
In what context would you be taking the course, if at all?
serene scaffold
I'll see if I can answer tomorrow
steady basalt
serene scaffold
can you give some context, please?
Drops link, doesn’t elaborate, leaves

sleek tapir
i havent done any ml
serene scaffold
sleek tapir
i havent done any ml
If that's the case, I don't know if this is the right course for you. Is there an intro to ml you can take?
sleek tapir
i done ml elsewhere not at uni
desert oar
wooden sail
maybe you'd like spyder
i tried it years ago and it felt like a sad rstudio imitation. i tried it again last week and it's wayyy better (nicer interface, more features and configuration options, support for jupyter kernels) but it kept crashing
i'm at the point now where if someone other than jetbrains made a "data science ide" that had a better UI around ipynb files, i'd buy it for sure
serene scaffold
sleek tapir
i done ml elsewhere not at uni
I don't know your life, so it's confusing if you say "i hvaent done any ml" and then qualify that with "i done ml elsewhere not at uni"
wooden sail
i see. i honestly don't mind much either way and just use what's at hand, but i will avoid recommending anyone use jupyter as much as possible
serene scaffold
sleek tapir
from andrew ng/islr
what degree are you seeking?
sleek tapir
math/cs
serene scaffold
sleek tapir
math/cs
do you have the option to do an ML/AI concentration?
serene scaffold
is this an elective that counts towards that concentration? or what?
desert oar
wooden sail
i see. i honestly don't mind much either way and just use what's at hand, but i ...
i still think jupyterlab is the best default for beginners who don't already have a preferred text editor etc, if an instructor is available to guide students in the "clean" usage of notebooks
and i think at least one homework assignment should require students to write some kind of standalone script/file rather than notebooks. get students introduced to both ways of working
wooden sail
given the amount of people i've seen struggle with spaghetti cells, i'll always disagree with the former
desert oar
well you can also require that the notebook be runnable from top to bottom as part of the homework submission criterion
"i will run this with nbconvert --execute and if it doesn't run you get a 0"
or "you must submit a plain .py script, here is how to use nbconvert to extract one from a notebook if you want to develop in a notebook"
i still think the interactivity and history tracking has tremendous pedagogical value, as much as i despise the clunky webapp that is jupyterlab (and jupyter notebook was even worse)
 distant iron
Hi everyone, I'm a DS that has been programming and modelling primarily in R with tidymodels. I'm looking to pick up sklearn and am currently reading Hands on ML with sklearn by Geron Aurelien.
Apart from the book, can anyone point me to some good learning resources? Preferably end-to-end tutorials where I can follow and code along. Thanks!
serene scaffold
distant iron
Hi everyone, I'm a DS that has been programming and modelling primarily in R wit...
!resources data science
arctic wedgeBOT
Resources
The Resources page on our website contains a list of hand-selected learning resources that we regularly recommend to both beginners and experts.
 rugged onyx
Hello guys as i have learn the Cnn algorithm after that what project should i do to advance my knowledge in CNN anyone ?? Could give me some suggestion plzz it would help me a lot
serene scaffold
rugged onyx
Hello guys as i have learn the Cnn algorithm after that what project should i do...
are you referring to convolutional neural networks?
 upper spindle
good resources to learn deep learning?
im currently using going through the mit DL youtube course, but would love to know any further resources that anyone else finds helpful
thanks in advance 🙂
 hearty token
How can I get a series from a pandas dataframe using the key?
hearty token
upper spindle
good resources to learn deep learning?
http://introtodeeplearning.com/ I find this to be very informative, although it's not really that beginner friendly
MIT Deep Learning 6.S191
MIT's introductory course on deep learning methods and applications.
steady basalt
tn 12035 fp 4240 fn 136 tp 130 anyone some advice on lowering fp and increasing tp?
desert oar
steady basalt
```tn 12035 fp 4240 fn 136 tp 130``` anyone some advice on lowering fp and incre...
you keep fishing for help like this, but every time someone tries to help you, you need to re-explain the whole thing and you force them to "interview" you for 20 minutes while you drip-feed them bits of relevant information. there is never a magic bullet, stop looking for one.
i have repeatedly suggested that you need to figure out why your model is fitting badly, and stop just looking at metrics and start investigating individual cases, looking at variable importance, etc.
and you keep suggesting that you're getting close to your deadline and so you don't want to try X or Y thing, but dropping cryptic questions hoping to get a magic "a-ha" answer that instantly solves all your problems is not going to help your thesis get done any faster, because no such answer exists
i suggest at this point that you talk to your advisor and not random people on discord
steady basalt

serene scaffold
steady basalt
<:pithink:652247559909277706>
Do you have any questions about what salt rock lamp has said? This is something we're going to hold you to in the future.
 zealous peak
hey guys, has anyone played with chatterbot here already?
I need to build a simple page where the user interacts with a bot to schedule a specific appoitment. So my bot needs to ask questions to the user and if it gets to the point of scheduling it, the bot needs to add an entry to my database properly scheduling the desired time, etc..
Do you know If I can do this with chatterbot or anyone has any other suggestions?
appreciate your help
serene scaffold
steady basalt
WDYM?
We're going to hold you accountable for asking reasonable questions in the future. Questions that boil down to "what magic bullet will improve my model, which I have told you nothing about?" are a waste of everyone's time, including your own.
Having to interview you for 20 minutes to get enough relevant details to help you--details that you should have provided initially--is a frustrating experience. And not something that I want our answerers to have to endure repeatedly.
steady basalt
If it helps, I get these results regardless of model
More or less
I’m almost sure it’s just the data
serene scaffold
what are every single one of those models? what are their hyperparameters? what is the training data, and what properties might be relevant to their performance? these are all details that should be expressed in your first message about the question.
steady basalt
Random forest and logistic regression, trained on patient data such as age,sex,ethnicity,blood pressure, classifying/predicting a condition occurring after having said readings, I’ve already tried tuning hyper parameters a bit, the data is very imbalanced and actually the precision is almost equal to the percentage of the data that is minority class
serene scaffold
Now we're getting somewhere.
steady basalt
Balancing training set doesn’t help it
So basically, model cannot really decide when it sees a minority class
serene scaffold
when you balance the training data, how many instances are there per class?
steady basalt
I’m getting over predictions for that class
serene scaffold
have you made a confusion matrix?
steady basalt
Before balancing, about 12000/100,000 for one set and 4000/30,000 for another, after smote equal of course, but it seems to be best to not balance and use class weight parameter in model
I have just shown u the matrix
Model sees something and tends to think it’s a majority negative class when actually it’s a minority positive class
On the imbalanced test set
As u can see the test set only has a few hundred positives
wooden sail
smote can only do so much. a lot of the predictive power of a network comes from approximately being able to represent unseen data in terms of the observed one. i would argue that most of smote's advantage comes mainly from SNR gains due to pairwise averaging. even in the original paper they use it by upsampling one class slightly and then either reweighting or downsampling the overrepresented class
wooden sail
probably, not that you can feasibly compute it
steady basalt
So 10xing somethings a bad idea
wooden sail
sounds like a great recipe for overfitting
steady basalt
What about doubling minority ?
serene scaffold
wooden sail
sounds like a great recipe for overfitting
We love that
wooden sail
i couldn't say, ideally you'd try several setups and keep the best
steady basalt
wooden sail
i couldn't say, ideally you'd try several setups and keep the best
ok, im going to look for a way to code that
gona try ENN
wooden sail
idk what enn means
iron basalt
serene scaffold
have you made a confusion matrix?
^ (it will guide you for these kinds of things)
desert oar
wooden sail
smote can only do so much. a lot of the predictive power of a network comes from...
also everything i read about smote suggests that it isn't a good idea and that its theoretical foundations are shaky at best
steady basalt
its a combined method that does smote then cleans the data with near neighbours or something
serene scaffold
steady basalt
I have just shown u the matrix
sorry, where did you show the confusion matrix?
steady basalt
serene scaffold
sorry, where did you show the confusion matrix?
tn 12035 fp 4240 fn 136 tp 130
serene scaffold
steady basalt
tn 12035 fp 4240 fn 136 tp 130
this is not a confusion matrix.
steady basalt
nani?
wooden sail
desert oar
also everything i read about smote suggests that it isn't a good idea and that i...
certainly, since all it is is convex combinations of the observed data. but depending on the noise statistics, it does provide an SNR gain... under the assumption that such convex combinations truly are valid data
serene scaffold
a confusion matrix has rows and columns for each class. let me get an example.
steady basalt
its a binary matrix
wooden sail
desert oar
also everything i read about smote suggests that it isn't a good idea and that i...
you can think of it as linearly interpolating the data, which can be reasonable in certain scenario
steady basalt
in this case 0 is negative and 1 is positive
 desert oar
wooden sail
certainly, since all it is is convex combinations of the observed data. but depe...
desert oar
wooden sail
certainly, since all it is is convex combinations of the observed data. but depe...
i was wondering if that's what it did. makes sense but yeah, i would be very skeptical of using it on this person's highly heterogeneous data with a relatively large number of features
iron basalt
desert oar
also everything i read about smote suggests that it isn't a good idea and that i...
Data augmentation is fine, but taking it too far when you have no samples will get you nowhere, still just need more data. As Edd wrote, it specifically helps with SNR.
steady basalt
i gave you the matrix in real values of both classes
desert oar
serene scaffold
a confusion matrix has rows and columns for each class. let me get an example.
to their credit, tn fp fn and tp are the 4 cells of a binary confusion matrix
steady basalt
I appreciate the credit, salt rock lamp
serene scaffold
desert oar
to their credit, tn fp fn and tp _are_ the 4 cells of a binary confusion matrix
I guess you're right. but those are kind of shit if you're doing multiclass.
steady basalt
@serene scaffold if i didnt mention it already, its a binary classification
desert oar
i happened to remember that they had a binary problem
wooden sail
the only thing i saw was you posting an IMAGE, of all things 
steady basalt
ill try next to cut down the class first
could be a case of overfitting if the model consistently predicts 1s instead of 0s
but gets 0s perfectly
could be detrimental to do smote on PCA'd Data
could be even more detrimental that ive PCA'd about 5 highly cardinal categorical features?
approx 50 binary features
serene scaffold
steady basalt
approx 50 binary features
perhaps you could drop some of the features? that seems like a lot.
steady basalt
serene scaffold
perhaps you could drop some of the features? that seems like a lot.
i just PCA the entire dataset at that point down to about 20
wooden sail
what are you calling PCA'd data here
steady basalt
it kinda just somehow merges the binaries into the continuous ones, but apparently its not 'wrong' to do that just less effective
steady basalt
wooden sail
what are you calling PCA'd data here
my 5 continuous features plus one-hot encoded ones too
wooden sail
that tells me nothing. you mean keeping the weights of the linear combination that (approximately) generates each data point? the projection onto the basis?
cuz doing smote on that does make sense
steady basalt
#     pca = pca.fit(X_train)
#     X_train = pca.transform(X_train)
# X_test = pca.transform(X_test)``` sort of thisok
steady basalt
bear in mind that X_train contains at this point mostly binary features, lol
wooden sail
that's usually good for PCA though, since that kinda naturally forms an orthonormal basis
wooden sail
actually, on second though, orthonormal though the basis might be, the linear combinations are not going to play nicely. interesting
if you wanna use pca, it makes more sense to use ints instead of one hot and do some rounding
steady basalt
what im running right now is NO PCA and a SMOTENC which is what theyve made for combined cont and cat data
doubt it helps
steady basalt
wooden sail
if you wanna use pca, it makes more sense to use ints instead of one hot and do ...
wdym?
wooden sail
instead of, say, usng a vector [1,0,0,0] to represent one of 4 categories, using a scalar in the range [0,3] and round when you don't get an integer value
this makes dealing with PCA easier, although you give up the niceness of having equidistant classes
steady basalt
would that help the problem of not learning the minority class?
well, not learning, but finding a good boundry to increase precision
is there a point where you can just blame the data? interestingly though, during cross vlaidation in my tuning pipeline, i get test scores of 0.7 f1.......
wooden sail
well, it reduces the parameter space and makes smote make more sense, i'd think it's worth a shot. i can't guarantee it'll work
steady basalt
i wonder how its possible to get 0.7 f1 on my training data
ah, it may be giving f1 for my. 0class
how weird
lapis sequoia

Can someone help
This is not giving me the desired output
I don't want the strings that are digits or -1
But it's returning true for everything
``` I made a temporary fix solution by this. But i still don't understand Why it was behaving that way thoughI would go by strings that match a regular expression instead
serene scaffold
-?[\d,]+ will match a string starting with or without a -, and then any number of digits for commas. and then perhaps you can figure out how to add the optional decimal place part.
lapis sequoia
I did use tons of regex just before that
serene scaffold
YAY
arctic wedgeBOT
Series.str.contains(pat, case=True, flags=0, na=None, regex=True)```
Test if pattern or regex is contained within a string of a Series or Index.

Return boolean Series or Index based on whether a given pattern or regex is contained within a string of a Series or Index.ah
great
anyways do you understand the other reason though
by raw python functions
serene scaffold
do I understand why your current solution doesn't work? no.
lapis sequoia
I think it has something to do with set theory
serene scaffold
it might be the order of operations with your ~ operator.
lapis sequoia
But I am so tired of it that I wanna move on
lapis sequoia
My dataset was taking so long to run because of it
pissed!
because it was appending all the rows insetad of a few
 tame patio
serene scaffold
just use regex
tame patio
serene scaffold
just use regex
what is regex
steady basalt
i shud probably go and ask them directly, but are you alowed to 'own' art generated with midjourney. i made this beauty by typing snailien
 serene scaffold
tame patio
what is regex
serene scaffold
tame patio
what is regex
pattern matching in strings
tame patio
oh
 serene scaffold
I like them
tame patio
steady basalt
i shud probably go and ask them directly, but are you alowed to 'own' art genera...
wow this is so beautiful
steady basalt
these r mine w midjourney
tame patio
how did you do this
steady basalt
join their discord for a free tiral
 serene scaffold
tame patio
how did you do this
serene scaffold
tame patio
how did you do this
there are AIs that are trained to generate images based on a natural language statement
steady basalt
I also have a link to a video generator which is in 'photorealism' style but its really scuffed, made my disco diffusion team but its not the art one
tame patio
serene scaffold
there are AIs that are trained to generate images based on a natural language st...
is it har to make one?
 lapis sequoia
Do you know how to achieve this
 serene scaffold
tame patio
is it har to make one?
serene scaffold
tame patio
is it har to make one?
yes, they require a lot of training data, and the training techniques are sophisticated.
steady basalt
you can freely get the data that theyve used
but theres no point making ur own really, its alot to code
serene scaffold
lapis sequoia
Do you know how to achieve this
it's the same mini-language for datetime
steady basalt
u can just use trained models on hugging face
serene scaffold
!docs datetime
arctic wedgeBOT
Source code: Lib/datetime.py
The datetime module supplies classes for manipulating dates and times.
While date and time arithmetic is supported, the focus of the implementation is on efficient attribute extraction for output formatting and manipulation.
lapis sequoia
serene scaffold
it's the same mini-language for datetime
I have a T letter in between
steady basalt
i have seen a guys own implimentation but its beyond my ability to code in pytorch
tame patio
steady basalt
but theres no point making ur own really, its alot to code
where can i find one already built?
steady basalt
see the. co lab i just linked
tame patio
ok thanks
steady basalt
if thats annoying to you, i can send u a web version
tame patio
nah its ok :)
steady basalt

Generate images using a variety of techniques - Powered by Discoart
Stelercus is my new prompt lets see
god dammit im outta free use
serene scaffold
that probably won't produce anything interesting, since the word "stelercus" probably never appears in the training data
serene scaffold
a query that would get results relevant to me would be "green programmer gay", or something.
serene scaffold
those were the days...
serene scaffold
not really. "green programmer gay".
remember, if the words weren't in the training data, they're meaningless to the model.
steady basalt
'gay runescape programmer'?
serene scaffold
no? are you not listening?
steady basalt
its just an idea
serene scaffold
well, do whatever you want.
steady basalt
i wonder what that would do
you can feed it nonsense and it will still try
context is best tho
tame patio
steady basalt
if thats annoying to you, i can send u a web version
yes please...
steady basalt
@serene scaffold I think with 5b parameters gay runescape programmer could lead to some good results
it also takes images too
its.. doing something..
almost half done
 serene scaffold
Wow, that's so me. /S
wooden sail
i mean, if you close both eyes and cough you kinda see an S
tame patio
why i get this: ⅹ Failed to determine if r8.im/nightmareai/disco-diffusion@sha256:3c128f652e9f24e72896ac0b019e47facfd6bccf93104d50f09f1f2196325507 exists: exit status 1
the link says page not found?
Generate images using a variety of techniques - Powered by Discoart
i took the code from here
 grave token
zero centered mean = (r - mean, g - mean, b - mean)
Here, For mean Do i have to sum the whole dataset and then divide it (sum/n)?
I have 29K image. Do i sum it by channel and the divide it by 29K?
steady basalt
 mild dirge
You'd have to sum each channel separately
np.mean(images, axis=(0, 1, 2))
@grave token
grave token
got it @mild dirge
model.add(Conv2D(filters=6, input_shape=12288)) # flattened 64x64x3
model.add(Conv2D(filters=6, input_shape=(64,64,3))) # RGB```Is it better to feed rgb image or flattened image to a tf model?A 2d convolutional layer does not make sense on 1d data
So by definition of a 2d convolutional layer, that is already a no-go
Keeping the data as 3d, makes it so you can use a model that uses this spatial information
Such as a CNN
grave token
mild dirge
A 2d convolutional layer does not make sense on 1d data
I saw a code sample on Kaggle, They were flattening images.
Is it for other models or smth? like KNN
mild dirge
Maybe it was mnist
which is only 28x28 pixels
But flattening an image is not a common first step to classify them
grave token
I also dont see any use of flattening images beforehand.
 stuck socket
I need help with this 😫
 odd meteor
stuck socket
I need help with this 😫
odd meteor
stuck socket
I need help with this 😫
Hi Nov, how may I be of assistance 🖐🏾
stuck socket
desert oar
i happened to remember that they had a binary problem
Heeeeelp pls!
stuck socket
odd meteor
Hi Nov, how may I be of assistance 🖐🏾
yes pls
How do I get eval metric per class with sklearn instead of eval_metric from catboost, this lasst one gives me keyerror 0?
grave token
With tensorflow I see many terms like adam/gradientboost... sparse crossentropy etc. Can anyone suggest me tutorial or youtube video on learning these? I just cant find all of them in one place.
lapis sequoia
hi guys, im trying to simulate crafting in a game, i have the objects as follows
class Kits:
    def __init__(self):
        materials = []
        cost = 1.07


class Ruby:
    def __init__(self):
        materials = [(110, Kits)]
        profit_NPC = 100
        base_crit_chance = 0.15
        crit_amount = 2
        pp = 2


class Sapphire:
    def __init__(self):
        materials = [(2, Ruby), (300, Kits)]
        profit_NPC = 200
        base_crit_chance = 0.15
        crit_amout = 2
pp = 30```materials is what u need to craft 1 of them
and pp the production points
and NPC is how much the npc gives to u
am i missing anything relevant?
okey, im missing the self
okey better, now, i wanna make 2 simulations. or 3 idk
where only the crit chance varies
any idea of how can i do that?
serene scaffold
@lapis sequoia this is not about data science. kindly copy and delete your messages.
odd meteor
stuck socket
How do I get eval metric per class with sklearn instead of eval_metric from catb...
There's a detailed explanation on it here https://catboost.ai/en/docs/concepts/python-reference_utils_eval_metric. (scroll down a bit to see the example on how to use it)
serene scaffold
stuck socket
odd meteor
There's a detailed explanation on it here https://catboost.ai/en/docs/concepts/p...
it gives me Keyerror 0
 odd meteor
grave token
With tensorflow I see many terms like adam/gradientboost... sparse crossentropy ...
odd meteor
grave token
With tensorflow I see many terms like adam/gradientboost... sparse crossentropy ...
You might wanna check out YouTube videos on these three specific topics: Gradient Descent, Optimizers, and Loss Function. This explains what optimizers are, and what they're essentially used for https://youtu.be/mdKjMPmcWjY
From Gradient Descent to Adam. Here are some optimizers you should know. And an easy way to remember them.
SUBSCRIBE to my channel for more good stuff!
REFERENCES
[1] Have fun plotting equations : https://academo.org/demos/3d-surface-plotter
[2] Original paper on the Adam optimizer: https://arxiv.org/pdf/1412.6980.pdf
[3] Blog on types o...
odd meteor
stuck socket
it gives me Keyerror 0
From the error message, you're not to add [0]. Remove it and try again
stuck socket
odd meteor
From the error message, you're not to add [0]. Remove it and try again
again the same error
grave token
Is there any way to prevent newline on vscode jupyter?
 odd meteor
stuck socket
again the same error
odd meteor
stuck socket
again the same error
What's the error message saying this time?
serene scaffold
grave token
Is there any way to prevent newline on vscode jupyter?
is the returned value a (numpy) array?
stuck socket
odd meteor
What's the error message saying this time?
it's the same one
 stuck socket
odd meteor
What's the error message saying this time?
stuck socket
odd meteor
What's the error message saying this time?
sklearn doesn't give me this problem , but how to extract the pred per class usin sklearn?
odd meteor
stuck socket
sklearn doesn't give me this problem , but how to extract the pred per class usi...
predict_proba() method to get the probability of each class's prediction while predict() is used to predict the actual class.
Assuming your target is (0,1), then the classifier would output a probability matrix of dimension (N,2). The first index refers to the probability that the data belong to class 0, and the second refers to the probability that the data belong to class 1.
These two would sum to 1 (because they're probability scores)
You can then output the result by doing something like this:
probability_of_class_1 = model.predict_proba(X)[:, 1]
If you have k classes, the output would be (N,k), you would have to specify the probability of which class you want.
stuck socket
odd meteor
`predict_proba()` method to get the probability of each class's prediction while...
I'm sorry, I asked wrong, what I would like to get is the eval metric per class prediction by using any sklearn metric, bc I cannot do it with eval_metric from catboost
stuck socket
odd meteor
`predict_proba()` method to get the probability of each class's prediction while...
this is how my data looks like

 serene scaffold
misty flint
ahhh im dead
serene scaffold
misty flint
ahhh im dead
I hadn't even heard of jax until one of the principal researchers in my department asked me for help installing it. why is it for researchers?
desert oar
serene scaffold
I hadn't even heard of jax until one of the principal researchers in my departme...
i think it's lower level than pytorch. more of a straight-up differentiable computing framework than a "machine learning" framework as such
iron basalt
serene scaffold
I hadn't even heard of jax until one of the principal researchers in my departme...
Basically Numba with reverse mode auto diff (aka backpropagation).
They probably wanted their own tool to add what they want.
misty flint
what they said
also
if you are doing any kind of gpu training on the cloud
this is a good page to have bookmarked
Detailed comparison table of cloud GPU providers for deep learning.
it is legit gold. many thanks to the FSDL folks

ah and i believe many peeps already know this but just in case

 marble ocean
hey guys
i need some help here
is there a good way to convert tensorflow model to pytorch model
tensorflow is so slow and i need to find a way to fasten the mode in cpu
 marble ocean
you mean i convert it to onnx?
 robust jungle
does anyone know a good way to convert a nested list to a multi dimensional np array?
e.g.
[[1, 2, 3], [4, 5, 6], [7, 8, 9]]

to

[1, 2, 3
4, 5, 6,
7, 8, 9]
I know you could probably solve this with a for loop, but im asking if there is a better way
desert oar
robust jungle
e.g.
```
[[1, 2, 3], [4, 5, 6], [7, 8, 9]]
to
[1, 2, 3
4, 5, 6,
7, 8, 9]
```
!e ```python
import numpy as np
lst = [[1, 2, 3], [4, 5, 6], [7, 8, 9]]
arr = np.array(lst)
print(arr)
@desert oar :white_check_mark: Your 3.11 eval job has completed with return code 0.
001 | [[1 2 3]
002 |  [4 5 6]
003 |  [7 8 9]]
thanks, I legitimately had no idea it did that
desert oar
robust jungle
thanks, I legitimately had no idea it did that
you might want to read the numpy "user guide" materials
robust jungle
desert oar
you might want to read the numpy "user guide" materials
probably a good idea
desert oar
it's a lot of stuff to get through, but it's really essential reading imo. like most complicated things, you will probably end up going back to it several times and understanding a bit more each time.
 spare briar
serene scaffold
I hadn't even heard of jax until one of the principal researchers in my departme...
spare briar
serene scaffold
I hadn't even heard of jax until one of the principal researchers in my departme...
makes model parallelism trivial, obvious choice when your model must be split across many accelerators https://jax.readthedocs.io/en/latest/_modules/jax/experimental/pjit.html
 ebon hazel
 ancient dragon
!e
import torch
@ancient dragon :x: Your 3.10 eval job has completed with return code 1.
001 | Traceback (most recent call last):
002 |   File "<string>", line 1, in <module>
003 | ModuleNotFoundError: No module named 'torch'
!e
import tensorflow as tf
@ancient dragon :x: Your 3.11 eval job has completed with return code 1.
001 | Traceback (most recent call last):
002 |   File "<string>", line 1, in <module>
003 | ModuleNotFoundError: No module named 'tensorflow'
Unfortunate
 barren snow
How to get the value from Gaussian mixture model distribution? I mean like 0.94,0.95,0.96 in this plot
 stuck socket
desert oar
it's a lot of stuff to get through, but it's really essential reading imo. like ...
stuck socket
desert oar
it's a lot of stuff to get through, but it's really essential reading imo. like ...
help pls!!
desert oar
stuck socket
help pls!!
how would you feel if someone randomly pinged you with this message?
stuck socket
these words define it "It's my turn to help my buddies again"
stuck socket
desert oar
how would _you_ feel if someone randomly pinged you with this message?
I'm struglin to death trying to get eval metrics per classes
steady basalt
desert oar
how would _you_ feel if someone randomly pinged you with this message?
Help pls!!!
steady basalt
stuck socket
I'm struglin to death trying to get eval metrics per classes
Bro just print the metrics from sklearn
stuck socket
ye, but how do ya do it per class?
steady basalt
It should show classes
desert oar
stuck socket
I'm struglin to death trying to get eval metrics per classes
please don't randomly ping people asking for help. it's acceptable or encouraged in some servers, but that's not how we do things in this server. just ask your question (in detail) and if someone is available they will answer it.
steady basalt
stuck socket
ye, but how do ya do it per class?
Metrics shows all classes by default im pretty sure
stuck socket
steady basalt
Metrics shows all classes by default im pretty sure
it doesn't y,y
 stuck socket
steady basalt
What does it show
stuck socket
steady basalt
What does it show
 steady basalt
Bro, really?
Use sklearn metrics to show all metrics for all
U don’t want to use accuracy anyways
U don’t need a loop
Use the sklearn report function
It will print a report for all classes
scikit-learn
Examples using sklearn.metrics.classification_report: Recognizing hand-written digits Recognizing hand-written digits Faces recognition example using eigenfaces and SVMs Faces recognition example u...
@stuck socket
stuck socket
steady basalt
https://scikit-learn.org/stable/modules/generated/sklearn.metrics.classification...
this one only show these

 torn saddle
hey guys i am working on a project to classify products based on their type and the text printed on them
so I'm using pytesseract for the same
But, I'm facing an error when i use pytesseract (OCR tool for python)
the error says
Tesseract error : (1, "Error, unknown command line argument '--'"
the error isn't related to my code most probably
it's bcs of some issue with the package
i tried finding out but had no luck
if someone is familiar with this please help me out
steady basalt
stuck socket
this one only show these
It shows all if u see the entire thing
Do u know how to get dictionary values
Also, don’t print it, just return it in a jupyter cell
Follow the tutorial
 barren drift
Hello everyone, I am new to data visualization and as I was trying to do some examples I could not figure out an error. I tried to plot JSON data via python, but if it is one object it works fine but if there are multiple objects, an error shows up: Extra data. I tried to find a solution online butit did not work . So if you can help me I would appreciate it. Thank you.
 neat anvil
Hey guys just started learning Pandas and I want to group my data in 10 years period (1990-2000 , 2000-2010) cuz I want to plot a bar graph.
But the "movies_year" column is not just integers it has bracket () and words too so how can i filter that out ?

 old meteor
I'm noob, but I guess you need to use https://pandas.pydata.org/docs/reference/api/pandas.DataFrame.apply.html#pandas.DataFrame.apply
And create a function to remove things you don't want
unique flame
neat anvil
Hey guys just started learning Pandas and I want to group my data in 10 years pe...
You may wanna search string slicing first and then convert the strings into integers. Maybe there is an easier way, but idk that's how I did it. There is a movie called Amogus??
lapis sequoia
in pandas is there a way to avoid when you .groupby something stopping it from becoming the index? it's kinda annoying because it's not a normal column anymore
df = df.groupby(["start_date_local"]).sum()
"""
>>> df['start_date_local'] = df.index # my workaround
>>> df
                    distance      start_date_local
start_date_local
2022-08-18T11:05:11Z     249.9  2022-08-18T11:05:11Z
"""
as_index=False!
torn saddle
model = tf.keras.models.Sequential()
model.add(tf.keras.applications.ResNet50(include_top = False, weights='imagenet', pooling='avg'))
def LoadData(path, h, w):
img = cv2.imread(path)
Data['text'].append(pytesseract.image_to_string(img, config = conf))
img = cv2.resize(img, (h, w))
# expanding image dims smodel.layers[0].trainable = Falseo this represents 1 sample
img = img = np.expand_dims(img, 0)
img = tf.keras.applications.resnet50.preprocess_input(img)
extractedFeatures = model.predict(img)
extractedFeatures = np.array(extractedFeatures)
Data['flattenimage'].append(extractedFeatures.flatten())
def ReadStore(path):
list = os.listdir(path)
for imgindex in list:
Data['image_name'].append(img_index)
imagePath = path + '/' + img_index
LoadData(imagePath, 224, 224)
path = '/kaggle/input/keep-babies-safe/dataset/images'
ReadStore(path)
im facing error in the last part
that is
path = '/kaggle/input/keep-babies-safe/dataset/images'
ReadStore(path)
TesseractError: (1, "Error, unknown command line argument '--'")
grave token
serene scaffold
is the returned value a (numpy) array?
sklearn.confusion_matrix()
mild dirge
It's a numpy array, and not sure how you would be able to remove those new lines, since the cell is just a set width
So you can' t really go past it, but I normally make a plot from the confusion matrix, like a heatmap
You can do that easily with matplotlib, and normalizing each row or column, and then doing plt.imshow(normalized_conf_mat)
And maybe plotting the actual values at the corresponding cells
grave token
mild dirge
It's a numpy array, and not sure how you would be able to remove those new lines...
by the way, i load my dataset into a numy array. Is it possible to store it for later use? I just dont want to fetch all the images every time and normalize them.
mild dirge
You would need to load the data every time you start the program
But you mean, only normalize once, and save that result?
grave token
mild dirge
But you mean, only normalize once, and save that result?
yes
mild dirge
For models it is really just common to load them in and normalize them everytime you load them in, instead of saving normalized versions
So just have a function that does both preferably
Some models also have batch normalizations at the start, and I think in that case it does not even matter that much to normalize them
Not 100% certain on the last part
But if you think normalizing takes really really long, I guess you could just save the normalized images as a numpy array in .npy format
serene scaffold
mild dirge
It's a numpy array, and not sure how you would be able to remove those new lines...
I think there's a print setting you can change for numpy. there is for pandas.
twin ravine
should you use the softmax function before calculating cost? or is it sufficient to calculate the cost using the sigmoid of the output?
steady basalt
I am visiting Brussels today bros
mild dirge
twin ravine
should you use the softmax function before calculating cost? or is it sufficient...
The softmax is applied on the logits of the model (so before applying any activation)
That gives you the output, and this must be compared to the desired output to calculate the loss/cost
Using sigmoid would give an entirely different output, and thus cost, so don't do that
lapis sequoia
Is anyone learning data science from the IBM course?
spare briar
sigmoid is a special case of softmax for binary case
 viscid python
Is R the language to learn for data science?
mild dirge
viscid python
Is R the language to learn for data science?
You're in the data science and ai channel of a python discord, so there obviously are other languages good for it too 😛
There are multiple languages that can be used, python is a good start
viscid python
no, my friend is being taught R for DS, that’s why i was asking
 latent shell
Hi, This is the histogram of an image
I want to select the range of the curve (from 100 to 180 in this case)
I tried using normal distribution but I still couldn't get how it's done
can anyone help?
thanks
 mild dirge
I don' t know what you mean with select the range of the curve
And how a normal distribution would be needed for it
You already have a distribution it seems like
mild dirge
viscid python
Is R the language to learn for data science?
If you are asking if it is the language for ds, then no, I have only used it a few times for statistics, I have done all my data science projects with Python
You don' t need R for ds
marble ocean
how can i load A saved_model and save it as .tf
how to convert from archieve model into single file in tensorflow
serene scaffold
marble ocean
how can i load A saved_model and save it as .tf
have you checked the tensorflow docs for how to load a saved model?
marble ocean
serene scaffold
have you checked the tensorflow docs for how to load a saved model?
yeah i know how to load it but how can i save it as .tf