#data-science-and-ml
1 messages · Page 8 of 1
 mild dirge
Because the window is 3x3, it will reduce the output compared to the input by 2 for every spatial dimension
Make sense?
If you want to have the output be the same shape, you could use padding around the image
 bold timber
mild dirge
This example has an image of 5x5, and a window of 3x3
bold timber
mild dirge
This example has an image of 5x5, and a window of 3x3
Whether the window that you mean is the filter (kernel)?
mild dirge
yes
In your case, the first layer has a kernel of size 3x3x3, the last 3 is because your image has 3 channels, RGB
And you want 32 filters, so that gives 32x3x3x3 is 864 params
bold timber
where did max_pooling2d_47 (MaxPoolin (None, 10, 10, 32) 0
g2D) come from?
bold timber
I mean max_pooling2d_47 (MaxPooling2D (None, 15, 15, 32)
mild dirge
Well the input to it is (None, 30, 30, 32)
maxpooling takes the max of every 2x2 patch of your image
So the size is only a quarter of your input
(halved in both width and height)
bold timber
Thank you so much for the explanation! @mild dirge
But, I have a question again. Does it means happens because I don't use padding?
mild dirge
the reduction of width and height is because you don' t use padding
If you check the image, you can see that it would indeed reduce the width and height, if you want all the cells of the window to overlap with some cells of the image
Padding in this case would mean putting, f.e., 0s all around the border
that way you can also put the window at the edges and corners, and thus the output would be the same shape as the input
(in the case of a convolution with a single 2d image)
bold timber
mild dirge
that way you can also put the window at the edges and corners, and thus the outp...
oh right, thank you so much!
bold timber
Whether we can put the batch_size that makes the output couldn't be None?
 fair zenith
Have you guys heard of open ai/DALL.E 2
And for what us it good and how could they even make something like this like how is it possible to make a bot that can make art what you say yk like woah haha
 tulip frost
Hi! I'm currently pursing Mtech in AIML. Can someone please help me? I'm trying to generate text from keywords. I have a small data set containing 2 columns with keywords and one column with corresponding question. How do I build a model for the same?

 wooden sail
can you try printing out the type() of an entry in that column? looks like you don't actually have date-times, probably strings instead
 exotic thicket
No it's not but the gradient descent has been in the introduction videos (I'd just heard and yet) and now I'm stuck at Convergence of Perceptron Learning Algorithm - Deep learning course
So, would u mind here's a link of that video https://youtu.be/vAOI9kTDVoo

Is there any alternate resource for this to get knowledge which is more clearer
 lapis sequoia
 willow jasper
can anyone please help me with this error
willow jasper
can anyone please help me with this error
I assume this time stamp is not datetime type.
 steady basalt
exotic thicket
No it's not but the gradient descent has been in the introduction videos (I'd ju...
steady basalt
exotic thicket
No it's not but the gradient descent has been in the introduction videos (I'd ju...
From my limited understanding of math he’s explaining how the perceptron approaches correct answers thanks to weight updates?
exotic thicket
In my POV Perceptron learning algorithm alone is an approach but when it's got the issue in the process (like in separation of the classified assignment things go above or less) on this case had to initiate a different approach to again classify. So, is that thing abt he had explained?
@steady basalt what's the difference btw PLA and Convergence of PLA
steady basalt
Pla is the perceptron
Convergence is how it gets closer to true predictions
I think in his case it’s regression
But the last two pages of that shit are unreadable
Just google perceptron
Oh I guess he’s explaining for Boolean inputs
I am not following past the angle part
 steady basalt
yea that had be confusedf a minute too
 lusty arrow
I have a question: I graduated in EnvSci/GIS but I am currently trying to change my career path into tech from the hard sciences. I plan to move into something data related or backend because I have been told by other colleagues that a natural progression away from GIS wold be this route. I assume this is probably accurate but wanted to get your thoughts on it. I am heavily interested in ML/DL/AI and plan on building a chess project idea I fell in love with since I love chess. What do you guys think?
 arctic cliff
when z=wx+b
Why do we cache z?
And what does caching mean
 lapis sequoia
arctic cliff
when z=wx+b
Why do we cache z?
And what does caching mean
lapis sequoia
arctic cliff
when z=wx+b
Why do we cache z?
And what does caching mean
In this context, you can think caching as in storing. We store z because in back propagation we use this z to find new z.
arctic cliff
lapis sequoia
In this context, you can think caching as in storing. We store z because in back...
Why do we need to update Z? Don't we focus on dw and db?
Also what did he mean by da? Is it (d/da * cost function?)
lapis sequoia
arctic cliff
Why do we need to update Z? Don't we focus on dw and db?
So we focus on z because z is the final weight of the neuron. Then we apply non linear function over it(g(z)) now when you will backpropogate you will change the value of z.
lapis sequoia
arctic cliff
Also what did he mean by da? Is it (d/da * cost function?)
I'm sorry I don't remember whole video throughly.
arctic cliff
lapis sequoia
So we focus on z because z is the final weight of the neuron. Then we apply non ...
Isn't w the final weight?
steady basalt
That depends on what your letters stand for
arctic cliff
w = weights
z is the linear function for example let it be W*X
arctic cliff
Since we are aiming to apply vectorization, It is supposed to be a matrix for the whole layer
steady basalt
Are you aware of how chain rule can allow you to understand the change in the first weight to the output
arctic cliff
Yes
steady basalt
That’s probably all it’s trying to explain
arctic cliff
But my confusion comes when we are going to apply the update
Do we apply it on the weight and bias individually then return the z (Let it be linear function again)?
Or do we apply the update on Z directly?
steady basalt
arctic cliff
Since we are aiming to apply vectorization, It is supposed to be a matrix for th...
I guess the theory stands whether it is a matrix or just a single number so easier to understand without using vector first time
Z as in activation function?
lapis sequoia
steady basalt
Z as in activation function?
g is activation.
steady basalt
What is z here
arctic cliff
In this context it's just a linear function
steady basalt
A linear function to do what
lapis sequoia
z = wa + b
a_next = g(z)
What does he say
arctic cliff
Can I share the video with the timestamp?
steady basalt
I mean z is effected if w is effected
lapis sequoia
Is there youtube link? May be I can help after watching.
lapis sequoia
arctic cliff
Can I share the video with the timestamp?
That would work, yes.
steady basalt
If u apply update to w it directly effects z anyway
Well the output sorry
Not what z is of course
as a function
arctic cliff

Take the Deep Learning Specialization: http://bit.ly/3aqFCk3
Check out all our courses: https://www.deeplearning.ai
Subscribe to The Batch, our weekly newsletter: https://www.deeplearning.ai/thebatch
Follow us:
Twitter: https://twitter.com/deeplearningai_
Facebook: https://www.facebook.com/deeplearningHQ/
Linkedin: https://www.linkedin.com/com...
steady basalt
Lol that’s a hard explanation to follow if it’s given before the overall concept is explained
arctic cliff
there's no context to be honest
He is just suddenly applying the back propagation to the activation function (But since z is a linear function, activations can be ignored)
🤔Seems like he suddenly jumped to a whole different context
steady basalt
I’d recommend another source
Just google backpropation there’s a good page explaining it
arctic cliff
Thanks! will check it out 👌
exotic thicket
@lusty arrow all u have to do is just start u gonna discover more ideas not just chess board
Ideas making into reality are hard there are a bunch of complexities
lusty arrow
exotic thicket
<@75372500040552448> all u have to do is just start u gonna discover more ideas ...
Already started. I plan on going well beyond a chessboard. It's just something I would like to do at the moment before moving onto the next thing
exotic thicket
Keep moving with the same excitement in every complexity @lusty arrow
lusty arrow
exotic thicket
Keep moving with the same excitement in every complexity <@75372500040552448>
Sounds like a plan
steady basalt
    def __init__(self,file):
        self.file = file
    def get_dummies(file):
file = pd.get_dummies(file,columns=columns)```a```<__main__.pipeline at 0x153724610>
anyone know how to do this so that I can actually see a?
pipeline.getdummies?
ah, got it had to return
 hazy saddle
Hi, I'm using pandas, triying to sort values, the data is of type:
<class 'pandas.core.frame.DataFrame'>
I'm using dataframe.sort_value('column name')
but nothing gets sorted.
 arctic wedgeBOT
Hey @hazy saddle!
It looks like you tried to attach file type(s) that we do not allow (). We currently allow the following file types: .gif, .jpg, .jpeg, .mov, .mp4, .mpg, .png, .mp3, .wav, .ogg, .webm, .webp, .flac, .m4a, .csv, .json.
Feel free to ask in #community-meta if you think this is a mistake.
hazy saddle
this is the data
 serene scaffold
hazy saddle
Hi, I'm using pandas, triying to sort values, the data is of type:
<class 'pand...
serene scaffold
hazy saddle
Hi, I'm using pandas, triying to sort values, the data is of type:
<class 'pand...
That just tells us that you have a DataFrame, which is already in the premise of your question.
Keep in mind that the sort values method returns a new DataFrame. It's like the opposite of list.sort
So if you don't chain another method call or save it to a variable, nothing happens.

 obsidian peak

GitHub
Rubik's cube assistant on Flask webapp. Contribute to YashIndane/webcube development by creating an account on GitHub.
 ripe forge
 untold storm
This is a whole pile of nonsense. Ignore anything that tries to give timelines as if everyone learns at the same pace
Personally I would have spent 2 years or so trying to go through this list.
untold storm
right the time frames are way too short realistically if you want it to retain into long term memory imo
 earnest widget
I am trying to get a better mAP value using my model but my validation set keeps fluctuating, is there a specific reason for this in terms of data or in the model?
 wooden sail
that's an interesting one. there's 2 parts to the answer. one part is that you're using an estimator based on the "mean". this means that a statistical approach is used. there is no guarantee that the metric will be minimized for any specific realization of the data, only that it will work well in average. this can be achieved by being very wrong all the time 😛 on top of that, the population statistics accuracy depends on the batch size through the law of large numbers. if your batches are small, your estimator is bad because the mean you use is the wrong one
on the flipside, it could also just be that your data has a very high variance. this one kinda ties in with the batch size though
you can introduce regularization like in ridge regression which should smooth out the results to some extent, as it's equivalent to assuming your distribution is very noisy and compensating for that, or you can increase the batch size
give those a shot and see whether that helps @earnest widget
earnest widget
wooden sail
give those a shot and see whether that helps <@98122414608633856>
Yeah well I can see how that makes sense since my batch size was too low, but about the regularization, does it require to be added for each layer of the model or just trial and error? Also, does kernel initializers have any effect in this?
wooden sail
kernel initializers always play a role as soon as your function is non convex. about the regularization, that's a good q. i couldn't really say without looking at the network architecture, but i guess it makes the most sense in big layers, the first one or so
using dropout also produces a similar regularizing effect, so you might wanna introduce that if you aren't yet
earnest widget
wooden sail
kernel initializers always play a role as soon as your function is non convex. a...
Yeah I have not introduced dropout layer in my model yet because I was not sure how much of a dropout rate I should add in for each layer. Not a pretrained model either. Because now the model just gets stuck at 80 mAP for some unknown reason. This is what I created on my own:
initializer = tf.keras.initializers.HeUniform()
model = Sequential()
model.add(Conv2D(32, (3, 3), activation='relu', input_shape=(350, 350, 3)))
model.add(BatchNormalization())
model.add(MaxPool2D(pool_size=(2, 2)))

model.add(Conv2D(32, (3, 3), activation='relu'))
model.add(BatchNormalization())
model.add(MaxPool2D(pool_size=(2, 2)))

model.add(Conv2D(64, (3, 3), activation='relu'))
model.add(BatchNormalization())
model.add(MaxPool2D(pool_size=(2, 2)))

model.add(Conv2D(64, (3, 3), activation='relu'))
model.add(BatchNormalization())
model.add(MaxPool2D(pool_size=(2, 2)))

model.add(Conv2D(128, (3, 3), activation='relu'))
model.add(BatchNormalization())
model.add(MaxPool2D(pool_size=(2, 2)))

model.add(Conv2D(128, (3, 3), activation='relu'))
model.add(MaxPool2D(pool_size=(2, 2)))

model.add(Flatten())
model.add(Dense(256, activation='relu', kernel_initializer=initializer))
model.add(Dropout(0.5))
model.add(Dense(4))

model.compile(loss='mse', optimizer='adam', metrics=[tfr.keras.metrics.MeanAveragePrecisionMetric()])
i always like some dropout between a flatten and a dense
as for how much is good, that's to taste. many peoeple start with 20%
hazy saddle
serene scaffold
That just tells us that you have a DataFrame, which is already in the premise of...
I'm so embarrased 😳
wooden sail
we can start by adding another dropout between the flatten and the dense, and making both dropouts be like 0.3? idk
try that out. and after that is done, undo the change and try increasing the batch size
then do both things at the same time and see which works nicer
earnest widget
Oh yeah I will do that. Anyways I think I can still increase the batch size since it's 8 now lol.
lapis sequoia
You may get convergence less if data is less, you can also play a little bit with epochs.
wooden sail
snr is proportional to sqrt(batch size), so changing from 8 to 64 should be nice if you have enough memory to accommodate that
earnest widget
lapis sequoia
You may get convergence less if data is less, you can also play a little bit wit...
Well my data is around 6000+ images with 150 epochs and having a callback.
earnest widget
wooden sail
snr is proportional to sqrt(batch size), so changing from 8 to 64 should be nice...
Yeah I can change to 64, let me try it out now.
serene scaffold
hazy saddle
I'm so embarrased 😳
don't be.
lapis sequoia
if you're making it from 8 to 64, keep in mind that you're basically giving your model x/8 batches if last time it was x so you may try epochs if doesn't increase efficiency much.
earnest widget
lapis sequoia
if you're making it from 8 to 64, keep in mind that you're basically giving your...
So you mean try and reduce the number of epochs? Anyways it does stop at 47th epoch because of early stopping.
lapis sequoia
earnest widget
So you mean try and reduce the number of epochs? Anyways it does stop at 47th ep...
Increase. (if needed)
earnest widget
Ah okay, I will try that out now. Thanks for the help. @wooden sail @lapis sequoia
wooden sail
report back with your results 😛 i'm curious to see what works
 misty flint
this is a follow-up with our convo a few days ago. you are correct about priorities, so i just wanted to make sure you saw this as well

 placid oak
misty flint
this is a follow-up with our convo a few days ago. you are correct about priorit...
placid oak
misty flint
this is a follow-up with our convo a few days ago. you are correct about priorit...
Thanks for this. Are there any resources in particular that you would recommend?
misty flint
placid oak
Thanks for this. Are there any resources in particular that you would recommend?
cant say i have any particular ones, but i follow vivek viswanathan and he produces a lot of quant + ML material and content
found him through the great ken jee https://youtu.be/suOIKgytkCw

Vivek Viswanathan is the portfolio manager of the Rayliant Quantamental China Equity ETF and is the Global Head of Research and Portfolio Management at Rayliant Global Advisors. He has a Ph.D. in Finance from UCI, a Master’s in Financial Engineering from UCLA, and a Bachelor’s in Economics from the University of Chicago. He has worked 15 years i...
this is his background
Vivek Viswanathan is the portfolio manager of the Rayliant Quantamental China Equity ETF and is the Global Head of Research and Portfolio Management at Rayliant Global Advisors. He has a Ph.D. in Finance from UCI, a Master’s in Financial Engineering from UCLA, and a Bachelor’s in Economics from the University of Chicago. He has worked 15 years in quantitative investment management.
i would check him out and his material and then go from there
 autumn ocean

 thin stag
lg.fit(x_poly, y1) /Found input variables with inconsistent numbers of samples: [108065, 21613] /what does this mean i did find it in stackoverflow
 agile cobalt
thin stag
lg.fit(x_poly, y1) /Found input variables with inconsistent numbers of samples: ...
agile cobalt
thin stag
lg.fit(x_poly, y1) /Found input variables with inconsistent numbers of samples: ...
sounds like X's shape is (108065,) while Y's (21613)?
you can try using x_poly.reshape(-1, 5) or x_poly.reshape(5, -1)
if that is not it, then try looking up Found input variables with inconsistent numbers of samples on your favourite search engine and see some other possible solutions
thin stag
it says x and y must be the same size
after i reshaped it to -1 5
@agile cobalt
in x i have 5 features and y i have 1 so i did plynomial regression
@agile cobalt
agile cobalt
agile cobalt
if that is not it, then try looking up `Found input variables with inconsistent ...
.
thin stag
k
 bitter pilot
Has anyone here used LightGBM for regression
I am having a huge RMSE and I cant think of what I am doing wrong
if anyone can guide me abit here I really appreciate it.
 hidden finch
Hey i was bored and i figured a dumb project, unfortunately it would need some ML to learn how to write its own text from and input text, i kinda suck at ML and have no experience with it so if anyone is interested, if yes then DM me.
 chilly dew
 wooden sail
do you have a gpu and cuda installed?
 coral walrus
does anyone know why pandas.merge joins randomly on NaN values
 ember scaffold
Hoping that it is possible to get the hints from this channel, but it is fair if people feel that this is not the right place to ask.
I am trying to make a solution to evaluate property based on different criteria:
- Distance to cost
- Shopping within 2 km
- Bakery count within 2km
..... etc.
That work now, but next is the following need:
Distance to fresh-water (river or lake) ??
To make this, I have a geoJason of the rivers, and lake-shorelines in Italy that is split in LineStrings (44683 objects) and for a given long-lat positon of a given property, I would like to find the distance to the closest LineString in the geojson file.
My research has pointed me to shapely and perhaps the usage of a STRtree index, but then my skills start to be challenged.
any help would be very welcome...

 dusty valve
import pandas as pd
import csv
data = pd.read_csv(r'C:\Users\USER\Downloads\messages.csv')
data = data.pop('Contents')
data.head()
for i in data.iteritems():
    try:
        with open('file.txt', 'a') as f:
            f.write(i[1])
    except Exception:
continue``` im tryna write all the contents from a single column to a .txt file, however once the code is done, the .txt file is emptyNot sure but put print in exception?
dusty valve
i think i got it
lapis sequoia
I usually solve this kinda error by printing crap everywhere.
 unique flame
autumn ocean
unique flame
autumn ocean
I've seen this image. I honestly expected that the algorithm would draw two bounding boxes, instead of one big one. So probably made for meme purpose.
steady basalt
@wooden sail how do u go about graphing g(f(x)) given only their graphs

This wasn’t even taught
wooden sail
well, it does say "estimate"
you know what g does and you know what f does
just concatenate them. take a value of x, put it into f, take that value and put it into g
then plot that point (x, g(f(x)) )
do this for a handful of points and join them with lines. you can't do it exactly, but it'll give you SOME idea
steady basalt
Not estimate, graphs
Graph @wooden sail
I don’t know what they do cause they aren’t linear
wooden sail
it's the same, dw
steady basalt
They don’t seem to be equal
wooden sail
they aren't, all you need to do is estimate
it's impossible to do it exactly from the graph
steady basalt
U mean just plug a bunch of numbers into them and then what
I can do that for one
The gx looks doable but the first graph seems impossible
So I will put the plots of g f of 0.5, 1, 1.5 etc and just fit tha
By the way, how feasible is PCA when 80% of my features are binary post one hot encoding?
 knotty hollow
hi guys
import csv
pnode_list = []
with open("Data/gen_by_fuel.csv", "r") as fh:
fh_reader = csv.reader(fh)
for row in fh_reader:
pnode_list.append(row[0])
print(pnode_list)
i need to extract data like this?
or another way, it's ETL
steady basalt
wooden sail
it's impossible to do it exactly from the graph
My final answer is like a sine wave from 0.5 to 3 going up to 0.7
knotty hollow
steady basalt
My final answer is like a sine wave from 0.5 to 3 going up to 0.7
can u help me?
steady basalt
What are u trying to do
knotty hollow
i need to extract data from csv file
knotty hollow
it's like ETL
steady basalt
does it run>
yo can someone help me for 2 mins i have a issue returning plots from inside my nonsklearn pipeline function as well as some sort of list comprehension problem
arctic wedgeBOT
Hey @earnest widget!
It looks like you tried to attach file type(s) that we do not allow (). We currently allow the following file types: .gif, .jpg, .jpeg, .mov, .mp4, .mpg, .png, .mp3, .wav, .ogg, .webm, .webp, .flac, .m4a, .csv, .json.
Feel free to ask in #community-meta if you think this is a mistake.
 hot ravine
@young ridge HashTable could help you
steady basalt
anyone know how to make my function include my plots in my outpuot with my prints?

i have a full process from dataframe to accuracy scores etc
in a single function
returning these doesnt show em
earnest widget
wooden sail
report back with your results 😛 i'm curious to see what works
Well, I did try your changes as you told for the batch size and regularization. I did two models with ridge regression using the built-in keras regularizer (L2 regularize) and used it in the last Dense layer with change in batch size and the two dropout layers at the end.
The first one has improved from the previous graph but can be better with regularization of L2(0.01) and two dropout layers of 0.35 in the end with batch size 32. The second one not too bad either but with regularization of L2(0.1) and same dropout layers at the end with batch size 64. I removed the kernel initializers from both of the models since I was not sure of how it affects the model performance. What I don't get is, why the mAP value still does go beyond 80.

 dusty valve
i got a pandas.core.series.Series obj, each row is a string. i want to one hot encode each one with tensorflow.one_hot. what's the best way to do that?
if stelercus could help that would be great 👉 👈
 mint palm
Can someone recommend a good source to see implementation of knowledge distillation?
I know the idea behind it but lack info on implementation
unique flame
earnest widget
Well, I did try your changes as you told for the batch size and regularization. ...
is this with the same medical dataset? with one class? didn't you had around 80%? Maybe try finding the paper that used it and compare
earnest widget
unique flame
is this with the same medical dataset? with one class? didn't you had around 80%...
Yeah it is actually. The paper on it is done with using Amazon Sagemaker so that's unfortunate lol.
serene scaffold
dusty valve
i got a pandas.core.series.Series obj, each row is a string. i want to one hot e...
scikit-learn
Examples using sklearn.preprocessing.OneHotEncoder: Release Highlights for scikit-learn 1.1 Release Highlights for scikit-learn 1.1 Release Highlights for scikit-learn 1.0 Release Highlights for sc...
serene scaffold
dusty valve
if stelercus could help that would be great 👉 👈

dusty valve
serene scaffold
<:pepefedora:583798103149379640>
👉 👈 thank
steady basalt
@wooden sail I’ve been thinking lately
dusty valve
steady basalt
<@467435887236612106> I’ve been thinking lately
nice, i should start too
 autumn glade
are there any open source RCNN models for object detection readily available like YOLOv5 (https://github.com/ultralytics/yolov5) ?
 thorn bobcat
yo!
 lavish lily
How can I use my BERT model to predict next sentence sentiment?
bold timber
Hi, how to analyze the model overfit or not? What plot can be analyzed for model performance, loss or accuracy?
 thorn bobcat
6/7 [========================>.....] - ETA: 0s - loss: -9305340928.0000 - accuracy: 0.0000e+00WARNING:tensorflow:Layers in a Sequential model should only have a single input tensor, but we receive a <class 'dict'> input: {'N_Days': <tf.Tensor: shape=(28,), dtype=int64, numpy=
how bad is this?
wooden sail
earnest widget
Well, I did try your changes as you told for the batch size and regularization. ...
oh, looks nice. what's your question regarding the 80
 young ridge
hot ravine
<@253122009653968896> HashTable could help you
young ridge
hot ravine
<@253122009653968896> HashTable could help you
got it thank you!
 kindred scroll
can anyone tell me how to create drop down Mapbox graph using Plotly in jupyter
 somber sphinx
not sure if this is the right place to ask but how do you show Arabic texts on an image with cv2.putText()? update: nvm got it
knotty hollow
guy's who can help me with EXTRACT data from csv file?
steady basalt
knotty hollow
guy's who can help me with EXTRACT data from csv file?
pd.read csv
knotty hollow
def extract_data_from_file_generation_by_fuel(path):
for x in os.listdir(path):
hrl_files = os.path.join(path, x)
hrl = pd.read_csv(hrl_files)
print(hrl.head())
extract_data_from_file_generation_by_fuel("Data/Generation by Fuel Type")
like this?
i need to prepare for transform
knotty hollow
so my code is good yea?
steady basalt
does it run?
knotty hollow
yea
steady basalt
then it must be
knotty hollow
[5 rows x 6 columns]
datetime_beginning_utc datetime_beginning_ept ... fuel_percentage_of_total is_renewable
0 12/31/2021 5:00:00 AM 12/31/2021 12:00:00 AM ... 0.19 False
1 12/31/2021 5:00:00 AM 12/31/2021 12:00:00 AM ... 0.36 False
2 12/31/2021 5:00:00 AM 12/31/2021 12:00:00 AM ... 0.01 True
3 12/31/2021 5:00:00 AM 12/31/2021 12:00:00 AM ... 0.00 False
4 12/31/2021 5:00:00 AM 12/31/2021 12:00:00 AM ... 0.40 False
[5 rows x 6 columns]
datetime_beginning_utc datetime_beginning_ept ... fuel_percentage_of_total is_renewable
0 8/15/2022 4:00:00 AM 8/15/2022 12:00:00 AM ... 0.22 False
1 8/15/2022 4:00:00 AM 8/15/2022 12:00:00 AM ... 0.39 False
2 8/15/2022 4:00:00 AM 8/15/2022 12:00:00 AM ... 0.00 True
3 8/15/2022 4:00:00 AM 8/15/2022 12:00:00 AM ... 0.00 False
4 8/15/2022 4:00:00 AM 8/15/2022 12:00:00 AM ... 0.37 False
[5 rows x 6 columns]
like this way
knotty hollow
idk, cuz i have a lot of files
knotty hollow
steady basalt
many files?
yea
steady basalt
i do this
actual_field_list = {value:key for key, value in field_list.items()}
df_age=pd.read_csv(folder+str(list(actual_field_list.values())[0])+'.csv')
but thats for when a file is a column
for field in range(len(actual_field_list)):
df_dict[field] = pd.read_csv(folder+str(list(actual_field_list.values())[field])+'.csv')```Guys who mind helping me with Concept Satisfying Convergence in the perceptron learning algorithm in positive points should have to lie on less than 90 degrees and Negative points have to lie on greater than 90 degrees. if it does not satisfy the above condition, then there's complex mathematics behind setting it in the right order. So, who would u guys mind helping me with this problem?
unique flame
When should you add a LSTM layer to a cnn network for image classification? I always figured LSTM were used for timeseries and that you need some time related property of the image. But I've happen to stumble on some hybrid cnn+lstm models (https://doi.org/10.1016/j.compeleceng.2022.107960) and wanna know the reason when you would add lstm.
wooden sail
think of what LSTMs and CNNs do
LSTMs are based on the idea of temporal correlation, while CNNs are based on the idea of spatial invariance
in other words, CNNs let you find stuff regardless of where it is in the image, while LSTMs assume that, as time goes on, things change slowly for each pixel. that's exactly the case, for example, in video without abrupt scene changes, or in the paper you linked right now, radiology.
many radiology methods are based on the idea of tomography, where you capture slices of an object along an axis
on top of that, networks don't actually care whether the axes mean what you usually associate with them. for all intents and purposes, vertical slices of a brain played one after the other is exactly the same as showing frames of a video
so in that case, they swap temporal correlation with spatial correlation along one axis
then the convolutional layers detect stuff anywhere in the brain, and once they show up, they will continue to show up in roughly the same place over several slices
this is where, much to supermoon's dismay, statistics matters. you discover these behaviors through exploratory analysis by checking for invariance of statistics and also correlation along several axes
applying this prior knowledge to your network instead of blackboxing it lets you get better performance with less data and with fewer layers
the TL;DR is that the "Time" in LSTM does not really have to be time: it can be any axis along which your data is correlated/slowly varying
unique flame
Ay thanks for the TLDR, was about to ask if the data-set needed some sort of time stamp. I haven't fully wrapped my head around the idea of combining cnn+lstm yet, but still gonna read through the article and other similar works.
wooden sail
unique flame
Ay thanks for the TLDR, was about to ask if the data-set needed some sort of tim...
that's a good question, i'm under the impression that the classical LSTM assumes a "constant time step", so the separate inputs have to be equally spaced, if that makes sense
otherwise you'd have to include the time step explicitly somehow, but i'm not familiar with how to do that tbh. it should be doable
exotic thicket
exotic thicket
Guys who mind helping me with Concept Satisfying Convergence in the perceptron l...
Anyone here up for my question I HV been waiting..
wooden sail
sorry, i read it but i have no idea, that's why i didn't comment
 glad drum
where do you guys practise your ml skills?
like u pick a random dataset from kaggle and start coding?
 torn slate
whats the best way to start with AI in python?
serene scaffold
torn slate
whats the best way to start with AI in python?
!resources data science
arctic wedgeBOT
Resources
The Resources page on our website contains a list of hand-selected learning resources that we regularly recommend to both beginners and experts.
torn slate
serene scaffold
!resources data science
thanks
serene scaffold
wooden sail
the TL;DR is that the "Time" in LSTM does not really have to be time: it can be ...
this was a great read. thanks for that!
 steady basalt
10
But I was confused when that number appeared as I would have rearranged the equation so there’s only a single divisor
wooden sail
!e
import math
print(1/math.log10(1.036))
arctic wedgeBOT
@wooden sail :white_check_mark: Your 3.11 eval job has completed with return code 0.
65.10520339406614
that doesn't make a difference, you should get the same result either way
steady basalt
Can u just isolate t but moving across that one log
Yeah it’s the same
But i cudnt see where 65 ids from
wooden sail
well, given the nature of the problem, no you can't
after taking a log, we have a linear equation y = mx + b, just swap x with t
you can't entirely get rid of that b, but you can associate it with y if you like
x = (y-b)/m
same thing as x = y/m - b/m
steady basalt
Wait so why is logP/ log1.036 65
steady basalt
Why are they dividing 1 by anything
wooden sail
why not?
steady basalt
There’s no 1
wooden sail
.latex \begin{align}
\frac{a}{b} = a \cdot \frac{1}{b}
\end{align}
 strange elbowBOT
 steady basalt
O lol
So that’s what they doing
Ty
For some reason the precalc in this book skips triangles and goes straight into circles
Interesting
I wonder how much my progress will slow down in later chapters haha
wooden sail
that makes sense. special triangles are studied scale-free in a unit circle, and same with trig functions
steady basalt
wooden sail
that makes sense. special triangles are studied scale-free in a unit circle, and...
By circles I mean just looking at angles and arcs and angular distance
Real basics
Then after one more sub chapter I’m onto limits
wooden sail
same thing
steady basalt
Idk I’m really bad at this stuff I’d prob still suck in exam conditions after practising a bit
But I rly enjoy intros calculus so far
Much more enjoying than other areas I’ve looked at
Thinking of sticking with it but part of me wonders that it may not be so useful for me in the future to make it worth it if I stop enjoying it
Most tools calculate for me
wooden sail
and how's that working out for you so far
steady basalt
Wdym
wooden sail
well, the reality is that not everyone needs much more than like middle school maths throughout their lives
steady basalt
That’s true, but becoming a data scientist isn’t exactly simple
And I’ve literally been told here I’d not be hired if I cudnt do this
So it is what it is
wooden sail
on the other hand, it's already well accepted that language and complex thought are related. then if you think of math as a language for logics, you could argue that practicing maths lets you articulate and develop your logic better
well yes, that's another thing. if you wanna do DS, you can't avoid it. and then you need college level maths
steady basalt
Uhhh college level? I doubt I’ll make it that far
wooden sail
the questions you showed that other time involved linalg and multivariate calc
wooden sail
plugging into formulas and understanding what you're doing are two different things though
steady basalt
But if that’s your definition of college level then yeah that’s where im headed in at least “understanding”
wooden sail
and HS is usually the former
steady basalt
But plugging shit in is what I’d not like or he good at
Alot of work to practise method
I wonder in a few years time all this will be rendered useless by advanced tools we can’t imagine today
Codex is coming along fast
wooden sail
stop wishing and start working. you'll also be dead in a few decades, but you don't bury yourself alive today because of it
serene scaffold
wooden sail
stop wishing and start working. you'll also be dead in a few decades, but you do...
this reminds me of an Alex Jones rant where he demanded that the globalists stop concealing the existence of the Life Extension Technology, but I can't find it in the sea of his bizarre content.
steady basalt
wooden sail
stop wishing and start working. you'll also be dead in a few decades, but you do...
True….
I’m just glad I’m enjoying it or I certainly couldn’t force myself to read it
Now what is not enjoyable Is having to learn pyspark and stay good at sql for interviews
Which is def more important but not fun
 timid kiln
Regarding data cleaning, I have a very broad based question. Can y’all direct me to a web resource that would help me understand the general concepts?
 kind herald
hey so ive been getting into machine learning an ai a lot recently and was wondering if there way a way i could from scratch teach a bot to play chess. Not like stockfish but i want it to learn like a human. I want it to make mistakes then learn from those mistakes, Or have something done against it and then see how to do it and learn that. Would that be possible or no?
steady basalt
kind herald
hey so ive been getting into machine learning an ai a lot recently and was wonde...
That wudnt be easy
kind herald
steady basalt
That wudnt be easy
I know
but i have a crap ton of time and dedication
dusty valve
kind herald
hey so ive been getting into machine learning an ai a lot recently and was wonde...
sounds like something where reinforcement learning would come in handy
im haven't started that though, im still learning nets
kind herald
dusty valve
sounds like something where reinforcement learning would come in handy
I don't want to use reinforcement learning. I don't want to be there telling it something. I want it to play against people and get better at chess that way. or is that reinforcement learning?
dusty valve
kind herald
I don't want to use reinforcement learning. I don't want to be there telling it ...
that's kinda it
dusty valve
kind herald
so it learns from mistakes?
essentially, yes
 sharp sinew
attrib,counts = np.unique(data['workclass'], return_counts = True)
most_freq_attrib = attrib[np.argmax(counts, axis = 0)]
print(most_freq_attrib)
data['workclass'][data['workclass'] == '?'] = most_freq_attrib
is attrib and counts two variables??
or what ,kindly some one help?
 strange idol
I have been working on a machine learning model recently and I wanted to ask something about improving the training accuracy.
If I train a model and use cross fold validation, eventually assessing the accuracy of that model, how can I be sure that the resulting confusion matrix will be "good". When I test the model later on the test dataset the confusion matrix looks really bad (I am aware that I dont think this is good practise? but I am not sure how to test the trained model for number of false positives etc). Does this make sense to anyone here?
kind herald
dusty valve
essentially, yes
great
earnest widget
wooden sail
oh, looks nice. what's your question regarding the 80
Sorry for the late reply, yeah I think I figured it out because my validation set has too few samples (unrepresentative validation set) compared to my training so I just changed up the split, will try it out now.
earnest widget
bold timber
Hi, how to analyze the model overfit or not? What plot can be analyzed for model...
Check out this link: https://machinelearningmastery.com/learning-curves-for-diagnosing-machine-learning-model-performance/
Super useful to understand the learning curves.
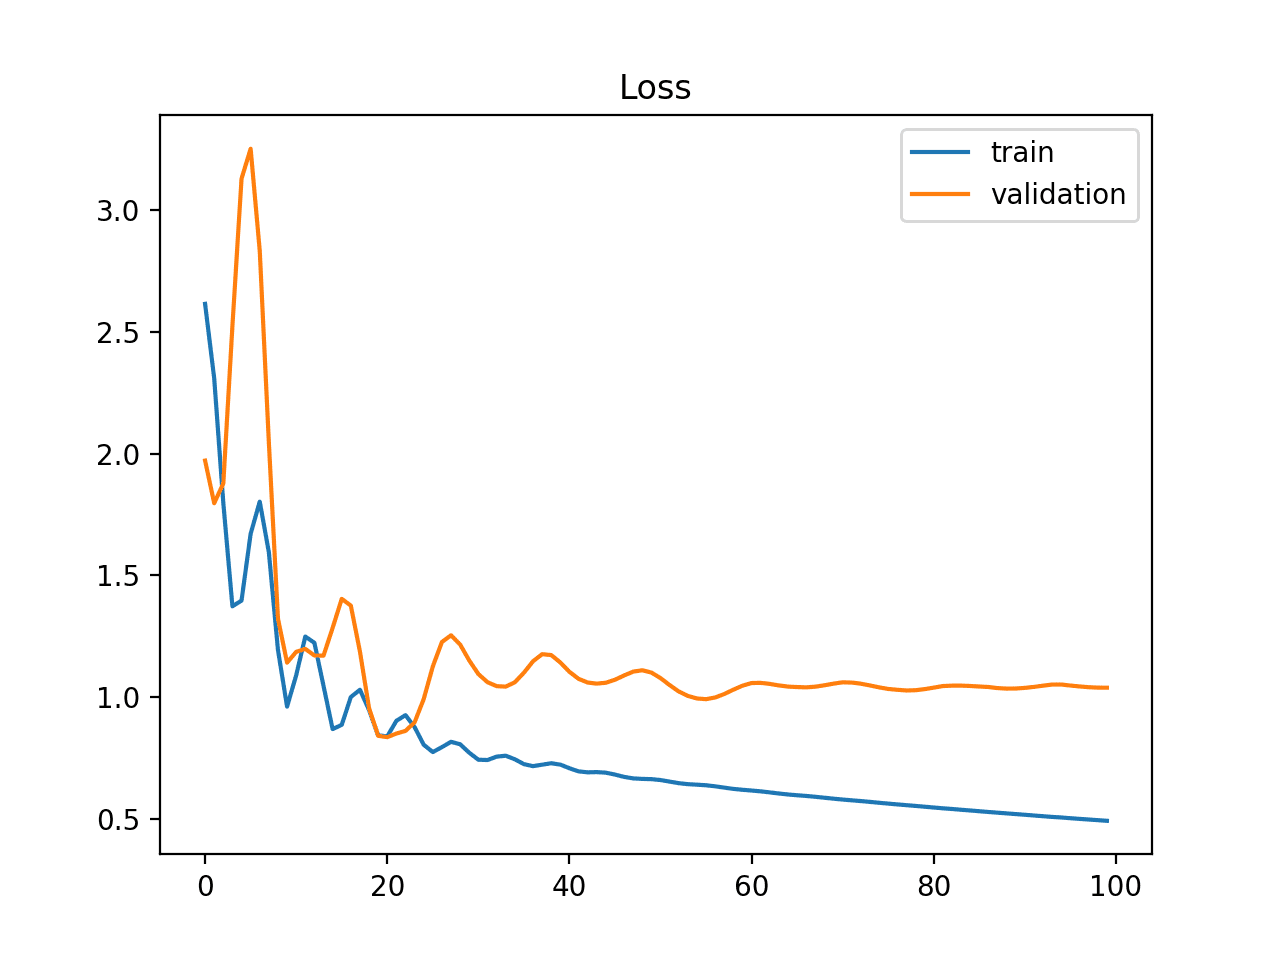
A learning curve is a plot of model learning performance over experience or time. Learning curves are a widely used diagnostic tool in machine learning for algorithms that learn from a training dataset incrementally. The model can be evaluated on the training dataset and on a hold out validation dataset after each update during training […]
 manic linden
hello, im having difficulty plotting something, before I ask, are questions allowed here?
serene scaffold
manic linden
hello, im having difficulty plotting something, before I ask, are questions allo...
yes.
manic linden
trying to bar chart between two features 'sex' and 'survived'. Sex has 'male' and 'female' values while Survived has 1 and 0.

but im trying to plot a graph in this way, any help?

 tacit nacelle
@manic linden please mention me when you finish your question I don't want to interrupt you
manic linden
im done 🙂
tacit nacelle
manic linden
im done 🙂
I mean when you find the answer.. cuz I want to ask a question too
tacit nacelle
Okay
How can I set a region of interest (ROI) if I'm working with opencv
Actually I've seen someone put it as [(x1,y1),(x2,y2).....] And it worked for him but he's working with cuda but for me it shows an error
The ROI that I want is not square shaped
wooden sail
whats up
dusty valve
im having a hard time understanding convolutional layers, anyone mind summing them up
wooden sail
what do you wanna know about them? do you know what a convolution is?
dusty valve
wooden sail
what do you wanna know about them? do you know what a convolution is?
im learning about convolutional networks in image classification rn, i don't get what a filter is though. i've read
A filter is a m x n pattern of pixels that we are looking for in an image
but i don't understand it fully
earnest widget
manic linden
but im trying to plot a graph in this way, any help?
You can do this with seaborn, you need grouped bar plot. Check this link: https://stackoverflow.com/questions/47796264/how-to-create-a-grouped-bar-plot second answer. I have not used matplotlib/seaborn in awhile. The DF needs to be grouped right though.
wooden sail
dusty valve
im learning about convolutional networks in image classification rn, i don't get...
so you don't know what a convolution is. i think it helps to look at the 1D case, since it generalizes
dusty valve
wooden sail
so you don't know what a convolution is. i think it helps to look at the 1D case...
alr
thnx
wooden sail
dusty valve
alr
here's a decent animation
 manic linden
earnest widget
You can do this with seaborn, you need grouped bar plot. Check this link: https:...
manic linden
earnest widget
You can do this with seaborn, you need grouped bar plot. Check this link: https:...
I'm looking for ways only in plotly friend. Also can you say how the df needs to be grouped?
wooden sail
oof wait, i didn'T copy the gif
wooden sail
dusty valve
alr
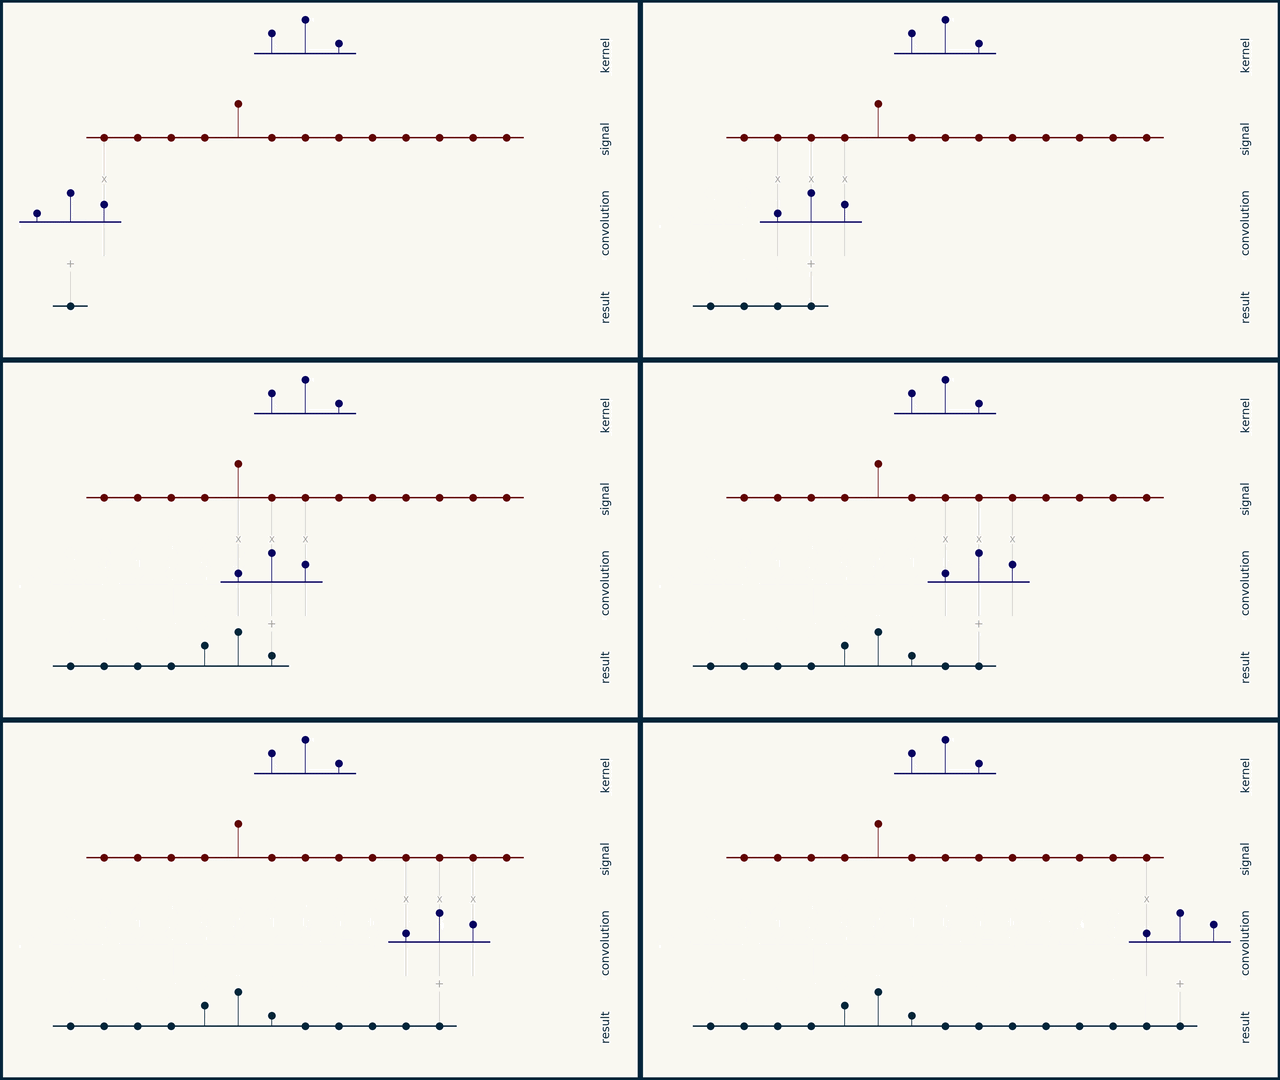
here we go
the small sequence of 3 spikes is a "filter" or "convolution kernel" or "convolution mask"
convolution can be understood as a "delay, multiply, add" operation
dusty valve
and it looks for dot products in what it's analyzing, and adds them?
wooden sail
you take this sequence, multiply it element by element with your data, and add the result. this gives you a single scalar. you then slide the filter one element to the right, and repeat
dusty valve
wooden sail
https://e2eml.school/images/conv1d/aa_copy.gif
.bm convolution gif
wooden sail
dusty valve
and it looks for dot products in what it's analyzing, and adds them?
right! you can interpret it as several dot products, yes
wooden sail
that should hint at the ability to represent the entire convolution as a matrix
and in several dimensions, as a tensor, etc
earnest widget
manic linden
I'm looking for ways only in plotly friend. Also can you say how the df needs to...
Oh plotly, I think this will be good then: https://www.geeksforgeeks.org/how-to-group-bar-charts-in-python-plotly/ what you are doing is good but you will have to separate into two Bar() functions for both categories (Survived, Died).
steady basalt
@wooden sail whats up is log rules and balancing an equation
4 * 3^x = 7 * 5^x i think it was

13 had me stumped
Possibly cause of order of operations
Log(4*3^x) right?
Isn’t that just log4+log3^x
wooden sail
sounds about right
wooden sail
log4 + xlog3 = log7 + xlog5 #let's rearrange: all x's on one side, constants on the other
log 4 - log 7 = x log 5 - x log 3 #nice. now let's use log properties
log(4/7) = x (log 5 - log 3) #here we also factored out x. we can still apply log rules on the RHS
log(4/7) = x log (5/3) #we're in the clear now
x = log(4/7) / log(5/3)
thorn bobcat
---------------------------------------------------------------------------
InvalidArgumentError                      Traceback (most recent call last)
/var/folders/r4/33p6_q_94wg_hkgz40gc8ngr0000gn/T/ipykernel_7963/1152504425.py in <module>
      2               loss='binary_crossentropy',
      3               metrics=['accuracy'])
----> 4 history = model.fit(train_ds, validation_data=test_ds, epochs=150, use_multiprocessing=False)

~/.pyenv/versions/3.8.10/lib/python3.8/site-packages/keras/utils/traceback_utils.py in error_handler(*args, **kwargs)
     65     except Exception as e:  # pylint: disable=broad-except
     66       filtered_tb = _process_traceback_frames(e.__traceback__)
---> 67       raise e.with_traceback(filtered_tb) from None
     68     finally:
     69       del filtered_tb

~/.pyenv/versions/3.8.10/lib/python3.8/site-packages/tensorflow/python/eager/execute.py in quick_execute(op_name, num_outputs, inputs, attrs, ctx, name)
     56   try:
     57     ctx.ensure_initialized()
---> 58     tensors = pywrap_tfe.TFE_Py_Execute(ctx._handle, device_name, op_name,
     59                                         inputs, attrs, num_outputs)
     60   except core._NotOkStatusException as e:

InvalidArgumentError: Cannot assign a device for operation sequential/dense_features/Stage_embedding/ReadVariableOp: Could not satisfy explicit device specification '' because the node {{colocation_node sequential/dense_features/Stage_embedding/ReadVariableOp}} was colocated with a group of nodes that required incompatible device '/job:localhost/replica:0/task:0/device:GPU:0'. All available devices [/job:localhost/replica:0/task:0/device:CPU:0, /job:localhost/replica:0/task:0/device:GPU:0].
Colocation Debug Info:
Colocation group had the following types and supported devices:
Root Member(assigned_device_name_index_=2 requested_device_name_='/job:localhost/replica:0/task:0/device:GPU:0' assigned_device_name_='/job:localhost/replica:0/task:0/device:GPU:0'```any idea why this is happening?
earnest widget
thorn bobcat
```py
--------------------------------------------------------------------------...
Maybe check this GH issue?https://github.com/tensorflow/recommenders/issues/269 looks similar. Never gotten an issue like this before. Maybe change some stuff in your model config during compile.
 royal hound
 thorn bobcat
earnest widget
Maybe check this GH issue?https://github.com/tensorflow/recommenders/issues/269 ...
thorn bobcat
earnest widget
Maybe check this GH issue?https://github.com/tensorflow/recommenders/issues/269 ...
yup that's my issue!
sadly it's not resolved yet..
earnest widget
thorn bobcat
sadly it's not resolved yet..
It's something related in optimizer for the model?
thorn bobcat
yea it's a problem with adam
steady basalt
UndefinedMetricWarning: F-score is ill-defined and being set to 0.0 due to no true nor predicted samples. Use `zero_division` parameter to control this behavior.
anyone know why this happens for my grid search?
my y_train literally has 0s or 1s
steady basalt
wooden sail
log4 + xlog3 = log7 + xlog5 #let's rearrange: all x's on one side, constants on ...
ah didnt know u can factor out x using log on only constants
wooden sail
i only used properties of logs and basic factoring
the factoring part had nothing to do with logs, that's just how multiplication works
steady basalt
wooden sail
the factoring part had nothing to do with logs, that's just how multiplication w...
do u know why im getting that error
wooden sail
what error
steady basalt
that one above
dusty valve
steady basalt
that makes 0 sene
quite ironic
steady basalt
Unnamed: 0
ffs, this was in my csv after merging
only 1 class presentin y true
ODD
{0: 97346, 1: 1894}
train set not sure how 3cv grid search somehow manages to not have a single one of those labels
earnest widget
thorn bobcat
yea it's a problem with adam
Tried using a different optimizer? Usually with adam, there should not be any issue. Idk about Adamax though.
steady basalt
this makes 0 sense at all
thorn bobcat
earnest widget
Tried using a different optimizer? Usually with adam, there should not be any is...
Idk what else to use tbh..
earnest widget
thorn bobcat
Idk what else to use tbh..
Try SGD, RMSProp? Get it to work first, then we can see about the results later.
 bright meadow
Why is this happening?

 earnest widget
bright meadow
Why is this happening?
earnest widget
bright meadow
Why is this happening?
Try from tensorflow import keras after importing tensorflow.
bright meadow
earnest widget
Try ```from tensorflow import keras``` after importing tensorflow.
I am now getting the error ModuleNotFoundError: No module named 'keras.api'; 'keras' is not a package
earnest widget
bright meadow
I am now getting the error `ModuleNotFoundError: No module named 'keras.api'; 'k...
Install keras separately and check.
bright meadow
Ill do it in a bit
earnest widget
Or if that does not work, try from tensorflow.python.keras import layers
 long fulcrum
Just need some quick help. When you're doing comparisons, should you include data for both timelines?
For example, lets say you compare 3 months to the entire year. Do you remove the 3 months from the year or leave it in?
 slow tartan
can i plot the graphs on plotly express first and then integrate it into dash?
bold timber
Whether an 'input_shape' should be only in the first layer?
 wooden sail
only on the first, the rest are inferred automatically
bold timber
wooden sail
only on the first, the rest are inferred automatically
Thank you!
 glacial wadi
hwo can i solve this error

 celest vine
I want to build a prediction model that predicts what percent will a stock move tomorrow.
How to do this?
Want to predict for the next day only
 frail dune
Kekw
 steady warren
hi
I would like to store data in gpu memory
like huge numpy datasets
or just images etc
may I know how it is possible to do that
mild dirge
steady warren
may I know how it is possible to do that
You use a library that is able to do that with cuda
like pytorch for example
It can easily take a numpy array, and convert it to a torch tensor
Then you can call .cuda() on it to send it to gpu
mild dirge
glacial wadi
hwo can i solve this error
you are probably giving a numerical output, instead of categorical
for LR the output should be 0 or 1 for each sample
glacial wadi
mild dirge
for LR the output should be 0 or 1 for each sample
you mean ytrain should be 1 or 0?
glacial wadi
but it's price value
steady basalt
logistic predicts categories
mild dirge
Then why are you using logistic regression?
glacial wadi
glacial wadi
but it's price value
it can't be
mild dirge
Try linear regression, or an MLP
steady basalt
u need linear matey
glacial wadi
i tried it worked but why its not working with log reg
steady basalt
log reg predicts categories
mild dirge
You should try figure out what logistic regression is
glacial wadi
hmm
mild dirge
and what it is used for
glacial wadi
mild dirge
and what it is used for
what
steady basalt
you are not predicting categories area you
glacial wadi
iam predicting price
steady basalt
price is not a category is it ?
mild dirge
Right, so not a category
steady basalt
did you bin price?
glacial wadi
got it so i 'll use linear reg
steady basalt
probably
glacial wadi
steady basalt
did you bin price?
yes
steady basalt
dude are u serious?
mild dirge
send a snippet
steady basalt
how many possible outputs are there?
glacial wadi
steady basalt
how many possible outputs are there?
what do you mean?
steady basalt
what do yhou think i mean
glacial wadi
my english is not too good i asked because of that
steady basalt
what language do you speak
glacial wadi
turkish
steady basalt
i was under the impression that stats is interantionall english
sürekli veri
sıralı kategorik veriler
?
glacial wadi
so ?
steady basalt
so what one is your data
glacial wadi
iam checking
steady basalt
you should know
 steady basalt
i cant see price
glacial wadi
it's train data
mild dirge
That is the input
glacial wadi
sorry
steady basalt
well we need to see price : )
glacial wadi
wait a second
mild dirge
Yeah nw, gotto start somewhere ;P

 mild dirge
Okay, so price is a continuous value
Like the error suggests
it is not just True or False, or high or low
glacial wadi
hmmm
mild dirge
It is a number that can range between values
steady basalt
@mild dirge ive been wondering is there a specific cut off for continuous vs categorical as in linear vs logistic if you were to have many categories which almost becomes cont
mild dirge
So you want a model that does not just predict 0 or 1, but can predict a range of values
glacial wadi
mild dirge
it is not just True or False, or high or low
for this kind of datas i should use log regression?
glacial wadi
no for false or true or 0 ,1
steady basalt
for example age, many would argue is continuous in years, but technically age is binned into integers
mild dirge
steady basalt
<@309775277720993792> ive been wondering is there a specific cut off for continu...
Well if you have multiple logistic regresion, then the output categories are assumed to be independent, or at least there is no order or something
whereas for price, 0-10 and 10-20 are closer to each other than 0-10 and 50-60
mild dirge
whereas if we treat them as categories, the difference would be the same
mild dirge
We' re talking about output though
steady basalt
groups of 10
sure, logistic for 4 or 5 groups yes?
but what if you had 100 groups, not so much
it becomes more continuous
mild dirge
No, it will still be separate groups
steady basalt
thats the exact same for price though, if you use integers
mild dirge
If you use multiple logistic regression
steady basalt
ok how about this
mild dirge
mild dirge
If you use multiple logistic regression
this part is important
steady basalt
price of 1, 2 3 4 or 5
youd use logistic not linear
right
but what if that kept going up to 100, or 1000 you wouldnt
mild dirge
I' m not talking about whether or not grouping them removes order, i'm talking about multiple logistic regression does not use that order
steady basalt
i know, but its a question of where is the line drawn in something requiring use of logistic if theres starting to become alot of categories and not use linear in this context
mild dirge
Well, if there is an order, linear regression is better
steady basalt
if you are predicting agegroups of 10 years that is ordered, but if you h ave only 4 groups ur gona use logistic regression
mild dirge
If the groups are independent, and an output of 0-10 being mistaken for 10-20 is equally likely as being mistaken for 50-60, then logistic regression might be as good
glacial wadi
it worked for 1 min ago and i get 81 r2 score now iam getting another error called
'numpy.dtype[bool_]' object is not callable
glacial wadi
what's MAE
glacial wadi
it's working with knn
steady basalt
linear regression
glacial wadi
and when i use linear reg it gaves me error
steady basalt
some coding problems
glacial wadi
: (
steady warren
mild dirge
Then you can call `.cuda()` on it to send it to gpu
ok well
import torch
import numpy as np
r = np.random.random((150, 300))
r.cuda()
this is my code and it does not work
steady basalt
go and read about types of data
steady warren
apologies for being such a beginner
glacial wadi
 mild dirge
steady warren
ok well
import torch
import numpy as np
r = np.random.random((150, 300))
r.cuda...
mild dirge
steady warren
ok well
import torch
import numpy as np
r = np.random.random((150, 300))
r.cuda...
That is not using pytorch at all
You need to convert to a torch tensor
Which has a method .cuda()
glacial wadi
the error
 steady warren
mild dirge
Which has a method .cuda()
steady warren
mild dirge
Which has a method .cuda()
ahhh
mild dirge
steady warren
ahhh
Also make sure cuda is available
Check how to install it locally with cuda
steady warren
yep thanks that worked
 mild dirge
It should be a line you put in terminal

 worthy phoenix
is there a way to convert .parquet files to .tfrecords?
 modest barn
where can i get help for machine learning
steady basalt
glacial wadi
HAHAHAHAHAHAHAHAAHA YESSSSSSS IT WORKED FINALLY
u may want to look at MSE not r2
glacial wadi
what's deference between r2 and MSE
glacial wadi
steady basalt
u may want to look at MSE not r2
.
glacial wadi
steady basalt
u may want to look at MSE not r2
can you explain please
steady basalt
google that
u need to find out how good is ur prediction
now how good is ur data
 modest onyx
hello bruddas
I finally released my vid https://www.youtube.com/watch?v=-QQML5kf26Q

This is a video I speed ran to submit to #SoME2
pumped this out in a week
I'd appreciate any feedback
modest onyx
I used manimce
steady basalt
easy to use?
modest onyx
GitHub
A community-maintained Python framework for creating mathematical animations. - GitHub - ManimCommunity/manim: A community-maintained Python framework for creating mathematical animations.
modest onyx
steady basalt
easy to use?
I think if you're a good programmer it's pretty quick to pick up
steady basalt
nice, tho i doubt ill ever need to use it
modest onyx
I pretty much started using it just for this project a bit over a week ago
steady basalt
must have taken ages to make that video
unique flame
but the part at 6:24 is a screenrecording no?
steady basalt
bro u type raced tyler 1
modest onyx
the deadline was one hour when I decided to put it in, so I had no time to animate comparisons between different optimizers myself
steady basalt
oh that was someone else
modest onyx
steady basalt
bro u type raced tyler 1
oh yeah no I wish though
although right now I can beat him for sure
steady basalt
lol....
celest vine
RNN or LTSM?
wooden sail
modest onyx
I pretty much started using it just for this project a bit over a week ago
the video is really well made. too long for me to watch in detail rn so i can't comment on the content
exotic thicket
Hello, Guys can anyone interpret, what do I need to prove if I need to prove that the algorithm Converges.
wooden sail
you need to show that there is a well defined limit for a sequence of iterates
serene scaffold
wooden sail
you need to show that there is a well defined limit for a sequence of iterates
what is an iterate?
exotic thicket
cycle of operations is repeated, often to approximate the desired result more closely.@serene scaffold
In a perception learning algorithm, we have to satisfy the certain condition
serene scaffold
so it has a different meaning as a noun? I'm only familiar with the verb "to iterate" and the nouns "iteration", "iterator", "iterable"
exotic thicket
serene scaffold
so it has a different meaning as a noun? I'm only familiar with the verb "to ite...
Different meaning? I didn't understand
I would say the 3 nouns can be possible in perceptron learning algorithm
 exotic thicket
exotic thicket
exotic thicket
What points does N negation contains in the Algorithm as it's showing N inputs with label 0;
(I think the points in 2D or 3D or nD might be considered. Yes?)
wooden sail
serene scaffold
what is an iterate?
just a bad choice of wording (from my side) for an element of a sequence
serene scaffold
wooden sail
just a bad choice of wording (from my side) for an element of a sequence
"unusual" isn't the same as "bad".
wooden sail
the very formal definition goes kinda like this
.latex if for every $\epsilon > 0$, $\epsilon \in \mathbb{R}$, there exists an $N \in \mathbb{N}$ such that $\forall n \geq N$ we have that $\vert x_n - x \vert < \epsilon$, we say that the sequence ${x_n}$ \emph{converges} to x and write it as
\begin{align*}
\lim_{n \to \infty} x_n = x
\end{align*}
strange elbowBOT
 serene scaffold
you love the latex command 😄
wooden sail
the common approach for gradient methods is to assume the gradient is lipschitz continuous with constant L, and use this to show that by choosing the step sizes carefully, following the gradient produces a sequence abs(x_n - x) that goes to 0
wooden sail
serene scaffold
you love the latex command 😄
i do, i arguably write about equal parts python and latex in my day to day
 grand blaze
Just posted a data-science related question on #help-carrot
 long moth
are we allowed to share ML projects in this channel?
dusty valve
looking at a tensorflow tutorial, rn im looking at CNN's, and this tutorial on using the CIFAR10 dataset of images to train a CNN, can someone explain what the layers do? py model = models.Sequential() model.add(layers.Conv2D(32, (3, 3), activation='relu', input_shape=(32, 32, 3))) model.add(layers.MaxPooling2D((2, 2))) model.add(layers.Conv2D(64, (3, 3), activation='relu')) model.add(layers.MaxPooling2D((2, 2))) model.add(layers.Conv2D(64, (3, 3), activation='relu')) model.add(layers.Flatten()) model.add(layers.Dense(64, activation='relu')) model.add(layers.Dense(10)) the first layer is a convolutional layer, it takes 32*32 images (i think the 3 is for 3 color? rgb) and it applies a 3x3 filter 32 times. the next 4 layers just take the outputs of the filters, max pool them, and apply filters again.
i don't understand what the last 3 layers do
the last layer outputs 10 neurons, for 10 kinds of images in the cifar10 dataset, idk the other two
 tidal bough
and it applies a 3x3 filter 32 times
Not sure what you mean by that. It applies a 3x3 convolution, so it turns a 32x32x3 image to a, I believe, 30x30x3 one.
dusty valve
tidal bough
> and it applies a 3x3 filter 32 times
Not sure what you mean by that. It applie...
yeah that's what i meant
tidal bough
Flatten I think is equivalent to a .flatten() operation. It turns a multidimensional array to a one-dimensional one. No learning involved, it's just that Dense wants a 1d input.
dusty valve
kk
tidal bough
and at the end we have 2 dense layers, with a RELU activation in between.
dusty valve
tidal bough
and at the end we have 2 dense layers, with a RELU activation in between.
what does the second to last dense layer perform?
tidal bough
Nothing specific. That's like asking what each layer does in an NN composed only of dense layers. Hell if we know, we pour data into it and the whole thing gravitates towards a configuration that produces good results.
If you mean why use 2 layers at the end instead of 1 or 3 - no idea, presumably that worked the best in practice or something.
dusty valve
tidal bough
Nothing specific. That's like asking what each layer does in an NN composed only...
well, it didn't perform well
0.15 accuracy 😬
tidal bough
🥴
dusty valve
and this is a tensorflow tutorial mind you
unique flame
I think I just saw the same tutorial, they got 0.71 tho
unique flame
I'm running it
mine is already starting at 0.44
Ay it finished, it's the same as theirs: 0.71
 spare briar
Don't you need a softmax layer at the end?
oh I see tensorflow puts the softmax in the CCE loss
steady basalt
yo can someone help me code something
I have a list of strings that are column names and i want to be able to say for any columns which are inside that list, pd.get dummies them, so i can have a blanket list to cover all datasets without getting the 'this col doesnt exist so cant get dummies' error?
serene scaffold
steady basalt
I have a list of strings that are column names and i want to be able to say for ...
You can use sets to only get the intersection of your list and the set of column names.
from functools import reduce
from operator import and_

labels: set[str]
dataframes: Iterable[pd.DataFrame]

shared_labels = reduce(and_, (set(df.columns) for df in dataframes), labels)
are those packages part of python or
serene scaffold
they're stdlib stuff, yes.
steady basalt
hol up
ok heres whats up. i have a massive function to make it quick and easy for someone to plug in their csv thats loaded earlier. for example you type my_func(df1) that was preloaded and it will preprocess that, such as splitting x and y, train test split, scaling, pca... then it will random forest grid search and spit out metrics of a few models and some other stuff in a single cell
and that thing i mentioned is because df1 and df2 will have one column different
serene scaffold
so do you want to figure out what column names appear in all dataframes of interest?
steady basalt
a further issue is for x/y split for another dataset entirely form another source, which uses mostly the same column names except in this case y will be from something else.
its prob easier if i show u, can u dm a snippit
serene scaffold
why not here?
steady basalt
its uhh, my thesis
serene scaffold
alright.
serene scaffold
yes.
steady basalt
ValueError: Only one class present in y_true. ROC AUC score is not defined in that case.
UndefinedMetricWarning: F-score is ill-defined and being set to 0.0 due to no true nor predicted samples. Use `zero_division` parameter to control this behavior.
anyone know why I get these? I have 0's or 1's as my labels
mild dirge
Is your model only predicting one of them?
steady basalt
it usually works just fine in classifying binary
mild dirge
oh nvm y_true
Do you do it in batches?
if so, how large are those batches, and could it be that there are no true predictions in that batch
steady basalt
No, its random forest, check this out
    print(len(X_test),len(y_test))
    unique, counts = np.unique(y_train, return_counts=True)
    print(dict(zip(unique, counts)))
    print(np.unique(y_train))
    unique, counts = np.unique(y_test, return_counts=True)
    print(dict(zip(unique, counts)))
print(np.unique(y_test))```11027 11027
{0: 97299, 1: 1941}
[0 1]
{0: 10864, 1: 163}
[0 1]```so my training data cannot be the problem
as according to google, this is an issue where theres missing labels in y_true, and since this is for a training grid search it would mean that the error has some up unexpectedly
mild dirge
Wouldn' t know about missing labels, just that there is only 1 value present in y_true
steady basalt
as u can see theres almost 2000 1s and 100k 0s. so why would it tell me this error
mild dirge
How are you checking the score
steady basalt
ytrue in this case is y_train. and as you can see y_train has two labels
so im extremely confused about that warning
wdym checking score
                                 random_state=30,verbose=0,n_jobs=-1,cv=3,scoring='f1',
).fit(X_train, y_train,)```yOUA RE GETTING AN ERROR FOR THE SCORE
Whoops caps
Okay, so you are doing it in batches
right?
steady basalt
doesnt make a different cause theres no way thats the root of the problem
i can disable cv
removed the cv=3 and still error comes
and even if it was what ur thinking, how likely would that be
that not a single 1 entered a kfold
oh its 5 by default, lol
doesnt it randomly draw labels?
yes, by default on binary data, it uses stratifiedkfold
this 100% isnt the problem
mild dirge
Well somewhere in your code it is trying to calculate the score, and it only gets 1 value in y_true
steady basalt
shuffle is false in this sklearn stratified kfold. could this be why?
i thought that its always randomly taking values and keeping their percentages
so makes 0 sense why this can happen when theres 1900 1's
mild dirge
Never used halving grid search, but doesn' t it take less and less samples or something
steady basalt
and only 3 possible folds they can enter
mild dirge
Which would make it feasible for it to pick such a small sample that it doesn' t contain 1s
steady basalt
i didnt have this issue before on the same data
mild dirge
steady basalt
``` search = HalvingGridSearchCV(clf, params,
r...
The error is on this line right?
steady basalt
also when you test train split doenst it randomly shuffle, so what exactly are the odds of 1900 out of 100,000 not entereing one of the 3 kfolds
its just a warning not error, it sitll runs but it send that warning 1000 times
mild dirge
Read 2 messages up please, I gave a possible explanation
Do you know how halving grid search works?
steady basalt
ill try to playt with the resources then
mild dirge
It limits the amount of samples I think
mild dirge
steady basalt
also when you test train split doenst it randomly shuffle, so what exactly are t...
So this would not be the case
steady basalt
would i say min_resources = 100000
mild dirge
Pick an amount in which it is unlikely to get only zeros
!e
print((10864 / (10864 + 163)) ** (1000))
@mild dirge :white_check_mark: Your 3.11 eval job has completed with return code 0.
3.4070802428757866e-07
This would be the chance to get only zeros for 1000 samples f.e.
You can change the last number to check which number gives a reasonably low chance for it to happen
steady basalt
that was what i was saying, its really not likely
oh, ur looking at my test set. this issues with training data
mild dirge
I don' t know what the current minimum is
steady basalt
as its gridsearch
mild dirge
steady basalt
oh, ur looking at my test set. this issues with training data
Doesn' t matter too much, the distribution is the same
steady basalt
min_resources by default is exhaust
let me change that to... 5000?
interesting, errors stopped coming
how many samples would exhaust have used?
The minimum amount of resource that any candidate is allowed to use for a given iteration. Equivalently, this defines the amount of resources r0 that are allocated for each candidate at the first iteration.

‘smallest’ is a heuristic that sets r0 to a small value:

n_splits * 2 when resource='n_samples' for a regression problem
n_classes * n_splits * 2 when resource='n_samples' for a classification problem
1 when resource != 'n_samples'
‘exhaust’ will set r0 such that the last iteration uses as much resources as possible. Namely, the last iteration will use the highest value smaller than max_resources that is a multiple of both min_resources and factor. In general, using ‘exhaust’ leads to a more accurate estimator, but is slightly more time consuming.
by the way, why does halving grid search start with less resources?
mild dirge
No clue, like I said, not very familiair with halving grid search, but somehow it used to few samples that gave only zeros
steady basalt
probably only start with like 50
mild dirge
yeah with 50 samples the chance to get only zeros is about 50%
steady basalt
this issue would be resolved also by using smote or undersampling but i skipped that to retain data and not add more noise, instead used class_weights = balanced in my RF. good idea?
mild dirge
I have never really considered it, but from a quick google search it seems people tend to get better resuls with that than smote
since you get to use all data, and don' t have to "generate" new synthetic data
steady basalt
and also random noise is massive issue for my crappy data. i think smote would make that worse
 desert oar
i see you're still hacking away at this. i actually did some digging into this topic for my own work recently, and i feel a lot more educated than when i was last helping you
i didn't look into smote, but i was looking into various performance criteria for classification and binary decision problems in general
what's the current state of your project @steady basalt?
desert oar
i'd rather keep the discussion here
steady basalt
I have seperate files only for curating and making datasets
i have decided all results will be obtained using a single ipynb file that uses a single function, which iteratively does preprocessing and predictions as well as print results in a single cell
such that someone can just open it press enter and not worry about having 15 ipynb files which all have like 50 million cells
desert oar
sure, whatever workflow is good for you
regarding the grid search, it seems like you are hitting some kind of error related missing y values? this is a known problem with scikit-learn when splitting, the label encoder is "fitted" only to the data in each split and not to the full dataset, leading to a situation where different splits have different binarized/encoded labels
steady basalt
we have deduced the problewm was that halvinggscv started with possible only <30 resources, or samples
i have set min_smaples to 5000 and it avoids that issue
[CV 1/3] END bootstrap=True, criterion=entropy, max_depth=7, max_features=10, min_samples_leaf=5, min_samples_split=5, n_estimators=500, n_jobs=-1;, score=(train=0.316, test=0.043) total time= 4.4s but out of the frying pan and into the fire
0.043
desert oar
are you still using precision for scoring?
steady basalt
no, f1
basically what i get is 0.6 recall and 0.04 precision at best, i actually had one AB tes thtat instead of PCA selected useful features that got 0.3 rcall and 0.7 precision, might try and use that instead and fiddle until thjeyre bo th good
wooden sail
i'd comment that i'm under the impression smote should improve your SNR, assuming ofc that convex combinations of noiseless observations are also valid observations (i.e. follow the same model as the actual measurements)
desert oar
have you actually inspected some of the misclassified cases manually?
consider what 0.04 precision means: on all of your positive predictions, only 4% are correct.
is this a binary problem, or multiclass?
steady basalt
wooden sail
i'd comment that i'm under the impression smote should improve your SNR, assumin...
sorry, whats snr
steady basalt
desert oar
is this a binary problem, or multiclass?
binary.
and as youve seen class imabalance is huge - but random_forest class_weights balanced ought to fix that issue
logistic regression actualy holds up alright but still not good
wooden sail
i'm making lots of assumptions here, but they're common ones. let's say we have two noisy observations d1 = x1 +n1, and similarly for d2, where di is the ith observation with true mean xi and noise ni, assuming the noise is uncorrelated with the true mean and is independently and identically distributed. let's say the noise has variance s^2. then the variance of di is s^2. how about the variance of 1/2 d1 + 1/2 d2? that'd be the variance of 1/2(d1 + d2) + 1/2 n1 + 1/2 n2. if 1/2(d1 + d2) is a valid true mean, the variance of this observation is now 1/2 s^2. similar results entail for different weights of the convex combination, with 1/2 yielding the greatest noise reduction, increasing monotonically until 1 (which is the same as just keeping the regular data)
you said noise was an issue. snr is "signal to noise ratio"
steady basalt
so basically what youre saying is that noise here isnt actually that of a bad thing
by noise i guess i just meant, very hard data to predict
steady basalt
like, extremely hard to not overpredict minority class when classweights are balanced
soa hard to the point that im just giving up and submitting my results for my thesis liek this
desert oar
i still suggest that you might want to go back and inspect the misclassified results
4% positive predictive value is suspicious that youre just doing something wrong
steady basalt
[CV 3/3] END bootstrap=False, criterion=entropy, max_depth=15, max_features=sqrt, min_samples_leaf=5, min_samples_split=2, n_estimators=100, n_jobs=-1;, score=(train=0.897, test=0.058) total time= 0.5s wonder why this is happening
desert oar
or the classifier has simply failed to learn the associations in the data
depth of 15 is huge
steady basalt
i gave it choices and its currnetly clearnig them
desert oar
your RF might be badly overfitted
steady basalt
[CV 2/3] END bootstrap=True, criterion=log_loss, max_depth=7, max_features=30, min_samples_leaf=5, min_samples_split=5, n_estimators=250, n_jobs=-1;, score=(train=0.306, test=0.038) total time= 2.3s
this is on train data
desert oar
what is the actual distribution of classes again?
what's the % of positive instances?
 marble cobalt
Has anyone here used spacy’s span categoriser?
steady basalt
positive
@desert oar if you genuinly think this is a problem that can be solved id be eternally in your gratitude if you pulled it off i would be willig to share screens so long as you only see PCA'd features as its quite sensitive data
desert oar
and what are your features again?
steady basalt
liek i said, it hsowed promise with 0.7 precision but 0.3 recall when using non pca'd features at one point
desert oar
how many and what kinds of data?
steady basalt
can I walk you through that in dms?
desert oar
just give me the high level summary. is this social science data? high-sparsity binary/categorical data like gene expressions? text? some combination of those? other?
steady basalt
i have a handful of continuous medical variables, and a handful of categorical social and medical infomration such that combined, one-hot encoded dataset is 60+ features
and yea, pca worked out alright even on that
trying the pca approach down to <25 features is passible, as is RFE on high scoring features to <10 features, which actually yielded good results at one point, but ive sort of gotten stranded now
iirc, its 5 cont. and about 6 categoricals of which most contain at least 5 categories
desert oar
steady basalt
i have a handful of continuous medical variables, and a handful of categorical s...
didnt i suggest not one-hot encoding the binary variables?
that should make the RF fit better
steady basalt
there are no binary variables that have befen one hot encoded
only 3+ categorical variables
sex, for example, is left as sex
ethnicity, has been encoded into about 8 features
age groups likewise
so yeah not rly sure and the deadlines in 3 weeks and i have not written the thesis up yet so i have to consider giving up and just reporting as is
@desert oar im 99% sure its not a obvious and large mistake but just a classifiers inability to learn form this data
desert oar
steady basalt
only 3+ categorical variables
im saying to leave those as categorical too
steady basalt
theyre numbers
id have to go and code them to strings
ohe shudnt be a make or break issue here
ive treid logistic regression, random forest and xgb
and svm
they all have the same problem
PCA down to 20 features shud be enough
 wicked grove
Hello i want to add an svm classifier at the end of vgg16
Im collecting all the features using features_ex=model.predict(X_train)
Is this correct or do i have to iterate over every image collect the features,append it in a list and then put it to an svm
desert oar
steady basalt
ohe shudnt be a make or break issue here
it definitely can cause a problem in RF models, but i agree that it probably isn't "the" problem in this case
trying different model types isn't likely to help
you have a more systemic problem here in your setup somewhere
e.g. do you get better performance when using a subset of features?
steady basalt
desert oar
e.g. do you get better performance when using a _subset_ of features?
ive seen better results by using recursive elimination to take the highest scoring features, yes, but i prefer to just use pca
and in doing so down to 20 features i keep 80%+ var
thinking back to when i had high precision and low recal, maybe thats better
desert oar
steady basalt
and in doing so down to 20 features i keep 80%+ var
20 pca components?
that's a lot to get 80% variance, in most datasets i am in the high 90s with just 4 or 5. there must be a lot of weakly correlated features here
the other issue with pca is that you lose a lot of your ability to construct nonlinear relationships. i'd sooner recommend not using pca, but also not one-hot-encoding the categorical features.
alternatively, i'd say stick with logistic regression until you work out the problems in your pipelie
logistic regression should beat random guessing
if you always guess the more common class, then random guessing should just you precision == accuracy == prevalence of that class, which i think is 2% based on the numbers you showed above. so i guess 4% precision is beating it, although not by much
wait... i think. i got about 3 hours of sleep so i'm not 100% on that. check my math
yeah that should be right. and sensitivity/recall should just be 100%
steady basalt
desert oar
if you always guess the more common class, then random guessing should just you ...
well if both class recall > 0.5 it is also doing something not random
desert oar
steady basalt
well if both class recall > 0.5 it is also doing something not random
sure, but clearly whatever it's doing is almost as bad as random guessing on the positive class
i still suggest using logistic regression for simplicity and then manually inspecting some of the misclassified positive cases to get a better sense of what might be going wrong
look at the regression coefficients too
steady basalt
its kinda hard to diangose that after pca
desert oar
sort of, but not entirely
you can still look at the underlying feature values for those data points
treat pca as part of the model pipeline
steady basalt
desert oar
you can still look at the underlying feature values for those data points
idk how
steady basalt
[CV 2/3] END bootstrap=True, criterion=entropy, max_depth=7, max_features=sqrt, min_samples_leaf=2, min_samples_split=2, n_estimators=100, n_jobs=-1;, score=(train=0.793, test=0.693) total time= 0.6s after SMOTE
@desert oar though im pretty sure that thats meaningless when the test set is very imbalanced
if my logic is right
desert oar
steady basalt
<@389497659087650836> though im pretty sure that thats meaningless when the test...
meaningless how? what did you change?
modest onyx
wooden sail
the video is really well made. too long for me to watch in detail rn so i can't ...
🙏 🙏
 prime kite
is there a way to make tensorflow ignore black cells in a csv file (NaN values)

this doesn't work
 viral thicket
hey guys
serene scaffold
prime kite
is there a way to make tensorflow ignore black cells in a csv file (NaN values)
You have to either fill the nans with something, or drop entire rows and entire columns that have any nas.
I would have to see the data to know why this allegedly doesn't work.
desert oar
prime kite
a.replace(np.nan, ''), you have the arguments swapped
but i prefer to writea = a.fillna(''), or at least write None instead of np.nan
oh, i see. you're replacing empty string values with nulls?
you need to use dropna on rows probably
prime kite
serene scaffold
You have to either fill the nans with something, or drop entire rows and entire ...
I fixed it by just making the blank cells in excel the cell below it
 gilded kestrel
hi, need some input. At work there is a data studio dashboard with filters but that's too limiting and I'm looking at different options. I'm looking at either a dash app or a streamlit app hosted on gcp. My understanding is that only those with access to the company's gcp can have access, is that right?
 strange marsh
Just wanted to let you know that Andrej Karpathy, who was leader of Tesla AI team made channel and great explanation of how AI works with code he wrote on fly
https://www.youtube.com/watch?v=VMj-3S1tku0
This is the most step-by-step spelled-out explanation of backpropagation and training of neural networks. It only assumes basic knowledge of Python and a vague recollection of calculus from high school.
Links:
- micrograd on github: https://github.com/karpathy/micrograd
- jupyter notebooks I built in this video: https://github.com/karpathy/rand...
modest onyx
holy shit!
wooden sail
this is probably a hot take, but explaining the maths through code is completely backwards, and there's so much bloat to get the visualization in the same notebook. this is everything that is wrong with learning math through code and also with using jupyter, imo
desert oar
not a hot take at all
 iron basalt
wooden sail
this is probably a hot take, but explaining the maths through code is completely...
iron basalt
wooden sail
this is probably a hot take, but explaining the maths through code is completely...
Code will always be more complex and bloated because it has the extra steps of making a physical machine do work that emulates the mathematics' ideas (and that machine has (engineering) constraints in how it works). It's extra steps not relevant until after you understand the idea that the math is trying to convey.
wooden sail
this went better than i expected 😛
iron basalt
Especially since you may also now need to spend months trying to get a good runtime complexity. So you actually have additional math problems to deal with (treating CS as math here).
So implementing something and explaining from that is like trying to explain a problem by explaining the more complex version.

 olive stirrup
Good morning, I don't know if it goes here. Does anyone know s sample to search for the source of an image using google lens (with the "search image source" option), I'm not interested in similar photos. Thank you in advance
wooden sail
sigh
wooden sail
mint palm
.latex the notation stands for cartesian product. it's telling you $\boldsymbol(f){(i,j)}$ is of the form
\begin{align*}
\mathbb{R} \times \mathbb{R} \times \cdots \times \mathbb{R},
\end{align*}
where the $\times$ is the cartesian product, and there are $d$ of them. this is simply a fancy way of saying $\boldsymbol{f}{(i,j)}$ has exactly $d$ elements, each of which is a real number.
strange elbowBOT
 wooden sail
there we go.
i guess i meant there are d - 1 cartesian products. sadly the bot doesn't have an edit option for tex yet
mint palm
wooden sail
i guess i meant there are d - 1 cartesian products. sadly the bot doesn't have a...
and the r meant real, or something else?
wooden sail
reals, yes
mint palm
ok thanks
steady basalt
desert oar
meaningless how? what did you change?
Meaningless as in it does great on smote data and not real test data
frail dune
guys could anyone help me I'm kinda lost
I want to create a Stiffness Matrix for that i need something like
([K11, K12,....K1n]
[.............................]
[.............................]
[Kn1, Kn2,....Knn]
with zeros in all entries (for example np.zeros)
and i want another Matrix
for example Matrix B to be added up on each Diagonal element
B is inserted to K11, K22, K33, ...., Knn
wooden sail
there's numpy.fill_diagonal. check this out:
In [1]: import numpy as np

In [2]: K = np.zeros((3,3))

In [3]: vals = np.array([1,2,3])

In [4]: np.fill_diagonal(K, vals) #modifies K in place

In [5]: K
Out[5]:
array([[1., 0., 0.],
       [0., 2., 0.],
       [0., 0., 3.]])
though you could alternatively make an actual diagonal matrix and add it to K if you wanted
more importantly, if you have an array of the elements you want on the diagonal, you can simply call np.diag instead
In [6]: np.diag(vals)
Out[6]:
array([[1, 0, 0],
       [0, 2, 0],
       [0, 0, 3]])
mach's gut
frail dune
Danke, okay I might have had the wrong approach ... I try to get this
 wooden sail
ah you want blocks
frail dune
yea
wooden sail
aight
the idea is that numpy can broadcast dimensions if you specify them correctly
you can specify rows as a column vector, and columns as a row vector
i know that seems backwards, but if you think about it, it's only natural
lemme make an example
frail dune
thank you, my problem is with the (4, 4) Matrix that is insertet into a (2, 2) Block
wooden sail
In [7]: M = np.zeros((6,6))

In [8]: block = np.ones((3,3))

In [9]: rows = np.arange(1,4).reshape(3,1) #as a column

In [10]: cols = np.arange(2,5).reshape(1,3) #as a row

In [11]: M[rows,cols] = block

In [12]: M
Out[12]:
array([[0., 0., 0., 0., 0., 0.],
       [0., 0., 1., 1., 1., 0.],
       [0., 0., 1., 1., 1., 0.],
       [0., 0., 1., 1., 1., 0.],
       [0., 0., 0., 0., 0., 0.],
       [0., 0., 0., 0., 0., 0.]])
you can achieve the same result using np.newaxis
frail dune
I'll try it with this approach thank you
wooden sail
In [14]: M = np.zeros((4,4))

In [15]: block = np.ones((2,2))

In [16]: rows = np.arange(2)[:, np.newaxis] #as a col

In [17]: cols = np.arange(2)[np.newaxis, :] #as a row

In [18]: M[rows,cols] = block

In [19]: M
Out[19]:
array([[1., 1., 0., 0.],
       [1., 1., 0., 0.],
       [0., 0., 0., 0.],
       [0., 0., 0., 0.]])

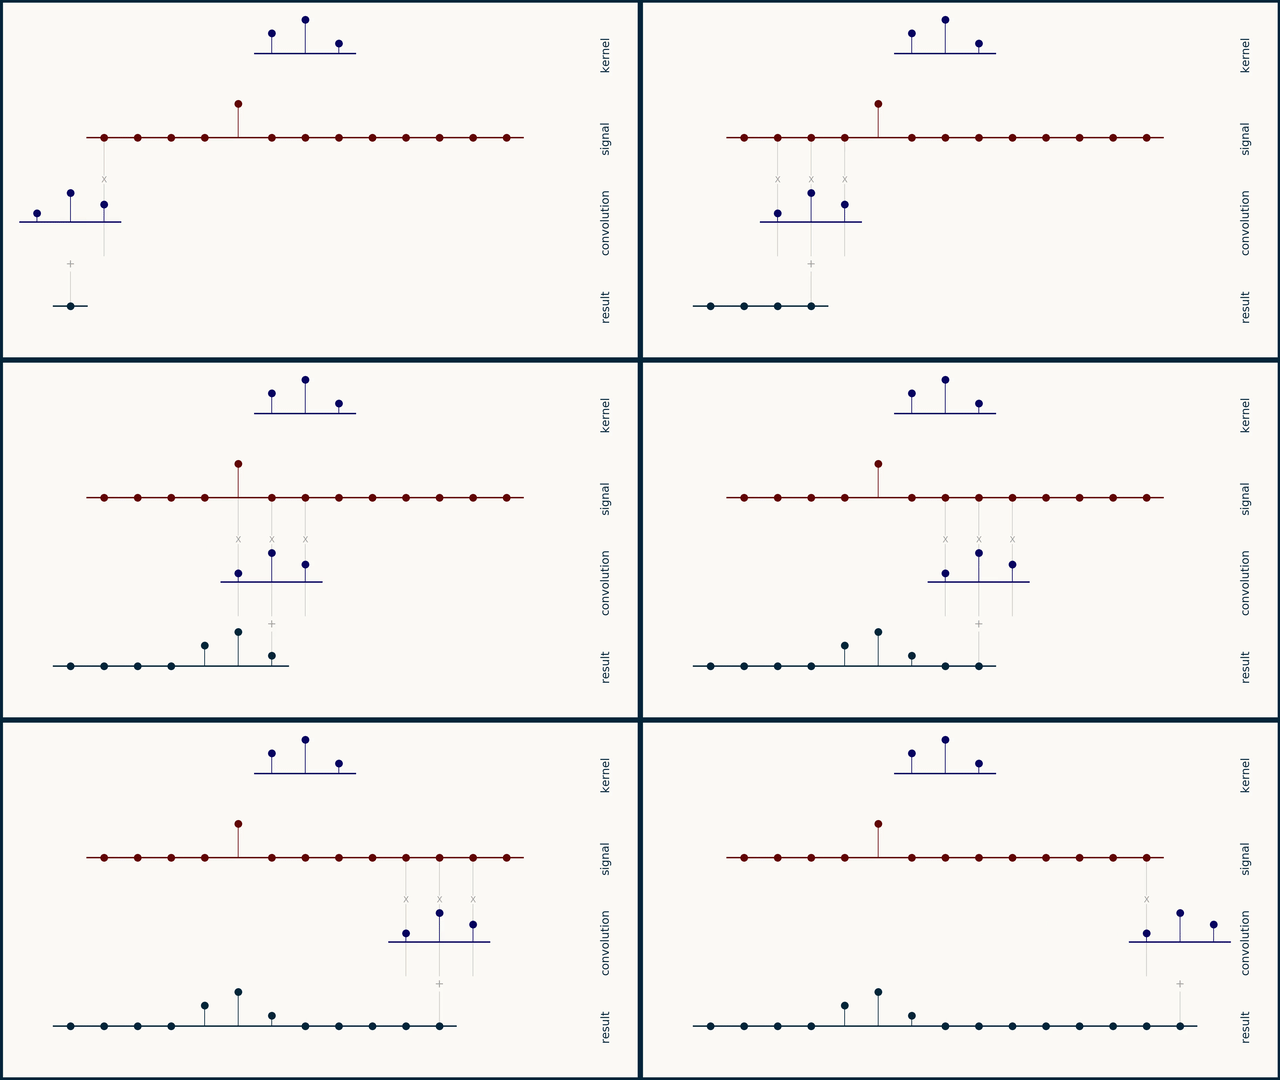 wooden sail
with the subscript 2, yes
you might run into expressions where it's not 2 but something else. 1 is common
mint palm
where can i get a collection of this notations?
wooden sail
in a linear algebra book 😛
or an optimization one
.latex the general definition goes kinda like this. given a vector $\boldsymbol{v} \in \mathbb{F}^N$, we define
\begin{align*}
\Vert \boldsymbol{v} \Vert_p = \left( \sum_{n=1}^N \vert v_n \vert^p \right) ^{1/p}
\end{align*}
and refer to it as the $\ell-p$ norm of $\boldsymbol{v}$. here, $\mathbb{F}$ is a suitable field, often $\mathbb{R}$ or $\mathbb{C}$
strange elbowBOT

 old grove
if weighted average gini in decision tree for two colums is same then how do we know which column to consider ?? or we can pick any column ??
wooden sail
.latex note that when $p$ is even, the absolute value is not needed. in your particular case with $p=2$, we get
\begin{align}
\Vert \boldsymbol{v} \Vert_2 = \sqrt( \sum{n=1}^N v_n ^2 ),
\end{align}
which is the usual quantity we associate with the length of a vector
strange elbowBOT
 wooden sail
i made some mistakes there, hopefully it's still understandable
frail dune
wooden sail
```py
In [14]: M = np.zeros((4,4))
In [15]: block = np.ones((2,2))
In [16]: ro...
yo Edd sorry for asking so many things but I really dont see how to implement my Matrix into this ;D
wooden sail
there are several options. you can do it as you have it in your drawing, by assigning 3 blocks. just make sure they overlap appropriately. alternatively, use 2x2 blocks, and then they don't overlap
notice that in your image, the lower 2x2 block of the green matrix was replaced
this tells me that you're supposed to write the upper block first, and the middle block second
that way the middle block replaces the lower corner of the first block, like so
In [20]: M = np.zeros((8,8))

In [21]: A = np.ones((4,4))

In [22]: B = np.ones((4,4))*2

In [23]: C = np.ones((4,4))*3

In [24]: inds = np.arange(0,4)

In [25]: M[inds[:,np.newaxis], inds[np.newaxis,:]] = A

In [26]: inds = np.arange(2,6)

In [27]: M[inds[:,np.newaxis], inds[np.newaxis,:]] = B

In [28]: inds = np.arange(4,8)

In [29]: M[inds[:,np.newaxis], inds[np.newaxis,:]] = C

In [30]: M
Out[30]:
array([[1., 1., 1., 1., 0., 0., 0., 0.],
       [1., 1., 1., 1., 0., 0., 0., 0.],
       [1., 1., 2., 2., 2., 2., 0., 0.],
       [1., 1., 2., 2., 2., 2., 0., 0.],
       [0., 0., 2., 2., 3., 3., 3., 3.],
       [0., 0., 2., 2., 3., 3., 3., 3.],
       [0., 0., 0., 0., 3., 3., 3., 3.],
       [0., 0., 0., 0., 3., 3., 3., 3.]])
idk if 2 is supposed to overwrite the corners of 1 AND 3, or of this order is correct. might be you have to assign 3 before 2
frail dune
I've also tried it with this approach
from getSbar import *
def getS(Sbar):

    n = 3
    S = np.zeros((2*n+2, 2*n+2))

    for i, j in Sbar:
        S[i, j] += Sbar[i, j]
    for i, j in Sbar:
        S[i + 2, j + 2] += Sbar[i, j]
    for i, j in Sbar:
        S[i + 4, j + 4] += Sbar[i, j]
but it seem to be wrong
I am just trying to learn many different ways but every single one seems to fail ;D
wooden sail
what you have here can work, if Sbar has the correct structure
Sbar would have to be a cartesian product
e.g. (0,0) (0,1) (1,0) (1,1)
if you have (0,0) and (1,1), that's only the diagonal elements
the reason i reshaped the indices into rows and columns is that numpy broadcasts that into a matrix isomorphic to a cartesian product
steady basalt
God damn I hate linear algebra
wooden sail
so your code is correct, but your Sbar is wrong
frail dune
So I would just have to rewrite Sbar into e.g.
Sbar[0,0] = 12
Sbar[0, 1] = 6*h
etc?
wooden sail
what do you hope is going to happen when you do for i,j in Sbar
frail dune
i hoped that it would end at (4,4)
wooden sail
then Sbar needs to be a cartesian product of (0,1,2,3) with (0,1,2,3)
frail dune
in the first forloop
wooden sail
i also think in all 3 lines where you wrote something like S[i, j] += Sbar[i, j], you meant something else
frail dune
wooden sail
i also think in all 3 lines where you wrote something like S[i, j] += Sbar[i, j]...
yea that was meant to be like : on the S[0, 0] -> add Sbar[0,0]
then on S[0, 1] -> add Sbar[0,1]
wooden sail
but what does Sbar have inside?
frail dune
Sbar = ((E*I)/(h**3))*np.array([12, 6*h, -12, 6*h],
                               [6*h, 4*h**2, -6*h, 2*h**2],
                               [-12, -6*h, 12, -6*h],
                               [6*h, 2*h**2, -6, 4*h**2])
then for i,j in Sbar does not do what you think it does :p it should be for i,j in some:collection_of_indices
otherwise you'll just get an error
 floral hollow
im new to neural networking. Can anyone give me a few tips?
wooden sail
brush up your maths
steady basalt
I’d say learn to make one first maybe with keras
mint palm
wooden sail
in a linear algebra book 😛
i have done my graduate level maths with a 90%, lmao, never saw that, only partially interpretable, i think notation is the problem why i see student outside my country hate maths
wooden sail
taking maths in a graduate course doesn't make them graduate level maths 😛
especially in engineering programs
serene scaffold
floral hollow
im new to neural networking. Can anyone give me a few tips?
🌍 it's all math? 🧑🏻🚀
always has been  👨🏻🚀
👨🏻🚀
neural networks depend on linear algebra and derivative calculus, at the very least.
lapis sequoia
do you guys happen to know of a good repo or tutorial to plot your pytorch model's performance?
serene scaffold
lapis sequoia
do you guys happen to know of a good repo or tutorial to plot your pytorch model...
what the model does is more important for determining how to plot it than the fact that it was made with pytorch. what does it do?
lapis sequoia
serene scaffold
what the model does is more important for determining how to plot it than the fa...
im making a RL model with pytorch and pybullet. it has a humanoid urdf model that is trying to stand up
so the plot would be: total time vs time step
im wondering if its possible to plot the graph in real time ( i have seen some non-tutorial ones) and tried it with multiprocessing but I am probably making some mistakes
mint palm
wooden sail
taking maths in a graduate course doesn't make them graduate level maths 😛
😂 but i mean i have crossed paths with calculus, vectors, and have covered almost everything there is to them
wooden sail
well, apparently not 😛
and if you hadn't seen this, than that's very far away from "almost everything", might i add
mint palm
😳 notation is different here
wooden sail
this is standard notation for vector and matrix norms
mint palm
the subscripts and superscripts notation is different here
exotic thicket
In one of the video boolean function for 2^2^2 = 16 can be designed but how come for 3 inputs it's (would be) 256??
mint palm
rest is same
 worldly haven
Hey everyone, hope you are all doing fine.
Im currently working on a project in order to get a job as a data analyst. Therefore i have to setup and configure a data pipeline that downloads the data, stores it in a local database in a automatical way where i could then connect to, and use powerbi to make my visualizations. Could you please spare 20min for me and help me with this. i really need this job.
this are the links:
https://docs.owid.io/projects/covid/en/latest/dataset.html
https://docs.owid.io/projects/covid/en/latest/environment.html
i have allready setup python, git bash, vscode, mysql server and ssms .
Hope to hear from you, Thanks in advance
exotic thicket
exotic thicket
In one of the video boolean function for 2^2^2 = 16 can be designed but how come...
For 2^2^3?
And also for n inputs
wooden sail
wdym for n inputs