#data-science-and-ml
1 messages · Page 4 of 1
 floral nova
when i try running this code it returns keyerror date
what does that mean and how do i fix it? I use google colab btw
 shut bear
hey ... so I made this NN model in Pytorch like so:


and I'm trying to graph it like this.
this uses the defined forward() func.

However, apparently: -1 <= dim <= 0 is expected... idk why
 untold bloom
shut bear
However, apparently: `-1 <= dim <= 0` is expected... idk why
untold bloom
shut bear
However, apparently: `-1 <= dim <= 0` is expected... idk why
hi, torch.cat concatanates along an existing axis, and white and black are 1D tensors so they have only 1 dimension so dim=0 should do
i'm assuming you want to concatanate those two 1D tensors such that you end up with again a 1D tensor but the size doubled as 81920
 wheat ivy
How do I remove 1e6 from pandas bar plot
dataframe print:-
Random External Data
crash color
0 2080101 red
1 1789736 blue
2 760134 green
3 1225782 orange
comes off as this at y axis

i want it to show complete numbers the few working solutions for pandas as well didn't work
 wooden sail
what's your issue with it? one thing you can do is to divide by 1e6 before plotting
wheat ivy
divide by 1e6?
my issue is y axis isn't showing complete numbers
2080101 like this
would be fine even if it just showed 200000
wooden sail
the 1e6 is telling you that the numbers at the left of the bar are in millions
why would you want to display 6 zeros? the tick marks would be super cluttered
the way it is now is standard and readable, it's scientific notation
wheat ivy
well its a use case thats why
i tried removing scientific notation and also tried removing offsets
neither worked unfortunately
ax.get_yaxis().get_major_formatter().set_useOffset(False)
this I tried for offset
wooden sail
how did you attempt that? there's pd.set_option and pd.options.display.float_format
or you can set the tick marks manually
wheat ivy
ax was returned from pd.plot()
also tried using
pd.set_option('display.float_format', lambda x: '%.3f' % x)
copied that off from stackoverflow tho, didn't work for my usecase
wooden sail
try setting the tick marks explicitly, then
 void sail
You need to unpack the list or use a vector operation and you are doing neither
If you are trying to get the mode of those lists where the value is <0.6 and >= 0.5 you could do this but not very efficient
stats.mode([value for value in x if value < 0.6 and value >= 0.5])
 lapis sequoia
Hey guys, any servers for R?
wheat ivy
nothing seems to work for it, very annoying
 serene scaffold
lapis sequoia
Hey guys, any servers for R?
serene scaffold
lapis sequoia
Hey guys, any servers for R?
I don't know of an R-specific server, but you might be able to ask here: https://discord.gg/kfxk9nbg
 compact valley
Hey this might seem like weird question but what is the industry standard IDE for Machine Learning Engineers, like what code editors/IDE do they use in big tech companies
pls tell me if u know / or are employed at big tech company - this bugs me a lot
wooden sail
it usually doesn't matter
 grand canyon
i had a question about a CNN im working with. over a couple epochs, my loss is gradually decreasing, but my validation accuracy is also decreasing.
what could be a potential cause for this?
wooden sail
sounds like overfitting
grand canyon
so should i do stuff like drop out
 mild dirge
Yeah, or maybe just less layers
grand canyon
mild dirge
Yeah, or maybe just less layers
alright
when will i know if im underfitting the data
mild dirge
If your training loss is also not decreasing a lot
grand canyon
ok cool thank you
 potent flame
compact valley
Hey this might seem like weird question but what is the industry standard IDE fo...
potent flame
compact valley
Hey this might seem like weird question but what is the industry standard IDE fo...
Most data scientists I know use vs code
 finite kayak
Hi everyone
Can someone with “data science and artificial intelligence” degree work in software engineering field? You can also list a few fields that can be worked in.
Thanks in advance
serene scaffold
finite kayak
Hi everyone
Can someone with “data science and artificial intelligence” degree...
there aren't a lot of DS/AI degree programs. the main degree for DS/AI is computer science.
finite kayak
If you get one, can you work as a software engineer?
serene scaffold
finite kayak
If you get one, can you work as a software engineer?
there's a lot of overlap in all these job titles. I work as an AI developer, but I still do "software engineering" like stuff.
finite kayak
Technically, there is programming in the curriculum of “data science and artificial intelligence”. Therefore, I think it would work. Thanks for your answer.
 iron basalt
finite kayak
Technically, there is programming in the curriculum of “data science and artific...
iron basalt
finite kayak
Technically, there is programming in the curriculum of “data science and artific...
Can't really do artificial intelligence without software engineering to some extent.
wooden sail
well... that depends on what you mean by "do artificial intelligence"
iron basalt
wooden sail
well... that depends on what you mean by "do artificial intelligence"
While having ideas and doing math and all that surrounding the implementation is fine, it still needs to be implemented to demonstrate that it actually works. I would rather have someone that can do both.
A lot of AI is kind of just tweaking / messing around and for that a feedback loop where you can implement it and test it is required.
finite kayak
wooden sail
well... that depends on what you mean by "do artificial intelligence"
Is there any specific thing that you ask? I mean the name of the degree is “data science and artificial intelligence” and it contains mathematics, programming and artificial intelligence.
iron basalt
And that will often involve some software engineering.
finite kayak
Also, C, Java and another programming language will be learned in the programming lessons.
wooden sail
finite kayak
Is there any specific thing that you ask? I mean the name of the degree is “data...
squiggle addressed it in their post. you can by and large do AI by doing only math research and no coding
this isn't what most people think of when they say or hear "i do AI", but it's certainly an important part of it
iron basalt
finite kayak
Is there any specific thing that you ask? I mean the name of the degree is “data...
There is more outside of just the programming.
(Although you will benefit highly from being able program effectively, because feedback loops are great for building ideas / knowledge / understanding (fast iteration / one of the main things computers have given us the ability to do))
finite kayak
Then, can it be said that an AI engineer can also work as a software developer?
Since “Data science and artificial intelligence” will cover the topics of “software engineering” to some extend?
wooden sail
that will really depend on the program tbh
AI engineering can range from very math heavy with little coding, to lots of coding and not as much math depth. and in that spectrum, what the coding focuses on may also vary
some programs would surely go into so-called "MLOps" or talk about massive parallelization and how to set up large scale systems, and others might focus on other stuff instead, for instance
iron basalt
finite kayak
Also, C, Java and another programming language will be learned in the programmin...
Learning a programming language is good, but software engineering is more than learning a programming language. Software engineering deals with concepts beyond any specific programming language and is mostly learned through experience. You need to program a lot to really get a feel for what works and what does not (lots of projects, both small and large). It also has to do with working in teams and that is pretty complicated (and kind of an unsolved problem still).
Could you get a job in software engineering? Probably. As long as you can show that you can do it, but that is somewhat independent of degree.
 steady basalt
compact valley
Hey this might seem like weird question but what is the industry standard IDE fo...
steady basalt
compact valley
Hey this might seem like weird question but what is the industry standard IDE fo...
Pycharm, vscode is trash
And jupyter for notebooks
finite kayak
Okay I got it. Thank you for your time and answers.
 lethal swallow
Hi guys what approach do I need to take, when I have a dataset with following info: consultants training clients at a specific location and date. Usually someone has to manually define which consultant teaches the client and has to look up where he usually teaches. Now I want to automate this approch a little bit. My goal is to set a specific date and my machine learning model predicts me the location and which consultant can do it. But I also want to able to set a client and the predictive model suggests me the date and consultant and so on.
 coral cradle
guys how do I even start with ai, I'm a final year student in university level I've learn ai for 2 years but never applied it T_T
coral cradle
not really, they told us what a neural network is, how weight bias work and for my second year we learn about different type of optimizers
mild dirge
You probably want to start learning a programming language then, like Python
afterwards you can learn how to implement AI
coral cradle
mild dirge
You probably want to start learning a programming language then, like Python
oh I know coding
I just don't understand how to make an ai
wooden sail
if you've learned the maths and know about optimizers, i would recommend you become part of the new generation and look at JAX
recommend is too strong, let's say suggest instead
coral cradle
hmmm
wooden sail
you'll have nice, low level control of your "networks" as composition of affine transformations and nonlinear transformations
coral cradle
I have my final year project coming up and I want it to have ai, I want to understand more about ai but I can't find the correct resources for my level.
I want to integrate computer vision with ai actually.
I've heard about tensorflow for ai as well.
wooden sail
tensorflow and pytorch are the common ones, yeah
lethal swallow
lethal swallow
Hi guys what approach do I need to take, when I have a dataset with following in...
anyone got an idea?
wooden sail
tbh this sounds to me more like a database lookup problem than an AI one, unless you want nondeterministic schedules. though you can maybe make a case for preferred hours for the consultants and possibly the clients if they are recurring
steady basalt
coral cradle
I have my final year project coming up and I want it to have ai, I want to under...
How long do u have? This takes ages to learn
 quaint leaf
coral cradle
I've heard about tensorflow for ai as well.
quaint leaf
coral cradle
I've heard about tensorflow for ai as well.
Computer vision is a field of AI, Tensorflow is one of the (Python) packages that help you work with it. Here is an example series from FreeCodeCamp to get a taste: https://www.youtube.com/watch?v=cPmjQ9V6Hbk
coral cradle
steady basalt
How long do u have? This takes ages to learn
Starting this October 😭
iron basalt
coral cradle
I want to integrate computer vision with ai actually.
Have a specific goal you want the AI to do. Then we can help.
(A specific project in mind)
coral cradle
What would be a good project in your opinion?
What course shall I buy off udemy that might help me in your opinion
iron basalt
For a beginner I would first recommend smaller projects. But this is your senior year project so it's suppose to be a bit more involved. You would have to do multiple more simple projects before then.
It's not so much a problem of courses, you need experience.
coral cradle
What's a good starting point in your opinion?
wooden sail
the classic mnist and fashion mnist ones are a good place to start
iron basalt
I'm not sure how much you know / can do, so at the very most basic level: implement simple linear regression from scratch.
wooden sail
or doing a polynomial regression the traditional pseudo-inverse way and comparing that to a deep learning solution
iron basalt
Gain the ability to read and implement pages like this: https://en.wikipedia.org/wiki/Simple_linear_regression
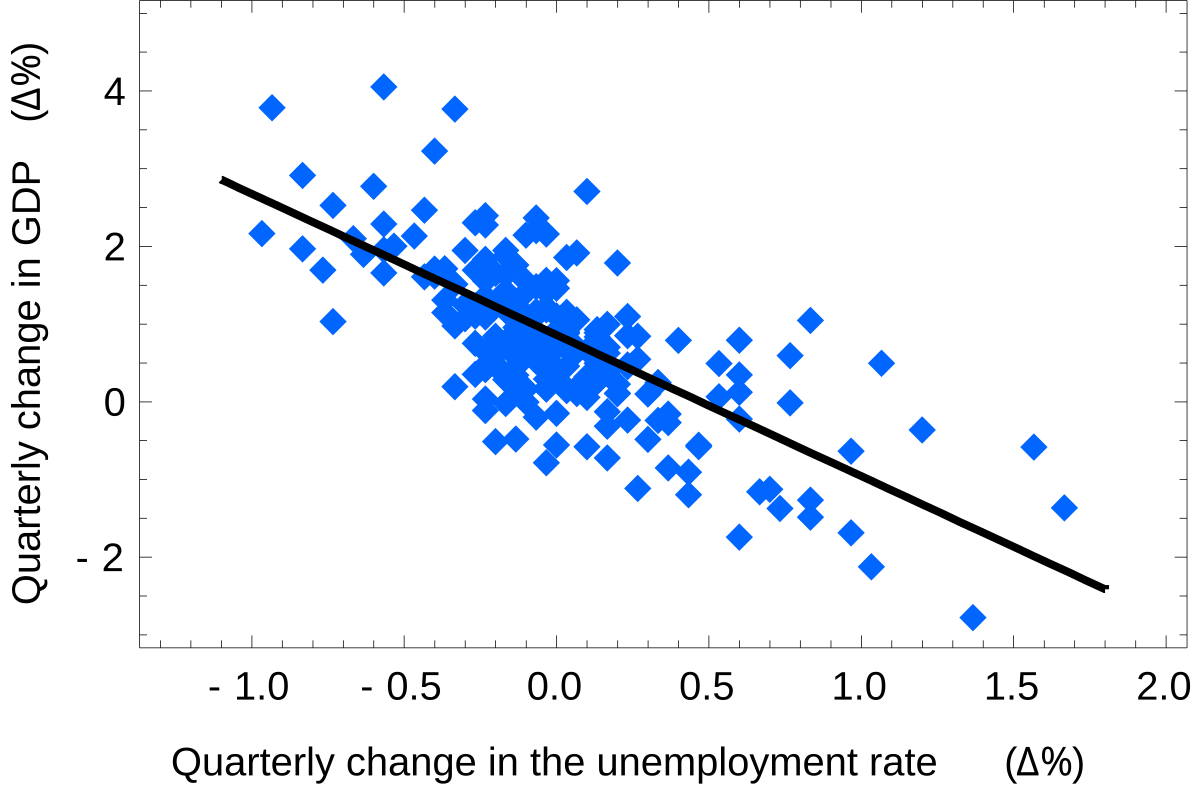
In statistics, simple linear regression is a linear regression model with a single explanatory variable. That is, it concerns two-dimensional sample points with one independent variable and one dependent variable (conventionally, the x and y coordinates in a Cartesian coordinate system) and finds a linear function (a non-vertical straight line) ...
(Sometimes Wikipedia goes into too much unrelated detail, but it's a starting point)
coral cradle
Does this use back propagation?
steady basalt
coral cradle
What's a good starting point in your opinion?
Start with sklearn on tabular data
Try and use a few methods to predict classes
coral cradle
I see
iron basalt
One step at a time. And after each step, feel free to just use someone else's implementation after you understood how it works.
iron basalt
wooden sail
the classic mnist and fashion mnist ones are a good place to start
Yeah, if you want to do something involving vision later, you will have mnist as one of your steps.
If you want neural networks, one step will probably be implementing a Perceptron from scratch.
After enough basic steps, you should have a more clear picture of where you can take it.
wooden sail
if you're good with your linalg and multivar calc, you can skip the perceptron and backprop, but only you know where you're at
 tropic matrix
what would be the best way to normalize a dataset that's too large to keep in ram?
i'm currently using a data generator based off of keras.Sequence, but when I try to blindly input the generator into the keras.layers.normalization().adapt() function, i get the following error:
ValueError: in user code:

    File "/usr/local/lib/python3.8/dist-packages/keras/engine/base_preprocessing_layer.py", line 117, in adapt_step  *
        self._adapt_maybe_build(data)
    File "/usr/local/lib/python3.8/dist-packages/keras/engine/base_preprocessing_layer.py", line 285, in _adapt_maybe_build  **
        self.build(data_shape)
    File "/usr/local/lib/python3.8/dist-packages/keras/layers/preprocessing/normalization.py", line 137, in build
        input_shape = tf.TensorShape(input_shape).as_list()

    ValueError: as_list() is not defined on an unknown TensorShape.
How large
How much ram u got
My ram is 16gb and when I load in a 100m row dataset it says it’s using 40gb ram, but still works
tropic matrix
steady basalt
How large
well i got 128gb of ram but apparently that isn't enough to load a 6.6gb csv file
well to be honest
if i can use something similar to a minmaxscaler for example in sklearn (where i have an encoder i need to fit just once on the dataset) then i can use 128gb
if it needs to be done on the fly (as in throughout training) i use 4 gpus and each get assigned 32gb of usable ram
@steady basalt
i'll see if i'm able to load the entire dataset using 128gb of ram rn using pd.read_csv just to make sure
ok @steady basalt here's the situation:
i'm able to load the csv file, however when i preprocess it it ends up running out of memory and crashing
to deal with this i use a sequence class and preprocess whatever portion i need on the fly
 timid kiln
void sail
You need to unpack the list or use a vector operation and you are doing neither
timid kiln
void sail
You need to unpack the list or use a vector operation and you are doing neither
Thanks for that advice. Between my post and yours, I found the function np.histogram which, for 0 to 100% bounds, evenly spaced, works quite nicely for me. Thanks for your help!
steady basalt
tropic matrix
well i got 128gb of ram but apparently that isn't enough to load a 6.6gb csv fil...
That’s totally not real
tropic matrix
steady basalt
That’s totally not real
read what i said after that
it was my misrememberance on that statement
steady basalt
No even still, sounds totally like a false problem
6gb is nothing
Shudnt crash a laptop even
Must be issue elsewhere
tropic matrix
20.7m rows + 106 columns says otherwise
that may be a possibility
it always crashes when running pd.get_dummies
steady basalt
Nah, I just did similar work on multiple million rows
tropic matrix
so maybe when running that function it explodes in memory usage?
steady basalt
With dozens of columns on a 16gb laptop
tropic matrix
the dataset does contain a lot of strings
steady basalt
Then count@how many unique strings are there it’s trying to add
tropic matrix
steady basalt
Then count@how many unique strings are there it’s trying to add
alright, what could i do with that number though?
if there's a solution to make it not run out of memory when running pd.get_dummies then i'd love to find it
 olive shore
hey so I have a collection of pdfs with some that I would like to extract from it
how would I go about extracting the data
serene scaffold
olive shore
how would I go about extracting the data
Have you looked for pdf-to-text libraries?
You'll have varying degrees of success using them, depending on how complicated the pages are.
olive shore
serene scaffold
Have you looked for pdf-to-text libraries?
do you mind if i pm you i have looked into those libraries but there is something specific that i would like to capture
serene scaffold
olive shore
do you mind if i pm you i have looked into those libraries but there is somethin...
I won't answer messages over DMs that could have been sent in this channel.
 serene scaffold
Ah. I'm not sure how successful those systems are with Arabic letters.
olive shore
including this and i just want to capture the text within these blocks and place information of each block with each other
yeah well ill try to get around that issue
but the thing is how could i just capture the information in those blocks
serene scaffold
Information extraction systems deal with "raw text". Ie stuff that could be represented as strings in code
So you have to extract the text before you can extract any information.
You might look into OCR for Arabic
Which is optical character recognition.
tropic matrix
I'm struggling to figure out why this error occurs when inputting a keras.utils.Sequence into keras.layers.Normalization:
norm = keras.layers.Normalization()
norm.adapt(SEQUENCE_VARIABLE)
ValueError: in user code:

    File "/usr/local/lib/python3.8/dist-packages/keras/engine/base_preprocessing_layer.py", line 117, in adapt_step  *
        self._adapt_maybe_build(data)
    File "/usr/local/lib/python3.8/dist-packages/keras/engine/base_preprocessing_layer.py", line 285, in _adapt_maybe_build  **
        self.build(data_shape)
    File "/usr/local/lib/python3.8/dist-packages/keras/layers/preprocessing/normalization.py", line 150, in build
        raise ValueError(

    ValueError: All `axis` values to be kept must have known shape. Got axis: (-1,), input shape: [None, None], with unknown axis at index: 1
the shape of each batch is (4096, 2899)
(4096 = batch_size)
 stiff belfry
yo can someone help me save my model so that i can just run a command in another program that uses the model to predict the end product
i cant find something like this. I have found the .save() and .load() functions but they are both returning errors
steady basalt

would anyone know what would be the next step to boost class 0 recall? I had a hugely imbalanced dataset with something like 17,000 1's and 390,000 0's - I had resampled this using smote to balance them out tho. Still unable to achieve greater than 0.5 recall for both classes. Other parameters result in an effective switch - giving 1.00 recal lfor 0's and 1.00 precision for 1's.....
olive shore

import arabic_reshaper
from bidi.algorithm import get_display
import pdfplumber
with pdfplumber.open(r'C:\Users\ahmad\PycharmProjects\pythonProject4\c6fe28d10be56fafc39a65ec189f6259.pdf') as pdf:
    my_page = pdf.pages[12]
    thepages=my_page.extract_text()
    reshaped_text = arabic_reshaper.reshape(thepages)
    bidi_text = get_display(reshaped_text)
    print(bidi_text)
im using this code to get the pdf move to text
and im getting these weird symbols
is there any way to get around this
serene scaffold
@olive shore you can filter them out of the result, but if there aren't settings you can adjust for the extraction algorithm, you can't make the algorithm give you the correct result.
olive shore
it seems that the letters arent connected properly
it seems that the arabic reshaper isnt functioning properly
serene scaffold
olive shore
it seems that the arabic reshaper isnt functioning properly
I would check to see if it works correctly for a PDF that is just one block of text.
No borders, no separate blocks of text. Nothing that could possibly confuse it. And see if it works in the most ideal circumstance.
olive shore
ok
ok the pdf has
اللغة العربية رائعة
and when i use the code it outputs
ﻼﻠﻏﺓ ﻼﻋﺮﺒﻳﺓ ﺭﺎﺌﻋ ﺓ
Well fuck.
serene scaffold
But did you do what I said. Or is this just an example from a PDF you already have
olive shore
i did exactly what you said
serene scaffold
Great
olive shore
i made a pdf with just the first part
and ran it through the code and it gave that output
olive shore
oh shit thats nice
serene scaffold
I'm a """"computational linguist""""
olive shore
thats so cool
that makes stuff easier for both of us
yeah for some reason the arabic reshaper isnt functioning properly
serene scaffold
Anyway, i wonder if there's a way to replace each character with the correct version automatically
You can just do it based on whether the next character is a space and whether the previous character connects. Right?
olive shore
wait im sorry i dont understand what should I do?
serene scaffold
So each character has two or four forms. As you know. And you can know which is the right one based on the previous and next character
olive shore
yeah
serene scaffold
So you can just write something to iterate through the string and figure out which character is right, and fix it.
olive shore
ok wait so i did this instead
import arabic_reshaper
from bidi.algorithm import get_display
import pdfplumber
import re
with pdfplumber.open(r'C:/Users/ahmad/OneDrive/Desktop/arabic.pdf') as pdf:
    my_page = pdf.pages[0]
    thepages=my_page.extract_text()

    reshaped_text = arabic_reshaper.reshape(thepages)
    print(reshaped_text)
and it outputs\
ﺓ ﻋﺌﺎﺭ ﺓﻳﺒﺮﻋﻼ ﺓﻏﻠﻼ
so its all flipped and the first and last letters are flipped
import arabic_reshaper

text_to_be_reshaped =  'اللغة العربية رائعة'

reshaped_text = arabic_reshaper.reshape(text_to_be_reshaped)


print(reshaped_text)
but for some reason this code up here just works
olive shore
serene scaffold
So you can just write something to iterate through the string and figure out whi...
^
the pdf is causing issues
yeah bruh idk
weird shit
tropic matrix
I'm struggling to figure out why this error occurs when inputting a custom keras.utils.Sequence into keras.layers.Normalization:
norm = keras.layers.Normalization()
norm.adapt(SEQUENCE_VARIABLE)
ValueError: in user code:

    File "/usr/local/lib/python3.8/dist-packages/keras/engine/base_preprocessing_layer.py", line 117, in adapt_step  *
        self._adapt_maybe_build(data)
    File "/usr/local/lib/python3.8/dist-packages/keras/engine/base_preprocessing_layer.py", line 285, in _adapt_maybe_build  **
        self.build(data_shape)
    File "/usr/local/lib/python3.8/dist-packages/keras/layers/preprocessing/normalization.py", line 150, in build
        raise ValueError(

    ValueError: All `axis` values to be kept must have known shape. Got axis: (-1,), input shape: [None, None], with unknown axis at index: 1
the shape of each batch is (4096, 2899)
(4096 = batch_size)

 thick marlin
Hello,
I have a pre-trained model on the original pix2pixHD. The saved model dir has 4 files
iter.txt
latest_net_D.pth
latest_net_G.pth
loss_log.txt
opt.txt
How can I convert the model to utilize it with Imaginaire's pix2pixHD? Imaginaire uses 1 .pt file for loading the models.
It's the same model but they have integrated the library with their other models to create a model zoo.
 unborn crow
Someone here that has time for a urgent call regarding SKlearn ?
steady basalt
Deadline tomorrow? 😂
unborn crow
steady basalt
Deadline tomorrow? 😂
more like in 4 Hours ...
 solar tiger
can anyone help me to solve this error
ValueError: invalid literal for int() with base 10: ''
I got this error, while im converting string values into integer values in data frame
here is my function code
python```
def mrp(x):
MRP = int(x)
return MRP
what did you pass to your func? this works for strings that represent numbers in base 10
solar tiger
column values from a dataframe
wooden sail
sure, but what do the values in that column look like
solar tiger

look at the MRP column
here is the info of my dataframe
<class 'pandas.core.frame.DataFrame'>
RangeIndex: 30758 entries, 0 to 30757
Data columns (total 7 columns):
 #   Column     Non-Null Count  Dtype
---  ------     --------------  -----
 0   BrandName  30758 non-null  object
 1   Deatils    30758 non-null  object
 2   Sizes      30758 non-null  object
 3   MRP        30758 non-null  object
 4   SellPrice  30758 non-null  object
 5   Discount   30758 non-null  object
 6   Category   30758 non-null  object
dtypes: object(7)
memory usage: 1.6+ MB
one thing you can do is put a try except inside that function call, and write None or NaN in the except block. then find these Nones or NaNs by index, and check in the original dataframe what their value is
some of the values in your dataframe appear not to be numbers
solar tiger
ok got it, thank you @wooden sail
hey @wooden sail , I see no NaN values in MRP column
wooden sail
can you show your code
solar tiger
yeah
steady basalt
Anyone wana try help me getting higher than 57% accuracy with xgboost on a poor dataset
Well, not poor. Just not powerful for this use
 amber swan
@solar tiger just a question, is all youre trying to do is to convert the column from type String to Integer?
because there are easier methods to do that within pandas (https://pandas.pydata.org/docs/reference/api/pandas.to_numeric.html)
amber swan
solar tiger
I got this error, while im converting string values into integer values in data ...
considering this
you could probably just write d['MRP'] = pd.to_numeric(d['MRP'])
wooden sail
the default pandas.to_numeric will also raise an error or set a nan, just as above 😛 but yeah, built-in functions are nice
solar tiger
here are the screen shorts of my code


 wooden sail
you didn't catch the exception. let's make this easier. use dingleyz suggestion. apply the to_numeric function to the appropriate column, and pass the parameter errors='coerce' to turn the errored entries into NaN
lapis sequoia
Can someone help me understand what's happening here. It's showing empty when I retrieve whole df. But values are in there when I retrieve just that column
 steady basalt
Recently made jupyter notebook dark mode , so much better
lapis sequoia
steady basalt
Recently made jupyter notebook dark mode , so much better
Thanks
lapis sequoia
telling me that it exists
solar tiger
wooden sail
you didn't catch the exception. let's make this easier. use dingleyz suggestion....
pd.to_numeric is working
thanq @amber swan @wooden sail
amber swan
wait, even without the coerce?
solar tiger
i used errors=coerce as parameter in apply method
wooden sail
ok
cool. now if you want to satisfy your scientific curiosity, you should look for the indices where this result has NaNs, and use those indices in the ORIGINAL column to see what the problem was
something like df_original['MRP'].loc[casted_to_numeric.isna()], i think that's the syntax? someone correct me if not, my pandas is rough
 versed gulch
Hi is there a way I can fill in sparse arrays into a zero array in Python?
wooden sail
what format is your sparse array in? scipy and numpy have sparse arrays that have something like to_dense() to turn into dense arrays, but this is usually not something you want to do
 somber prism
anyone here tried to install ontonote 5.0 ???
versed gulch
wooden sail
what format is your sparse array in? scipy and numpy have sparse arrays that hav...
format? if you mean how I created them, then i converted my 3D images into sparse arrays which where of shape (242, 512, 512) and are of uint8
wooden sail
and how exactly did you do that?
versed gulch
using the module sparse
wooden sail
all righty. and what do you want to make it dense for?
versed gulch
dont want to make it dense as I'm running out of memeory with numpy arrays as my zero which I want to fill in is of size (39, 39, 242, 512, 512)
wooden sail
i think i'm just not understanding what you're trying to say. you have a dense array and want to make it sparse? or backwards? or?
versed gulch
no, so what I did first was filling by large 3D arrays (imgs) of size (242, 512, 512) into a zero array of size (39, 39, 242, 512, 512), but Python says that numpy array runs out of memory
therefore I converted my 3D arrays to sparse arrays as it has lots of zeros anyways and trying to fill my zero array like this
wooden sail
are the images sparse?
versed gulch
yes as in they have a lot of zeros
wooden sail
all right
versed gulch
and pixels of low value
this is my code:
arr = np.zeros((39, 39, 242, 512, 512), dtype='uint8') # temp zero array to fill in

# path for the MIP tiles and sort them
tiles3D_path =  "my_path/raw_data/confocal/raw_tiles/*.CZI"
list_of_tiles = sorted(glob.glob(tiles3D_path))
list_of_tiles.sort(key=lambda f: int(''.join(filter(str.isdigit, f))))
# place the tiles inside the array 'arr' based on the grid coordinates from the dataframe
# like placing oieces of a puzzle but with images as arrays into a zero array

for tile_path, xy in zip(list_of_tiles, df0["grid_coord"].values.tolist()):
    # open the MIP tile and convert to an array
    raw_tile = czifile.imread(tile_path)
    tile_arr = raw_tile.reshape(242, 512, 512)
    sparse_tile_arr = sparse.COO(tile_arr)
    # unpack the (x, y) coordinates
    x, y = xy
    # fill in the zero based on the coordinates
    arr[int(y), int(x), :, :, :] = sparse_tile_arr
arr is dense there, so that won't work
you should be able to use the usual slice notation, but arr needs to be a sparse array itself
versed gulch
wooden sail
arr is dense there, so that won't work
so does that mean I have to make my arr sparse too?
wooden sail
yeah
versed gulch
wooden sail
yeah
okay so only change the arr defining line?
wooden sail
that should do, and just leave its data field empty
i think you might have to use a DOK sparse matrix instead of COO for that
versed gulch
DOK?
wooden sail
dictionary of keys instead of coordinate sparse array
versed gulch
TypeError: Expected rank <=2 dense array or matrix.
wooden sail
show the code
versed gulch
got this when i did this
from scipy.sparse import dok_matrix
arr = dok_matrix((grid_size, grid_size, 242, 512, 512), dtype=np.uint8)
grid_size is 39
wooden sail
nono, DOK sparse array from the same library you are using
scipy's sparse arrays are only 2D
alternatively try making a list or an array of each of the sparse COO arrays, and then using those to create a new COO array that contains all the data
versed gulch
wooden sail
nono, DOK sparse array from the same library you are using
for some reason sparse doesnt have this?
versed gulch
wooden sail
https://sparse.pydata.org/en/stable/generated/sparse.DOK.html
I did this but it gave my this:
RuntimeError: Cannot convert a sparse array to dense automatically. To manually densify, use the todense method.
wooden sail
show the full code and full error message
versed gulch
this was my code
arr = sparse.DOK((grid_size, grid_size, 242, 512, 512), dtype=np.uint8)
arr = sparse.DOK((grid_size, grid_size, 242, 512, 512), dtype=np.uint8)

# path for the MIP tiles and sort them
tiles3D_path =  "/home/si22/data/raw_data/confocal/raw_tiles/*.CZI"
list_of_tiles = sorted(glob.glob(tiles3D_path))
list_of_tiles.sort(key=lambda f: int(''.join(filter(str.isdigit, f))))
# place the tiles inside the array 'arr' based on the grid coordinates from the dataframe
# like placing oieces of a puzzle but with images as arrays into a zero array

for tile_path, xy in zip(list_of_tiles, df0["grid_coord"].values.tolist()):
    # open the MIP tile and convert to an array
    raw_tile = czifile.imread(tile_path)
    tile_arr = raw_tile.reshape(242, 512, 512)
    sparse_tile_arr = sparse.COO(tile_arr)
    # unpack the (x, y) coordinates
    x, y = xy
    # fill in the zero based on the coordinates
    arr[int(y), int(x), :, :, :] = sparse_tile_arr
    break
 wooden sail
all right. and it doesn't seem there's COO to DOK, or at least i couldn't find it. gimme a second to test the other thing i suggested
versed gulch
wooden sail
all right. and it doesn't seem there's COO to DOK, or at least i couldn't find i...
kl
steady basalt
Anyone have any strategy to boost recall ?
serene scaffold
steady basalt
Anyone have any strategy to boost recall ?
that's generally applicable to any possible model?
 grand blaze
Guys its my x-th time posting the same problem (although with more details now), which it doesnt seem many can solve. Just wondered if someone could help med at #help-orange ?
unborn crow
versed gulch
```py
arr = sparse.DOK((grid_size, grid_size, 242, 512, 512), dtype=np.uint8)
#...
What kind of psycho uses a red terminal ?
wooden sail
versed gulch
kl
holy crap, the functions for this thing are SUPER limited! there seems to be no easy way to make a large sparse array from smaller ones other than concatenating them yourself. passing lists of sparse or dense arrays doesn't work
this is my artistic representation of what you're looking for
import sparse
import numpy as np

size_x = 2
size_y = 2
size_i1 = size_i2 = size_i3 = 3

for row in range(size_x):
    for col in range(size_y):
        x = np.random.binomial(1, 0.1, size=(1,1,size_i1, size_i2, size_i3))
        if col == 0:
            temp = sparse.COO.from_numpy(x)
        else:
            temp = sparse.concatenate((temp, sparse.COO(x)), axis = 1)
    if row == 0:
        big_sparse = temp
    else:
        big_sparse = sparse.concatenate((big_sparse, temp), axis = 0)

print(big_sparse.shape)
it's pretty shabby because i got frustrated with the lib and need to go back to work, but this should get the job done
make sure you massage the images into size 1,1,242,512,512 before sparsifying them
you can alternatively find the support of each of the images and do index gymnastics along the image dimensions or concatenation dimensions. but yeah, you kinda have to piece the stuff together yourself if the images don't fit in memory. this lib is not friendly with arrays it makes itself lol
versed gulch
unborn crow
What kind of psycho uses a red terminal ?
me 😉
wooden sail
i use a purple one
versed gulch
wooden sail
make sure you massage the images into size 1,1,242,512,512 before sparsifying th...
There of this shape or something similar to this as the images are czi files
wooden sail
just make sure those dummy extra dimensions in front are added, that's all i mean
if those 1's in front are missing, you have to add them in
on one hand i'm frustrated the library is so limited, but on the other, larger-than-memory-arrays are never easy to deal with. at least i can immediately see cases where i could use this library myself, so thanks for showing me something new
versed gulch
wooden sail
this is my artistic representation of what you're looking for
```py
import spars...
from your code I'm assuming x is the zero array but not sure how to fill this in with my images
versed gulch
wooden sail
on one hand i'm frustrated the library is so limited, but on the other, larger-t...
thanks for giving your input and helping
wooden sail
remove the x = np.random.binom, since i used that only to generate random data, and replace it with raw_tile.reshape(1,1,242,512,512)
wooden sail
you have to attach some value to the strings so that you can do math on them. the common way is with "one-hot encoding" since it makes labels equidistant
lapis sequoia
wooden sail
you have to attach some value to the strings so that you can do math on them. th...
Oh
I actually removed those values so that It becomes purely categorical
and not treat it as int
Changed 0,1 to "yes", "no"
wooden sail
you can do boolean arithmetic on that, but not continuous operations
wooden sail
it means, what is the distance between male and female? and what mathematical operation do you do to move x % of the distance from male to fomale?
lapis sequoia
huh
There's no distance between male and female. They are categories
How do I find distance
wooden sail
by embedding the categories in a space where distance is defined
lapis sequoia
like 0-male, 1-female?
wooden sail
mhm
wooden sail
that's the whole point of one-hot, yeah?
steady basalt
serene scaffold
that's generally applicable to any possible model?
I mean I’m using random forest and xgboost but if you could help me using any model I’d appreciate it
Pulling my hair out because clearly the data is holding me back
lapis sequoia
wooden sail
that's the whole point of one-hot, yeah?
so many categories
 lapis sequoia
wooden sail
that's the whole point of one-hot, yeah?
lapis sequoia
wooden sail
that's the whole point of one-hot, yeah?
what's one-hot
lapis sequoia
wooden sail
one hot encoding...
is there a function for it that I can use?
wooden sail
the one supermoon just gave you
unborn crow
versed gulch
me 😉
i hope i never meet you at night
steady basalt
Of any columns u want
Is there a problem with using get dummies before test train split so that I don’t encounter unknowns and have to swap to using sklearn encoder
lapis sequoia
Pog it worked
 steady basalt
@wooden sail
lapis sequoia
How do I get original values mapped back?
wooden sail
i don't see any problem with that off the top of my head
i need to get going, busy busy
steady basalt
So why do people cry and say u shud use onehotencoder to avoid such an issue
wooden sail
aren't they the same thing
 hollow sentinel
they are i think
hollow sentinel

Stack Overflow
What is the difference between one_hot_encoder and pd.get_dummies? Because sometimes, the get_dummies function gives the same results as the one hot encoding thing, but people tend to use the one hot
steady basalt
So what’s the advantage of using sklearn
unborn crow
unborn crow
more like in 4 Hours ...
I just presented a completely overfitted Model because i am an Idiot
 misty flint
where is the lie
 versed gulch
unborn crow
i hope i never meet you at night
versed gulch
unborn crow
i hope i never meet you at night
hmmm
misty flint

unborn crow
versed gulch
hmmm
maybe it would be better to get gutted by a psycho like you ...
versed gulch
unborn crow
maybe it would be better to get gutted by a psycho like you ...
ok you're just digger deeper into what you think my personality is like
hollow sentinel
misty flint
<@567030124306759710> bro look at this
hmmm i don't know if i agree with this
 worthy phoenix
!resources
 arctic wedgeBOT
Resources
The Resources page on our website contains a list of hand-selected learning resources that we regularly recommend to both beginners and experts.
worthy phoenix
i dont see any resources for learning AI in there
unborn crow
versed gulch
ok you're just digger deeper into what you think my personality is like
clearly you choose the Color of your terminal because you enjoy to look at it - red the color of Blood, so it is not far of that you like to touch red things like blood and gore
worthy phoenix
any suggestions for beginner resources to learn about ai and deep learning?
unborn crow
worthy phoenix
any suggestions for beginner resources to learn about ai and deep learning?
are you based in germany ?
versed gulch
unborn crow
clearly you choose the Color of your terminal because you enjoy to look at it - ...
those are not the only connotations for red, there are some positive connotations for this colour, and anyway, the connotations are subjective
worthy phoenix
nope
unborn crow
versed gulch
those are not the only connotations for red, there are some positive connotation...
no my opinion is fact
worthy phoenix
worthy phoenix
any suggestions for beginner resources to learn about ai and deep learning?
.
misty flint
hollow sentinel
hmmm i don't know if i agree with this
haha i think it depends on who you meet tbh
unborn crow
worthy phoenix
.
Depends on your current skills
misty flint
some peeps are better at teamwork than others...some...
worthy phoenix
unborn crow
Depends on your current skills
intermediate with python, and got a good understanding of maths
unborn crow
worthy phoenix
intermediate with python, and got a good understanding of maths
How are you on probability and stochastics
versed gulch
unborn crow
no my opinion is fact
hmmm
hollow sentinel
misty flint
some peeps are better at teamwork than others...some...<:kekHands:94869794071158...
meanwhile my friend has been texting me nonstop to do a group project with him and i keep saying no ☠️
worthy phoenix
unborn crow
How are you on probability and stochastics
probability is one of my fav topics of mathematics well statistics i kinda know basics
unborn crow
worthy phoenix
probability is one of my fav topics of mathematics well statistics i kinda know ...
good starting point
worthy phoenix
............
unborn crow
worthy phoenix
............
Go find a project that you would like to do and try it
if you need help come back here
worthy phoenix
aight
misty flint
hollow sentinel
meanwhile my friend has been texting me nonstop to do a group project with him a...
ehh he should get a hint lol
coral cradle
is sklearn worth learning rather than pytorch?
serene scaffold
coral cradle
is sklearn worth learning rather than pytorch?
sklearn and pytorch are for completely different things.
coral cradle
serene scaffold
sklearn and pytorch are for completely different things.
pytorch is for images is it?
serene scaffold
coral cradle
pytorch is for images is it?
pytorch is for neural networks. and image processing often involves neural networks, because there are so many inputs (each pixel is an input)
but you can use neural networks for other things, too
coral cradle
rn I'm learning sklearn, will it help me use pytorch in the future?
serene scaffold
coral cradle
rn I'm learning sklearn, will it help me use pytorch in the future?
I would rethink your whole learning strategy. learning how to use these libraries as a goal unto itself isn't really a good idea. you should focus on solving certain kinds of problems, and learn how to use the libraries as they pertain to accomplishing that.
I have a message in the pins about what the main libraries are for. none of them are intended to be an end-to-end solution for a class of DS/AI problems.
coral cradle
thanks
 river escarp
I need to make a model which forecasts whether a product will go out of stock based on sales history. What would be a cool / interesting way of implementing this?
 civic ivy
does anyone have a good tutorial i can look at for make a neural network to simulate life of an creature?
i do hope this is the right spot to ask
lapis sequoia
How should sell my model cuz I know how to make model , it’s pre-processing, developing model (eg: car price predicting) . What you guys suggest to you know amazed it
steady basalt
unborn crow
How are you on probability and stochastics
Hot garbage and still able to be a data scientist
lapis sequoia
And I had another question how can I give brain to my model xD to u know get smarter than human . Let’s say I input a company name that not even exist , may be I can use exceptional handling??!wdus
 ocean swallow
is there any rule based text generation models using grammar?
I am trying to POS tag the words in my data set and like markov chains, it will create sentences based on probabilities etc
serene scaffold
ocean swallow
is there any rule based text generation models using grammar?
I'm sure someone has made one, but it's very difficult to account for all grammar rules.
ocean swallow
If there is I simply couldn't find really
i am actually okay with kinda working models
serene scaffold
@ocean swallow there isn't really incentive for people to invest more development in grammar-aware text generation, because there are already excellent text generation models that don't need that.
ocean swallow
suppose you have 20 sentences as input and you want to generate text solely from them.
serene scaffold
why would you even be in that circumstance? there's tons of text out there.
ocean swallow
All ML will do is generate next word based on the previous words etc
Well I want to create Hot Topic titles based on the small trending niche
And that small trend doesn't have many titles also, creativity is a big priority
it would be great if it was able to understand rules of grammar and generate from them too actually
but I kinda lowered my expectations lol
iron basalt
ocean swallow
suppose you have 20 sentences as input and you want to generate text solely from...
That is the only data you are given? No other data allowed?
ocean swallow
iron basalt
That is the only data you are given? No other data allowed?
yep. the numbers of course can change somewhat like maybe 100 etc
training on general data pollutes are scope e.g.: old news titles
iron basalt
ocean swallow
yep. the numbers of course can change somewhat like maybe 100 etc
Well, that won't get you anything. To see why, imagine a human that has never seen, felt or heard anything, they have never spoken, written, or read anything, except for those 100 sentences. What could they possibly generate? Not much.
Only remixes of those 100.
ocean swallow
Markov chains does somewhat good job
iron basalt
Yeah, that is what they do.
But if you want creativity / introducing new factors. They have to come from somewhere.
ocean swallow
no, some words and or phrases actually combine correctly into each other. but since they didn't in any of the samples, markov chain doesn't produce it
iron basalt
Yes, but only from those 100 correct?
You are missing out on the tons of other text out there.
Or even non-text.
So it's going to be limited.
Best case those 100 sentences have a ton of variety to allow for a decent amount.
ocean swallow
yeah
iron basalt
Even if you get the grammar correct, it still can't choose from words not included in any of those 100.
ocean swallow
I mean, I kinda don't want it to.
I want it to revolve around the trending topic titles
iron basalt
But you also wanted creativity right?
ocean swallow
it is easy to just put in 100 million news title and make it generate text
I don't think it will be creative though
because it will be using texts generated earlier
but just mix-and-matching them mostly
what I want is to disregard mix and match and just create from grammar rules
ocean swallow
ocean swallow
but just mix-and-matching them mostly
it really is what GPT-2 is doing now too. Context awareness is recognizing the order of words. nothing more
iron basalt
How do you create from grammar rules without mix and match, is that not mix and matching words?
With some dictionary, which may not include all words.
Are you trying to generate based on more than just text?
ocean swallow
Because model will not know what words are. There is just a bag called NP.
Okay I am gonna make it really simple.
I have dog.
You are a table.
dog here is NP.
table is also a NP.
I have a table. is a valid sentence based on the examples. A neural network won't do this.
Unless you provided the labeled POS tags with it.
unborn crow
steady basalt
Hot garbage and still able to be a data scientist
I am not only Garbage in Math - i am garbage in general
unborn crow
unborn crow
I am not only Garbage in Math - i am garbage in general
Top that my Nword
wooden sail
what is even going on here, please keep the discussion on topic
unborn crow
 ocean swallow
wooden sail
what is even going on here, please keep the discussion on topic
ocean swallow
wooden sail
what is even going on here, please keep the discussion on topic
huh?
wooden sail
not you, i mean masterofthemüllermilch
ocean swallow
oh yay. man had to decompress there a bit
iron basalt
ocean swallow
Okay I am gonna make it really simple.
I have dog.
You are a table.
dog here i...
A neural network can do that, it just depends on what kind neural network. Neural networks such are as transformers are not forced to do things like this. But with enough data they tend to figure it out. You can create neural networks with forced / hard rules (e.g. for grammar). Adding POS tags makes it much easier when there is not much data, but with a lot of data a complex neural network may end up learning to do that itself. Transformers and other sequence models have been shown to learn a lot of unexpected things.
Their approach is tons of data + they can kind of do whatever they want / not the hard coded rules approach.
But not all NN models follow that approach.
ocean swallow
iron basalt
A neural network can do that, it just depends on what kind neural network. Neura...
we come back to the initial problem I told you. It will deviate from the topic. I may get a 200 new cool titles but it is very possible that they will be buried in 20 million other titles that doesn't interest me.
So yes it will be creative but it will not stay in the topic.
which I did btw. GPT2 bert XLNet all of them deviate either too little or too much.
fine tuning is not really achieved right now with those models is as I saw
ocean swallow
iron basalt
A neural network can do that, it just depends on what kind neural network. Neura...
No it won't do that. Why would it?
iron basalt
ocean swallow
No it won't do that. Why would it?
It depends on what the rest of the data is, but one way to tell is that it can learn that table and dog happen around the same positions. It has positional input.
ocean swallow
The feature vectors should spell out some form of grammar rule in some way.
or the model itself
iron basalt
ocean swallow
The feature vectors should spell out some form of grammar rule in some way.
GPT-2 and such decided to not go the route of explicit rules like that, so without a bunch of fine-tuning and more data, it will probably fail.
You can make another model, that uses the hidden state (or output) of those big language models as extra information. But that model itself has more strict rules and such.
iron basalt
How you have the model ignore or make use of what the big language model is telling it is up to you. One way would be to have a much more agile smaller model that uses both those sentences that you want and whatever the big language model thinks as input (the big language model has all that tons of text data baked into its weights). The smaller model being easier to understand and hand-crafted for the specific task.
This is similar to how some robots are now making use of a language model paired with its visual system to get better results (e.g. sees cup, language model says cup is related to table, so object below cup has higher probability of being table). Although in that case it's two different types of input.
(text contains a lot of information / relational stuff and so it makes for a great way to get a lot more information into your system to make use of because of the access to all of the text / contains humans knowledge baked into it)
iron basalt
ocean swallow
How can I approach doing it is idk?
Maybe you could even combine it with the Markov Chain method and grammar checks.
See what each generates, check grammar, and decide.
unborn crow
wooden sail
not you, i mean masterofthemüllermilch
i am sorry, will you ever forgive me ?
lapis sequoia
What function can I use to map a set of categorical values to a bunch of integers. Like "a":1, "b":2, etc
I don't care about a specific value being attached
wooden sail
you probably don't wanna map to integers, this will cluster the categories because they're not equidistant
wooden sail
one hot encoding is popular for a reason
lapis sequoia
It doesn't work for more than 2 categories
wooden sail
yes it does, that's the whole point of it
it maps a set of categories with cardinality N to R^N
lapis sequoia
It just gives 3 columns for 3 categories
wooden sail
those vectors are equidistant (and orthonormal, which is sexy)
lapis sequoia
increase my number of features?
steady basalt
Welcome to data analysis
wooden sail
for all the reasons i mentioned, yes. if the number of categories is too large, you can anyway employ sparse regularization
steady basalt
Nothing inherently wrong with many features and I’m kinda sick of the rhetoric that there’s always an issue unless you remove features until there’s 4 left
lapis sequoia
Well, last time I didn't do it. I did 0 for no, yes for 1 and -1 for no plan. Through manual mapping by hand
steady basalt
Features contain information
Models can also decide for themselves how much so
I’d never drop features unless they’re totally useless
lapis sequoia
lapis sequoia
Well, last time I didn't do it. I did 0 for no, yes for 1 and -1 for no plan. Th...
Bad idea?
steady basalt
Which they rarely are in data I work with
wooden sail
lapis sequoia
Well, last time I didn't do it. I did 0 for no, yes for 1 and -1 for no plan. Th...
note that 1 is 2 units of distance away from -1, and so this means categorizing something as -1 when it should be 1 is "more wrong" that misclassifying it as 0. this makes the algorithm biased
lapis sequoia
ooooo
wooden sail
it yields a larger gradient and skews your parameters
lapis sequoia
Looks like I wasted a couple of hours of my life
wooden sail
or in other words, it clusters 1 with 0, and -1 with 0, but does not allow grouping 1 and -1 together
you're pretty much telling it that it should allow some errors and fix others
wooden sail
then you can use just 0 and 1, it's not an issue
lapis sequoia
Yeah but hot encoding gives me back 2 columns. Can I keep both?
wooden sail
the problem only becomes evident with 3+ categories
wooden sail
you can, yes. doesn't make a difference
steady basalt
Python things 😅😅
wooden sail
it might require some renormalization though, since sometimes you'll get distances of root 2
lapis sequoia
That extra feature is providing no value?
wooden sail
keeping the hessian nice and spherical is important
lapis sequoia
lol
steady basalt
@wooden sail how badly do u think not normalising test set will degrade model accuracy
When it’s just been min maxed
wooden sail
lapis sequoia
That extra feature is providing no value?
pretty much, because the data is in a low dimensional manifold. if you wanted you could represent a bool with 1000 columns
lapis sequoia
I don't understand more than half the shit. Why don't they teach me statistics
steady basalt
Not much right
wooden sail
it's useless, but it can be done with good results
wooden sail
lapis sequoia
I don't understand more than half the shit. Why don't they teach me statistics
this is linalg
wooden sail
steady basalt
Not much right
i have no idea what you're talking about from the words you used
iron basalt
lapis sequoia
Really?
The integer version can be treated the same as the one-hot, but it's the compressed version (each integer is the index of the 1 in the vector, rest are 0s). Same thing, but a lot of systems are not designed to take in the compressed form. Either way, it's so you can have a bunch of nice orthonormal vectors.
steady basalt
Fit transforming columns between 0-1
For ONLY training data
The pattern remains but without it for testing data would the model struggle
wooden sail
steady basalt
Fit transforming columns between 0-1
then you should do it for the test data and the data you'll do inference on
steady basalt
Of course but if you didn’t how serious really is the impact
wooden sail
the answer, as always, is "it depends"
you're telling the network that the data dimensions are nice and spherical, but the real data is a weird high dimensional ellipsoid
then if one column has large values, your alg will prioritize that one and think everything else is 0
loosely
smoothness and condition numbers are very unforgiving things
steady basalt
Interesting
wooden sail
linalg, multivar calc, and convex opt, if you wanna look into it
wooden sail
linalg and multivar calc are prerequisites
some basic real analysis helps a lot, too
iron basalt
lapis sequoia
Bad idea?
The idea is that all the categories are treated equally in a sense. The higher number of dimensions also makes them easier to suss apart for the system.
wooden sail
and if you work with complex valued quantities, you'll need to be at least familiar enough with complex numbers and complex differentiability to understand that you can relate C^n to R^2n and work with easier conditions to satisfy than being complex differentiable
wooden sail
ofc 🙂 what do you think ML is
lapis sequoia
But all they make me do is write silly reports
wooden sail
are you in undergrad? that's not uncommon (not saying it's good either)
lapis sequoia
I got lower accuracy with your method btw
compared to the one I used
But I just used a simple train test split to test
You would say your model is more generalised?
wooden sail
that'll also depend on how many samples you have of each class
i would say one hot is the standard if you have no additional information or good reason to introduce bias in the distances
if you have good reason to make one misclassification worse than another, then it's fine. if you don't, then don't
 wooden sail
unchurned
lapis sequoia
My churn predictions really bad. What might be wromg
is it dataset or me
Am I the bad guy
The feature importance is really hard to describe with one hot encoding too
mild dirge
If you one-hot encode categorical data, you get new features that can each have their own importance
lapis sequoia
Yeah but it's hard to describe those features' importaces in report
mild dirge
F.e. if you want to predict the salary of a person, and you have a feature "company" that tells what company they work at, it might be useless for 99% of the data. But if someone works at Google, and the category is one-hot encoded, the new column for works at google is very important
lapis sequoia
Like I don't understant that old_yes has an importance too and old_no has an importance too. When infact old yes told everything there was to be told in old_no
mild dirge
For binary categories you can just convert it to 0 and 1 pretty sure
Don't think it is necessary to one-hot encode those
mild dirge
lapis sequoia
Like I don't understant that old_yes has an importance too and old_no has an imp...
For this reason
iron basalt
lapis sequoia
Like I don't understant that old_yes has an importance too and old_no has an imp...
For binary it's one or the other. But for 3 you can already see that you have one of them and not the other two (it's different).
So for binary just leave it as is.
lapis sequoia
how to decide for the depth in decision trees
When I let it run on default params, it gives very high accuracy
But wasn't that supposed to not be good at generalisation
wooden sail
how many no churn and churn were in the original data set?
in the training one, i mean
lapis sequoia
Hmm
The total values are 30%
The one in my confusion matrix
Do you need bifracation? @wooden sail
lapis sequoia
mild dirge
For this reason
Okay. I just used the same function for simplicity. I will drop those extra columns then ig
wooden sail
what is bifracation and what do you mean by "the total values are 30%'"
lapis sequoia
Bifurcation
wooden sail
i just want to know how many were churn category and how many were no churn category in the training set
wooden sail
in the 70% you used for training, how many were of each category
lapis sequoia
Hmm
Will have to turn computer on for that. Are you onto something from that information?

 wooden sail
lapis sequoia
Will have to turn computer on for that. Are you onto something from that informa...
wooden sail
lapis sequoia
Will have to turn computer on for that. Are you onto something from that informa...
just letting oyu know that if it's not close to 50/50 that'll also affect your results
 wooden sail
i'm gonna go sleep, good luck with that
 stuck schooner
anyone :c ?
lapis sequoia
I will uncover
Then we will sleep together
Uh oh
Doesn't sound right
@wooden sail
 wooden sail
that'll do a number on you
lapis sequoia
What's the solution
wooden sail
you can read up on imbalanced classification
steady basalt
lapis sequoia
It was 70-30 split
Try 80/20
lapis sequoia
And check what?
steady basalt
Results
80/20 is the standard these days
Unless u don’t have much data
So results look biased
ocean swallow
iron basalt
See what each generates, check grammar, and decide.
okay thanks for the ton of hlep but i couldn't see myself actually coming up with a concrete idea. NLTK has generation tool builtin from grammar rules but I actually couldn't find english grammar rule set. Not even a very simple one. lol
iron basalt
ocean swallow
okay thanks for the ton of hlep but i couldn't see myself actually coming up wit...
Yea, IDK if you will even find any nice pre-made tools for this. It will take some work.
And finding some grammar rules that are in a nice format is not as common as one would think.
mild dirge
steady basalt
<@467435887236612106> normalising test set to 0-1 like train boosted ac by 20%.
Was your training set normalized?
Because the model expects your data to be in the same format as your training data
If you optimize your model for values between 0 and 1, then your model would be very incorrect if those values are scaled times 100 f.e.
So you should process your test set the same as you do for your training set
Where normalization should be based on the min and max of the training set
@steady basalt
 proper ingot
Hey does anyone provide tutoring here? I need help specifically with pandas
steady basalt
mild dirge
Where normalization should be based on the min and max of the **training set**
Oh...
fucks sakes, i normalised test set on itself
but isnt that still fair?
because you get new data from a source, normalise it on its own values and predict it?
mild dirge
No
steady basalt
im normalising test set on itself and then training the model on the trainig set and predicting test y values
steady basalt
good point
mild dirge
😛
steady basalt
gona have to redo it
mild dirge
And the model is based on the scaling and offset of the training data
So you need to use the same scaling
 steady agate
i am making a wordle bot can somebody help me
steady basalt
omg i hope it doenst kill my score again
mild dirge
But if your test set and training set have approximately the same min and max, it probably won't matter a lot in this case
mild dirge
Not sure how that scaler works, but there probably is a .fit() method by itself
mild dirge
so fit on the training data, and then transform both the train and test
mild dirge
steady basalt
we do scaler.transform only?
yes
steady basalt
so is it this
test[col] = scaler.fit_transform[train[col]]
so the exact same as before, just declaring test
mild dirge
you need to transform the test data
steady basalt
X_train['age'] = scaler.fit_transform(X_train[['age']]) and X_test['age'] = scaler.fit_transform(X_train[['age']])
is this what u meant
X_test['age'] = scaler.fit_transform(X_test[['age']]) i was errenously doing this
mild dirge
norm_train_data = scaler.fit_transform(train_data)
norm_test_data = scaler.transform(test_data)
o hi see
this inst going to work
with how ive coded it
as i coded all the trains first with fit transform
so id have to do them one at a time train and test
mild dirge
So you have
norm_train = (train_data - min_train) / (max_train - min_train)
norm_test = (test_data - min_train) / (max_train - min_train)
What do you mean "all" the trains?
steady basalt
X_test['age'] = scaler.transform(X_test[['age']])
X_train['bmi'] = scaler.fit_transform(X_train[['bmi']])
X_test['bmi'] = scaler.transform(X_test[['bmi']])```there i made them intermittant
mild dirge
Yeah that's it, maybe you can do it with multiple columns at once
Seems like it from the docs
steady basalt
interestingly my model tuned to max out AUCROC is garbage compared to random params
when it does so it lowers recall for important class
so is it best to try to optimise accuracy for this issue
?
mild dirge
What you try to optimzie depends on what you want out of this model
If accuracy is important to you, use a loss function that maximizes it
steady basalt
I mean its tabular data so im using random forest and xgb
so its a grid search parameter
default is accuracy but all i care about is making sure recall is decent for both classes
and optimising roc ruins that
mild dirge
So maybe instead of accuracy use the sum of the recall of both classes
steady basalt
it makes great precision and good recall for 1 class but not the other
idk how to do that, does halvinggridsearch allow custom ones?
mild dirge
Not sure, I don't use sklearn that often
steady basalt
lets say I prefer accuracy of 65, recall from both classes at 65 and roc of 70 than 70,20,65 and 80 respectively
@mild dirge about to find out how much acc ill lose by reducing this bias
any experts in classification metrics here?
kappa score etc
steady basalt
mild dirge
Not sure, I don't use sklearn that often
after doing as you said i suddenly get 0.98 auc wtf?
but thats only with a certain set of parameters i chose, otherwise its 0.82
what on earth
steady basalt
This can be due to oversamlljng before splitting?
river escarp
I need to make a model which predicts whether a product will go out of stock based on historical sales data. What would be a unique/interesting way to implement this?
serene scaffold
river escarp
I need to make a model which predicts whether a product will go out of stock bas...
do you know about time series forecasting?
 timid narwhal
has anyone done extensive work with geocoding such as using the Photon geocode in order to get information about addresses?
 harsh crow
Hello, do you know any library that I can use to make a similar graphic as in the picture?
 serene scaffold
harsh crow
Hello, do you know any library that I can use to make a similar graphic as in th...
serene scaffold
harsh crow
Hello, do you know any library that I can use to make a similar graphic as in th...
what do the dots mean? how is this different from finding a plane outline and putting dots on it in MS paint?
harsh crow
serene scaffold
what do the dots mean? how is this different from finding a plane outline and pu...
The dots means the hits that the plane had. This figure is from the survival bias from a case in the WII.
quaint leaf
harsh crow
The dots means the hits that the plane had. This figure is from the survival bia...
you could combine matplotlib and opencv for example
https://www.researchgate.net/post/Can_I_plot_some_points_over_an_image
 final aurora
Guys Im a mechanical engineering student taking AI as an additional course and its in Python. If there are lists or information i have to plug in, Ill look for them and provide them. I just have no basic in python so im asking for help for the following questions:
def survivorSelection(population, eliteSize):
# Replace the dummy survival selection function below with
# either Fitness Based Selection or Merge, Sort & Truncate.


elites = []

# Replacement starts here  #this is dummy/ Use the merge, sort, truncate and take the elite size list from the top
def merge (population,eliteSize):


for i in range(eliteSize):
    elites.append(population[i])
# Replacement ends here

return elites
I need to change the code between #replacement starts here and #replacement ends here into a merge,sort and truncate python code
#And for the 2nd question: Performance Evaluation. You will present performance evaluation for the different options created in this lab, either: a) Fitness function; or b) Parent Selection function.
filename = 'cities8.txt'
popSize = 20
eliteSize = 5
mutationProbability = 0.01
iteration_limit = 100
cityList = genCityList(filename)
population = initialPopulation(popSize, cityList)
distances = [Fitness(p).routeDistance() for p in population]
min_dist = min(distances)
print("Best distance for initial population: " + str(min_dist))
for i in range(iteration_limit):
population = oneGeneration(population, eliteSize, mutationProbability)
distances = [Fitness(p).routeDistance() for p in population]
index = np.argmin(distances)
best_route = population[index]
min_dist = min(distances)
print("Best distance for population in iteration " + str(i) +
": " + str(min_dist))
print("Optimal path is " + str(best_route))
# TO DO (10 marks) - Performance Evaluation. You will present the performance achieved
# by different options created in this lab. You can choose to investigate either
# a) Fitness function; or b) Parent Selection function. For fitness function, you compare
# the performance achieved by Fitness function 1 (Simple division) and
# Fitness function 2 (Maximum difference). For parent selection function, you compare the
# performance achieved by Random Selection, Tournament Selection, and Proportional Selection.
yozu can scroll up to yesterday's explanation. for now it's most important you keep in mind normalization is done before test/train splitting
final aurora
final aurora
Guys Im a mechanical engineering student taking AI as an additional course and i...
These 2 different questions are part of 1 big Genetic Algorithm code
its under the travelling salesman problem
my group just split up the work in messy orders but we were tasked to just complete our individual parts
 woven coral

 stuck schooner
Hello, what would be a proper way to merge two series together while creating a clue for plotting purpose (ie. a boolean column with 0 for the first series, 1 for the second) ?
 unique flame
I would create a dataframe for the first series with columns [name, bool] and also a second dataframe, for the second series, with [name, bool] and than merge on "name"
steady basalt
wooden sail
yozu can scroll up to yesterday's explanation. for now it's most important you k...
according to pccamel ur not meant to do this
ive changed my project such that x_test columns are transformed based on the fit of x_train
additionally, im going to have to go back and oversample only only training data after splitting,
untold bloom
stuck schooner
Hello, what would be a proper way to merge two series together while creating a ...
hi, can pass indicator=True to pd.merge which will put a new column named "_merge" in the result indicating from which series the data come from: "left_only", "right_only" or "both" are the values. If you pass a string instead of True to indicator, the default name "_merge" will be replaced with that
In [35]: s_1
Out[35]:
0    1
1    2
2    3
3    2
Name: month, dtype: int64

In [36]: s_2
Out[36]:
3    A
4    D
5    Z
Name: item, dtype: object

In [37]: pd.merge(s_1, s_2, how="outer", left_index=True, right_index=True, indicator="flag")
Out[37]:
   month item        flag
0    1.0  NaN   left_only
1    2.0  NaN   left_only
2    3.0  NaN   left_only
3    2.0    A        both
4    NaN    D  right_only
5    NaN    Z  right_only
you can map the resultant column values to 0, 1...
stuck schooner
But pd.merge doesn't take only Series as argument
 wooden sail
steady basalt
according to pccamel ur not meant to do this
wooden sail
steady basalt
according to pccamel ur not meant to do this
the explanation camel gave you was the same i did, except he went on to explain in more in detail. the main idea is to do the same scaling to all the data
 wraith goblet
versed gulch
```py
arr = sparse.DOK((grid_size, grid_size, 242, 512, 512), dtype=np.uint8)
#...
wraith goblet
versed gulch
```py
arr = sparse.DOK((grid_size, grid_size, 242, 512, 512), dtype=np.uint8)
#...
PLEASE
tell me what font and what theme you are using in what text editor or IDE
stuck schooner
wraith goblet
tell me what font and what theme you are using in what text editor or IDE
comic sans ms, clown theme is nice
stuck schooner
no regular just light theme and default vs code font
wraith goblet
thx
steady basalt
wooden sail
the explanation camel gave you was the same i did, except he went on to explain ...
I scaled testing data on the FIT of the training data, rather than all together
that was his point, so that if you have a single testing sample to predict you can scale it on trainig data
wooden sail
that makes no difference, as long as you apply the same scaling
steady basalt
wooden sail
that makes no difference, as long as you apply the same scaling
also, do u know whats the best metric to optimise for making sure neither class has low recall or precision
wooden sail
the difference is that in practice you don't have as many samples to test on, and they may not be know ahead of time. other than this, the takeaway is just apply the same scaling to everything
steady basalt
rather than getting massively high auc but just from one class
such as 0.06 for one and 0.98 for anoither
even after rebalancing
wooden sail
probably a wasserstein-like metric that considers support/cardinality mismatch
steady basalt
does sklearn have
wooden sail
probably not
steady basalt
           0       0.97      0.95      0.96    145304
           1       0.07      0.10      0.08      5420

    accuracy                           0.92    150724
   macro avg       0.52      0.53      0.52    150724
weighted avg       0.93      0.92      0.93    150724
this is unnacceptable
id take a 20% loss in accuracy to get class1 over 0.6 recall
can anyone help with that?
my test data is not balanced but trainig has been balanced
and yet its still guessing 0 for all
versed gulch
Hi is there a way I can project my 2D flat surface back to a 3D surface (i.e. a sphere) in Python as the image originally in real life was like 3D spherical structure but was then flattened when taking the image?
wooden sail
if you have only a single 2D surface and no extra info, no
if you have several 2D images from different angles, you can use epipolar geometry for this. and if you stored all of the coordinates on the sphere that the 2D image corresponds to, it's easy
versed gulch
wooden sail
if you have only a single 2D surface and no extra info, no
extra info as in the approximate radius?
wooden sail
radius, distance from the sphere to the 2D imaging plane, and which pixels correspond to which part of the sphere
versed gulch
wooden sail
if you have several 2D images from different angles, you can use epipolar geomet...
I have several but all at the same angle as the specimen in question was flattened before imaged (taken tile by tile)
so I stitched it all together to make one big 2d Image (these images were originally 3D but i took their Maximum intensity projections)
wooden sail
there's no easy way to undo that kind of projection. you'd have to look in the original data to see which coordinates contained the max and use that info
this image probably won't be very useful though
it'll be sparse with some points scattered here and here, and 0 everywhere else
versed gulch
wooden sail
there's no easy way to undo that kind of projection. you'd have to look in the o...
I know how they're arranged as I've got their coordinates but this is obvious when it was flattened
wooden sail
then what's the question?
versed gulch
to project it onto a 3D spherical surface
wooden sail
you have the coordinates
versed gulch
yes but obviously when joining them it makes a rectangular shape
wooden sail
what do you mean by "joining them"
versed gulch
so my images are 3D tiles and what I did to each tile was take the maximum intensity projection of them making them 2D. after this using the coordinates of how they're arranged i glued the tiles together to make 1 large 2D image
using hstack and vstack
wooden sail
mhm
versed gulch
so now i got this 2d large image and want to project it onto a 3D sphere-like (hemishphere etc) shape, and I'm wondering how to do that?
wooden sail
ok, if all you want is to map the plane to a sphere, regardless of where the samples came from, you want to follow the same procedure of a stereographic projection. i think the common python libraries only do it in the opposite direction (the usual direction), mapping a sphere to a plane (a hemisphere to a disc)
alternatively you can use a vertical projection if your images can be considered to be captures from "infinitely far away" from the sphere
i really don't know any libs that do this automatically, but it's not so difficult to do by hand
here's a nice stackoverflow on it https://math.stackexchange.com/questions/1729012/mapping-the-unit-disc-to-the-hemisphere
and here on wiki https://en.wikipedia.org/wiki/Stereographic_projection
the bottom one here

if you have numpy-like arrays, it should be doable in a couple of broadcasted operations
 north condor
I know this question is dumb, but anyways
I have this data

from did a moving average to get

when applying a SARIMA model, should I apply it to the first or second?
wooden sail
that depends on whether you know if the high frequency components you filtered out have any useful info
if you know anything about the spectral content of the target signal, that'd be your answer
north condor
It's sales data so I doubt it. Assuming that the average across the window is a good representation of each of the individual days.
wooden sail
then the second should be fine as long as the averaging window was reasonable
north condor
30 days
wooden sail
do you know what a fourier transform is?
north condor
Yeah, why?
wooden sail
try looking at the amplitude or power spectral density of the first plot. if the noise is white~ish in distribution, we should see the spectrum of the signal of interest + a rather constant offset added to all of the spectrum. you can use this info to decide what a reasonable window length for filtering is
you can also plot the ASD or PSD of the filtered signal and see if you're happy with how it came out compared to the original
north condor
Oh cool, thanks
 frigid creek
hi, umm can anybody tell me what is average precision and what precision and recall has to do with it like a 5 y/o? thx
north condor
wooden sail
try looking at the amplitude or power spectral density of the first plot. if the...
And the moving average part of the SARIMA model will not interfere with the rolling average I've already done (assuming no useful info has been filtered out)?
wooden sail
it shouldn't if the noise is uncorrelated to the quantity you are trying to fit with the (S)ARIMA model
north condor
Ok, thanks
wooden sail
the assumption is that the error between the fit of the previous samples and the model for those samples is a random quantity that has some direct predictive power over a given window of time
that's only true if the error is related to the model, it need not necessarily be the case
but do try both and see. doing a moving average filter can be incorporated explicitly into the (S)ARIMA model, if you wanna look at that
steady basalt
is it macro f1 that will balance both clases scores?
might use thatr as my scorer
to stop one sided high scores
serene scaffold
steady basalt
is it macro f1 that will balance both clases scores?
macro f1 takes the average for each class. whereas micro f1 is the average of all the instances.
mild dirge
macro treats every class as equal basically
steady basalt
serene scaffold
macro f1 takes the average for each class. whereas micro f1 is the average of al...
so whats best in fixing my problem?

i nee recall for 1 to be high too
im willing to sacrifice other stuff
serene scaffold
steady basalt
so whats best in fixing my problem?
I'm not caught up on what your model is intended to do, or what the training data is, etc.
steady basalt
its from a databank of peoples info and medical stuffs
i want high recall for 1, which i oversampled
but its rly bad

 serene scaffold
north condor
Does anyone know have to fix this error?
serene scaffold
north condor
Does anyone know have to fix this error?
shouldn't you be passing something to fit?
north condor
What do you mean?
Here is the example I'm follwing

The data is passed into the model ARIMA(train_data, order=(7,1,2))
serene scaffold
what is type(model)? by the way, I won't look at any more screenshots--please use text.
and if it's just SARIMAX, where can I find the docs for that?
north condor
Yeah
type(model) = statsmodels.tsa.arima.model.ARIMA
I tried passing in freq="D" and missing="drop" but that didn't work and the implied frequency should be correct already.
steady basalt
anyone know a good balanced metrics scorer?
scikit-learn
There are 3 different APIs for evaluating the quality of a model’s predictions: Estimator score method: Estimators have a score method providing a default evaluation criterion for the problem they ...
untold bloom
@north condor That's not an error but a warning saying that the underlying procedure did not converge. SARIMAX of statsmodels uses maximum likelihood to figure out the (S)AR/MA parameters. It's an iterative process (e.g., using L-BFGS), so there's a max_iter parameter controlling it. It turned out that although max_iter was reached, maximum likelihood value (or around) was not, hence the ConvergenceWarning.
you can pass maxiter to .fit.
amber swan
hi, got a time series question regarding feature engineering due to a course im following on it (and the lecturer is on vacation 😅)
when creating features such as lag-features, moving averages, ... what is the best practice to determine the ideal value for my dataset (here it is btw: https://www.kaggle.com/datasets/robervalt/sunspots) note: this dataset has seasonality that reoccurs every 11 years (every 132 datapoints)
from my understanding starting with a lag feature based on the seasonality is a decent one to start with but what about others... are there any optimizers (hyperparameter tuning?) or stuff like moving average (which my lecturer said doesnt work that well for seasonal data which im not sure about) that i could take a look at? im quite new to all of this so if im incorrect about any assumptions please correct me 🙂
north condor
untold bloom
you can pass `maxiter` to `.fit`.
Thanks
What would be a sensible value?
untold bloom
i wouldn't know; but i know 100_000_000 isn't, and 10 isn't :p
1000 maybe?
if your data size isn't very large, you can try & see perhaps; otherwise i don't have a strong heuristic in general
north condor
Ok
wooden sail
that depends very strongly on the method it's using. if it's really L-BFGS, it depends on how well conditioned the estimate of the hessian is at every iteration, so a good thing to play with is the initial hessian
shouldn't be all that difficult to compute the fisher information matrix, for instance
steady basalt
wow, changing test train split to 90:10 instead of 70:30 literally made my results actually viable
0 435802
1 435802
training
0 48435
1 1807 testing
 odd marsh
Running model.summary() to see the layers of my model drain all my 16GB of ram, freeze VS Code and destroy Jupyter, any help?
Also this happens
 compact valley
guys, has anyone finished projects on dataquest.io?
I am about to start some and I was wondering If I can have a link to share with HR so I can apply to some Data positions with this projects
north condor
If I have a pandas time series containing daily sales data, how can turn it into a pandas time series containing monthly sales data summing up all of the sales of the whole month?
 desert oar
north condor
If I have a pandas time series containing daily sales data, how can turn it into...
desert oar
north condor
If I have a pandas time series containing daily sales data, how can turn it into...
use .resample
!d pandas.DataFrame.resample
arctic wedgeBOT
DataFrame.resample(rule, axis=0, closed=None, label=None, convention='start', kind=None, loffset=None, base=None, on=None, level=None, origin='start_day', offset=None)```
Resample time-series data.

Convenience method for frequency conversion and resampling of time series. The object must have a datetime-like index (DatetimeIndex, PeriodIndex, or TimedeltaIndex), or the caller must pass the label of a datetime-like series/index to the `on`/`level` keyword parameter.!d pandas.Series.resample
arctic wedgeBOT
Series.resample(rule, axis=0, closed=None, label=None, convention='start', kind=None, loffset=None, base=None, on=None, level=None, origin='start_day', offset=None)```
Resample time-series data.

Convenience method for frequency conversion and resampling of time series. The object must have a datetime-like index (DatetimeIndex, PeriodIndex, or TimedeltaIndex), or the caller must pass the label of a datetime-like series/index to the `on`/`level` keyword parameter.it's like groupby but for time ranges
north condor
Perfect, tysm
steady basalt
anyone know why my accuracy goes from 56% to 70% when changing from 80/20 to 90/10 traintest split
is this due to the variance and bad data
if so, is it cheating to just go with the 90/10
ftr, i have 500k samples, of which 18k are the target class, I oversampled thje training data too, so the final test data was left with 40k/1.8k class balance
desert oar
any number of reasons. natural variance in the data (remember, splitting should be random) is a likely suspect. i suggest doing the same exact training process for several train/test splits (maybe 5-10) to see how much the accuracy varies solely due to randomness in splitting
there are also results showing that cross-validation can perform better than repeated train/test splits in terms of needing fewer iterations to get the same amount of variation coverage
steady basalt
yeah time to thoroughly investiage this... do you mean with a different random seed?
or different split values
desert oar
same seed, do 10 different splits, run the same exact process on each split
steady basalt
can you explain what you mean by cross validation in this case?
desert oar
steady basalt
can you explain what you mean by cross validation in this case?
cross-validation is a specific technique
steady basalt
Yeah ik what it is
desert oar

Cross-validation, sometimes called rotation estimation or out-of-sample testing, is any of various similar model validation techniques for assessing how the results of a statistical analysis will generalize to an independent data set.
Cross-validation is a resampling method that uses different portions of the data to test and train a model on di...
steady basalt
are you saying to stick with the well performing test train split?
and do cv?
i didnt do any cv on my test set
desert oar
i am saying that in the future you might want to use cross val instead of a train/test split as long as you have enough data
oh, i see
steady basalt
I dont really understand what u mean by that
how can you replace test train split by cv?
desert oar
you have two completely separate datasets?
steady basalt
arent they meant to be used in tandem? youd always want a test holdout
desert oar
it's rare in real world scenarios that you have a "train set" and "test set" -- usually you have a big pile of data and you need to figure out what to do with it
steady basalt
I have 1 set
desert oar
so often you construct your own train/test split, and if you have enough data in the train set you can do further splitting
steady basalt
so is it enough to skip splitting it and just to 10fold cv instead to get a more reliable understanding
and take the average scores
desert oar
if this is a true holdout set then no i don't recommend re-splitting 10 times. you'll burn all of your holdout data
steady basalt
doing as you advice, id skip holdout entirely
desert oar
no, you definitely do want one
but i do suggest doing cross val on the training set, or repeated train/test splits
it depends on how much data you have and how nervous you are about missing sections of it
desert oar
i see the numbers you posted above. yeah that's pretty typical. it's also hard to know if 56 -> 70 is within reason or if it's a sign of a problem
steady basalt
so as you advice: test train split 80/20 or 90/10 and on the training set do cv to get additional insight, while also doing analysis just on the test set too?
desert oar
i would avoid doing analysis on the test set for now, and do the cv or repeated-splitting analysis on the train set only. that way you can get a general sense of how much variation you can expect just from splitting
steady basalt
the shocking class1 scores?
i need it fixed seriously, even if it means sacrifices
in the final results, do i use the training cv or test results?
desert oar
in the final results you'd re-fit on the whole training set and then test on the test set
steady basalt
I did that already is what im saying, i fit my model to all traiing set
desert oar
right. but now you have reason to question your process (unexpectedly big accuracy increase), and you need to gather more info
so instead of burning up your test data to do so, i'm suggesting going back to just the training set for that analysis
steady basalt
okay... good idea i guess
desert oar
i mean, you could do it on the full dataset too. that's fine if you're really disciplined and you aren't tempted to tune hyperparameters based on the results
desert oar
so if you do the repeated train/test split analysis on the full dataset, that will definitely give a better result. but then you're risking information leakage via your brain.
steady basalt
funnily, im getting 96% scores for my gridsearch best results, weird
thats 3cv
thisis data science channel
desert oar
oh ok so you're already doing 3-fold cv on the train set to tune parameters
steady basalt
right, but thats not really anything to do with analysing why its so sensitive to differnet splits
lapis sequoia
steady basalt
thisis data science channel
ai
steady basalt
yeah thats ot an ai task
lapis sequoia
eh
steady basalt
thaqt isnt really ai
lapis sequoia
sure i'll use another channel
desert oar
lapis sequoia
ai
i'm not sure this kind of task is considered ai. check out #user-interfaces perhaps, or #algos-and-data-structs or even even #game-development. object collision detection itself isn't an AI task
lapis sequoia
thanks :D
steady basalt
@desert oar I mean no1 wud notice if i just didnt mention anything and went with the 90/10 split and called it a day with good scores...
desert oar
heh that's always the danger 🙂
i think you're probably ok doing repeated (~10?) train/test splits on the entire dataset but just to see how much variation you get when splitting.
steady basalt
I think its likely the issue is the more useful target class samples were left out of the training set in 8/2 split
desert oar
that's possible. make sure you are doing a stratified split
oversample first, then do a stratified split
steady basalt
oh no
desert oar
the other risk with splitting in general is splitting up rare values of features
steady basalt
i oversampled on my training data only, as per the manual
desert oar
ok, that's good too
but keep in mind that accuracy isn't a great metric to use on unbalanced data
steady basalt
ive basically all but eliminated my bias mistakes
desert oar
accuracy can be very sensitive to the class imbalance
steady basalt
i used smote to boost from 18k to 330k class1 samples
i normalised based on training set
then i analyised based on test set
im not rly using acc
more so i care about having a good balance of BOTH classes recall/precision
desert oar
okay, so you're using f1 score to evaluate then?
steady basalt
basically the main issue was as seen earlier, i was getting 0.2 recall for positive class and still high roc
im just waiting until i get >0.6 recall AND precision for BOTHclasses
rather than getting 0.90 for 1 and 0.1 for another
make sense/
desert oar
oof yeah. i think roc is sensitive to class imbalance too
desert oar
indeed that's no good. when doing grid search what scoring criterion are you using?
steady basalt
test set is extremely unbalanced but that doenst mater
desert oar
it sounds like you should be using f1
steady basalt
ive tried
a lot ... including f1 and auroc
currently im doing auroc
score=(train=0.996, test=0.947)
my question is. why tf is this happenign in my search
when it was much lower for 80/20
desert oar
i'd stick with f1 tbh. auroc is a bit funky https://stats.stackexchange.com/a/468497/36229

Cross Validated
I just start to learn the Area under the ROC curve (AUC). I am told that AUC is not reflected by data imbalance. I think it means that AUC is insensitive to imbalance in test data, rather than imba...
steady basalt
I think if anything this is a good sign because its training data, and getting the best out of that is all that matters, surely its not cheating to do whatever boosts it
if that means 99/1 split so be it
desert oar
well that's my point: you don't know what's causing it. likely suspects include incorrect stratification of classes during splitting (you probably ruled this out), or rare values of features that are also being split and maybe need to be stratified
steady basalt
wdym by stratified in this context
desert oar
enforcing that the distribution is similar on both sides of the split
steady basalt
[CV 1/3; 1/2] END bootstrap=True, criterion=entropy, max_depth=None, max_features=sqrt, min_samples_leaf=2, min_samples_split=2, n_estimators=1000, n_jobs=-1;, score=(train=0.999, test=0.968) total time=15.9min
this cant be natural
steady basalt
desert oar
enforcing that the distribution is similar on both sides of the split
isnt this cheating? i want test to be torally random
desert oar
steady basalt
isnt this cheating? i want test to be torally random
it's not cheating at all. it's ensuring that the test and train sets are both reflective of the underlying data