#data-science-and-ml
1 messages · Page 3 of 1
 fiery dust
 steady basalt
but tahts not really what machine learning itself it
is* thats just a process of work
machine learning itself is the numbers behind making those predictions
fiery dust
I would like to understand what machine learning is bfore actually studying it lol
steady basalt
how theyre calculated
the video you watched describes whatw happens when you compare multiple ML methods
unless it was like, describing something else like knn distances idk?
fiery dust
Hmm and what would you recommend for me to understand how ML works
Like I want to really understand
steady basalt
ok dude
fiery dust
cause if not ☠️
steady basalt
look into KNN, SVR and decision tree in that order
knn shud be easy to undetrstand
fiery dust
ok
steady basalt
and svr wil lallow u to understand better
fiery dust
aight :)
steady basalt
later
In statistics, the k-nearest neighbors algorithm (k-NN) is a non-parametric supervised learning method first developed by Evelyn Fix and Joseph Hodges in 1951, and later expanded by Thomas Cover. It is used for classification and regression. In both cases, the input consists of the k closest training examples in a data set. The output depends on...
here is one way of trying to predict what class something belongs to, using distance
its.. prety weak
in most cases imo
start with a couple of classics
then try to code it and visualise
not from scratch ofc
it snot rly something u can just learn in a month and predict stocks its a huge field
steady basalt
but if u really need to get that project done there will be some tutorials on LSTM RNN neural networks which can predict time series windows
requries some pretty difficult python tho
fiery dust
So in order. KNN, then SVR, then decision tree, then pytorch?
steady basalt
its one of the hardest things to do imo
fiery dust
I like challenges
 grand canyon
could someone take a look at my neural network, its a binary classifier stuck at around 49% accuracy im not sure why its not learning as epochs increase
steady basalt
ur gona need to get really comfortable with python
steady basalt
could you impliment linear regression to predict stocks right now?
fiery dust
Uh
steady basalt
not that it wud work
fiery dust
I mean I would need to study kinear regression to tell that
steady basalt
massive error
fiery dust
I mean I know what indicators Ill use
steady basalt
just use purely price?
fiery dust
no
steady basalt
what else is there
fiery dust
you are asking what indicators Ill provide to the script?
steady basalt
yes
i know how to do it so maybe i shud try for once stocks and make some money X)
but if this was real surely everyone wud be millionaries
steady basalt
im sure they did
fiery dust
nah
steady basalt
or rather daily
fiery dust
Well what you just said is really possible with ML right?
steady basalt
I think maybe take hourly stock price readings for the last 15 years
could do smoething
fiery dust
yeah
steady basalt
e.g youd want to have inflation, currency info, economy strength and growth, social stuff factored in
maybne its possible
steady basalt
where can i get a csv of stock price at hourly intervals i wana try this, would also be helpful if i cud get data on montlhy inflation,growth,consumer spending and interest rates
i could add those as events
fiery dust
useless
steady basalt
must have some sort of impact
if you loko hard enough there will eventually be some correlation
fiery dust
people go too far on "indicators"
So as a conclusion, KNN, SVR, decision tree then pytorch right?
steady basalt
no ur gona need neural network for predicting stocks
i wonder in theory if you take into account all of the covariates i mentioned but also added in nlp from massive webscrapes its possible
I bet there’s guys at banks been working on that
What changes?
Society? Politics? Tech?
In theory couldnt you factor this in with enough data and sources
Doesn’t need to be everything but key info
Financial info and social info and political events
Must be some way to quantify
Just use the blue red dot psychic trend

 unique flame
There are papers with models predicting bankruptcy 😄
steady basalt
Wana model my own death
unique flame
that seems much more fun than predicting stock prices
steady basalt
I’ve done a lot of medical statistics and studies and had a look at a lot of people dying trends
But I never considered adding my own fat ass into it, I’d probably have a massive hazard ratio
Ms?
grand canyon
i had a question
steady basalt
I’d recommend conintueing for masters the stats gets good
grand canyon
my training loss starts oscillating between 100 and 0 for some reason could someone take a look at my code?
steady basalt
U get to look at real records and analyse that obese peopel do infant die 3x rate
steady basalt
grand canyon
my training loss starts oscillating between 100 and 0 for some reason could some...
Learning rate?
grand canyon
steady basalt
Learning rate?
0.001
steady basalt
USA?
grand canyon
?
steady basalt
grand canyon
0.001
Did u test 0.0001
grand canyon
steady basalt
Did u test 0.0001
let me try that
steady basalt
Oooo me too
grand canyon
steady basalt
Did u test 0.0001
tried that its better
steady basalt
Apply to imperial ucl Warwick
grand canyon
however its reaching a point where loss sometimes hits a really large value then goes down a lot
and then repeats this
steady basalt
Also Manchester
i got rejected by icl
nice, decent city
im gona lose my unidays in september
feels badddd no more discounts
london has ALL the jobs man
almsot all companies
i plan on workin gin london for a while
thats a factor, does depend on ur situation
im lucky af
but alot of people prob wud have to stay in shitty areas
fuck PWC
im in the NE rn btw
ive been rejected by pwc 2x now, once for a grad scheem final round btw and once in an acutal interview
pwc hq is london
i swear ill never work for them even if u payed me
are u in newcastle?
im going across the river into enemy terrirotry tromorrow to see my nan
she in uhh
near gateshead
do u know hebburtn
its tiny town in newcaslte
near jarrow
im going to london on weekend tho for prob a long time
grand canyon
i had anotehr question
my loss decreases for a while then just rebounds to a higher value
what could that indicate?
grand canyon
ill see how it goes
if you don't mind if im still having issues could you take a look at my code?
steady basalt
its prob overfitting if validation starts climbing up above train
i dont think looking at ur code will help
its a projcet level thing
grand canyon
wdym by that
steady basalt
its probably not a code problem
specifically as in a code error
it takes hours to figure this stuff out
grand canyon
so rlly i jkust need to mess w hyperparameters and diff functions and all that?
steady basalt
screenshot ur data
grand canyon

GitHub
The PatchCamelyon (PCam) deep learning classification benchmark. - GitHub - basveeling/pcam: The PatchCamelyon (PCam) deep learning classification benchmark.
fiery dust
steady basalt
no ur gona need neural network for predicting stocks
so pytorch will be useless? where can I learn how neural networks work? cause i want to study what I should
I need to understand how pytorch and neural networks work to make the best decision
steady basalt
fiery dust
so pytorch will be useless? where can I learn how neural networks work? cause i...
both pytorch and tensorflow allow neural networks
steady basalt
no u shud learn it at the same time
fiery dust
if Im good at statistics I shouldnt have a problem right?
fiery dust
steady basalt
no u shud learn it at the same time
ahh okok
steady basalt
and learn also how neural networks work maybe
fiery dust
ok
fiery dust
whats that?
grand canyon
steady basalt
so yes cnn?
im not using a conv nn
im just using a traditional one
where i make the image into a tensor
and do operations over it
steady basalt
thats ur issue possibly, if you want to get edges done
grand canyon
so what im trying to do is say "yes" if there's cancer and "no" if not, and i do that by having two output neurons and i pick the one with the highest value. its index dictates the presence or not (0 if not present, 1 if present
steady basalt
how does ur nn do that
grand canyon
steady basalt
how does ur nn do that
input layer, 100 neurons in the middle, two output neurons
neuron 0 is if there isn't cancer, neuron 1 if there is
depending on which one has a higher value
it will output the presence of cancer or not
steady basalt
based on?
grand canyon
wdym based on
grand canyon
ig?
grand canyon
yeah
steady basalt
so why didnt you try a cnn, the best model at doing this
 mild dirge
You are doing binary classifcation on images with a regular MLP?
steady basalt
xd
mild dirge
Doesn't sound like a good idea
steady basalt
im sure hes learning thats all
grand canyon
yeah im leanring, the course im doing right now uses a traidtional nn on the mnist data set
grand canyon
so i wanted to try it out myself on a new dataset, im sorry if im asking stupid questions
steady basalt
cv2or wwatever
mild dirge
Well the mnist data is very simple, you could predict the number pretty accurately using just 1 or 2 pixels
grand canyon
alr so the move is to use a cnn?
steady basalt
ur meant to be getting 90% auc?
mild dirge
But you don't want to predict it based on just the value of all pixels, you want to find patterns like corners, and roundness, and shapes etc.
steady basalt
ur prob not getting even 75 right?
grand canyon
steady basalt
ur prob not getting even 75 right?
i think im getting 50% acc because im not using cnn
im just using a normal nn
so i have a question when should i use a normal ann vs a cnn
mild dirge
Cnn is not the only way btw, you can use some methods to compress the data and use a traditional multi-layer perceptron
But with every single pixel as input, it will likely overfit
Or require a lot of data
grand canyon
alright i think cnn is like industry-practice though, so i think ill try to learn that
and try something
that makes sense a ann isn't "good enough" to fit complex data that im feeding in
steady basalt
jesus CVHRIST im workign wwith the worst data of ALL TIME
these fools have recorded medical readings in different columns, wrong columns, used strings, floats, different bloody measreument scales
 rough mountain
Currently my GAN (WGAN-GP), is preforming terribly. I'm starting to think it's beacuse of the output's high channel count (54). Is there a better way to approach this? (Maybe with 3d convs instead of 2d?)
 tropic matrix
steady basalt
jesus CVHRIST im workign wwith the worst data of ALL TIME
tropic matrix
steady basalt
jesus CVHRIST im workign wwith the worst data of ALL TIME
could always be worse
the data i'm working on is regression on a live in game market
by the end of my preprocessing the shape of my data is (4899,)
on another note
what would be the best way to normalize a dataset that's too large to keep in ram?
i'm currently using a data generator based off of keras.Sequence, but when I try to blindly input the generator into keras.layers.normalization's .adapt() function, i get the following error:
ValueError: in user code:

    File "/usr/local/lib/python3.8/dist-packages/keras/engine/base_preprocessing_layer.py", line 117, in adapt_step  *
        self._adapt_maybe_build(data)
    File "/usr/local/lib/python3.8/dist-packages/keras/engine/base_preprocessing_layer.py", line 285, in _adapt_maybe_build  **
        self.build(data_shape)
    File "/usr/local/lib/python3.8/dist-packages/keras/layers/preprocessing/normalization.py", line 137, in build
        input_shape = tf.TensorShape(input_shape).as_list()

    ValueError: as_list() is not defined on an unknown TensorShape.
 night sequoia
Hey there ! I have been reading the book "Hand's On machine learning" and making notebooks of each chapter here's the 7th chapter on Ensemble Learning and Random Forests , have a look at it , Thank you !!--> https://www.kaggle.com/code/supreeth888/ensemble-learning-and-random-forests/notebook

Explore and run machine learning code with Kaggle Notebooks | Using data from No attached data sources
 oblique garnet
Hie, has anyone worked with .csv.gzip files before?
I need help with this error: https://stackoverflow.com/questions/73148463/how-to-decode-a-csv-gzip-file-containing-tweets
 summer pebble
how do you improve a model on TF-IDF?
 thick marlin
I'm getting the following traceback after running the bash scripts/test_training.sh from https://github.com/NVlabs/imaginaire/blob/master/INSTALL.md
ImportError: /jmain02/apps/gcc/5.4.0/lib64/libstdc++.so.6: version `GLIBCXX_3.4.26' not found (required by $HOME/mambaforge/envs/imaginaire1/lib/python3.8/site-packages/scipy/linalg/_matfuncs_sqrtm_triu.cpython-38-x86_64-linux-gnu.so)
ERROR:torch.distributed.elastic.multiprocessing.api:failed (exitcode: 1) local_rank: 0 (pid: 33636) of binary: $HOME/mambaforge/envs/imaginaire1/bin/python
Full traceback: https://paste.pythondiscord.com/poxanigapu
I'have tried this for gcc 9.1.0 (CUDA 11.1) andgcc 5.4.0 (CUDA 10.2)but both give the same GLIBCXX_3.4.30' not found and 'GLIBCXX_3.4.26' not found respectively.
both gcc's are available as modules that can be loaded individually
The results for libstdc++.so.6 are as follows
strings /jmain02/apps/gcc/5.4.0/lib64/libstdc++.so.6 | grep GLIBCXX
GLIBCXX_3.4.1
GLIBCXX_3.4.2
GLIBCXX_3.4.3
GLIBCXX_3.4.4
...
GLIBCXX_3.4.16
GLIBCXX_3.4.17
GLIBCXX_3.4.18
GLIBCXX_3.4.19
GLIBCXX_3.4.20
GLIBCXX_3.4.21
Full: https://paste.pythondiscord.com/edobizociv
And for gcc-9.1.0
GLIBCXX_3.4
GLIBCXX_3.4.1
GLIBCXX_3.4.2
...
GLIBCXX_3.4.20
GLIBCXX_3.4.21
GLIBCXX_3.4.22
GLIBCXX_3.4.23
GLIBCXX_3.4.24
GLIBCXX_3.4.25
GLIBCXX_3.4.26

GitHub
NVIDIA's Deep Imagination Team's PyTorch Library. Contribute to NVlabs/imaginaire development by creating an account on GitHub.
 candid garnet
so at the minute i'm working with a messy 3D array.
The current has been swept through 80 different values.
The frequency has been swept through 5001 different values.
Amplitude of a signal response has been taken for every current at every frequency.
What i've got is each of these arrays having the shape (80,5001)
I would like to write them to a csv, just saying the amplitude for every frequency and current, even though they'd be repeating.
When I create a numpy array using np.array(current,frequency,amplitude)
That gives me a 3D array of shape (3,5001,80)
Any guidance is appreciated
 wooden sail
there's numpy.savetxt('myfile.csv', mynumpyarray, delimiter = ',')
i'm not sure how numpy will unfold a 3d array though, i'd almost suggest saving 3 CSVs. one of them the array of currents, one of them the array of frequencies, and the last being the matrix of amplitudes
candid garnet
savetxt takes only 1D/2D
wooden sail
makes sense. you can go with my suggestion, if you find it to your liking
otherwise you have to choose an unfolding yourself
candid garnet
I think i'd prefer one csv of just having them current and frequency columns repeating (with the amplitude being unique each time)
candid garnet
one super long i sfine
is fine** for now, will keep my supervisor happy in the short term haha
wooden sail
i strongly discourage your choice, but i won't stop you. just savetxt the meshgridded currents and frequencies. these should be matrices of the same size as the amplitudes matrix
 lapis sequoia
Hi guys can someone help me with Adjusted Rand Score in sklearn? Do we just generate a randomized array of class label then compare it - for instance versus a KMeans model? then the score would tell us if the KMeans model is not terrible/random? or do we clash it with other models like DBSCAN? where we can assess the score to the somewhat ground truth that the both models arrived at? Sorry to ask, I just couldn't find any digestable resources about it thanks.
steady basalt
whats DBSCAN
 modern silo
Is there a way to search through a pandas df for a specific string in a column and show the whole row?
df.columnname.str.contains('string') outputs boolean - wondering if there's another way to do this?
wooden sail
my google-fu says something like my_df.loc[my_df['some column'] == some_value]
something like ```py
In [1]: import pandas as pd
In [2]: d = {'boopness':[1,2,3], 'beephood':[20,-5,40]}
In [3]: df = pd.DataFrame(d)
In [4]: df.loc[df['beephood']>0]
Out[4]:
boopness beephood
0 1 20
2 3 40
that didn't work for me
wooden sail
do show your code
modern silo
activity is a stream of splunk output
df = pd.DataFrame(activity)
df.loc[df['connectip'].str.contains("ip", case=False).notnull()]
the notnull() part ruins my experiment, it works for me without that
note that str.contains(...) returns a series of booleans. both True and False count as not null, so this will return true for all true and false values, and false for NaNs
check this out
In [18]: df
Out[18]:
   boopness  beephood blarghdom
0         1        20         a
1         2        -5         b
2         3        40      None

In [19]: df['blarghdom'].str.contains('a')
Out[19]:
0     True
1    False
2     None
Name: blarghdom, dtype: object

In [20]: df['blarghdom'].str.contains('a').notnull()
Out[20]:
0     True
1     True
2    False
Name: blarghdom, dtype: bool
just provides bool output 😦
wooden sail
modern silo
```
activity is a stream of splunk output
df = pd.DataFrame(activity)
df.loc[df[...
a bit more googling suggests that the cryptically named "fillna" is what you wanted, not notnull()
modern silo
ahh
wooden sail
modern silo
just provides bool output 😦
ofc, all you need to do is then put df.loc[all of the stuff that returns a series of bools]. that's exactly how your code works, too
lookie
In [30]: df
Out[30]:
   boopness  beephood blarghdom
0         1        20         a
1         2        -5         b
2         3        40      None

In [31]: df['blarghdom'].str.contains('a').fillna(False)
Out[31]:
0     True
1    False
2    False
Name: blarghdom, dtype: bool

In [32]: df.loc[df['blarghdom'].str.contains('a').fillna(False)]
Out[32]:
   boopness  beephood blarghdom
0         1        20         a
using an array of bools for indexing is called "fancy indexing" (at least in numpy) and it's the same thing you were already doing
modern silo
that worked
wooden sail
cool
modern silo
wooden sail
cool
thank you so much - I gotta get better at object management 😄
wooden sail
idk what you mean by object management, but i would say "with google" instead lol
<@&831776746206265384>
(the message already got deleted; someone posted a nitro scam link)
 carmine solstice
yea, they hit pygen first
wooden sail
all righty, thanks for the quick reply nevertheless 😛
 untold bloom
na=False is possible in .str.contains to fill .fillna(False)'s place
 red timber
Accountability post:
Continuing to work on extracting data from websites for my sentiment analysis project. Customer reviews from Amazon is taking a bit longer than I thought, but I continue on…
Today I also started a math course in linear algebra. 😸
 distant shadow
Hi everyone,
I'm learning about CNN, and I've done the popular educational projects, and trying to do something more realistic now.
I saw this challenge https://www.kaggle.com/competitions/herbarium-2022-fgvc9/overview and wanted to work on it. However, I find it a little bit difficult to handle the data since the images are in separate folders, and the labels are in a dataframe.
I know there are people with more experience here, and I hope somebody will be able to give pointers in the right direction.
And sorry if this question sounds stupid.

Identify plant species of the Americas from herbarium specimens
lapis sequoia
anyone know a good way i could use image to text recognition to make a restaurant menu into a json like the categories is one list the price etc
 hidden ledge
´´´py from tkinter import *
from PIL import ImageTk
food = ["Tacos","Pizza","Pasticcio"]
def order():
if(x.get()==0):
print("You ordered Tacos!")
elif(x.get()==1):
print("You ordered a Pizza!")
elif(x.get()==2):
print("You ordered a Pasticcio!")
else:
print("huh?")
window = Tk()
TacosImage = ImageTk.PhotoImage(file="tacosE.png")
PizzaImage = ImageTk.PhotoImage(file='pizzaE.png')
PasticcioImage = ImageTk.PhotoImage(file='pasticcioE.png')
photoImage = [TacosImage,PizzaImage,PasticcioImage]
x = IntVar()
for index in range(len(food)):
radiobutton = Radiobutton(window,
text=food[index],
variable=x,
value=index,
padx = 25,
font=("Impact",50),
image = photoImage[index],
compound = 'left',
command=order
)
radiobutton.pack(anchor=W)
window.mainloop()
terminal : name = self.photo.name
#AttributeError: 'PhotoImage' object has no attribute '_PhotoImagephoto'
´´´
some help
 serene scaffold
hidden ledge
´´´py from tkinter import *
from PIL import ImageTk
food = ["Tacos","Pizza",...
serene scaffold
hidden ledge
´´´py from tkinter import *
from PIL import ImageTk
food = ["Tacos","Pizza",...
This is a tkinter question. try #user-interfaces
 mint palm
in knap sack when we have to print the selected items,
like using following method:

so, in case there are 2 last items with same weight, which item is considered to be selected??
last or second last?
wooden sail
it shouldn't make a difference. you can choose whether stability (in the sorting sense) is important
mint palm
wooden sail
it shouldn't make a difference. you can choose whether stability (in the sorting...
i am using longest comman subsequence concept to find longest palindrome
i made it works, it was a hard one
mint palm
wooden sail
it shouldn't make a difference. you can choose whether stability (in the sorting...
if you imagine a word and then devide it in 2 parts then longest comman subsequence = palindrome
BUT
theres a catch, while deviding if last elements of string are part of palindrome: YOU DONT ADD 1
and if they are not part of it YOU ADD 1
example
bob is palindrome of length 3 and not 2
so while deviding odd length integer this anomaly comes
so you have to effectively know if you choose last elements or no
SECOND anomaly:
last of strings are same, STILL not part of palindrome
example:
BEOAOOEB
here you can devide like this (not optimal but one scenario in DP)
BEOOO
BEO (reverse of rest)
though O O are last but is not part of palindrome as algo counts bold O as part of palindrome
SO THERE IS A NEED TO DIFFERENTIATE btw different O
this is the code
#include <string.h>
#include <iostream>
int arr[1001][1001] = {0};
int solve(string s) {
    string temp = s;
    reverse(temp.begin(), temp.end());
    if (s.size()<2) return s.size();
    int mx{0};
    for(int k{1}; k<s.size(); ++k){
        string a = s.substr(0, k);
        string b = temp.substr(0, temp.size()-k);
        for (int i=k-1; i< a.size(); ++i){
            for (int j=0; j< b.size(); ++j){
                a[i]== b[j]? (arr[i+1][j+1]=arr[i][j]+1 ): (arr[i+1][j+1] = max(arr[i][j+1], arr[i+1][j]));
            }
        }
        // cout<<arr[a.size()][b.size()]<<" ";
        arr[a.size()][b.size()]==arr[a.size()-1][b.size()]? (mx = max(mx, (2*arr[a.size()][b.size()])+1)):(mx = max(mx, 2*arr[a.size()][b.size()]));
    }
    return mx;
}
Btw sorry i thought this is data-structure
mint palm
C++
 wild urchin
Hello Guys, can anyone give me direction on how to go on about this problem. basically i have a 3d image which i have cropped using masking. (a mask is just a boolean version of an image), i am now trying to get the thickness of this segmented 3d mask but cant seem to find anything useful regarding this task in sklearn documentation
all the input data ( 3d image and the 3d mask ) are in numpy array form

an example of a slice of the mask
wild urchin
By thickness here i mean the orthogonal distance of one boundary point on the mask to the last point of said orthogonal vector within the mask
steady basalt
mint palm
C++
This is the python discord
mild dirge
wild urchin
By thickness here i mean the orthogonal distance of one boundary point on the ma...
distance of the vector inside the mask orthogonal to the slice or?
Or just the longest vector you can draw through your 3d object
mild dirge
You want to use machine learning for this? Isn't there some easier way?
wild urchin
The problem is there are few gaps in the mask so
wild urchin
mild dirge
You want to use machine learning for this? Isn't there some easier way?
Yea, I just thought this was the most appropriate channel as image processing is kinda a Ds/ML sub branch
mild dirge
Yeah but you specifically mention sklearn, which is basically mainly ml
But if you think that is the best way, it is a regression task, so you want to make a regression model
And maybe use convolutions, so 3d convolution layers?
Not sure tbh
wild urchin
mild dirge
And maybe use convolutions, so 3d convolution layers?
Regression I get but can you expand on how convolution will help with this
mild dirge
Well that is just a very basic building block for models concerned with image data
And since your data is 3d, you want a 3d convolution
wild urchin
Ok let me read the documentation for that. Thank you for the help.
mild dirge
But there's other models for image data too, can't name any of them at the top of my head rn though
wild urchin
mild dirge
But there's other models for image data too, can't name any of them at the top o...
Do you remember their libraries?
 mild dirge
wild urchin
Hello Guys, can anyone give me direction on how to go on about this problem. bas...
mild dirge
wild urchin
Hello Guys, can anyone give me direction on how to go on about this problem. bas...
Btw, what did you mean "cropped using masking" ?
You meant you made a mask from a 3d image using a threshold or?
rough mountain
I'm trying to generate one-hot encoded images. I was trying to use a gan, but that wasn't working beacuse the one hot encoding is discrete. Is there a better model I should use, or are there some good methods for generating discrete outputs from GANs?
mild dirge
rough mountain
I'm trying to generate one-hot encoded images. I was trying to use a gan, but th...
One hot encoded images?
Do you mean image classification?
rough mountain
mild dirge
One hot encoded images?
images where every pixel is a one hot encoded array
rough mountain
kind of similar, but no.
mild dirge
Every pixel classified into one of several categories is just semantic segmentation pretty sure
rough mountain
Think more of generating segmented images from the latent vec itself
mild dirge
hmm like that
Not sure, sorry
I'm not completely sure how a GAN works, but if you have N categories for the pixels, you could maybe make N separate GANs, each generating an image where the pixels are 0 or 1 based on whether they are part of the class
And then just take the max over the N images pixel-wise
But that is just a very raw idea out of thin air, sure somebody has done something similar before
rough mountain
"each generating an image where the pixels are 0 or 1" Surprisingly, that is also a discrete task that gans are bad at.
 misty flint
update:
i got my model to work in a serverless environment
it was a journey to hell and back
but i made it out alive


wild urchin
mild dirge
You meant you made a mask from a 3d image using a threshold or?
yup this
 brave sand
has anyone dealt with a results file as a json format?
misty flint
you can use the json module
take a look at this https://docs.python.org/3/library/json.html
brave sand
misty flint
you can use the `json` module
so I converted to an xlsx file to save time and effort.
https://docs.google.com/spreadsheets/d/1WqX-ek0J6aLUeetVVHDKwvxwSwGEBrB6RbQYNsLXPMg/edit#gid=855754221
looks like this so I have no clue how to graph it
 uncut solar
How would I resolve this?

when i download the txt file it opens it looks like this
Anyone who knows, let me know!
serene scaffold
uncut solar
How would I resolve this?
What's the context? Is this a data science question?
brave sand
serene scaffold
What's the context? Is this a data science question?
do you have any experience with decision trees?
serene scaffold
brave sand
do you have any experience with decision trees?
You should always ask your actual question. Not if someone knows about the topic of the question that you haven't asked
brave sand
serene scaffold
You should always ask your actual question. Not if someone knows about the topic...
my question is so broad that I can't even specify what i need help with lol
serene scaffold
brave sand
my question is so broad that I can't even specify what i need help with lol
Well, I can't read your mind.
brave sand
serene scaffold
Well, I can't read your mind.
alright sorry. how would I classify vulnerability in this dataset?
serene scaffold
brave sand
alright sorry. how would I classify vulnerability in this dataset?
I'd have to look at this tomorrow
brave sand
serene scaffold
I'd have to look at this tomorrow
any help would be appreciated
 quasi sparrow
Can anybody point me in the right direction?
I have experience training machine/deep learning models
But I want to start building my own pipelines and keep models running and training. Pretty getting my feet wet on MLOps
But I don't know what data to gather; Literally zero idea of where to begin
wooden sail
mint palm
if you imagine a word and then devide it in 2 parts then longest comman subseque...
oh sorry, i had misunderstood your question, i thought you were asking about knapsack. if all you want is to split a sequence into equal length parts, all you need is floor((n+1)/2), where n is the sequence length. i might still have misunderstood what you're saying though
brave sand
hey
so I've been struggling encoding my dataset
import pandas as pd
from sklearn.tree import DecisionTreeClassifier # Import Decision Tree Classifier
from sklearn.model_selection import train_test_split # Import train_test_split function
from sklearn import metrics #Import scikit-learn metrics module for accuracy calculation
from sklearn import preprocessing
from sklearn.feature_extraction.text import HashingVectorizer
from sklearn.preprocessing import LabelEncoder

df = pd.read_excel(r"C:\Users\moore\OneDrive\Documents\MARL Summer 2022\marl-data\Drug Seizures All HIDTAs All Drugs 2018-2021 Combined.xlsx")

feature_cols = ['Drug', 'Quantity']
corpus = df[feature_cols] # Features
vectorizer = HashingVectorizer(n_features=2**3)
X = vectorizer.fit_transform(corpus)

label_encoder = LabelEncoder()
df.County = label_encoder.fit_transform(df.County)
y = df.County # Labels

X_train, X_test, y_train, y_test = train_test_split(X, y, test_size=0.33, random_state=42)

clf = DecisionTreeClassifier(criterion="entropy", max_depth=3)

# Train Decision Tree Classifer
clf = clf.fit(X_train,y_train)

#Predict the response for test dataset
y_pred = clf.predict(X_test)

print("Accuracy:",metrics.accuracy_score(y_test, y_pred))
this is my code rn
wooden sail
wait up
brave sand
the shape of X is (2, 8)
wooden sail
for starters, what is vulnerability here? i have no knowledge of this domain
brave sand
wooden sail
for starters, what is vulnerability here? i have no knowledge of this domain
like which state/county is most vulnerable to drug trafficking
wooden sail
what do the columns mean then? how much of each drug was trafficked on each day?
brave sand
let me send the dataset
 signal lagoon
so let's say I have 300,000 numbers of differing quantities, from 1.0 to 400. I have 10 numbers of also differing quantities. how do I predict the next number using those two different number sets
brave sand
it'll be more clear
wooden sail
i was already looking at that
brave sand
oh ok
wooden sail
that's why i'm asking you
brave sand
it's state/county day of seizure/drug?
wooden sail
ok
brave sand
i get this error
Traceback (most recent call last): File "C:\Users\moore\OneDrive\Documents\MARL Summer 2022\marl-code\test.py", line 20, in <module> X_train, X_test, y_train, y_test = train_test_split(X, y, test_size=0.33, random_state=42) File "C:\Users\moore\anaconda3\envs\marl-env\lib\site-packages\sklearn\model_selection\_split.py", line 2430, in train_test_split arrays = indexable(*arrays) File "C:\Users\moore\anaconda3\envs\marl-env\lib\site-packages\sklearn\utils\validation.py", line 433, in indexable check_consistent_length(*result) File "C:\Users\moore\anaconda3\envs\marl-env\lib\site-packages\sklearn\utils\validation.py", line 387, in check_consistent_length raise ValueError( ValueError: Found input variables with inconsistent numbers of samples: [2, 438592]
maybe after encoding the shape changed?
wooden sail
after encoding, the drug column turns into an n-dimensional array, where n is the number of different drugs that appear in the whole column
that's equivalent to replacing one column with n new ones
brave sand
so what should I do to transform it back?
wooden sail
you don't, that's what you need
wooden sail
can you show the shapes of all of X, y, and X_train, X_test, y_train, y_test
brave sand
alright
lapis sequoia
They should really use ctypes for jinja2
brave sand
wooden sail
can you show the shapes of all of X, y, and X_train, X_test, y_train, y_test
how do I print those? they happen after the error line
wooden sail
so it happens on the line of the split?
brave sand
ik X and y are different shapes
wooden sail
can you show those
brave sand
X is (2, 8)
y is (438592,)
wooden sail
what's the shape of X before doing vectorizer.fit_transform
brave sand
(438592, 2)
wooden sail
ah, i'm pretty sure it's that you set the corpus wrong. you said the corpus was both columns, but it should be only the drug column
try corpus = df['Drug']
brave sand
yeah it worked
wooden sail
aight, do you get why?
brave sand
yeah I get it. also, is it normal for my accuracy to be 3% LMAO
Accuracy: 0.03279764536811851
wooden sail
well, let's see. what are you trying to do? the model looks like, based on the drugs input, you try to predict the quantity. this doesn't make sense
rather, you want to take drugs AND quantity as input, and tbh probably also the date of seizure, and use these to predict some OTHER thing
brave sand
wooden sail
rather, you want to take drugs AND quantity as input, and tbh probably also the ...
am I not taking drugs and quantity as an input?
brave sand
wooden sail
rather, you want to take drugs AND quantity as input, and tbh probably also the ...
isn't the other thing state/county? that's the label
wooden sail
sure, but then use that
that is nowhere in your code. you explicitly chose to use only the drug and quantity column
brave sand
feature_cols = ['Drug', 'Quantity']
so I change this line?
wooden sail
you have to have a LOT of stuff, but that's the first place, yes
first question is
what do you want to predict? and which quantities do you want to use as predictors?
brave sand
I'm trying to predict the state that is the most vulnerable
quantities would be drug, quantity, date
wooden sail
what does "the state that is most vulnerable" mean?
this quantity is nowhere in your data
brave sand
most amount of drugs and deaths?
brave sand
wooden sail
this quantity is nowhere in your data
i wanted to see if it'll work without it
wooden sail
if you want to train with supervised learning, you need the true quantities to train against
do you have the amount of drug and deaths?
the amount can be computed easily
do you have the deaths?
brave sand
nope, this is the only dataset I have
wooden sail
then you can't predict that
wooden sail
then this won't work
brave sand
what can I predict?
wooden sail
in supervised and self-supervised learning, you need to either already have the quantities to train against, or know how to compute/approximate them. you have neither
brave sand
wooden sail
in supervised and self-supervised learning, you need to either already have the ...
can't I have an input of drug, quantity, time to predict state/county?
wooden sail
you can, but you don't need deeplearning for that
that's like a cross-search in a database
you already have the data, why give up accuracy by trying to learn the keys of a database
brave sand
wooden sail
you already have the data, why give up accuracy by trying to learn the keys of a...
wdym?
wooden sail
i might be lacking creativity here because this isn't the kind of data i usually look at, but i can't think of anything useful to do with this alone if you want to do ML with it
mint palm
wooden sail
oh sorry, i had misunderstood your question, i thought you were asking about kna...
there can be unequal splits too
wooden sail
mint palm
there can be unequal splits too
sadly i still don't understand your wording. hopefully someone in the DSA channel could help you
brave sand
wooden sail
i might be lacking creativity here because this isn't the kind of data i usually...
yeah this dataset is too straightfoward. I do have another dataset but I'm not sure how to interpret it
https://docs.google.com/spreadsheets/d/1Cq-fVzf2wK41qg3cjZpLzi0ifLn24RCP/edit#gid=1807521170

Google Docs
Interdiction
UID,REF_LOC_X,REF_LOC_Y,DISTANCE,BEARING,ORIG_FID,FID_1,UID_1,CASE_NO,VESSEL_NAM,YEAR,MONTH,DAY,CITY_STATE,COUNTRY,VESSEL_TYP,FLAG_STATE,DRUG_TYPE1,DRUG_TYPE2,DRUG_WEI_1
1,8.37966100000,-83.28686000000,148.00000000000,225.00000000000,0,0,1,2,2001,10,20,Matapalo,Costa Rica,GF,CO,COCAINE
not sure what half those columns mean
wooden sail
well, ML is at the intersection knowing math and understanding the data. start by reading about it until you understand what it means 😛 otherwise you won't be able to do something useful with it
brave sand
wooden sail
well, ML is at the intersection knowing math and understanding the data. start b...
yeah alright, sounds good. could I use data from different datasets? or would it be not the same stuff
wooden sail
if the data sets correspond to each other in some way. the only way to know is for you to understand the two data sets 😛 that's something you figure out yourself
so, sometimes yes, other times no
 rigid nova
Hey.. I've just joined this server... So is AI better or Data Science??
steady basalt
rigid nova
Hey.. I've just joined this server... So is AI better or Data Science??
What do you think is the difference
 tawdry phoenix
rigid nova
Hey.. I've just joined this server... So is AI better or Data Science??
tawdry phoenix
rigid nova
Hey.. I've just joined this server... So is AI better or Data Science??
Data science and ai are coming togther
 small trail
Can I ask sth here
candid garnet
        for y in range(0, rows1 -1):
            normalised_amplitude_decibels[y,x] = 20*np.log10(amplitude[y,x]/amplitude[y,0])```

what's a nicer, non-nested for loop, way of doing this?(i didn't write this i've inherited it from someone else)
 uneven totem
oh ok
candid garnet
i'm on cleanup duty pretty much
uneven totem
candid garnet
i'm on cleanup duty pretty much
?
uneven totem
candid garnet
i'm on cleanup duty pretty much
no one asked
small trail
how can I use interpolate() for filling that 0 values related to time
 uneven totem
small trail
how can I use interpolate() for filling that 0 values related to time
uneven totem
small trail
how can I use interpolate() for filling that 0 values related to time
i cant read which language is that??
small trail
python
small trail
Turkish
candid garnet
<@&831776746206265384> got a bit of griefing going on here from wumpus
uneven totem
wdym?
uneven totem
candid garnet
<@&831776746206265384> got a bit of griefing going on here from wumpus
?
what?
candid garnet
the turkish language isn't related to their question at all
uneven totem
okok
small trail
candid garnet
the turkish language isn't related to their question at all
exactly
candid garnet
uneven totem
no one asked
also this doesn't help anyone
uneven totem
i will sort out the problem and dm it to @small trail
uneven totem
candid garnet
also this doesn't help anyone
sory..
 heavy crow
I have a black box that I can ask questions and get the result back from. I now want to train a neural network to estimate this Black box.
But I have no way of generating a "uniform" distribution of questions
If I just ask it random questions it over fits
Does anyone have ideas how to solve this?
Some kind of confidence or exploration based learning?
This Black box is also very slow so I can't just ask it billions of questions and resample later
serene scaffold
heavy crow
I have a black box that I can ask questions and get the result back from. I now ...
neural networks require a lot of inputs in order to work (but not billions). what is this black box, anyway?
heavy crow
So the black box tells me the perceived distance between two color palettes
But the problem is that if I just generate 1 million distances from random palettes i get a uniform distribution
Very few with a distance of 0 or 1 and a lot in the middle
So when training it is prone to overfitting on the center
We are talking only one sample with a distance over 0.95 and 15 million im the 0.3-0.6 area
 ripe forge
that sounds like a losing battle to begin with
wooden sail
this is a fairly standard probability question though https://www.youtube.com/watch?v=AvpbYzGS0dM&ab_channel=AnaTudor (the formula is given toward the end, this is a random video i found by searching for uniform distribution of distances o a disc)
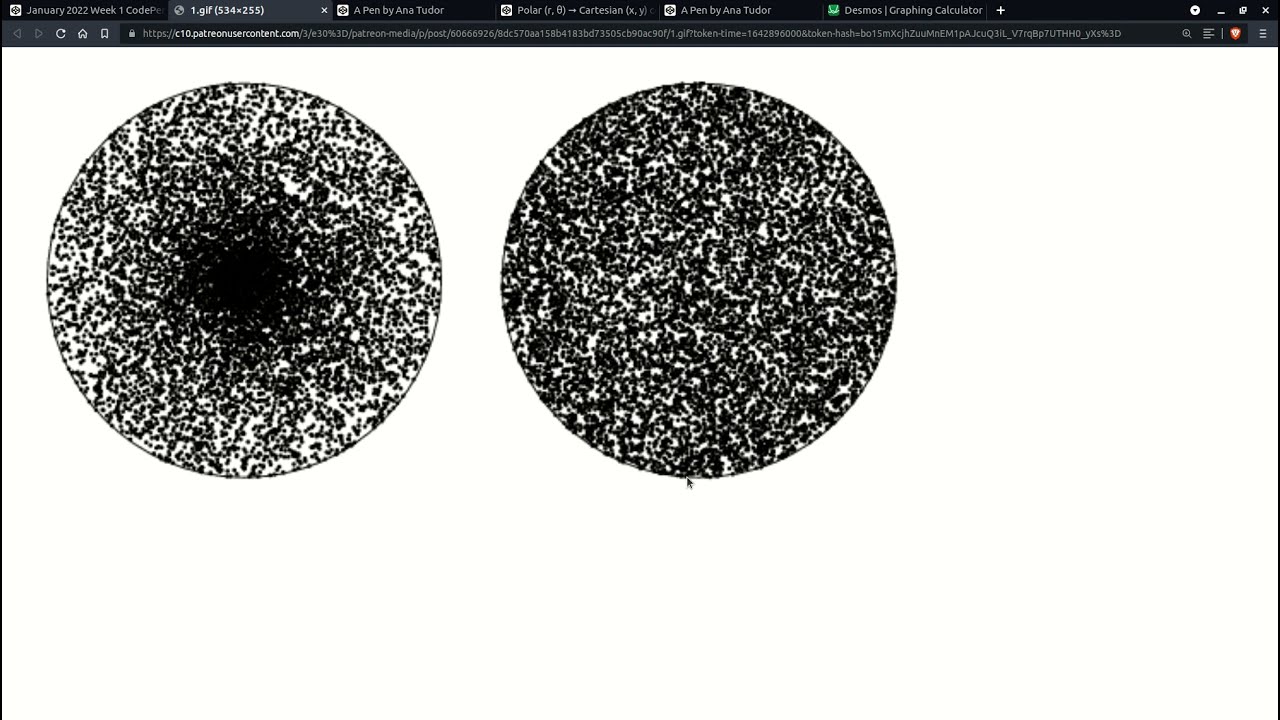
Live demos:
a) line segment, circle & rectangle random distributions https://codepen.io/thebabydino/pen/NWazdyL
b) random uniform disc distribution: incorrect vs. correct https://codepen.io/thebabydino/pen/ExwRZQj
If the work I've been putting out since early 2012 has helped you in any way or you just like it, please consider supporting it to h...
serene scaffold
heavy crow
Very few with a distance of 0 or 1 and a lot in the middle
can you do some kind of transformation so that the middle is "larger"?
wooden sail
on the other hand, the function computing the distance is deterministic. is it black box because you truly can't observe it, or because you don't want to read the documentation of something?
heavy crow
No it is not a black box, i wrote it. It's just a black box in the regard I can't just invert it and ask for examples with a distance of X
ripe forge
so its a white box then. you have the algo that calculates distance
what's your goal with training said neural network?
heavy crow
Ah yes. A white box
ripe forge
to put it differnetly, if you already like your own algo, any model would be just a poor approximation of "the real thing". and a neural network even more so
wooden sail
what you should do is compute the unit ball for your distance metric and characterize it geometrically. that makes more sense than just throwing ML at it
heavy crow
So the neural network should embed the color palette into a N dimensional space that preserves the distance function i wrote. That way I can perform nearest neighbor search on the embeddings
The problem is that i only have a distance function. Whenever I want "similar" palettes i can't compare with all palettes in my DB
So my solution is to embed them in nD space and then query that
ripe forge
okay, so frame challenge: the real question is this: given a new colour, you want the ability to quickly get it's similar palettes, but the distance calculation is slow. am i understanding right?
heavy crow
The distance calulation is too slow to perform a O(n) search against all other palettes
But yes. Each palette is made of 4 colors. Each color of 3 values
One major point is that the distance function ignores the order of the colors in the palette
ripe forge
okay, what does similar mean in this context
heavy crow
This is also what makes it so slow. I check each combination of colors.
I should probably write a description with pictures of the problem...
ripe forge
because technically, somthing similar to a palette could just be autogenerated instead of calculating distances from existing palettes, if similar simply meant "change the colour slightly, and done"
yeah that could be nice
im envisioning you're essentially trying to mimic some kind of recommendation system, more so than anything
that's what im getting here atleast
heavy crow
Yes kinda
wooden sail
sounds like a wasserstein-like metric
heavy crow
You upload a picture and it shows you similar pictures
by the colors (palette) in the picture
wooden sail
can you show your function that computes the distance?
heavy crow
Sure, one sec
ripe forge
and your set of palettes is essentially fixed? you have a finite group of palettes? if so, how many
heavy crow
What do you mean by that?
ripe forge
given a new picture, you mentioned you compare against "something" to bring back similar pictures
well..what does this "something" involve. is it a finite or fixed set of images?
heavy crow
Yes pictures previously uploaded. I am using redis vector similarity for that
Finite ~1 million
heavy crow
wooden sail
can you show your function that computes the distance?
I only have the cuda code, i hope that's fine
wooden sail
i would grab onto something like "images are usually sparse in some domain" and the johnson lindenstrauss lemma to use a random matrix for the embeddings, that should work with high probability. and yeah i guess, i'll see if i understand anything
heavy crow
Not sure why it's not a link..
So I would move away from the image part a bit, it's really just palettes
So 4 unordered colors
 sand osprey
hii
i m having some issues related to cuda
i have setup the enviromenet for object detection and when i try to train it returns me an error
wooden sail
heavy crow
pastebin.com/Xc1BdRwy
this doesn't look so computationally intensive, but lemme see if i got it right. the colors can be in any order, but for each color, the 3 values are always in the correct order?
so for palettes of 4 colors, you keep the smallest of 24 distances that are the sum of squared differences between the colors of the palettes
heavy crow
Yup, exactly
wooden sail
this might actually be slower on gpu than cpu
heavy crow
For 5 colors it's already 120
wooden sail
certainly. how large do you expect your palettes to be
heavy crow
It's just on the GPU because I was generating a couple million at once
4 is a fine starting value
wooden sail
that's fair enough
heavy crow
But the problem is I can't calculate the distance to N other palettes each time I upload a image
That's why I embed them into a 16 dimensional space
wooden sail
ok, so images still means palettes. yeah, that's fair
so, this problem sounds to me like a "linear assignment problem"
rather than all combinations, there's the hungarian and the jonker-volgenant algorithms that could compute the distance more quickly
not what you had asked for, but it's a nice place to start i think
heavy crow
But again when I have 2 million other palettes i can't afford to compute the distance
I was thinking of maybe using some kind of gradient following to find pairs of palettes with a certain distance from each other
Small changes in color shouldn't make a huge difference in distance
wooden sail
that's not necessarily the case due to the min() you apply
heavy crow
It would be great if the neural network could "suggest" pairs that it feels uncertain about
I will create a more visual explanation of the problem tomorrow
wooden sail
i already got the gist of it, just trying to think if there's a clever way of approaching it
heavy crow
I can create 67 million examples in around 5 seconds on the GPU
But that's already 6.3Gb of data
And resampling the data starts taking a while then
wooden sail
by generate examples you don't mean compute the distances, but rather make random images, yeah?
heavy crow
Generate random palettes and compute their distance on the gpu
But that's the max amount i can generate at once because I run out of GPU memory them
wooden sail
and what slows you down is rather getting the palette from the images? or?
heavy crow
I don't have a GPU in production
wooden sail
aha
heavy crow
Only now for generating trainingdata
wooden sail
i see
heavy crow
Yeah just a weak CPU with low ram later
Redis handles this great and I can query fast enough
But when generating i get a gaussian distribution of distances not a uniform one :(
wooden sail
the most straightforward approach for that without dealing with the nasty min in your function is to keep track of the histogram as you generate the examples and discard ones that would not make the histogram more uniform
i don't think you can analytically generate a uniform distribution for this
heavy crow
Hehe
I just stared trying to implement that on the GPU, but it wasn't going to great so I asked here ;)
wooden sail
on the other hand, i would also comment that this type of recommender system usually does not run on the client's hardware, but sends requests to a remote server that handles the computation
or it keeps a pre cached database
so hopefully the model you end up with can be run fast enough on that slow computer you mentioned, even if it is pretrained
heavy crow
Yeah i get around 500 embeddings/s on the cpu
And luckily embedding (when a user uploads) can happen async. Just the queries have to be fast. Redis handles that though
Getting 100 "similar" images takes only a few ms
wooden sail
i don't think getting much more than a couple thousand in under a second is going to be realistic, but good luck
heavy crow
No that's perfectly fine
I use pagination anyways displaying 20 images at a time
Just need to get the model accuracy up a bit
wooden sail
all righty then. yeah, try this sample dropping before feeding to the network, that should be the most straightforward way
heavy crow
Thanks for the help!
wooden sail
you should also consider the jonker-volgenant alg i mentioned for larger palettes though
your algorithm scales as n!, that algorithm scales as n^3
heavy crow
Ah nice, thanks!
 earnest herald
Hey guys is anyone familiar with data wrangling?
 desert tusk
earnest herald
Hey guys is anyone familiar with data wrangling?
desert tusk
earnest herald
Hey guys is anyone familiar with data wrangling?
Somewhat. What are you trying to do?
earnest herald
desert tusk
Somewhat. What are you trying to do?
Do you know somebody who’s a bit familiar with data wrangling? I’m looking to hire somebody for 30 minutes to help me with these questions
serene scaffold
earnest herald
Do you know somebody who’s a bit familiar with data wrangling? I’m looking to hi...
!rule 9
serene scaffold
earnest herald
Didn’t know about this
the rules were presented on your screen when you joined the server, and you had to push a button to accept them. you might want to take another look.
earnest herald
I didn’t bother, should have
serene scaffold
That said, you can still ask your data wrangling questions.
anyway, @earnest herald, "data wrangling" is a bit of a buzzword. it's just taking data and putting it into a format that is usable for what you want to do.
candid garnet
candid garnet
``` for x in range(0, cols1 - 1):
for y in range(0, rows1 -1):
...
still struggling with this, is there a nice way of doing this without a nested for loop?
serene scaffold
candid garnet
``` for x in range(0, cols1 - 1):
for y in range(0, rows1 -1):
...
what are the types of each variable here, and for the ones that are arrays, what are their shapes?
wooden sail
assuming these are numpy arrays, you can broadcast the whole operation in one line without loops
candid garnet
    print(amplitude.shape)
    rows1 = amplitude.shape[0]
    cols1 = amplitude.shape[1]

    normalised_amplitude_decibels = np.zeros((rows1,cols1))

    for x in range(0, cols1 - 1):
        for y in range(0, rows1 -1):
            normalised_amplitude_decibels[y,x] = 20*np.log10(amplitude[y,x]/amplitude[y,0])

    return normalised_amplitude_decibels```
amplitude has the shape (5001, 160)yeah I think i'm getting broadcasting wrong when i do it myself
indexing of np arrays always confuses me
earnest herald
Hey guys any good resources/websites to practice data wrangling?
earnest herald
serene scaffold
anyway, <@605197056621019171>, "data wrangling" is a bit of a buzzword. it's jus...
Any resources which you would recommend to learn more about it? I do have to experience with it
serene scaffold
normalised_amplitude_decibels = 20 * np.log10(amplitude / amplitude[:, 0])
I think?
wooden sail
normalised_amplitude_decibels = 20*np.log10(amplitude/amplitude[:,0].reshape(-1,1))
not really. it's sort of an ad-hoc thing.
candid garnet
ValueError: operands could not be broadcast together with shapes (5001,160) (5001,)
wooden sail
you do need to add an extra dimension to get the broadcasting going nicely
candid garnet
wooden sail
```py
normalised_amplitude_decibels = 20*np.log10(amplitude/amplitude[:,0].resha...
trying this one sec
wooden sail
either with reshape or with [:,np.newaxis] or something of the like
serene scaffold
candid garnet
ValueError: operands could not be broadcast together with shapes (5001,160) (500...
yeah, Edd's solution fixes that with the reshape part
candid garnet
it works ❤️ thanks so much
any good resources for really understanding reshaping/ different dimensions of arrays? has been confusing the life out of me
wooden sail
candid garnet
any good resources for really understanding reshaping/ different dimensions of a...
it might be the case that [:,np.newaxis] is faster, play around with it and see. as for this, my only recommendation is studying linear algebra and einstein notation 😛
these are special cases of "elementwise" or "hadamard" products
serene scaffold
candid garnet
any good resources for really understanding reshaping/ different dimensions of a...
I just skimmed this, and it looks like it covers what you need to know https://towardsdatascience.com/reshaping-numpy-arrays-in-python-a-step-by-step-pictorial-tutorial-aed5f471cf0b

Medium
This tutorial and cheatsheet provide visualizations to help you understand how numpy reshapes arrays.
serene scaffold
candid garnet
ValueError: operands could not be broadcast together with shapes (5001,160) (500...
the trick is that when you have (5001, 160) and (5001, 1), it "repeats" (ie broadcasts) that column 160 times, so everything matches up.
wooden sail
there are extensive broadcasting examples in the numpy docs too https://numpy.org/doc/stable/user/basics.broadcasting.html
serene scaffold
earnest herald
Any resources which you would recommend to learn more about it? I do have to exp...
what are you trying to wrangle, exactly? it requires an understanding of what data you have, what format its in, and what format you need it to be in.
mild dirge
serene scaffold
I just skimmed this, and it looks like it covers what you need to know https://t...
I think this could give a solution, but it doesn't really show how to do it with broadcasting
small trail
is there anybody knows making prediction with time series
mild dirge
You would need to use stack or something, which seems worse than broadcasting
mild dirge
wooden sail
```py
normalised_amplitude_decibels = 20*np.log10(amplitude/amplitude[:,0].resha...
Are you sure this gives the correct answer?
wooden sail
mild dirge
I think this could give *a* solution, but it doesn't really show how to do it wi...
this is why i recommended the math instead. reshaping and broadcasting are ways to exploit what is really going on: the underlying vector spaces are isomorphic and the shape doesn't matter
wooden sail
mild dirge
Are you sure this gives the correct answer?
what's your concern about it?
mild dirge
Ehh lemme confirm first
wooden sail
i'm also asking earnestly, not in a douchey way 😛 do let me know if i made a mistake, i just don't see it off the top of my head
serene scaffold
small trail
how can I use interpolate() for filling that 0 values related to time
what question do you have about interpolate?
!docs pandas.DataFrame.interpolate
 arctic wedgeBOT
DataFrame.interpolate(method='linear', axis=0, limit=None, inplace=False, limit_direction=None, limit_area=None, downcast=None, **kwargs)```
Fill NaN values using an interpolation method.

Please note that only `method='linear'` is supported for DataFrame/Series with a MultiIndex.ah nvm
small trail
serene scaffold
what question do you have about interpolate?
I've done that but I need to create a model that predicts 1 year future
mild dirge
I thought it would apply division over a different axis
I had it like res = 20 * np.log10(amplitude / amplitude[:, 0][:, np.newaxis])
wooden sail
mild dirge
I thought it would apply division over a different axis
that should be equivalent
mild dirge
Yeah it is
wooden sail
what you SHOULD test is if it is faster (i think np.newaxis slicing is faster)
serene scaffold
tfw np.newaxis instead of None
brave sand
does anyone know what ref_loc_y means?
serene scaffold
brave sand
does anyone know what ref_loc_y means?
not without seeing the context
brave sand
serene scaffold
not without seeing the context
Google Docs
Interdiction
UID,REF_LOC_X,REF_LOC_Y,DISTANCE,BEARING,ORIG_FID,FID_1,UID_1,CASE_NO,VESSEL_NAM,YEAR,MONTH,DAY,CITY_STATE,COUNTRY,VESSEL_TYP,FLAG_STATE,DRUG_TYPE1,DRUG_TYPE2,DRUG_WEI_1
1,8.37966100000,-83.28686000000,148.00000000000,225.00000000000,0,0,1,2,2001,10,20,Matapalo,Costa Rica,GF,CO,COCAINE
mild dirge
wooden sail
what you SHOULD test is if it is faster (i think np.newaxis slicing is faster)
My problem was that I thought .reshape(1, -1) made a column vector, but it should have been .reshape(-1, 1) so that's why I got diff results
serene scaffold
brave sand
https://docs.google.com/spreadsheets/d/1Cq-fVzf2wK41qg3cjZpLzi0ifLn24RCP/edit#gi...
it probably means "reference location y". like a y coordiante. just a guess.
wooden sail
mild dirge
My problem was that I thought .reshape(1, -1) made a column vector, but it shoul...
ah i see what you mean. yeah the -1 there tells numpy to automatically infer the size
In [23]: import numpy as np

In [24]: import timeit

In [25]: M = np.random.rand(10000,25000)

In [26]: x = np.random.rand(25000)

In [27]: %%timeit
    ...: M/x[np.newaxis,:]
    ...:
    ...:
375 ms ± 74.6 ms per loop (mean ± std. dev. of 7 runs, 1 loop each)

In [28]: %%timeit
    ...: M/x.reshape(1,-1)
    ...:
    ...:
536 ms ± 169 ms per loop (mean ± std. dev. of 7 runs, 1 loop each)
normally yes, but if you have a multidimensional array and specify an order different from the usual, it does take some time
esp if you have it infer the size itself
those operations require a small optimization problem to be solved. that's the bottleneck in einsum as well
wooden sail
then it should be nice and fast
In [29]: %%timeit
    ...: M/x.reshape(1,25000)
    ...:
    ...:
344 ms ± 4.12 ms per loop (mean ± std. dev. of 7 runs, 1 loop each)
Huh, even faster lol
wooden sail
that's probably due to random stuff in the background, curse the scheduler
In [30]: %%timeit
    ...: M/x[np.newaxis,:]
    ...:
    ...:
345 ms ± 6.81 ms per loop (mean ± std. dev. of 7 runs, 1 loop each)

In [31]: %%timeit
    ...: M/x.reshape(1,25000)
    ...:
    ...:
469 ms ± 151 ms per loop (mean ± std. dev. of 7 runs, 1 loop each)
don't trust my computer too much ig
mild dirge
hmm alright haha
brave sand
ValueError: np.nan is an invalid document, expected byte or unicode string.
what does this error mean?
wooden sail
can you show the code where that error occurs
brave sand
import pandas as pd
from sklearn.tree import DecisionTreeClassifier # Import Decision Tree Classifier
from sklearn.model_selection import train_test_split # Import train_test_split function
from sklearn import metrics #Import scikit-learn metrics module for accuracy calculation
from sklearn import preprocessing
from sklearn.feature_extraction.text import HashingVectorizer
from sklearn.preprocessing import LabelEncoder

df = pd.read_excel(r"C:\Users\moore\OneDrive\Documents\MARL Summer 2022\marl-data\Interdiction.xlsx")

feature_cols = df['DRUG_TYPE1'] #Features

vectorizer = HashingVectorizer(n_features=2**3)
X = vectorizer.fit_transform(feature_cols)

label_encoder = LabelEncoder()
df.COUNTRY = label_encoder.fit_transform(df.COUNTRY)
y = df.COUNTRY # Labels

X_train, X_test, y_train, y_test = train_test_split(X, y, test_size=0.33, random_state=42)

clf = DecisionTreeClassifier(criterion="gini", max_depth=3)

# Train Decision Tree Classifer
clf = clf.fit(X_train,y_train)

#Predict the response for test dataset
y_pred = clf.predict(X_test)

print("Accuracy:",metrics.accuracy_score(y_test, y_pred))
Traceback (most recent call last): File "C:\Users\moore\OneDrive\Documents\MARL Summer 2022\marl-code\test2.py", line 14, in <module> X = vectorizer.fit_transform(feature_cols) File "C:\Users\moore\anaconda3\envs\marl-env\lib\site-packages\sklearn\feature_extraction\text.py", line 870, in fit_transform return self.fit(X, y).transform(X) File "C:\Users\moore\anaconda3\envs\marl-env\lib\site-packages\sklearn\feature_extraction\text.py", line 845, in transform X = self._get_hasher().transform(analyzer(doc) for doc in X) File "C:\Users\moore\anaconda3\envs\marl-env\lib\site-packages\sklearn\feature_extraction\_hash.py", line 160, in transform indices, indptr, values = _hashing_transform( File "sklearn\feature_extraction\_hashing_fast.pyx", line 43, in sklearn.feature_extraction._hashing_fast.transform File "C:\Users\moore\anaconda3\envs\marl-env\lib\site-packages\sklearn\feature_extraction\_hash.py", line 159, in <genexpr> raw_X = (((f, 1) for f in x) for x in raw_X) File "C:\Users\moore\anaconda3\envs\marl-env\lib\site-packages\sklearn\feature_extraction\text.py", line 845, in <genexpr> X = self._get_hasher().transform(analyzer(doc) for doc in X) File "C:\Users\moore\anaconda3\envs\marl-env\lib\site-packages\sklearn\feature_extraction\text.py", line 106, in _analyze doc = decoder(doc) File "C:\Users\moore\anaconda3\envs\marl-env\lib\site-packages\sklearn\feature_extraction\text.py", line 234, in decode raise ValueError( ValueError: np.nan is an invalid document, expected byte or unicode string.
wooden sail
that's a weird error message. at any rate, it's saying what you passed as parameter X has an np.nan inside, and this cannot be tokenized. idk why it calls the elements of the array/series/whatever "documents"
brave sand
so I tried to convert to a str and I got the same error tho
why would a list of drug types have a nan inside
wooden sail
ofc, you can't turn a nan into a string
the data set has missing entries or something of the sort. you have to deal with that first. i'm not very savvy on the techniques, maybe someone else can recommend something for you to try
brave sand
I thought it was missing entries too, but for that column it's all filled
wooden sail
you could set up a toy function that goes through the rows and tries to turn the corresponding entry in that column to a string in a try catch. where you get an exception, print the row. then we'll be able to see what's going on
small trail
Which model should I use to predict the values for 2022.
 brave sand
wooden sail
you could set up a toy function that goes through the rows and tries to turn the...
brave sand
wooden sail
you could set up a toy function that goes through the rows and tries to turn the...
could symbols such as / be the cause?
wooden sail
brave sand
could symbols such as `/` be the cause?
probably not. it's really likely that the dataset has missing entries, and these are NaNs in the dataframe, as i said before
try what i told you and see what the source of the error is
brave sand
wooden sail
try what i told you and see what the source of the error is
ok this is super weird
I went through the data frame to check for NaN
and it said true
I printed out where it was and it said None
wooden sail
show what you did
brave sand
alright
brave sand
wooden sail
show what you did
import pandas as pd
import seaborn as sns
import matplotlib.pyplot as plt

df = pd.read_excel(r"C:\Users\moore\OneDrive\Documents\MARL Summer 2022\marl-data\Interdiction.xlsx")

check_for_nan = df['DRUGTYPE_1'].isnull().values.any()
print (check_for_nan)```this printed True
import pandas as pd
import seaborn as sns
import matplotlib.pyplot as plt

df = pd.read_excel(r"C:\Users\moore\OneDrive\Documents\MARL Summer 2022\marl-data\Interdiction.xlsx")

check_for_nan = df['DRUG_TYPE1'].isnull()
print(check_for_nan)
this printed
0 False 1 False 2 False 3 False 4 False ... 1531 False 1532 False 1533 False 1534 False 1535 False Name: DRUG_TYPE1, Length: 1536, dtype: bool
wooden sail
you realize that is only showing you 10 entries, right? print out the sum of check_for_nan
brave sand
wooden sail
you realize that is only showing you 10 entries, right? print out the sum of che...
import pandas as pd
import seaborn as sns
import matplotlib.pyplot as plt

df = pd.read_excel(r"C:\Users\moore\OneDrive\Documents\MARL Summer 2022\marl-data\Interdiction.xlsx")

check_for_nan = df['DRUG_TYPE1'].isnull()
print(sum(check_for_nan))
this gets me 23
wooden sail
there are 23 nans then
brave sand
alright got it
too big to paste here though
so I have these 23 rows
do I just delete them from the dataset?
wooden sail
that's fine. now you know where the nans are. i can't help you with what to do with them. those should be rows btw, not columns
brave sand
sorry rows
wooden sail
it's up to you whether to delete or replace or interpolate. the other peeps will help you out
steady basalt
If other columns have info I’d say keep
brave sand
steady basalt
If other columns have info I’d say keep
why?
 steep cypress
What are the reasons that may cause my validation accuracy to be more than training accuracy? Even my validation loss is less than train loss. I'm training a CNN with simple layers.
~26k images with 0.2 validation split.
- Early stopping with patience = 5 ... stopped at 18/30 epochs
- Using CosineAnnealingLR scheduler but even with other schedulers, its the same situation.
- Initial LR: 5e-3
Currently:
Train Loss: 1.0561530590057373 | Train Accuracy: 0.6371102333068848
Val Loss: 0.853873610496521 | Val Accuracy: 0.710657000541687
I can share the kaggle notebook if anyone wants to check it out
serene scaffold
Can you describe what the difference is between deep learning and not deep learning?
@charred egret deep learning is when you have a neural network with a lot of layers. I'm not familiar with a non-arbitrary threshold for when a given neural network is "deep"
So, any machine learning that you think is cool, and which isn't that.
Regression based learning isn't deep learning. At least not in itself
(but deep neural networks involve lots of regression)
No problem 
 cyan kelp
Anyone have any luck getting tensorflow to run on a Mac M1 chip? The kernel dies every time I try to do anything and I've tried every guide I can find.
 gleaming osprey
Hey! I am trying to classify facial expressions using the fer2013 dataset(This is the exact one: https://www.kaggle.com/datasets/ahmedmoorsy/facial-expression, however, this one https://www.kaggle.com/datasets/msambare/fer2013 has the same data arranged differently and is more documented.)
This is the model I am using to classify the emotions: ```py
model = Sequential()
model.add(Conv2D(8, 3, padding='same', input_shape=(48, 48, 1), activation='relu'))
model.add(Dropout(0.2))
model.add(MaxPooling2D(2))
model.add(Conv2D(16, 5, padding='same', activation='relu', kernel_regularizer=keras.regularizers.l2(l=0.01)))
model.add(Dropout(0.25))
model.add(MaxPooling2D(2))
model.add(Flatten())
model.add(Dense(512, activation='relu', kernel_regularizer=keras.regularizers.l2(l=0.001)))
model.add(Dropout(0.5))
model.add(Dense(256, activation='relu', kernel_regularizer=keras.regularizers.l2(l=0.001)))
model.add(Dropout(0.3))
model.add(Dense(128, activation='relu', kernel_regularizer=keras.regularizers.l2(l=0.01)))
model.add(Dropout(0.2))
model.add(Dense(7, activation='softmax'))
model.compile(
loss = "categorical_crossentropy",
optimizer = keras.optimizers.Adam(learning_rate=0.001),
metrics = ['accuracy']
)
run = model.fit(
x_train,
y_train,
batch_size= 128,
epoch= 50,
callbacks=[model_checkpoint_callback],
validation_data= (x_val, y_val)
)
My problem is that **My model validation accuracy is stuck at 59% while my training accuracy jumps to 96%**

***My Inputs***
A normalized (0 - 1) 48x48 2D ndarray as with values seen in the link above. No data augmentation.
*Note: there are very few `disgust` samples compared to the rest of the classes, which seems to be an issue*

***My Outputs***
My output is a 1D tensor of shape (7, ) such as [0, 0, 0, 1, 0, 0, 0] where the index represents the class the model has predicted with 1 as 100% and 0 as 0%

I am most interested in the ***`happy`, `sad`, `disgust` and `anger` classes

Thanks!(Sorry for the long message, I wanted to put all the information in one message)
 hollow sentinel
import pandas as pd
import seaborn as sns

df = pd.read_html("https://www.espn.com/soccer/team/stats/_/id/86/league/ESP.1/season/2021/view/scoring")

#print(df[0])

print(df[0].head())

print(df[0].columns)

sns.countplot(x = "G", data= df)
plt.show()
    RK             Name   P   G
0  1.0    Karim Benzema  32  27
1  2.0  Vinícius Júnior  35  17
2  3.0    Marco Asensio  31  10
3  4.0          Rodrygo  33   4
4  5.0    Lucas Vázquez  29   3
Index(['RK', 'Name', 'P', 'G'], dtype='object')
Traceback (most recent call last):
  File "/Users//Desktop/real madrid goals project/real_madrid.py", line 12, in <module>
    sns.countplot(x = "G", data= df)
  File "/Users//Library/Python/3.7/lib/python/site-packages/seaborn/_decorators.py", line 46, in inner_f
    return f(**kwargs)
  File "/Users//Library/Python/3.7/lib/python/site-packages/seaborn/categorical.py", line 3602, in countplot
    errcolor, errwidth, capsize, dodge
  File "/Users//Library/Python/3.7/lib/python/site-packages/seaborn/categorical.py", line 1585, in __init__
    order, hue_order, units)
  File "/Users//Library/Python/3.7/lib/python/site-packages/seaborn/categorical.py", line 144, in establish_variables
    x = data.get(x, x)
AttributeError: 'list' object has no attribute 'get'
im pretty sure instead of x = "G", you need x = df.G?
hollow sentinel
import pandas as pd
import seaborn as sns

df = pd.read_html("https://www.espn.com/soccer/team/stats/_/id/86/league/ESP.1/season/2021/view/scoring")

#print(df[0])

print(df[0].head())

print(df[0].columns)

sns.countplot(x = df["G"], data= df)
plt.show()
    RK             Name   P   G
0  1.0    Karim Benzema  32  27
1  2.0  Vinícius Júnior  35  17
2  3.0    Marco Asensio  31  10
3  4.0          Rodrygo  33   4
4  5.0    Lucas Vázquez  29   3
Index(['RK', 'Name', 'P', 'G'], dtype='object')
Traceback (most recent call last):
  File "/Users//Desktop/real madrid goals project/real_madrid.py", line 12, in <module>
    sns.countplot(x = df["G"], data= df)
TypeError: list indices must be integers or slices, not str
Anything above 1 layer is deep. It's essentially when you form non linear relations.
serene scaffold
hollow sentinel
```python
RK Name P G
0 1.0 Karim Benzema 32 27
1 2.0...
do you understand what the error message is telling you?
||once you understand what it means, look up the return type of pd.read_html||
hollow sentinel
indexes are numbers but here i used a string as an index
serene scaffold
hollow sentinel
indexes are numbers but here i used a string as an index
where are you using a str as an index?
or otherwise as a key for looking something up?
hollow sentinel
x= df["G"]
serene scaffold
so what does list indices must be integers or slices, not str tell you about df
serene scaffold
ripe forge
Anything above 1 layer is deep. It's essentially when you form non linear relati...
shows what I know 
hollow sentinel
pd.read_html returns a list of dataframes
serene scaffold
do you see the problem now?
hollow sentinel
it's not the correct type?
import pandas as pd
import seaborn as sns

df = pd.read_html("https://www.espn.com/soccer/team/stats/_/id/86/league/ESP.1/season/2021/view/scoring")

#print(df[0])

#print(type(df[0]))

print(df[0].columns)

sns.countplot(x = df[0]["G"], data= df[0])
plt.show()
this code is different from the one in your error message
you get an error with sns.countplot(x = df["G"], data= df)
and in sns.countplot(x = df["G"], data= df) df is still a list of dataframes.
hollow sentinel
ok so i have a plot but it's not the plot i actually wanted
      RK               Name   P   G
0    1.0      Karim Benzema  32  27
1    2.0    Vinícius Júnior  35  17
2    3.0      Marco Asensio  31  10
3    4.0            Rodrygo  33   4
4    5.0      Lucas Vázquez  29   3
5    NaN              Nacho  28   3
6    7.0        David Alaba  30   2
7    NaN        Luka Modric  28   2
8    NaN  Eduardo Camavinga  26   2
9    NaN      Ferland Mendy  22   2
10  11.0       Éder Militão  34   1
11   NaN           Casemiro  32   1
12   NaN         Toni Kroos  28   1
13   NaN      Dani Carvajal  24   1
14   NaN         Luka Jovic  15   1
15   NaN               Isco  14   1
16   NaN            Mariano   9   1
17   NaN        Gareth Bale   5   1
18  19.0   Thibaut Courtois  36   0
19   NaN  Federico Valverde  31   0
20   NaN        Eden Hazard  18   0
21   NaN            Marcelo  12   0
22   NaN      Dani Ceballos  11   0
23   NaN      Jesús Vallejo   5   0
24   NaN   Miguel Gutiérrez   3   0
Index(['RK', 'Name', 'P', 'G'], dtype='object')
i wanted to have this but its names on the x axis and goals on the y axis
gleaming osprey
gleaming osprey
Hey! I am trying to classify facial expressions using the fer2013 dataset(This i...
yoo, can someone help, I'm currently augmenting the disgust class
hollow sentinel

here's what it looks like instead
i did it
now i want to make a clearer visualization
 iron basalt
serene scaffold
<@303873532863971330> deep learning is when you have a neural network with a lot...
iron basalt
serene scaffold
<@303873532863971330> deep learning is when you have a neural network with a lot...
I would say it also needs to use backpropagation (as a way to handle multiple layers), it's the two common things in all of "deep learning".
(So many layers (at least 1 hidden) + training method (actually I think backpropagation may be the main thing even above many layers, it forms the framework for all deep learning methods))
gleaming osprey
gleaming osprey
yoo, can someone help, I'm currently augmenting the `disgust` class
can someone help plz
im augmenting
but I think I'm using the wrong metrics
iron basalt
What are you looking for though in terms of goals? Are you trying to do supervised, unsupervised, RL?
/ what is the problem being solved?
Oh. There is good old ARIMA: https://en.wikipedia.org/wiki/Autoregressive_integrated_moving_average
In statistics and econometrics, and in particular in time series analysis, an autoregressive integrated moving average (ARIMA) model is a generalization of an autoregressive moving average (ARMA) model. Both of these models are fitted to time series data either to better understand the data or to predict future points in the series (forecasting...
If you are ok with "neural networks" beyond DL, then there is some pretty wacky stuff to choose from.
ARIMA is used.
It's standard / a benchmark for NNs.
(A lot of stuff that falls under NNs are not really neural networks, just "repeated node models", "neural network" has become a catch all term for any of these types of models, and the problem is that most models that get complicated can be represented by a graph of nodes (especially if they get "deep" / has some stages to it))
(Actual neural networks have neurons of many different types / functions (a lot), and individual neurons have multiple functions and modes and more, so most of these graph models and even traditional ML methods could be considered NNs depending on how loose you are / what you feel like / how you look at it)
thick marlin
[INFO] 2022-07-29 20:17:22,930 __init__: Setting worker0 reply file to: /tmp/torchelastic_0ssr6lo8/none_w2sejxn3/attempt_0/0/error.json
  warnings.warn(_create_warning_msg(
Traceback (most recent call last):
  File "train.py", line 168, in <module>
    main()
  File "train.py", line 140, in main
    trainer.gen_update(
  File "HOMEproject/imaginaire_11/imaginaire/trainers/vid2vid.py", line 254, in gen_update
    net_G_output = self.net_G(data_t)
  File "HOME.local/lib/python3.8/site-packages/torch/nn/modules/module.py", line 1051, in _call_impl
    return forward_call(*input, **kwargs)
  File "HOME.local/lib/python3.8/site-packages/torch/nn/parallel/distributed.py", line 799, in forward
    output = self.module(*inputs[0], **kwargs[0])
  File "HOME.local/lib/python3.8/site-packages/torch/nn/modules/module.py", line 1051, in _call_impl
    return forward_call(*input, **kwargs)
  File "HOMEproject/imaginaire_11/imaginaire/generators/wc_vid2vid.py", line 161, in forward
    self.get_guidance_images_and_masks(unprojection)
  File "HOMEproject/imaginaire_11/imaginaire/generators/wc_vid2vid.py", line 104, in get_guidance_images_and_masks
    point_info = unprojection[resolution]
KeyError: 'w1024xh512'
I'm getting the above error during training
I have tried to print the value for unprojection
print(unprojection)
print(unprojection.keys())
point_info = unprojection[resolution]
However, that doesn't do show anything. How can I log that value durint training?
This is using pytorch
Some thing like above
warnings.warn(_create_warning_msg(
can someone help
signal lagoon
so let's say I have 300,000 numbers of differing quantities, from 1.0 to 400. I have 10 numbers of also differing quantities. how do I predict the next number using those two different number sets

 terse frigate
 modest timber
<@310860262624460801> did u made pip install pandas
modest timber
<@310860262624460801> did u made pip install pandas
yes
@modest timber check #help-carrot
 distant valley
I ran into an issue with pivoting only a specific column wider in pandas. This is easy in R with dplyr, but I don't think there's a built-in pandas solution. So I've written a function that does the thing.
The goal is to transform this:
In [2]: df = pd.DataFrame(np.array([['a', 'b', 'c'],
   ...:                             ['d', 'e,f,g', 'a,b,c'],
   ...:                             ['h', 'i,j', 'z,x']]),
   ...:                   columns=['a', 'b', 'c'],
   ...:                   index=['spam', 'eggs', 'ham'])
In [3]: df
Out[3]:
      a      b      c
spam  a      b      c
eggs  d  e,f,g  a,b,c
ham   h    i,j    z,x
into this:
In [4]: pivot_string(df, "b", "c")
Out[4]:
        a  b  c
spam    a  b  c
eggs_a  d  e  a
eggs_b  d  f  b
eggs_c  d  g  c
ham_z   h  i  z
ham_x   h  j  x
Here's the function I created:
import pandas as pd
import string

def pivot_string(df, val, idx='__alpha__', sep = ','):
    to_pivot = df[df[val].str.contains(sep, na=False)]
    outs = [df[~df[val].str.contains(sep, na=False)]]
    for rowdex, row in to_pivot.iterrows():
        vals = row.loc[val]
        assert type(vals) is str
        vals = vals.split(sep)
        if idx == '__alpha__':
            dex = list(string.ascii_lowercase[:len(vals)])
        elif idx == '__numeric__':
            dex = list(range(1, len(vals) + 1))
        else:
            dex = row.loc[idx]
            assert type(dex) is str
            dex = dex.split(sep)
            assert len(dex) == len(vals)
        pivoted = pd.DataFrame([row] * len(vals))
        pivoted[val] = vals
        pivoted[idx] = dex
        pivoted.index = ['_'.join([x, y]) for x, y
                         in zip(pivoted.index, dex)]
        outs.append(pivoted)
    return pd.concat(outs)
Works pretty well except being sorting unstable. Does anyone have any better suggestions, or any interest in a gist?
It's also pretty inefficient, but it's fast on the dataframes where I'm using it.
 dreamy isle
distant valley
It's also pretty inefficient, but it's fast on the dataframes where I'm using it...
dreamy isle
distant valley
It's also pretty inefficient, but it's fast on the dataframes where I'm using it...
you can use numpy with pandas
also why all the asserts
distant valley
@dreamy isle , the asserts are because this will only work on string columns, and will only work if the index and value columns have the same number of separators. I know you can use numpy with pandas, but IDK how it would speed things up here. It's the memory allocations and the looping that are slow here.
dreamy isle
distant valley
<@310263589913100288> , the asserts are because this will only work on string co...
it's gonna error anyway or produce a wrong result if you don't put asserts
distant valley
that's fair
dreamy isle
distant valley
I ran into an issue with pivoting only a specific column wider in `pandas`. This...
also you could do f"{x}_{y}" instead of '_'.join([x, y])
dreamy isle
distant valley
I ran into an issue with pivoting only a specific column wider in `pandas`. This...
do you have cython installed
brave sand
is it normal for my DT to have an accuracy of 100% lol
mild dirge
On training or testing set? @brave sand
brave sand
mild dirge
On training or testing set? <@765319974469238814>
testing I believe. let me send my code
import pandas as pd
from sklearn.tree import DecisionTreeClassifier # Import Decision Tree Classifier
from sklearn.model_selection import train_test_split # Import train_test_split function
from sklearn import metrics #Import scikit-learn metrics module for accuracy calculation
from sklearn import preprocessing
from sklearn.feature_extraction.text import HashingVectorizer
from sklearn.preprocessing import LabelEncoder
from math import isnan

def main():
    df = pd.read_excel(r"C:\Users\moore\OneDrive\Documents\MARL Summer 2022\marl-data\Copy of Interdiction.xlsx")
    data = df[['REF_LOC_X', 'REF_LOC_Y', 'DISTANCE', 'BEARING',
            'ORIG_FID', 'FID_1', 'CASE_NO',
            'YEAR', 'MONTH', 'COUNTRY',
            'VESSEL_TYP', 'FLAG_STATE', 'DRUG_TYPE1',
            'DETAINEES', 'VESSEL_SEI', 'DIRECTION', 'D_Weight',
            'ROUTE']]
    print(data)

    X = data.copy() #features
    y = X.pop('ROUTE')
    label_encoder = LabelEncoder()
    for col in data:
        if isinstance(data[col].values[0], str) or isnan(data[col].values[0]):
            X[col] = label_encoder.fit_transform(data[col])
    y = label_encoder.fit_transform(y)# Labels

    #vectorizer = HashingVectorizer(n_features=2**3)
    #X = vectorizer.fit_transform(feature_cols)

    #label_encoder = LabelEncoder()
    #y = label_encoder.fit_transform(df.ROUTE)# Labels

    X_train, X_test, y_train, y_test = train_test_split(X, y, test_size=0.15, random_state=42)

    clf = DecisionTreeClassifier(criterion="gini", max_depth=35)

    # Train Decision Tree Classifer
    clf = clf.fit(X_train,y_train)

    #Predict the response for test dataset
    y_pred = clf.predict(X_test)

    print("Accuracy:",metrics.accuracy_score(y_test, y_pred))

if __name__ == "__main__":
    main()
How many samples in the test set?
brave sand
mild dirge
How many samples in the test set?
Like rows?
mild dirge
yes
brave sand
mild dirge
yes
1537
mild dirge
If they are very easy to separate then maybe
100% is almost always suspicious for any real problem
brave sand
mild dirge
100% is almost always suspicious for any real problem
yeah
distant valley
dreamy isle
do you have cython installed
Easy for me to install. Why?
dreamy isle
distant valley
Easy for me to install. Why?
it might improve performance there
dreamy isle
distant valley
Easy for me to install. Why?
there's also this guide on enhancing performance in pandas https://pandas.pydata.org/pandas-docs/stable/user_guide/enhancingperf.html
distant valley
Thanks. It looks like further optimization doesn't make sense here unless I can improve the algorithm. Might come back to it if I start using larger dataframes
 sleek tapir
anyone from sydney
serene scaffold
sleek tapir
anyone from sydney
ask your actual question; don't filter for answerers before you've said what the question is.
serene scaffold
sleek tapir
tats my question lol
if literally all you want to know is if anyone here is from Sydney, then that's not a data science question.
serene scaffold
so there is a question other than "is anyone from sydney"
sleek tapir
networking e.t.c. industry
serene scaffold
sleek tapir
networking e.t.c. industry
you're more likely to find what you're looking for on LinkedIn. (and I could have told you that immediately if your original question explained that you wanted to network with local data science professionals.)
serene scaffold
you can use LinkedIn as a uni student.
a lot of companies have people whose job involves maintaining the company's linkedin presence. if you go on there and make intelligent-sounding comments, you might get noticed.
 merry ridge
Kind of an eyeroll moment, but I've maintained some code to do algorithmic pricing and inventory management for a niche market. A friend of mine is the owner of a successful company in that market and I was doing it as a hobby. He gives me stuff like product I want with no mark up in exchange for keeping the lights on so to speak.
He is retiring and said he wants to buy the source code off of me so he can pass it off to the new owner. I say I don't want to make this about money and if he wants it he can just have it. We compromise and he wants to give me a few grand.
Long story short, the guy buying the business did not seem especially pleased by this arrangement and is asking how much does it even cost to write code anyways.
 bold timber
Hi, I want to improve my model.
In my project the data explained is imbalanced. Thus, I want to handle it by using 'class_weight' instead of SMOTE. How to use class_weight in TensorFlow?
 vast goblet
hello
i have this problem where item id is higher than item_name, how can I fix it, or at least see where are these 169 differences?
the dataset has 300k records.

 unborn crow
Hey someone online who is familiar with pipelines in sklearn ?
thick marlin
Hello, I'm having issues with Pytorch. #help-cookie
steady basalt
sleek tapir
does feature selection belong to the ml model
Depends on the model usuall not
serene scaffold
Yes, but it might be prohibitively slow.
serene scaffold
sleek tapir
does feature selection belong to the ml model
Not sure what you mean by "belong". Feature selection is where you decide what properties of the thing you want the model to learn about will be the inputs.
serene scaffold
unborn crow
Hey someone online who is familiar with pipelines in sklearn ?
Please don't ask to ask. Just ask your actual question.
serene scaffold
sleek tapir
like doing it the ml models
Sorry, but I don't understand what you are saying. You might spend more time reading about feature selection, and see if that answers your question
steady basalt
serene scaffold
Not sure what you mean by "belong". Feature selection is where you decide what p...
May have been meaning random forest
In that it chooses itself
mild dirge
Using L1 regularization basically "chooses" which features to use and which not
wooden sail
using it how and where 😛 you have to be careful what you're trying to sparsify
unborn crow
How patient are you guys with support Vector regression?
serene scaffold
unborn crow
How patient are you guys with support Vector regression?
patient in what way?
unborn crow
serene scaffold
patient in what way?
Fitting time
I am starting at a turning wheel in Vsc for over an hour(100 fit gridsearch)
steady basalt
Lol
Grid search can take many hours if u rly wana push it
My current one is only a halving search and I left it for 6 hours
I have to do this 6 times one for each dataset too
unborn crow
steady basalt
I have to do this 6 times one for each dataset too
3645 fit Gridsearch for a decision tree regressor took only 9 minutes(on the same dataset)
 burnt citrus
quick, maybe stupid question, how do i delete a pandas dataframe row based on date? Let's say i want to keep everything but 2020 data
unborn crow
Do you have a problem with the dropping or the date part of that ?
burnt citrus
unborn crow
Do you have a problem with the dropping or the date part of that ?
the date part. selecting the rows that contain the year
unborn crow
df['year'] = pd.to_datetime(df['DATOP']).dt.strftime('%Y').astype(float64)
df = df.loc[df["year"] == 2020 ]
maybe there is an easier solution, but that will work
burnt citrus
unborn crow
maybe there is an easier solution, but that will work
Thanks, i'll try it!
unborn crow
just ping me if it doesnt
steady basalt
unborn crow
3645 fit Gridsearch for a decision tree regressor took only 9 minutes(on the sa...
That many fits would take my m1 pro laptop multiple hours on random forest
unborn crow
steady basalt
That many fits would take my m1 pro laptop multiple hours on random forest
I am using an M1 MBP
steady basalt
Try 15k fits
I usually do cross validation and a fair few parameters
But yeah grid search takes a long time
Imo just leave it while u sleep so u aren’t waiting
Especially on SVR with tens of thousands of data points
unborn crow
i have to finish this project until monday so, it is really stressful to wait for the result
 limpid talon
Hi,
I am facing a problem and I would like to receive any advice
We need to process a CSV file with around 1million of rows and 30 columns.
We need to run 3 groups of validation on every cell
1, structure validations, (data type, length and required)
2, arithmetic operations with some calculations, grouping data over the entire dataset
3, data validation over each cell, where we we need to compare values against databases lists and also webscraping validations.
Here we have a performance requirement and all of this operations must be done in less than 90 minutes.
We start running it on a machine on Azure with 16 cores and 56gb memory, but running a 10.000 file it breaks. We run small files and run well, but if the file is greater than 10.000 crash and I don't know the reason, but I think it is something on databricks and not for code rules.
Reading a bit I found that could be better run this on a cluster for high concurrency and create another...High concurrency with 56gb and 8 cores.
The process was launched on it with 10.000 rows and is running right now. In this moment 3 hours and continues..... 😔
Anyone has done something similar?
What do you think we can do or evaluate for a better performance and also to finish the task?
PD... It must run 1 million rows file?
steady basalt
unborn crow
i have to finish this project until monday so, it is really stressful to wait fo...
So do at night time
steady basalt
limpid talon
Hi,
I am facing a problem and I would like to receive any advice
We need to proc...
Are u using pandas ?
I’m working on 1million row data and it’s fine never crashes, my laptop handles it fine
10k rows? Seems somethings wrong
limpid talon
Yes, it is with pandas
steady basalt
Fyi my Mac laptop can handle millions of rows
I recently imported a 100m row csv or something
Whatever it was was so huge
Anything over 1m will be a headache tho making u wait minutes for operations
unborn crow
steady basalt
So do at night time
I need the result to continue ... otherwise i would
steady basalt
SVR does take its time
I remember doing the exact same
But of course not a grid search, but halving grid search
It’s faster
I think I did about 6k fits
5cv
I recommend u to use halving
unborn crow
steady basalt
I recommend u to use halving
i'll try that
steady basalt
And then leave it running for 2 hours
While u wait find something else to do xd
Maybe another notebook do some other code
Like extra data analysis idk
I play games while I wait for mine to run
Or YouTube
unborn crow
steady basalt
Like extra data analysis idk
I plotted the shit out of my data while waiting
unborn crow
a friend of mine wrote his Phd about that stuff
steady basalt
Must be physicist and very smart
unborn crow
but not matter how hard he tries i just get the basic level
steady basalt
Yeah screw that
unborn crow
steady basalt
Must be physicist and very smart
right on both parts
steady basalt
I wonder when that tech will be commercial
In smartphones and stuff
I can imagine we will be running grid searches on chips in our head eventually
unborn crow
he is quite convinced that there is not really a poimt to that
steady basalt
The point is speed
unborn crow
steady basalt
The point is speed
Only in certain tasks
unborn crow
there are other halbleiter (sorry i am german ) beside silicon that could be used for processing and have higher thermal stability
serene scaffold
unborn crow
```py
df['year'] = pd.to_datetime(df['DATOP']).dt.strftime('%Y').astype(float64...
if you ever have a datetime, store it in the dataframe as a datetime--don't use it as an intermediary
# no
df['year'] = pd.to_datetime(df['DATOP']).dt.strftime('%Y').astype(float64)
df = df.loc[df["year"] == 2020 ]
# yes
df['DATOP'] = pd.to_datetime(df['DATOP'])
df.loc[df['DATOP'].dt.year == 2020]  # what a terrible year :(
so you could drive higher clock speeds
unborn crow
serene scaffold
if you ever have a datetime, store it in the dataframe as a datetime--don't use ...
we optimized that in DMs already
was just the first thing that came to mind
i am doning Data Science stuff for around 2 Months now, before that i did backend stuff so i am not really fluent in Pandas yet
serene scaffold
unborn crow
i am doning Data Science stuff for around 2 Months now, before that i did backen...
I hope my suggestion is helpful for you.
unborn crow
serene scaffold
I hope my suggestion is helpful for you.
Any input is appreciated
 timid kiln
I need some help with a calculation. I have a set of data that's a percentage between 0 and 100. I want to calculate the mode of the data, but in certain intervals. So how many times is there a value between 50 and 59, 60 and 69, 70, and 79, etc. Do y'all know how I would do that?
wooden sail
this is exactly what a histogram is. both numpy and pandas can compute this for you
well, not "exactly", i lied. that will give you the counts, which is the second thing you asked for, but not the mode
for the mode you'd have to use inequalities
In [45]: import numpy as np

In [46]: from scipy import stats

In [47]: x = np.random.rand(50)

In [48]: x
Out[48]:
array([0.75451679, 0.22425868, 0.60821127, 0.22826769, 0.71057578,
       0.84992761, 0.73691657, 0.98797846, 0.75035246, 0.47657827,
       0.86512421, 0.9368889 , 0.77613344, 0.85527805, 0.68588951,
       0.5800516 , 0.58573269, 0.70707832, 0.27455543, 0.53575204,
       0.79235506, 0.38019203, 0.96129576, 0.93724375, 0.82049363,
       0.3896343 , 0.12300635, 0.59362387, 0.37076835, 0.45195437,
       0.31993079, 0.01720551, 0.46273298, 0.59086524, 0.68070039,
       0.56770447, 0.44186155, 0.17931036, 0.82123604, 0.67875285,
       0.07158461, 0.68059559, 0.80474427, 0.83245901, 0.2853007 ,
       0.58537778, 0.68382655, 0.11207463, 0.3515011 , 0.00177698])

In [49]: stats.mode(x[np.logical_and(x < 0.6, x >= 0.5)])
Out[49]: ModeResult(mode=array([0.53575204]), count=array([1]))

In [50]: x[np.logical_and(x < 0.6, x >= 0.5)]
Out[50]:
array([0.5800516 , 0.58573269, 0.53575204, 0.59362387, 0.59086524,
       0.56770447, 0.58537778])
something like this for the mode
timid kiln
wooden sail
```py
In [45]: import numpy as np
In [46]: from scipy import stats
In [47]: x ...
Well I learned something new today, what a histogram is. :).
timid kiln
wooden sail
```py
In [45]: import numpy as np
In [46]: from scipy import stats
In [47]: x ...
That’s cool how you just threw that together. 🙂
 pastel sphinx
hey so im trying to plot this data here, basically its time-series data for how long a process took on a vm. i want to plot it as a series of lines (with the x value being the timestamps, and the y being the total time), with each line being grouped together by the vm number. ive been trying for a while now to plot it using matplotlib w/ the dataset imported as a pandas df, but i cannot get it to look how i expect. google hasn't been too useful as my series of lines aren't categorized separately and the timestamps may not all line up between groups. any recommendations?

(i have the data in a csv and loaded it using panda's read_csv w/ the parse_dates)
btw sorta new with data plotting in python
 hallow turret
hello, I wanna try programing in python. Where to start?
I found many courses on the net but each other are different, I dont know man...
!learn
lapis sequoia
pastel sphinx
hey so im trying to plot this data here, basically its time-series data for how ...
maybe using seaborn's hue function may help you
sns.lineplot(x='Timestamp', y='TotalTime', hue='VMNumber', data=df)```this is very close to what i want, how come only groups of 4 are in the hues?
 lapis sequoia
well, it shouldn't. what happens if you run df['VMNumber'].unique()?
 lapis sequoia
ok, so it isn't a problem with the dataframe. okay, try using
sns.lineplot(x='Timestamp', y='TotalTime', hue='VMNumber', hue_order=df['VMNumber'].sort_values(ascending=True), data=df)
maybe this way it can force seaborn to plot all VMs
pastel sphinx
nope still in groups of 4
lapis sequoia
ok, try running sns.relplot(kind='line', x='Timestamp', y='TotalTime', hue='VMNumber', data=df) and see if works
that way we can check if it is a seaborn limitation
pastel sphinx
there are supposed to be 20 individual lines, maybe thats hitting a maximum
lapis sequoia
yeah, that's what I'm thinking
you could go another way and plot a lineplot for each one of the VMs
sns.relplot makes that easy
pastel sphinx
 lapis sequoia
sns.relplot(kind='line', x='Timestamp', y='TotalTime', col='VMNumber', col_wrap=4, data=df) colwrap here creates rows of plots each one containing 4 columns of plots
pastel sphinx
i am trying to compare all 20 at once, rn its with a little bit of a data but once a grab the full dataset then the lines shouldnt look as a chaotic. worst case i will just sep them out
pastel sphinx
lapis sequoia
```sns.relplot(kind='line', x='Timestamp', y='TotalTime', col='VMNumber', col_wr...
yeah it made 20 individual plots
lapis sequoia
sns.FacetGrid(df,hue='VMNumber',height=4).map(plt.plot,'Timestamp','TotalTime').add_legend()
try this also and see if works
remember to import matplotlib as plt
pastel sphinx
 lapis sequoia
well, that worked hahaha kind chaotic tho
pastel sphinx
haha yeah, how do i expand the graph? i had ```py
plt.figure(figsize=(16, 8), dpi=150)
sns.set(rc={'figure.figsize':(16,8)}) should work
pastel sphinx
didnt change it
lapis sequoia
have you ran %matplotlib inline at the start of the notebook?
pastel sphinx
no but adding it didn't fix it either
im using pycharm btw for the jupyter notebook
lapis sequoia
plt.gcf().set_size_inches(16, 8) try that after the line that generates the figure
pastel sphinx
fixed it!
lapis sequoia
great
pastel sphinx
thanks a ton for the help
lapis sequoia
np
timid kiln
wooden sail
```py
In [45]: import numpy as np
In [46]: from scipy import stats
In [47]: x ...
So the numbers I have are float values but they're in a list. I'm getting errors attempting to process the values in the list.
x = [0.2286, 0.2297, 0.2638, 0.2484, 0.2665, 22.5138, 61.594, 0.6334, 61.879, 61.468,
     1.1949, 61.521, 32.2758, 1.1535, 0.2906, 95.1944, 0.2463, 82.3127, 60.574, 0.7390]
print(type(x))
print(type(x[0])
stats.mode(x[np.logical_and(x < 0.6, x >= 0.5)])
print(x[np.logical_and(x < 0.6, x >= 0.5)])
'<' not supported between instances of 'list' and 'float'
How do I tell numpy to process the float values? type(x) is a list, type(x[0]) is a float. When I run the numpy array through there, the values are numpy.float64.