#profiling observations - tracy profiler
1 messages · Page 1 of 1 (latest)
 still pawn
benefits vs internal UI:
- captures the stream of frames (instead of just one [at a time])
- can visualize frames over time
- can generate statistics on scopes (total amount/average/distribution - more?)
- can drill down into a frame via mouse wheel zoom
WIP
problems:
- [major] needs ~2 GM RAM per minute + crashes when too much RAM is requested
- default scope coloring not ideal - can be changed via options
- no keyboard control (?)
- no zoom in flame graph


 teal dock
can also export the traces nicely
You can switch it to main thread only, alot less memory usage but, if you have lag that is caused by a worker thread being slow, you wouldn't see it
still pawn
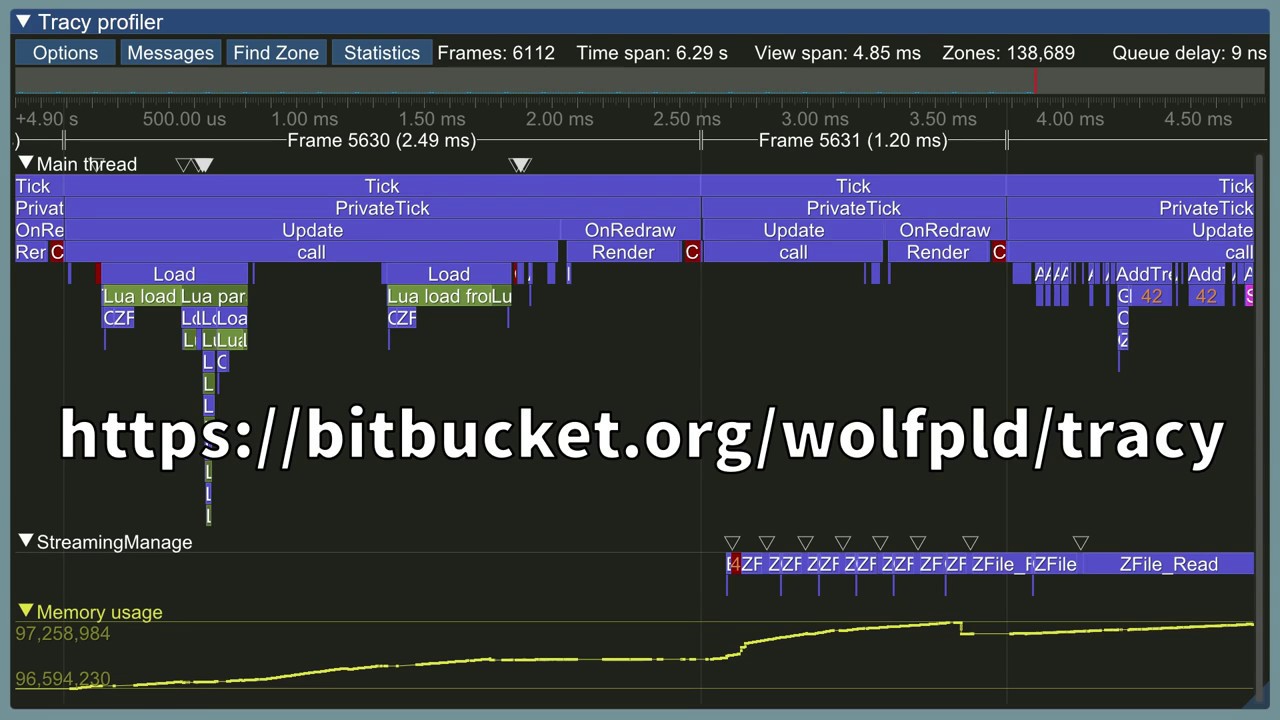
This video is a presentation of Tracy Profiler v0.2.
More information is available at https://github.com/wolfpld/tracy
~first half offers relevant stuff for A3 usage
Automated data collection and Memory Profiling is only available if you the the RV engine source available, right?
 ancient saffron
Looks like magic😅
still pawn
while certainly useful to profile unscheduled sqf code (scheduled if doable somehow), not sure so far how useful tracy is for community people to profile the engine. the be able to record a stream of many frames in general is great, yet not sure what insights to gain from it and what approach and workflow to use

stats with mean time per call could be useful to give pointers what to focus on (still a scope may already run in parallel to the main thread / on worker threads - and thus wouldnt contribute to speed up the main thread)
another element is to find extremes via stats and zone, and thus identify spikes/fps lag/mini freezes. by just looking through the graph and data, and no relation to game events (as tracy cant halt the engine like the internal profiler can do), it seems tricky

stats "timing with children" could be useful - specially for sqf functions with long runtime
so far i couldnt figure out how to switch focus to a particular frame - with LMB hold only to highlight it
it seems also it cant pick up the frames properly - its always just "3" and not seeing the "time/fps graph" at the top to easily jump across frames
might be as the server didnt have elevated permissions
teal dock
still pawn
it seems also it cant pick up the frames properly - its always just "3" and not ...
Its probably broken.
The frame counter is flaky
still pawn
tried elevated permissions, yet it seems it didnt work as not seeing in tracy what i should see
FSUTIL DIRTY query %SystemDrive% >NUL || (
    PowerShell "Start-Process -FilePath '%0' -Verb RunAs"
    EXIT
)```Elevated permissions does nothing
Tracy has a couple features that use it, but these are turned off and are not related to Arma profiling.
still pawn
ok so ASP has a customized version bundled?
teal dock
yes
still pawn

it seems ASP cant pick up subscopes of jobs (at times?). a bit tricky to determine as ASP disables the arma internal profiling (has to?)
teal dock
jobs don't always have subscopes
still pawn

yeah for others it does them display them. so all good there


there seems to be a bug with tracy - if you zoom in, it will hide sub threads (scrollbar doesnt keep them available either)
teal dock
jobs generally don't carry over between frames.
Something went wrong and it missed the end of a job scope, thinking it is still running
teal dock
still pawn
there seems to be a bug with tracy - if you zoom in, it will hide sub threads (s...
It only shows what is visible in your horizontal slice.
If threads do nothing in your horizontal zoom, then they are hidden.
There is no purpose in showing empty rows
still pawn
i see. seems useful and makes sense - albeit a bit confusing

having the sub threads named like in the internal profiling viewer would help a good deal overall but also if you sidescroll and it dynamically adjusts which are shown

looks like some AI path calls are spread over two frames - is that so, or rather a timestamp problem with the AI scope?
still pawn

for WLs it looks like the server is mainly doing pthAS, then pthMF and some cLVis (and PX) in the subthreads
teal dock
only pthMF and aiWIS are multithreaded in the AI sim
But the pthMF ones should be called "OC_CF" but thats probably only in the description when you hover the job
still pawn


as this is from mission start, there is probably some more PX and other vehicle simulation, and at times more combat related scopes in later phases
teal dock
Second image is interesting.
It shows what scopes I should disable to reduce tracy memory usage, and improve performance in profiling
still pawn
the super sub scopes are interesting to some extent at first to learn what the engine does, but not really useful for profiling indeed
teal dock
it is weird that it has multiple of same name, they should be merged into just one
still pawn
i think to recall an update added that as a feature - seems not available/exposed in this tracy mod
teal dock
I mean there should only be one of these in engine too. Nothing that tracy would need a feature for
Ah I think it does it per thread, because ASP has a separate cache per thread now
still pawn
teal dock
But the pthMF ones should be called "OC_CF" but thats probably only in the descr...
 still pawn
teal dock
Ah I think it does it per thread, because ASP has a separate cache per thread no...
still pawn
teal dock
Ah I think it does it per thread, because ASP has a separate cache per thread no...
tracy seems to identify them only per thread yes

 teal dock
if job has a name, its displayed there
that is the "extra info"
in in-game profiling its shown after the timing info
still pawn

wsSet may be worth to recheck if you havent/not on your list. see also: #1301452742186766389 message

other times it seems at least cover fully by jobs - yet either missing subscope info or unclear why it gets dragged out still for "so long"
teal dock
what are these jobs
uVSs/mJobM are missing subscopes. And that is fine and correct.
updAttPJ also have no subscopes, also correct
still pawn
 teal dock
seems all correct then
still pawn
top one
 still pawn
it seems also it cant pick up the frames properly - its always just "3" and not ...
still pawn
still pawn
it seems also it cant pick up the frames properly - its always just "3" and not ...
whats pretty annoying is that you can not focus on frames - i'd assume its not working as the frame separation is not working
teal dock
yup
still pawn

mid mission capture - due the ai scope layering/separation no longer working properly, right?
teal dock
yes
but something went wrong there with end of a scope again.
there can not be a perAI down inside AI processing
seems ASP sometimes misses the end of a scope


 teal dock
yeah again, missing ends of scopes
Thats mostly caused by performance improvement in ASP, I'll just have to take that out again
still pawn


i'd assume these stats have some value - especially if you could get them for longer MP sessions
still pawn
i'd say as server admin/scenario designer, if the server was running low on fps or had other problems, you can see:
- if jipqueue may need some attention
- basically if you have too many vehicles (PX)
- if AI has been too much or their pathfinding
as programmer with access access to the source what scope might be worth your attention to optimize
ofc you would still need to check if it actually impacts the main thread

WLs server at 10 fps
the env sounds look no good for some reason

other bigger element are the pthMF on the main thread

shNew seems also quite expensive at times for env sounds

some 30min later server at 2 fps
env sounds now at 350ms range

AI around ~90 ms in mean at that point
teal dock
still pawn
the env sounds look no good for some reason
the cL's usually take a couple hundred nano seconds. But here it looks like 10 milliseconds each.. Something is messed up there.
Could potentially be objects outside of terrain
teal dock
still pawn
shNew seems also quite expensive at times for env sounds
loading models is slow. But rarely happens
I'd say look if there is something outside of terrain bounds
still pawn


AI did advance quite well; mostly empty vehicles - 110 AI seems not that high
{_x inArea [[worldsize/2, worldsize/2, 0], worldsize, worldsize, 0, true]} count vehicles/allUnits
all inside the terrain area if i got that check right
 diag_log str
 [
  count (63 allObjects 0), {_x inArea [[worldsize/2, worldsize/2, 0], worldsize, worldsize, 0, true]} count (63 allObjects 0),
  count (63 allObjects 1), {_x inArea [[worldsize/2, worldsize/2, 0], worldsize, worldsize, 0, true]} count (63 allObjects 1),
  count (63 allObjects 2), {_x inArea [[worldsize/2, worldsize/2, 0], worldsize, worldsize, 0, true]} count (63 allObjects 2),
  count (63 allObjects 3), {_x inArea [[worldsize/2, worldsize/2, 0], worldsize, worldsize, 0, true]} count (63 allObjects 3),
  count (63 allObjects 4), {_x inArea [[worldsize/2, worldsize/2, 0], worldsize, worldsize, 0, true]} count (63 allObjects 4),
  count (63 allObjects 5), {_x inArea [[worldsize/2, worldsize/2, 0], worldsize, worldsize, 0, true]} count (63 allObjects 5),
  count (63 allObjects 6), {_x inArea [[worldsize/2, worldsize/2, 0], worldsize, worldsize, 0, true]} count (63 allObjects 6)
];```"[785,785,241,241,0,0,0,0,566,566,41,41,0,0]"
 diag_log str
 [
  count (63 allObjects 0), {((getPosATL _x)#2) < 0} count (63 allObjects 0),
  count (63 allObjects 1), {((getPosATL _x)#2) < 0} count (63 allObjects 1),
  count (63 allObjects 2), {((getPosATL _x)#2) < 0} count (63 allObjects 2),
  count (63 allObjects 3), {((getPosATL _x)#2) < 0} count (63 allObjects 3),
  count (63 allObjects 4), {((getPosATL _x)#2) < 0} count (63 allObjects 4),
  count (63 allObjects 5), {((getPosATL _x)#2) < 0} count (63 allObjects 5),
  count (63 allObjects 6), {((getPosATL _x)#2) < 0} count (63 allObjects 6)
];```"[785,129,238,72,0,0,0,0,559,208,37,1,0,0]"
below ground:
(rounded to two digits)
still pawn

at times the check is quite expensive (PZKW mission). the mortain terrain has no water - only the water title objects for rivers but AI usually doesnt get close ot them
teal dock
It checks water objects (ponds)
Usually there are none, then its cost is very low (it just checks empty grid cells that have no ponds). The number of grid cells to check depends on where inside a cell the position is.
It seems you have some spot on the terrain where there are ponds
still pawn
yeah the rivers, yet not me or AI are anywhere close (plus almost all AI doesnt even have simulation active yet
teal dock
I don't know how large the cells for water objects are. Should be same cell size as terrain cells/landgrid.
Also cells on edge of terrain contain everything that is past the end of terrain in that direction.
So something outside of terrain, "behind" a river, would still see the river
still pawn
hm didnt find anything in WLs outside the terrain. can do a check if anything is near the pond models i guess

PZKW DS once AI tanks get activated
interesting that aiMines (vis check for nearby mine) still quite high up despite R3vo reduce their amount a great deal
count allMines = 750. ok still a fair number
teal dock
but do I see right that average is 150us for aiMines?
That would mean its not worth multithreading
still pawn
 teal dock
ah. mh.
There is already a optimization note there to put mines into a quad tree. So instead of checking all mines, you would only check mines nearby.
That would be the proper fix for that issue anyway. But unlikely. That is like a day or two of work, not worth it
same image twice
still pawn
darn. new keyboard..

btw all these are from our real DS with that hardware (VM)


ref data on PX3 for the DS + PZKW
teal dock
I'm fixing px3vehsim and px3vehsimsweep now
still pawn
wSimPXSco optimization is in that you have mentioned for v6? #1301458792323743817 message
 teal dock
yes
still pawn
a few observations from PZKW still running unattended over night
PX3 subscopes with a few extremes from time to time (<1ms vs several ms)


 teal dock
still pawn
PX3 subscopes with a few extremes from time to time (<1ms vs several ms)
teal dock
still pawn
PX3 subscopes with a few extremes from time to time (<1ms vs several ms)
Okey. But all these do not matter at all because its async. So why tell me that
still pawn
the three with long bars (except 1st red) are uSens AI threads - normally these have one or two of these long bars all the time. either something related to tracy or potentially different AI calcs with no player present

 teal dock
If you have these job bars going across more than one frame, then its a bug in ASP not catching the scope ending
still pawn
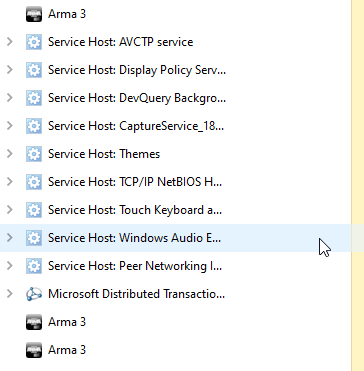


it seems when tracy has been active, the arma 3 (server) task doesnt get killed/exited properly
had 3 of those stale tasks remaining with almost no memory use - but blocked the exe to get updated by steam
still pawn

unfortunately the scopes seem even more busted than before - only main thread is still readable. so cant use tracy atm really to judge PX3 MT
the EpeFR distribution indicates a good a chunk of PX3 calcs in PZKW are not finished in the initial frame

if that MTPC is actually true, that looks way higher than i had locally
will test some more tomorrow with our DS using the a3 internal profiler