#profiling observations - client
1 messages · Page 1 of 1 (latest)
 knotty igloo
thread

the waitBG here is due to waiting for the blue thread to finish, right? (forgot to check what its in that)

that gsEva in hudDr is draw2d and the like - aka only sqf code processing, right?


mapDr (aw?) should be the engine processing i think
mtPmj has 95% coverage with lots of MT
mapSeaAndNormalDraw only 5% and low MT - could be worth to investigate

preLd might be worth to check too

preLG only 2% coverage

preLS only 5%

wSimPXSco - hadnt noticed that one before, yet seems also something PX (epe) related.
this was CP with enemy side having several tanks

0.5 ms and 0.2 ms on a network message - fishy or not?
knotty igloo

hudDr in 3d only has 22% coverage

preLV (from preLd) only 8%

for GPU(?) the sceACPrx may have biggest potential with MT/optimization - overall render composition would need comparison with more modern GPUs(/CPUs) tho

a sample of wPSn1 - this situation with two snTnk (tanks) to make the majority of it.
SPE with the complexity audio system by LAxemann vs vanilla would be interesting to compare
 unreal wagon
knotty igloo
the waitBG here is due to waiting for the blue thread to finish, right? (forgot ...
unreal wagon
knotty igloo
the waitBG here is due to waiting for the blue thread to finish, right? (forgot ...
Yes... But its weird. The blue thread should've started in the previous frame. Not in the current one. It should stretch the whole length
unreal wagon
knotty igloo
that gsEva in hudDr is draw2d and the like - aka only sqf code processing, right...
yes
unreal wagon
knotty igloo
mapDr (aw?) should be the engine processing i think
mtPmj has 95% coverage with ...
its rendering. Afaik not much I can do
unreal wagon
knotty igloo
preLd might be worth to check too
Already did. It now only does 1/4th of preLd per frame.
Its slow because it iterates over all objects and asks "Do you need to preload anything?" and most cases, objects say no.
That is also why the low coverage.
If an object actually preloads something, it would be covered. But all its doing is iterating over them and finding they got nothing to do
unreal wagon
knotty igloo
wSimPXSco - hadnt noticed that one before, yet seems also something PX (epe) rel...
Its new, that scope was missing before.
I wrote about this before. When a physx object is simulated, it also updates others around it. And if many objects are close by it updates some multiple times.
This was heavily optimized in v6
unreal wagon
knotty igloo
0.5 ms and 0.2 ms on a network message - fishy or not?
I also noticed that first messages always take longer.
maybe its because CPU cache is not filled with the relevant stuff yet, but for later messages it is. That message in itself should not be slow.
unreal wagon
knotty igloo
hudDr in 3d only has 22% coverage
it renders many displays.
We should add sub scopes for every display, and also log the classname of it
unreal wagon
knotty igloo
for GPU(?) the sceACPrx may have biggest potential with MT/optimization - overal...
Not possible sadly
unreal wagon
knotty igloo
Mh what are these jobs in the worker threads there?
knotty igloo
unreal wagon
Mh what are these jobs in the worker threads there?
in the first three below the main thread, right? all or just the ones in the same timeframe as the wPSn1?
unreal wagon
the ones immediately below, the tight block
 knotty igloo
 unreal wagon
yeah thats good then.
It just looked so weird that it exactly matched up with the length of sound sim, as if the sound sim was doing the jobs
knotty igloo
yeah usually it seems particle simulation does have only a fraction of the sound simulation
maybe explosions, burning wrecks and other smoke were added up for that situation
knotty igloo


is there some distance check for (vehicle) sound simulation?
it feels like it simulates the sounds for vehicles all the time

when moved to top right corner
 unreal wagon
knotty igloo
is there some distance check for (vehicle) sound simulation?
it feels like it s...
unreal wagon
knotty igloo
is there some distance check for (vehicle) sound simulation?
it feels like it s...
no. Technically a vehicle could create a sound with 50km audible range
unreal wagon
knotty igloo
Something is weird there, sound sho... oh crap
I forgot to enable some optimizations.. Like sound running async
knotty igloo
unreal wagon
no. Technically a vehicle could create a sound with 50km audible range
is it about moving sound sources - ie missiles?
in practical terms >1000m is "usually" inaudible - or distance check (for all) is more expensive than to simulate all the time regardless if "needed"
unreal wagon
No any sound source.
Usually yes. But Arma is not a usual game, there are exceptions everywhere :/
knotty igloo
did some 0.1 ms logging


doesnt show either the scope where its really coming from, or otherwise just lots of ximO and its subscopes to add up

the steam query


an exclude filter would be also super handy to not capture known problems/events (ie steamCbk or UI onLoad/unLoad or scScr (scheduled) [from pause menu])
knotty igloo
unreal wagon
Already did. It now only does 1/4th of preLd per frame.
Its slow because it iter...
why isnt it feasible to add objects into a separate queue only if they need updating? is that more expensive to set such reference than to iterate over all and do the check?

wSimM over 0.5 ms - would such be worth investigation? (low coverage doesnt tell why)

simShM with more than 0.6 ms
knotty igloo
unreal wagon
Not possible sadly
is this where section count is most relevant, or GPU stuff too complex to pinpoint beyond the general best practices?

ie here 0.100 to 0.160 for SPE_GER_Soldier_Unterofficer_Boots vs 0.025 to 0.100 for SPE_US_HBT44_FrogSkin_Jungle - only thing otherwise i can think of would be LOD level or amount (if that matters)


technically the US model should be more demanding from what i understand

should a ticket be made for the animalBehavior? (up to 0.7 ms here)

another sample of netwT with some higher load

bgD3D is stalling the main thread with waitBG. bgD3Dis probably drawing all the map elements - any chance for optimization with that one?

wDisp with almost 5 ms - is it about creating new UI elements?

mapObjectsDraw seems not to have MT yet - over 6 ms here. what is this about?
knotty igloo
knotty igloo
217 ms p3d fsAPr


 unreal wagon
knotty igloo
why isnt it feasible to add objects into a separate queue only if they need upda...
unreal wagon
knotty igloo
why isnt it feasible to add objects into a separate queue only if they need upda...
To do that, the objects would need to know that they have something that they want to update.
The preLd step is doing that, its checking if objects have something that they want to update.
unreal wagon
knotty igloo
simShM with more than 0.6 ms
It triggered an explosion. Sh is probably a shell/exposive. Triggering a explosion is rare, and 0.6ms for a rare event, no its not worth wasting time on
unreal wagon
knotty igloo
is this where section count is most relevant, or GPU stuff too complex to pinpoi...
PRx is proxies.
That step collects all objects visible in the scene, and selects which LOD they should render at. Both based on distance but also based on the other objects on the scene.
Lots of objects (proxies) == lots of work
unreal wagon
knotty igloo
should a ticket be made for the animalBehavior? (up to 0.7 ms here)
No. It will not be fixed
unreal wagon
knotty igloo
bgD3D is stalling the main thread with waitBG. bgD3Dis probably drawing all the ...
unlikely. And I don't really care about fps while on the map screen
unreal wagon
knotty igloo
simulating UI. Still on map screen, doesn't matter
unreal wagon
knotty igloo
mapObjectsDraw seems not to have MT yet - over 6 ms here. what is this about?
unreal wagon
knotty igloo
217 ms p3d fsAPr
There is nothing I can do about loading a file from disk, taking long
unreal wagon
knotty igloo
92 ms ATRCpl
 knotty igloo

wSimPXSCo with with 80 ms - repeated 2 more times thereafter while approaching the APC (non moving)

with px3InitO with 14 ms the biggest hit

almost 16 ms from sndTr - didnt trigger again that high later

textures of ui elements loaded when you enter a vehicle - couldnt these be avoided by preloading those textures via the config preloadTextures?

(MT) first time ive seen such long visul (30 ms) - of that 6,5 ms issCB
with such cases, one would need some statistical analysis to get an idea if just rare special, or really something to happen often enough to warrant attention

this amount of sound files loading is probably demonstrating the more complex sound system LAxemann made for SPE

although not having many vehicles overall, and especially near the start position, the Prizefighter scenario may indeed highlight a couple interesting cases

also preloading fonts could help reduce mini lag when entering vehicles, or dialogs/menus

the SteamCbk, with repeating each 10? seconds, probably the most worthy to look into small freezes - at least if it happens for a higher percentage of players

while most of the ui/font texture loading is put into threads, some remained in the main one - due to limit of 3 subthreads?
is the 100ms for cmBld (part of AI) correct, or also skewed due to MT for AI? any way to see that from the visualization or logged data?


456 ms for mSUGS with no subscope info - as part of wDisp likely dialog related
dunno how meaningful the 0.1 s event logging is without data aggregation for those :/
unreal wagon
knotty igloo
with such cases, one would need some statistical analysis to get an idea if just...
It is async anyway so it doesn't matter
unreal wagon
knotty igloo
is the 100ms for cmBld (part of AI) correct, or also skewed due to MT for AI? an...
yes. No. Somewhat, if you see a sub aiGrp scope inside it, then thats due to coroutines
knotty igloo
unreal wagon
It is async anyway so it doesn't matter
sure as long as the main frame is longer/not delayed by it. probably wont happen either. still with modern cpu/gpu/etc, it may be more relevant.
we will do some profiling together with R3vo and other next week that have top notch hardwar. so to be seen how it looks there
knotty igloo
@zenith horizon i think i found the reason for low fps in PZKW 🙄


and it gets worse
 knotty igloo
the SteamCbk, with repeating each 10? seconds, probably the most worthy to look ...
knotty igloo
knotty igloo
the SteamCbk, with repeating each 10? seconds, probably the most worthy to look ...
first time i saw it combined with dlcUpd (290 ms)
 knotty igloo
while most of the ui/font texture loading is put into threads, some remained in ...
knotty igloo
knotty igloo
while most of the ui/font texture loading is put into threads, some remained in ...
another case - not sure why it loaded the fonts that moment. the UI was already present for a while
 knotty igloo
this amount of sound files loading is probably demonstrating the more complex so...
knotty igloo
knotty igloo
this amount of sound files loading is probably demonstrating the more complex so...
even if in MT, 10-15 ms for one/two sound files seems bad. at least with faster hardware (and thus the main thread quicker), it could turn into a short lag element
does the engine cache sound files after first time use? if so, what about some preloading on most relevant ones (fx, ammo, environment, vehicle engine)
also is it relevant that its loading from EBO here vs PBO?


 zenith horizon
knotty igloo
<@444053322312318976> i think i found the *reason* for low fps in PZKW 🙄
zenith horizon
knotty igloo
<@444053322312318976> i think i found the *reason* for low fps in PZKW 🙄
I wonder if that is related to tracked vehicles.
knotty igloo
knotty igloo
first time i saw it combined with dlcUpd (290 ms)
getting this more often now in combo - could this be some appId ownership check relation?

normally dlcUpd is part of steamCbk - at times its own thread
knotty igloo

PX init for vehicles seems quite intense - possible to MT the init? or distribute over a few frames?


had the mSUGS a few times now with 50+ ms. in this situation there wasnt any dialog tho - unless the creation of the capture window itself somehow got caught

staSim with almost 50 ms. had that only once so far tho


vssCB stalling the main thread - had it a handful of times now
oPasD with 10ms; while the second main part recCB seems to have good MT, o1Drw not yet? seen this only once so far


actually soon after another longer o1Draw and two longer vssCB - are they related?


oSoSL / slDoL without MT - again first time i saw that one

dsr2t - is this PiP? if so, not possible to render it in parallel to "render"/as part of it?

txRsM another first timer - when the briefing of the CO started. no clue how it could relate tho

usrIn - user input? happened when i press space to grab the rifle

rtm, ogg and wss loaded alongside

 knotty igloo
getting this more often now in combo - could this be some appId ownership check ...
knotty igloo
knotty igloo
getting this more often now in combo - could this be some appId ownership check ...
more samples


 knotty igloo
had the mSUGS a few times now with 50+ ms. in this situation there wasnt any dia...
knotty igloo
knotty igloo
had the mSUGS a few times now with 50+ ms. in this situation there wasnt any dia...
later samples - also related to DLC ownership in some way?


 knotty igloo
textures of ui elements loaded when you enter a vehicle - couldnt these be avoid...
knotty igloo
knotty igloo
textures of ui elements loaded when you enter a vehicle - couldnt these be avoid...
preloading the standard A3 inventory UI elements could also avoid some initial loading lag at least

winMs with 30 ms - another first timer. no subscopes and no idea how it could relate to ingame events
 knotty igloo
PX init for vehicles seems quite intense - possible to MT the init? or distribut...
knotty igloo
knotty igloo
PX init for vehicles seems quite intense - possible to MT the init? or distribut...
another case with the layer with vehicles got activated


IndExplo with 12 ms (tank explosion) - 0.3 ms HD but mostly IEde with 11,5 ms in subscope - another EH? (ie hitPart)


EHs "mainly" processed in netwT (why in SP???) and wSimO via wPosE subscope


 knotty igloo
another case with the layer with vehicles got activated
knotty igloo
knotty igloo
another case with the layer with vehicles got activated
one more sample


 knotty igloo
oSoSL / slDoL without MT - again first time i saw that one
knotty igloo
knotty igloo
oSoSL / slDoL without MT - again first time i saw that one
another oSoSL / slDol

 knotty igloo
oPasD with 10ms; while the second main part recCB seems to have good MT, o1Drw n...
knotty igloo
knotty igloo
oPasD with 10ms; while the second main part recCB seems to have good MT, o1Drw n...
another case of lodUL

RMB zoom leading to many LOD level changes and thus texture loading


should be another such RMB zoom


feasible/meaningful to have more threads for texture loading (in special situations like zoom)?
knotty igloo
knotty igloo
another case of lodUL
not sure if this was also from RMB zoom


scrVM is scheduled, isnt it? aka should be limited to 3ms - here 113 ms, yet seems more a problem with scope not correctly ending / non correct assignment to the scope


possible to get higher subscope coverage for PrxObj to get a better idea why these infantry models are so expensive (at times at least)?

pthMF (pathfinding related?) with 1-2 ms
might be due our complex terrains (Normandy/Mortain) with low cell size?

parWorldVis with 9 ms (in an AIGrp/AISub) - unsure if this is just due the scoping problems or really from one group
 unreal wagon
knotty igloo
first time i saw it combined with dlcUpd (290 ms)
unreal wagon
knotty igloo
first time i saw it combined with dlcUpd (290 ms)
dlcUpd is separated, because it waits on Steam to write a file
That seems to be due to a change in Steam API, that tries to acquire contended locks and doing file system reads AND writes (Yes, asking if a DLC is owned, results in a file write)
Steam is just being very slow for some reason, which probably means its so busy that it cannot even process the messages that dlcUpd asks for.
We already assumed it as a steam issue, this just confirms it, not much I can do
 unreal wagon
knotty igloo
another case - not sure why it loaded the fonts that moment. the UI was already ...
unreal wagon
knotty igloo
another case - not sure why it loaded the fonts that moment. the UI was already ...
license plate text?
unreal wagon
knotty igloo
even if in MT, 10-15 ms for one/two sound files seems bad. at least with faster ...
Its async... It doesn't turn into a "short lag element"
knotty igloo
unreal wagon
license plate text?
yeah likely
unreal wagon
knotty igloo
PX init for vehicles seems quite intense - possible to MT the init? or distribut...
MT could be possible, for some sub parts.
Would need to know what sub parts cause the lag there.
unreal wagon
knotty igloo
had the mSUGS a few times now with 50+ ms. in this situation there wasnt any dia...
Steam. Sending it statistics for achivements
unreal wagon
knotty igloo
vssCB stalling the main thread - had it a handful of times now
"stalling the main thread" How do you know that?
Main thread is working for BGD3D. Which is two threads further down. Its not waiting for vssCB.
unreal wagon
knotty igloo
oSoSL / slDoL without MT - again first time i saw that one
Not MT able
unreal wagon
knotty igloo
dsr2t - is this PiP? if so, not possible to render it in parallel to "render"/as...
Yes. No.
unreal wagon
knotty igloo
txRsM another first timer - when the briefing of the CO started. no clue how it ...
Freeing VRAM
unreal wagon
knotty igloo
rtm, ogg and wss loaded alongside
It processes user actions, Which's position might be animation dependant, so it might need to wait for the animation to be loaded.
And for some reason that disk read took unreasonably long.
unreal wagon
knotty igloo
preloading the standard A3 inventory UI elements could also avoid some initial l...
I really really really don't care about even a 100ms lag when opening inventory for first time.
You only do that once per mission, and your brain anyway has a bit of lag to transition from first person shootering, to finding where the mouse cursor is and interacting with UI.
unreal wagon
knotty igloo
IndExplo with 12 ms (tank explosion) - 0.3 ms HD but mostly IEde with 11,5 ms in...
spawning particle effects (particle effect init might contain scripts)
and scripted eventhandlers..
The things that are slow for physx. are complex geometries of objects. Either the physx objects themselves, or objects (like rocks) around them
unreal wagon
knotty igloo
That is one thing I optimized.
Then we had cartoon textures on dev-branch.
unreal wagon
knotty igloo
scrVM is scheduled, isnt it? aka should be limited to 3ms - here 113 ms, yet see...
Or something ran a lineIntersects.
Intersecting an object who's model wasn't loaded yet.
So it loads the whole model here. And we can see, there is p3d loading in there, so yeah.
unreal wagon
knotty igloo
possible to get higher subscope coverage for PrxObj to get a better idea why the...
I'd need to see that selected element expanded, to see where the gaps are.
It just animates the object. So probably animation isn't loaded yet, and its loading it in there
unreal wagon
knotty igloo
parWorldVis with 9 ms (in an AIGrp/AISub) - unsure if this is just due the scopi...
scoping problem. You can literally see anotehr aiGrp right below that.
But its weird that it does that, as you can see there is no "parallel" there, there is no job on the worker threads so it should not be switching to another group
knotty igloo
unreal wagon
dlcUpd is separated, because it waits on Steam to write a file
> That seems to b...
whats the reason to do the check contineously - would caching the info open it up to get manipulated during game runtime?
unreal wagon
You can purchase DLCs while the game is running
knotty igloo
could it not still be event based state change? like if normally to check is way quicker, its not needed, but the current ~100ms lag every 10-15 seconds, isnt great. @zenith horizon whats the duration with your hardware and connection?
zenith horizon
Sorry I didn't follow the whole conversation. What do you mean exactly?
knotty igloo
you had mentioned to also seen the steamCbk scope. would need to know the duration (2nd number) on your end
knotty igloo
unreal wagon
MT could be possible, for some sub parts.
Would need to know what sub parts caus...
at times the PX3initO has no subscope info; if it does, also didnt cover much from what i recall - will recheck later
zenith horizon
knotty igloo
you had mentioned to also seen the steamCbk scope. would need to know the durati...
I need to check when I am back home.
knotty igloo
unreal wagon
Steam. Sending it statistics for achivements
so similar situation with steamCbk/updDLC? aka normally should be way quicker?
unreal wagon
yes
knotty igloo

statsSt is new, isnt it? most isnt covered within still - would that be even relevant?

at times there is still this with the separate thread for dlcUpd

mSUGS still happens (to be expected)
unreal wagon
knotty igloo
statsSt is new, isnt it? most isnt covered within still - would that be even rel...
yes. I added new scopes for steam callbacks
Now I know that the fault is actually our code, and not steam
Though mSUGS is unclear still
knotty igloo
mSUGS seem triggered by events, or at least doesnt have some cycle time it seems
 knotty igloo
the steamCbk? if so, in what sense - the duration?
zenith horizon
I am just suprised it's that low this time
Last time I tried in PZKW, this time in VR
knotty igloo
diag_captureSlowFrame ["steamCbk", 0, 0, false, 100];//with UI
diag_captureSlowFrame ["steamCbk", 0, 0, true, 100];//toFile
if you want to get some more samples
zenith horizon
magic 😉
unreal wagon
Ah you modded it.
I know there is a search field supposed to be there, but I don't know why its not working normally
zenith horizon
I added a background first, because that semi transparent one sucks. Then I relasized I can just mod the display and added a search
unreal wagon
I mean the vanilla one is already supposed to have a search, its just not working
zenith horizon
Yeah, it's in config, but not visible 🤷♂️
Can't load Panzerkampfwagen scenario. It crashes the game when loading.
Last line in RPT is
17:16:34 "BIS_fnc_log: [BIS_fnc_preload] ----- Scripts initialized at 11153 ms -----"
knotty igloo
SP/hosted/Eden?
zenith horizon
eden
unreal wagon
zenith horizon
Can't load Panzerkampfwagen scenario. It crashes the game when loading.
Last li...
gib dmp
unreal wagon
Are you running into the cpu count issue in #perf_prof_branch ?
No more than 12 cpu threads allowed
knotty igloo
new observations with v8


can see the MT for sound now
in this case it wasnt moved into a separate thread - may have been a special situation

also MT for wsSet. however the distribution for that one seems no good. it appears you end up always with same duration as if not MT
would need higher subscope coverage to learn why/what parts make up the majority
first part is not covered. middle is very short

the middle may start new (short) jobs below

updAttPJ is again a bigger block
always the same distribution for me
however the scoping seems also a bit weird (at least in this case)

AI was only in a job

sceAI would still be a relevant win if doable somehow. fairly open also couple of ms long for me
unreal wagon
knotty igloo
first part is not covered. middle is very short
uVSs will launch MT work, but only if more than 256 vehicles are in the world. Could it be that you have less?
knotty igloo
vehicles to include infantry or in what classification?
unreal wagon
Yes
knotty igloo
above is from WLs only few minutes - could still be less. can do a count later
unreal wagon
with more than 256 vehicles in the world, some things switch over to MT.
So it doesn't pay the MT overhead, when its too few to be worth it
the updtAttPos is now launched by a worker thread, after it updated the position interpolation on vehicles
The whole block also with async sound is not good enough yet.
Its supposed to overlap over D3D Present
knotty igloo
overall most part of render are nicely covered with MT now. the hudDr in 3d includes unscheduled code/script HUD stuff i think
 unreal wagon
The second part of oPrep, after sceAC was completely overhauled
knotty igloo


a little more detail view

simUI is the only other "missing" here. the composition indicates it may not be doable/help much even if
 unreal wagon
All the drw's there are not well enough optimized yet.
If you zoom in you can see gaps between the multithreading. Like the start of o1Drw
knotty igloo
hudDr detail view

i think you mentioned Prx = proxy. isnt the WH some dummy model, or the actual container (ie uniform model)
unreal wagon
WH is a dummy, that renders its contents using proxies
weapon dropped on ground
I think the fsWTP below it, is related
loading some model and waiting for it
knotty igloo
ok. is it always one to one - or would be say multiple magazines be still one WH? like 10ms is a lot
ok
unreal wagon
multiple items go into one holder
knotty igloo
is this a network message leading to some model loading?


couldnt the stats stuff get cached and sent at mission end/session end?
unreal wagon
no you want to get achivement when a thing happens, not at end of mission where a thing happened
knotty igloo
like i have VDSL with low ping; good local network
well user option to disable achievements? 😄
zenith horizon
Contact campaign. First mission when reaching the green container
 zenith horizon
So yeah, steamcbk causes frequent stutter in the contact campaign.
Reaching the destination of "Move to EW Training Area" task (also first mission)
 zenith horizon
And another one. When the explosion happens in the first mission.

What's this one?
 unreal wagon
zenith horizon
And another one. When the explosion happens in the first mission.
unreal wagon
zenith horizon
And another one. When the explosion happens in the first mission.
Showing me more of them doesn't tell me anything, it just clutters this channel
unreal wagon
zenith horizon
What's this one?
knotty igloo
zenith horizon
What's this one?
near some rock/building?
zenith horizon
Don't recall =/
knotty igloo
the downside of black background 😬
zenith horizon
Nah, downside of trying to enjoy the campaign 😄
knotty igloo
continuing with Attack on Mortain scenario of SPE (3 tank convoy + one APC)

this wasnt mission start/layer activation - maybe the convoy script disabling the engine at times that leads to a reinit of PX for the tanks

preLS either happens rarely or usually very low profile
interestingly last time it was in the first third of the main thread: #1301458792323743817 message
unreal wagon
every 4 or 5 frames
knotty igloo

ssAdv should be a new subscope for sound
has only very little coverage tho. unless anything more can be done, probably wont matter
updAttPJ was split into 2 or 3 jobs here


one concerning observeration for ssAdv in AoM mission - it grew more and more (until i forced respawn). could some faulty scripting lead to that? (adding more and more sounds to the queue?)


 unreal wagon
knotty igloo
knotty igloo
unreal wagon
knotty igloo
knotty igloo
grew up to 50ms
AI is calling for help when unconscious; earlier i noticed too many scripts in scheduled - appears to pile up. as AI was laying for several minutes, may have been also happening in that situation

after respawn back to 3-5 ms (AI calling script reset when dead)
knotty igloo
did one more run on a different SP scenario (more infantry heavy, yet also with vehicles - more a classic CoD stage by stage mission) using total 0.1 trigger - not really new insights
knotty igloo
knotty igloo
winMs with 30 ms - another first timer. no subscopes and no idea how it could re...
only second time i had the winMs to trigger

was a burst of these 3 this time right after another


mSUGS remains a loyal companion - not as frequent as steamCbk/dlcUpd tho

 unreal wagon
Most likely also caused by steam
knotty igloo
getting only these two variants of SteamCbk tho


 unreal wagon
They are steams fault and I will not fix them. You can stop reporting that now..
knotty igloo
first time to see simSW with 600ms. i think it felt like the OS/hardware stalled for some reason (one HDD goes to sleep automatically and gets triggered by sth to wake up a times again [unrelated to Arma])
 unreal wagon
You're throwing so many useless reports at me
knotty igloo
can i judge what useful or not? you can just skip over those not useful
wasnt aware that "dammaged" EH can trigger actually multiple times per frame and same object but wiki states
If simultaneous damage occured (e.g. via grenade) EH might be triggered several times.
as we dont set the EH, nor does A3, probably from XEH again

actually had done a screenshot of the subscope to confirm it
 knotty igloo
first impressions of MT of PX

works very well (all yellow boxes + most big white job boxes are from it) [line 4-6] (only exception in there of yellow is aiAll)
job; 25.90576; 0.81407;"PxsContext.contactManagerDiscreteUpdate" is the white boxes
other MT or async remaining are updAttPJ, aiAll, sound


for render i am not 100% (ldt+odb, URJ) (much for oPasA and some jobs put into main thread with oPrep) and one/some missing due to:
Removed: One rendering optimization (caused objects to visibly flicker, pending further investigation)


cLVis at the end is also still MT+async

TLDR: for PZKW the PX3 MT seems to have stabilized fps on my pc for SP env to 20-25 vs 5-10 before
checking with DS in a bit. probably similar, but client vs DS distribution will be interesting to see
unreal wagon
knotty igloo
for render i am not 100% (ldt+odb, URJ) (much for oPasA and some jobs put into m...
the flicker one was wPrep
your oPasA would use worker threads.
But physx is blocking all your threads already
knotty igloo

from what i understand PX3 is now able to finish its work within the frame, thus the main thread/thus fps is no longer slowed down from it
would be interesting how it compares on your very fast hardware @zenith horizon
ok now falling below 20 (15-20) during close engagement - is EpeFR/left side PX3 of "vehicle simulation" work not finished from the previous frame, or just some other part/type of the PX simulation?

overall seems its more the render that puts me below 20 when getting closer to the town - more and more unique objects to render

 unreal wagon
knotty igloo
ok now falling below 20 (15-20) during close engagement - is EpeFR/left side PX3...
unreal wagon
knotty igloo
ok now falling below 20 (15-20) during close engagement - is EpeFR/left side PX3...
not finished yet
So its still not enough to completely fix the problem
knotty igloo

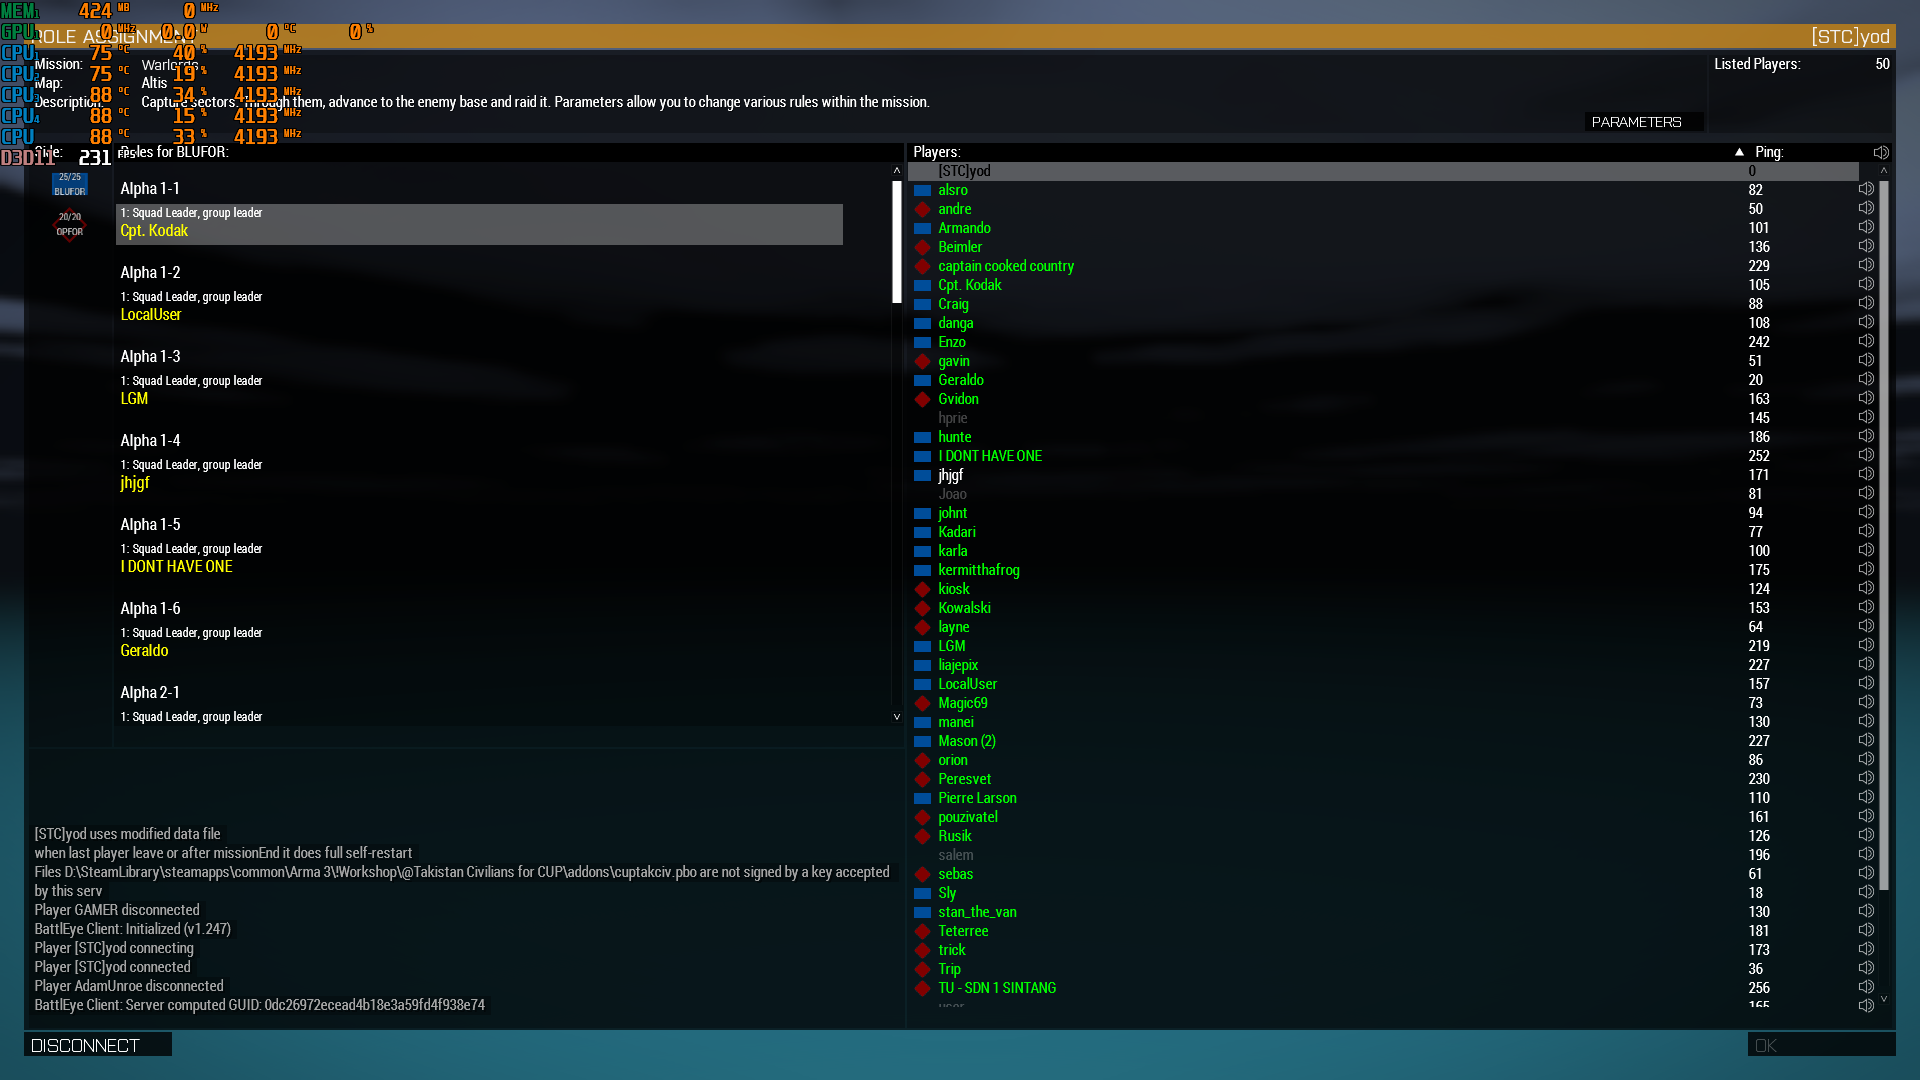
my lobby coming from main menu with -skipIntro (60 fps)

lobby from @keen cypress with same but ~20 fps
IDWat = probably water. maybe due to the 40k rendering distance?
@keen cypress try to turn down your viewdistance settings to very low/1k or sth.
if you play only MP, the client setting (normally) doesnt matter anyway (or does KOTH/Redux allow customization based on your client settings?)
 keen cypress
k
it was regular warlords, 4k maximum
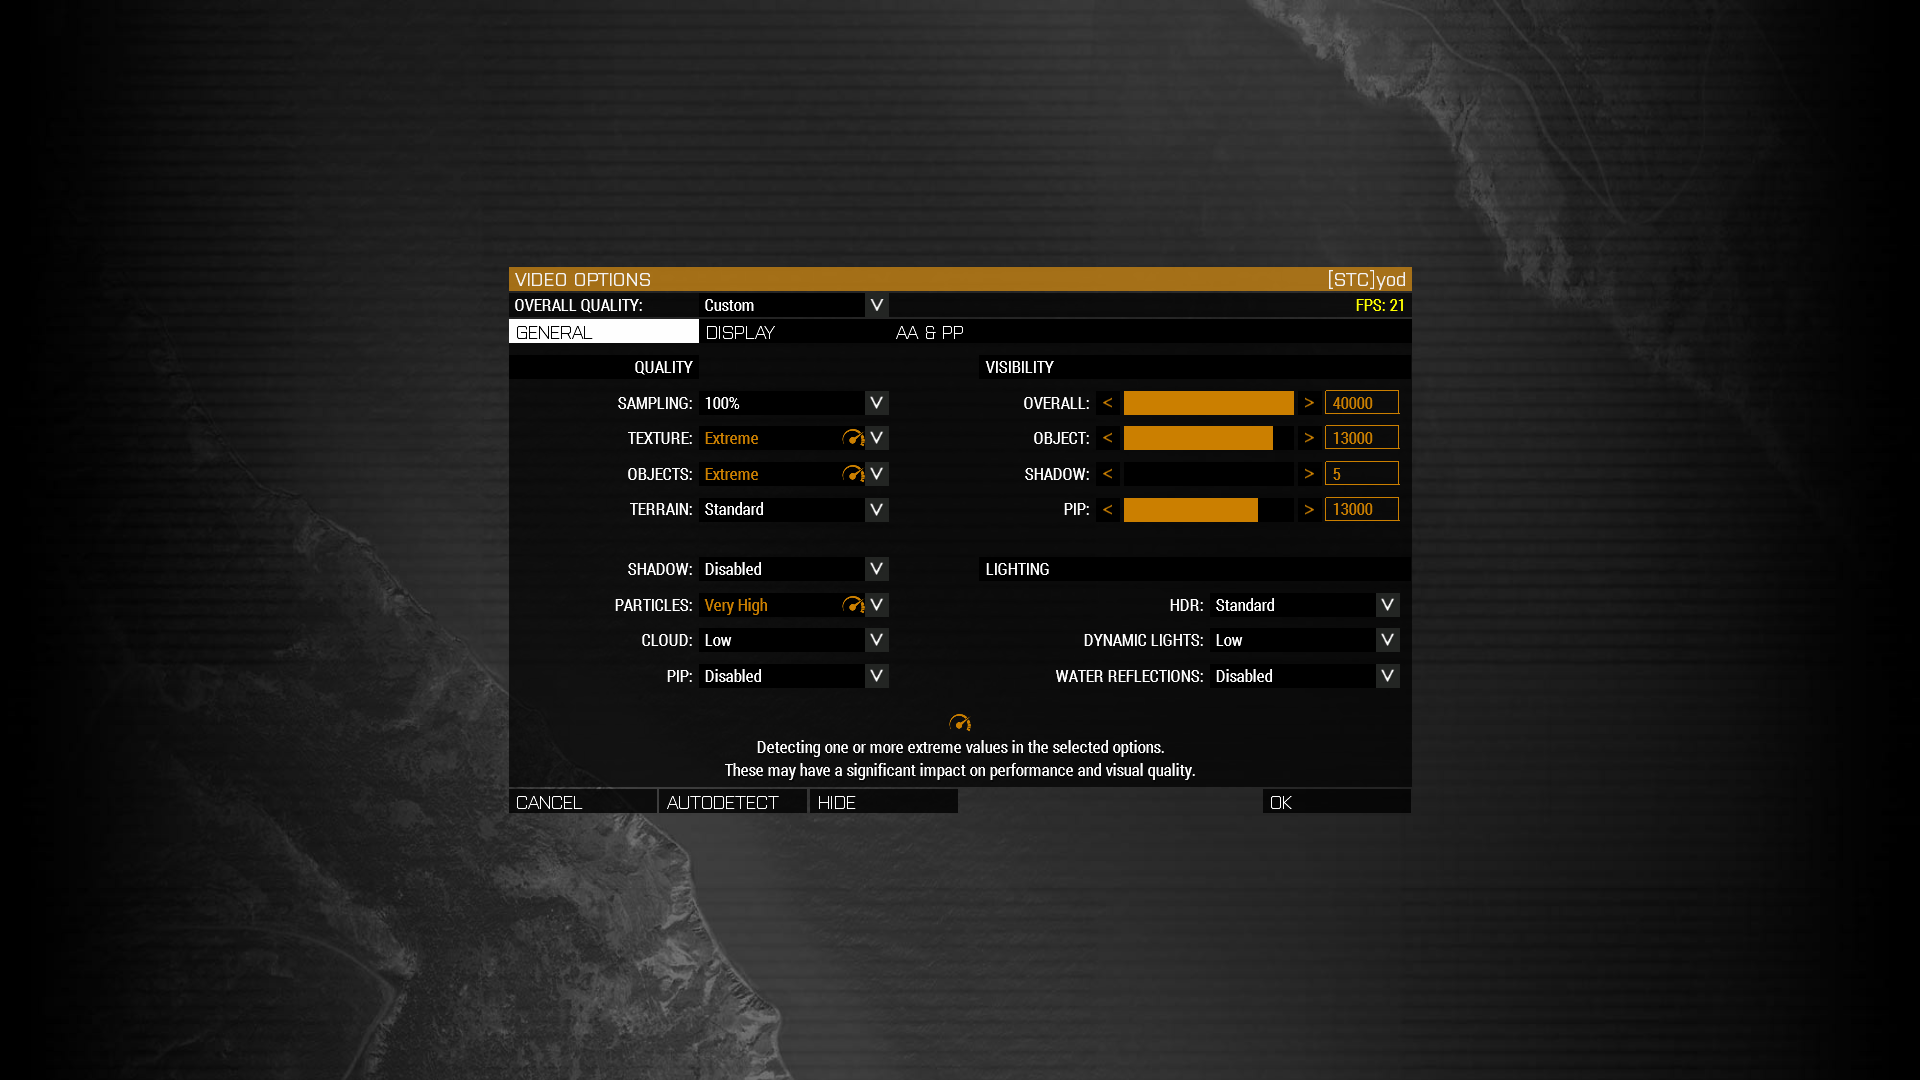
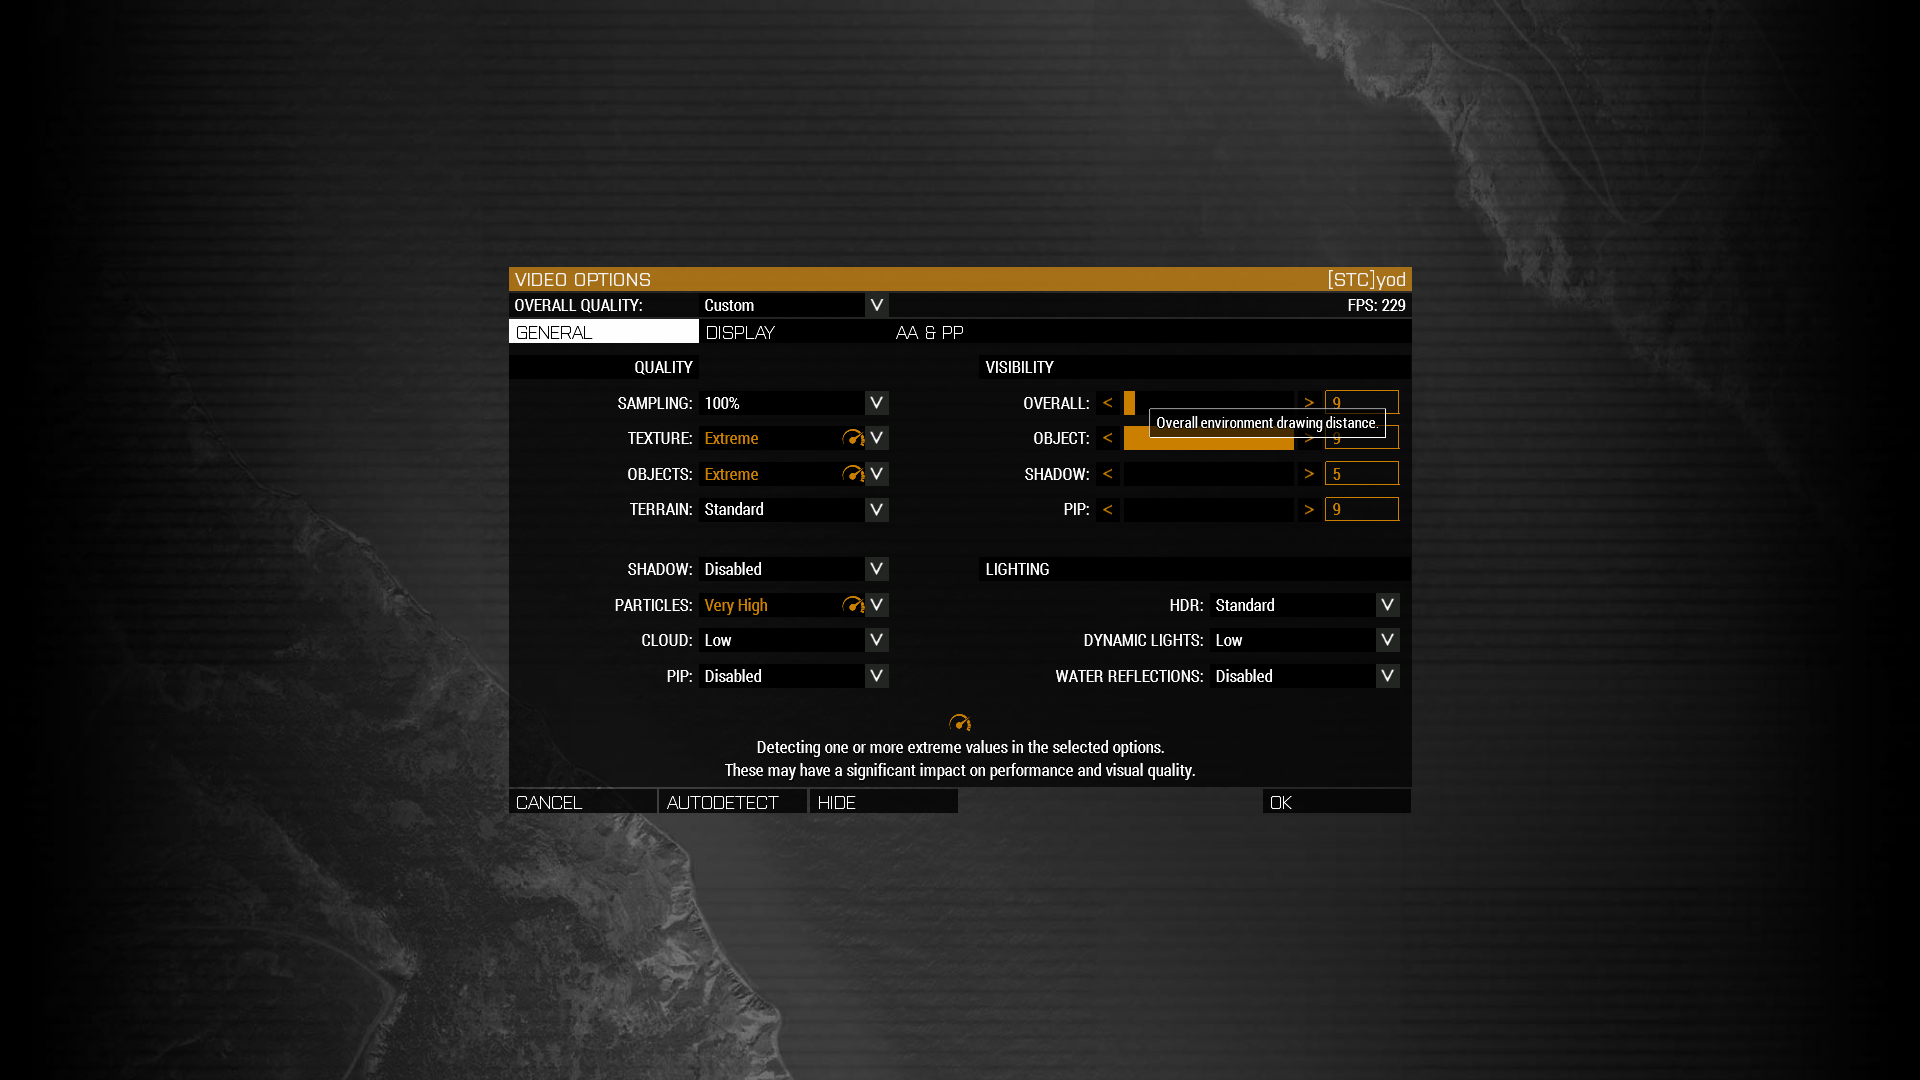
bruh. I didn't think that the viewdistance in the lobby matters, especially if I set 4k (the maximum server rendering is 4k, then fps is 200, and if 40k, then 20 fps, although the server has a 4k limit)
 knotty igloo


a low fps capture from @upper fulcrum of YAAB
lndExplo with 75 ms (of total 100 ms)
it appears the job crtSchedM is related/linked (mostly cLVis visible but the 98% subscopes arent covered)
curious if the engine does LOS checks for nearby entities to get damaged
from what i know indirectHitRange is a sphere and not vectors from the source like with shrapnel
but without knowing what its actually about, its just speculation
unreal wagon
knotty igloo
curious if the engine does LOS checks for nearby entities to get damaged
yes
Something clearly went wrong in the scheduling 🤔
knotty igloo
a little strange observation - it looks like i have very stable 50 fps in this situation:

while sframe still picks up these where the rendering MT optimization or otherwise the rendering MT thread look strange. dunno if thats "normal" - didnt notice that before


will do some more testing to see if this is common/normal
knotty igloo


wSimPXSCo / px3initO at times still very expensive - was rushing fast with the tank along the road. dragged fps down to 10 for the most part


sound in our SPE campaign missions is often very expensive (up to 5-10 ms range) - seems both too many units+vehicle+environment sources, and more complex sound design
knotty igloo
frame capture impressions from our SPE testing last night

17 ms sample of very modern HW - 13 ms on that on render scope (PZKW with 3k VD)


dPr of wPrep lacks MT (also noticed on my captures) - i think its the one currently disabled due to the flickering issues
knotty igloo

in sceACPrx the ppdOT subscope seems to make the majority of the processing time - any insights what its about / what modders could do to optimize their assets could be helpful here.
AFAIK so far the consensus is that number of sections is by far the most important factor. do "proxies" relate to sections, or is it something else?
in simple terms it seems stranges why certain of our models seem so demanding vs others
otherwise noteworthy seems to me:
- 2.7 ms waitBG in hudDr - waiting on render thread? (on the bottom)
- 2,5 ms 3dSwp at the end in wFram (VRAM exhausted?)


pretty much the same compositions from the end of the mission - but only 1000 m VD: wPrep; 4.92244; 1.31025;"maxDist 980, view 1000, obj 1000, shadow 100"
 upper fulcrum
how can i post a diag_captureSlowFrame pic in here like you kju?
knotty igloo
might be a permission thing. try imgur or similar otherwise
upper fulcrum

we did already discovered that or, wasn't dedmen already fixed that?
forget it, dedmen posted it was fault of steam and he cant fix
knotty igloo
not sure. might depend on the type of callback and how frequent it happens


 upper fulcrum
@unreal wagon i posted new observations on thursday but forgot to mark you, sry for that
unreal wagon
knotty igloo
in sceACPrx the ppdOT subscope seems to make the majority of the processing time...
Proxies are proxies attached to objects.
Weapon attachments, proxies on vehicles, best/backpack/helmet attached to unit models
knotty igloo
a few impressions from latest perf branch
if any optimizations could still be found for wSimA, it could have a relevant impact. some observations for that:

while very low/mostly 0ms runtime, maybe waterEffects could be skipped for most objects altogether (or just the scope is set outside the check)

simEai scope adds up - i'd assume nothing to be done but depends what the scope actually contains

cLRSu (and maybe other like cLGSL/etc) - if these could be done in batch and MT as discussed in #perf_prof_branch, there might be some gain possible


cLGnd might be another candidate

wSimEJs should be the new scope - if all these could be via MT or another mechanism, could be another possible improvement

while sound is async, from what i understand, the waitSnd in the main thread still indicates a wait of the main thread as the async part isnt done in time
if this outcome is common, and also true for faster hardware, it should mean optimization of the sound subscopes (wPsn1/2/3 + ssAdv + snCmt) [if possible], could help to reduce the chance/amount of waitSnd [if i got it right]


a good amount of the sound calcs seem to be cal3D/cLGSL


sample overview of MT/job coverage [may be more/less in other situations naturally]

 upper fulcrum
my RPT has in 10 minutes 123.000 lines of this:
23:06:02 StreamSource: ca\shapur_baf\shapur_baf.wrp; TellGFromOffset: 68; WantedOffset: 0; WantedSize: 1615015; ReadedID: 1048592; MapGrid: (64,48); ReadedIndex: 524304
23:06:02 Accessing static object outside landscape (64,48 out of 64,64 - 64,64)
knotty igloo

noticed shdCl (shadows?) as part of rendering - usually its only a ~10th yet maybe the cLUnd are still worth to MT (if possible)

from R3vo's modern hardware (31 ms total) - seem usually in that range
above 0,37 ms sample are also from a modern pc - in my frame captures when its present its usually ~0,2 ms range
unreal wagon
Everything below #1301458792323743817 message
is a "No"
Except the outside terrain thing, which is fixed
 empty star
 knotty igloo
@empty star much is from AI (especially two long thAtE - 1,7 and 1,8 ms) as well as 7 ms preLd
Maybe the async ogg loading caused some wait sync to preLd too:
ldCli; 14.53815; 10.85422;""
ldGdt; 14.53830; 10.85402;""
oggGF; 14.53830; 0.00007;""
oggGD; 14.53916; 10.85284;"0(875804)"
fsARd; 15.13740; 0.01478;"(P0) 6058000:1000:addons\sounds_f_jsrs2025.pbo/explosions\rocket\explosion_far_distance_3.ogg"
...
fsARd; 25.02386; 0.01155;"(P0) 6084000:1000:addons\sounds_f_jsrs2025.pbo/explosions\rocket\explosion_far_distance_3.ogg,explosions\rocket\explosion_far_distance_4.ogg"
The 6,5ms separate Render thread may have caused also some wait sync to main thread otherwise
unfortunately the preLd doesnt have much scope coverage to really tell

context:
Not too technical but I'm having some consistently inconsistent performance only on the profiling branch. Dev and live branches are fine but on profiling I jump all around from 119 fps down to 11, up to 38, then to 90, back down to 22 etc. Tried all mallocs and leaving all launcher parameters at default and nothing changes.
@empty star try to disable JSRS and see if it helps. maybe his sound/OGG design isnt ideal (if related at all)
it would need also more captures to see if this is happening more often (and thus the possible cause for that), or this specific frame capture is unrelated
empty star
knotty igloo
it would need also more captures to see if this is happening more often (and thu...
Gotcha, I'll give it a test later today. Thank you for helping, I appreciate it
empty star
Fascinating, it does seem to be JSRS 2025. After disabling it I get around the same if not better performance than dev build. Since it seems to have nothing to do with the profiling build aside from I guess how the files are read I'll ask LordJarhead about it.
Thanks again, probably would have spent days testing mods and settings if it wasn't for your help
upper fulcrum
my testscenario with a load of mods (with Mods fps down to 29, vanilla only down to 50)

but maybe there is nothing more that can be optimized
another one
zenith horizon
You will first need to figure out what's causing the slowdown.
I'd start looking into the scopes with a runtime > 2ms
In wSim. Maybe you find a hint that leads to a mod.


 knotty igloo
@upper fulcrum
waituSense is AI from what i recall. check the job below it.
scScr/scrVM is scheduled code. it should have a 3 ms limit, yet it can get prolonged by prio requests - ie data loading. EpeFR is physx yet it seems to lack the actual scope for the 6 ms part
the render scope has very little MT. could be just the specific scene tho
knotty igloo
profiling observations - client
 quaint jungle
here's my run
knotty igloo
@quaint jungle i will post my observations in #1422598532237627543
unreal wagon
quaint jungle
here's my run
-maxFileCacheSize=16384
You might be forcing the game to be out of memory already, the second it starts up
-maxvram=8192 -malloc=tbb4malloc_bi_x64 These don't even do anything
quaint jungle
roger that
unreal wagon
19:04:17 Updating base class ->B_Carryall_Base, by a3\weapons_f\ammoboxes\config.bin/CfgVehicles/B_Carryall_khk/ (original a3\weapons_f\ammoboxes\config.bin)
This is wrong and bad.
The vanilla pbo updates its own base class?
Its not supposed to do that..
quaint jungle
I have no idea what mods are doing that base class break...
(I know some mods are doing like that shine... i.e. https://steamcommunity.com/workshop/filedetails/?id=3292165943 but not this time)
but it's works fine with v21 even those fucked config
without mods and no maxFileCacheSize/vram/malloc params for ref
unreal wagon
Try if this one is better? Doesn't work with BattlEye
Are you sure v22 is fine and v23 is not?
Like v23 specifically is the veresion that introduced the problem?
unreal wagon
quaint jungle
without mods and no maxFileCacheSize/vram/malloc params for ref
Wait.
So.. You are still on prof v31. Removed those parameters and now the startup is 24 seconds.
So everything is fixed now?
Ah! Without mods
quaint jungle
unreal wagon
Are you sure v22 is fine and v23 is not?
Like v23 specifically is the veresion t...
I don't know if version 22 is ok, but I remember talking about whether a Linux compiler change affected launching times (although it didn't).
yeah it's with out mods 
I'm trying again so please wait (if you have time)
quaint jungle
unreal wagon
Try if this one is better? Doesn't work with BattlEye
is build v19 with something changes?
(I'm testing v31 with huge mod and param/no wrong params now because I lost my last test preset are not saved)
unreal wagon
quaint jungle
is build v19 with something changes?
That is v32, with one config loading change undone. But that change was I think v26
I looked through all relevant changes in v22 and v23 and cannot find anything that would explain the problem
quaint jungle
quaint jungle
quaint jungle
I don't know if version 22 is ok, but I remember talking about whether a Linux c...
this is it
I'm still testing the launch of v31. It takes about 15 minutes...
unreal wagon
Well by that point it alreay is a failure right? so might aswell abort there
quaint jungle
that right. I'll test v32.
wow! v32 are too fast!
but is it actually v32? It says 2.20.153200 and I think this build number was v19.
unreal wagon
My build numbers are fake because I don't update them
So me removing my performance optimization, fixed your launch times..
But it still doesn't make sense, that performance optimization first appeared in 153290, which is v27.
Why is v23 slow, it didn't have that
quaint jungle
I understand. But either way, this v32 is working fine.
but the captureFrame log was output as 0kb though.
Should I try the v22/23 ?
unreal wagon
I'd like to know v23 and the real v32 (Just pushed to steam now)
But not needed today
I expect v23 to actually be fine? and v32 to be bad
quaint jungle
ok :)
thanks so much
oh I forgot to say the one of bug
this is my latest tested rpt with v32(test ver)
but capture frame is not logged
it's shows 0kb and 1kb (one byte is only logged the ])

Yes, the loading speed does actually decrease in v23 and v22, and the degree of the decrease seems to be the same as up to v31. (I stopped launching it midway through.)
I'll try the v32 (released ver) next
quaint jungle
unreal wagon
I'd like to know v23 and the real v32 (Just pushed to steam now)
But not needed ...
The release version v32 is not works fine!
Its loading speed is the same as v31 with huge mods.
Maybe the release compiler or something is different?
It seems like the function to increase loading speed isn't properly implemented.
unreal wagon
quaint jungle
The release version v32 is not works fine!
Its loading speed is the same as v31 ...
Just a missunderstanding.
The build I sent is v32 PLUS additionally, removing the config loading change.
It is not in v32 itself, that was something I did extra on top. So that will be v33
quaint jungle
Ummm why is loading slower in v32 (public version)... v32+ (Test version) are fine for me.
unreal wagon
because v32+ has the fix, and v32 public version doesn't
quaint jungle
Oh sorry, I see. So that means this might be implemented in v33 tomorrow or later of some day right?
unreal wagon
yes. Tomorrow maybe
quaint jungle
thanks so much and I'm so happy it's fixed
upper fulcrum
when i play online Domination on Tanoa i got massive frame drops from 120 down to 40 only by facing on one specific direction. i caputerd it with -sframe

what is hudDr; 12.38334; 6.74506; ?
knotty igloo
@upper fulcrum hudDraw (draw uiEH) - would need sqf profiling why so excessive
however to me it looks like the rBatch is actually defining the fps/frame length - albeit not by much
with total being 22ms, this should be ~50 fps - aside from the hudDr you would need make a frame capture when at 120 to see whats the big difference
what that rBatch is about and if the frame capture here indicates a potential problem, only Dedmen can assess
hudDraw (draw uiEH) - would need sqf profiling why so excessive
ie could be poor coding, or just many elements visible to draw. doing 2d and 3d ui elements via sqf is generally very slow - we had to come up with various optimizations to limit the impact. only engine access to the native engine ui system could help with that, yet it may or may not be some effort to expose that to sqf (or other reasons speaking against doing that)
upper fulcrum
i can provide a capture with the 120 fps and at the same position one with 40 fps when turning to another direction
120 FPS looking south on Tanoa Domi with -frame
40 FPS looking north on Tanoa Domi with -sframe
i can provide some more with low fps if wanted
the next/last is captured with -frame instead of -sframe like the 3 before
maybe this helps but maybe not. i will stop now because i dont want do spam
and now i have a crash

ok i stop
unreal wagon
upper fulcrum
waitBG. Waiting for the GPU rendering to get done.
Probably there are just lots of objects to render.
unreal wagon
knotty igloo
<@229661410483896320> hudDraw (draw uiEH) - would need sqf profiling why so exce...
hudDraw (draw uiEH) - would need sqf profiling why so excessive
no
unreal wagon
knotty igloo
<@229661410483896320> hudDraw (draw uiEH) - would need sqf profiling why so exce...
however to me it looks like the rBatch is actually defining the fps/frame length - albeit not by much
No
upper fulcrum
are those captures help you in any way or is providing them a waste of time for you/me/all of us? if so then i will stop to post them when not useful
unreal wagon
no