#perf_prof_branch
1 messages · Page 21 of 1
 weak panther
 whole cloud
probably not on profiling so you can't do a frame capture for me?
weak panther
whole cloud
probably not on profiling so you can't do a frame capture for me?
You right sorry, probably I didn't wait for update to be installed, on the second launch I saw some particles and then got the status violation
whole cloud
If you got a crash then please send me the crash report
whole cloud
⚠️ v29 was replaced with 2.18.152842.
Crashfix for ui2texture @thin wyvern
Crashfix for netcode @fast hornet
 vale shoal
whole cloud
⚠️ v29 was replaced with 2.18.152842.
Crashfix for ui2texture <@144900100726980...
vale shoal
whole cloud
⚠️ v29 was replaced with 2.18.152842.
Crashfix for ui2texture <@144900100726980...
Hi! I've also sent you a crash dump a couple of days ago. But I don't know if its still relevant. Just wanted to give you a heads up to it.
whole cloud
Ah yeah you are too far down the unread DM's stack
 foggy vine
Particles are gone after I went AFK for a bit, died from AI, picked another slot in lobby, and spawned in
Got RPT on Gist if it's needed
GPU usage is on 100%?
Goes away after a bit when I Alt+Tab back into the game and wait a while, but comes after another Alt+Tab out of the game
Got my FPS back after another re-slotting along with my proper GPU usage and FPS more than 1
whole cloud
foggy vine
Goes away after a bit when I Alt+Tab back into the game and wait a while, but co...
The gpu usage, or the particles?
foggy vine
GPU usage
With working particles and no lag spikes from GPU usage:
Around 50% GPU usage when I'm moving mouse around like a maniac with zoomed-out FoV, but I haven't checked my usual GPU usage on stable for comparison. No smokes or grenades deployed
I guess LoD taking effect on grass mostly when I'm approx 5-10 meters in front of it is intentional/known? 🤔 I've seen a fair bit of LoD popping up out of nowhere on objects I'm rather close to
whole cloud
probably intentional
 restive pilot
foggy vine
With working particles and no lag spikes from GPU usage:
Around 50% GPU usage wh...
restive pilot
foggy vine
With working particles and no lag spikes from GPU usage:
Around 50% GPU usage wh...
I think I've seen this issue when you pass invalid stuff to the GPU
foggy vine
Such as?
restive pilot
not sure but I think invalid floats was one (NaN, Inf, etc)
 heavy vortex
This is task manager GPU usage?
foggy vine
Yeah
restive pilot
at what frequency tho? is it maxed out?
heavy vortex
I would guess it just asks the driver these days.
foggy vine
https://i.imgur.com/kdFh6M7.png this is what I've been looking at instead of the Performance tab at the time of it happening unfortunately
heavy vortex
wallpaper32.exe 👀
foggy vine
Related or just something that caught your eye? :P
https://i.imgur.com/D5xOz9U.png 3D peak value is me zooming in on a hill ~1.5 km away from me with 3km view and object draw distance
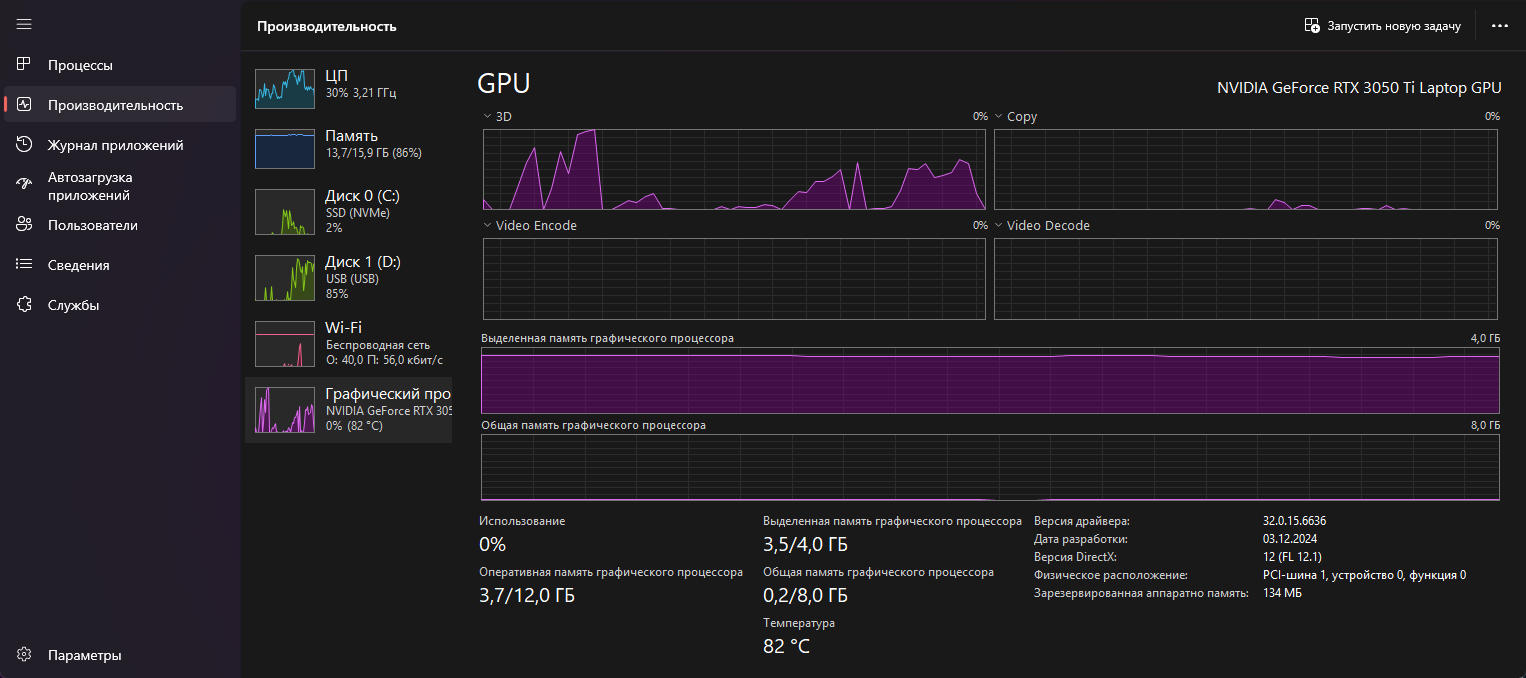
The 0% usage is me alt tabbing out of Arma, then alt tabbing back and looking without zooming in
adapter description : NVIDIA GeForce RTX 3050 Ti Laptop GPU 🤷♀️
 lean light
foggy vine
https://i.imgur.com/D5xOz9U.png 3D peak value is me zooming in on a hill ~1.5 km...
lean light
foggy vine
https://i.imgur.com/D5xOz9U.png 3D peak value is me zooming in on a hill ~1.5 km...
Maybe thermalthrottle?
foggy vine
Hmm. Would it display 3D usage like that from thermal throttling only in that case?
lean light
My english not so good so ->
||Видеокарта может троттлить, сбивать себе частоту до ~50%, арма утилизует всю достпную мощность и диспетчер показывает 100%. Проверь через MSI afterburner OSD. Там видно будет действительно ли игра выжирает всю мощность, или это термотроттл. @foggy vine ||
foggy vine
Good point, thanks. Forgot that exists
 magic elm
DM'd my crash reports from yesterday on the previous v29
 woven loom
foggy vine
I guess LoD taking effect on grass mostly when I'm approx 5-10 meters in front o...
woven loom
foggy vine
I guess LoD taking effect on grass mostly when I'm approx 5-10 meters in front o...
Yup, it's common
woven loom
foggy vine
With working particles and no lag spikes from GPU usage:
Around 50% GPU usage wh...
Pretty typical honestly, Arma 3 is limited by the CPU's performance
Look at the sky for high GPU usage 😄
Also keep in mind the GPU might downclock to save power, in which case GPU usage may jump higher. And then when it clocks up again, GPU usage will drop.
foggy vine
Hm, true. You learn something new everyday
magic elm
152842 fixed the Headless Client issue we were having, running smoothly now
Vehicle smokes arent appearing though for us
Like the smoke grenades
heavy vortex
What, like consistently failing to appear for everyone on the server?
 light cargo
task manager reports % incorrectly because it bases it on power scheme and stuff like that
process explorer or process hacker or gpu-z show the real usage
woven loom
Or HWINFO
light cargo
hwinfo is primarily for temp sensors not for % usage of cpu/gpu
 swift narwhal
A friend of mine reported he got his particle effects working again after lowering his view distance. Had him repro by upping and lowering again.
Maybe this is useful Information 
 azure jewel
I love this update
 whole cloud
swift narwhal
A friend of mine reported he got his particle effects working again after loweri...
whole cloud
swift narwhal
A friend of mine reported he got his particle effects working again after loweri...
So upping it, made them disappear?
Maybe that's why I can't repro, maybe I have different view distance than the affected people
 inland dew
looks like higher draw distance = no particles
lower draw distance = particles are present
but overall/terrain or exactly/only objects distance and what's the exact value and particles quality setting 
swift narwhal
whole cloud
So upping it, made them disappear?
I just asked again to be sure,
he didn't repro like i asked.
But lowering view distance definitely fixed his missing particles.
I'll ask him to try playing around with his view distance later this evening and see if particles go missing again on higher view distance.
 potent sparrow
azure jewel
I love this update
potent sparrow
azure jewel
I love this update
what basic.cfg are you using if you don't mind - I played with the network settings years ago and stuff has worked fine since so much so I don't have a clue what the values should be for the profiling branch anymore 😄
whole cloud
I need to find a way to make the particles disappear.
Not a way to fix it after they've disappeared
inland dew
swift narwhal
I just asked again to be sure,
he didn't repro like i asked.
But lowering view...
ask what's particles quality is set to and whether only objects distance and/or overall/terrain distance affect that
it's a big difference
be as specific as possible, so dedmen can finally repro, thus fix it
whole cloud
That issue goes back till 2.16, a year ago.
And we weren't aware of it until you reported it now 
 wise sparrow
Huhh, interesting 😄
 fading seal
Are these client side improvements supposed to work with proton and/or older CPU tech (Ryzen 2700x (zen+))? I haven't seen any big difference compared to a year ago. As soon as the AI or I get in a battle or inside a town the fps tanks to like the 20-30 range. This is with just me playing and using a (remote) dedicated server to offload the mission and AI. Could be the DLC content/mission/mods but I guess I'd ask before trying to find a problem.
inland dew
ryzen 1000-3000 are very very bad in arma in general
fading seal
It's kinda frustrating seeing the CPU sitting at low-ish utilization and the GPU at like 30-40% 😆
inland dew
check per core and not whole cpu
fading seal
I know, none of the threads or cores are being used to their full potential
 pseudo zealot
Just popping in to say the work in this space is amazing, can't believe the performance increase this gives 🤘
whole cloud
fading seal
Are these client side improvements supposed to work with proton and/or older CPU...
yes. I don't check what CPU you're using to then turn off all improvements 😄
fading seal
this is me just sitting at the edge of the map with some random AI patrolling
(can't upload a normal image for whatever reason 🤨)
whole cloud
capture frame to see what its doing
I assume you're unhappy about the high cpu usage
 patent sky
low in this case, seems like some sort of frame limit is going on
fading seal
whole cloud
I assume you're unhappy about the high cpu usage
yeah low CPU usage mostly
whole cloud
95% on main thread? looks normal to me
fading seal
the 95% load of the main process isn't reflected on any of the cores though. It should show at least 1 core bar thingy near fully filled
I have a captured frame, how do you want this data?
whole cloud
can just drop the .trace file in here
whole cloud
fading seal
the 95% load of the main process isn't reflected on any of the cores though. It ...
Not if the scheduler keeps moving the threads between different cores.
The core display on top is averaged
fading seal
it seems I can't upload files here?
patent sky
fading seal
it seems I can't upload files here?
gotta accept the #rules iirc
fading seal
ah.. been here for years but I guess new rules lol
the thread scheduling thing seems kinda probable I guess
whole cloud
The frame looks okey. All looks like expected
 thin wyvern
For proton users https://www.phoronix.com/news/Proton-10.0-Beta-Released
Valve and CodeWeavers today announced the much anticipated beta release of Proton 10.0 as the newest version of their downstream version of Wine that powers Steam Play for running Windows games on Linux.
fading seal
I've been using experimental so I guess that doesn't matter much (for me anyway)
fading seal
whole cloud
The frame looks okey. All looks like expected
Alright thanks. 🙂 I guess it's just too slow to benefit from the optimizations 😢
Well I could get rid of most mods and see if that improves anything
potent sparrow
fading seal
Alright thanks. 🙂 I guess it's just too slow to benefit from the optimizations ...
I had a 2700X before I upgraded - I feel your pain, it was an excellent CPU for it's time generally but it ran arma like a drunk one legged man
slap a 5700X3D in that bad boy and you should see a significant uplift, arma really likes the improved IPC but it really likes the X3D's
from a while ago (running mainline with full modset I used at the time)

see bottom two for X3D vs nonX3D (have a 7950X3D for ref so I can actuall bench X3D vs non X3D by pinning)
fading seal
Neat, yeah I want to upgrade the CPU at some point. Just waiting for a better deal I guess 😛
potent sparrow
between the non X3D and X3D CCD there is a 23ish % uplift on X3D despite the X3D CCD locking at a lower freq than the non-X3D
neither was thermal throttling (a 420mm RAD in a 7000D means throttling isn't a thing to worry about tbh)
 fast hornet
arma just really really likes the big L3-Cache.. 🙂
(and so does Factorio btw.)
potent sparrow
pretty much all games do - it's almost the perfect fit between use case and use - much less of an uplift on other types of software but that's why I love the heterogeneous CCD's on the 7950X3D/9950X3D - "Do you want productivity or gaming?" and AMD just pulled a "why not both" card
inland dew
please -> #hardware_vs_arma
fading seal
no mods, in the editor, edge of Altis looking at the sky and the GPU is still sitting at 40%. I guess I'll play the Virtual Reality map at 400 fps with 99% GPU usage haha
fast hornet
on another note, 152842 has been running great for us for the last 24h. Seems to be a "good" version 😄
potent sparrow
fast hornet
on another note, 152842 has been running great for us for the last 24h. Seems to...
Same, We beat on it with a hammer last night (I have a training mode on our zeus server that spawns a collosal amount of AI dynamically (and continuously as it gets killed) with a lot of automated waypoints and stuff - I use it for testing since it stresses the server more than most zeus ops would - took it like a champ
whole cloud
I'd have fun in seeing some bandwidth statistics with a server setting sockets/maxBandwidth to a higher value and blasting clients with data 😄
I topped out at 80MB/s but maybe a proper server can reach more?
fading seal
thin wyvern
For proton users https://www.phoronix.com/news/Proton-10.0-Beta-Released
Gave it a try, realizing that experimental isn't the same thing (wine 9 vs 10 etc). The only difference I'm noticing is that the little launcher dialog thingy starts centered on screen instead of the bottom and the sun (and rays) seem to render differently (could be placebo or a little shift in time or whatever but it feels different)
No difference in performance (for my under powered system anyway)
(and mouse capturing is different, I have to click now before it captures after moving from different monitor (using dwm as my window manager))
potent sparrow
whole cloud
I'd have fun in seeing some bandwidth statistics with a server setting sockets/m...
I mean maybe but my dedi would cap at 120MB/s under perfect conditions - you are limited by the technology of your time 😉
inland dew
fading seal
no mods, in the editor, edge of Altis looking at the sky and the GPU is still si...
view distance 500 m and here goes your gpu usage.
view distance higher = cpu/ram limit
fading seal
inland dew
view distance 500 m and here goes your gpu usage.
view distance higher = cpu/ram...
I wish, even at 500m I'm CPU limited. Setting object view distance to 1 bumps up the FPS a lot but GPU still just chilling.
I guess a tiny silver lining is that I can run at 200% render resolution with barely any FPS drop lol
fast hornet
well, your CPU was already not great when it released and by now it's ancient as well. You won't get better performance in Arma with it.
fading seal
Yeah and I guess the proton overhead, if any, doesn't help much either
 spiral pond
Any meaningful way to monitor/compare the network throughput after the rework? (besides basic in and out max)
whole cloud
the out max, would now be able to go higher, if the server needs it
 knotty wraith
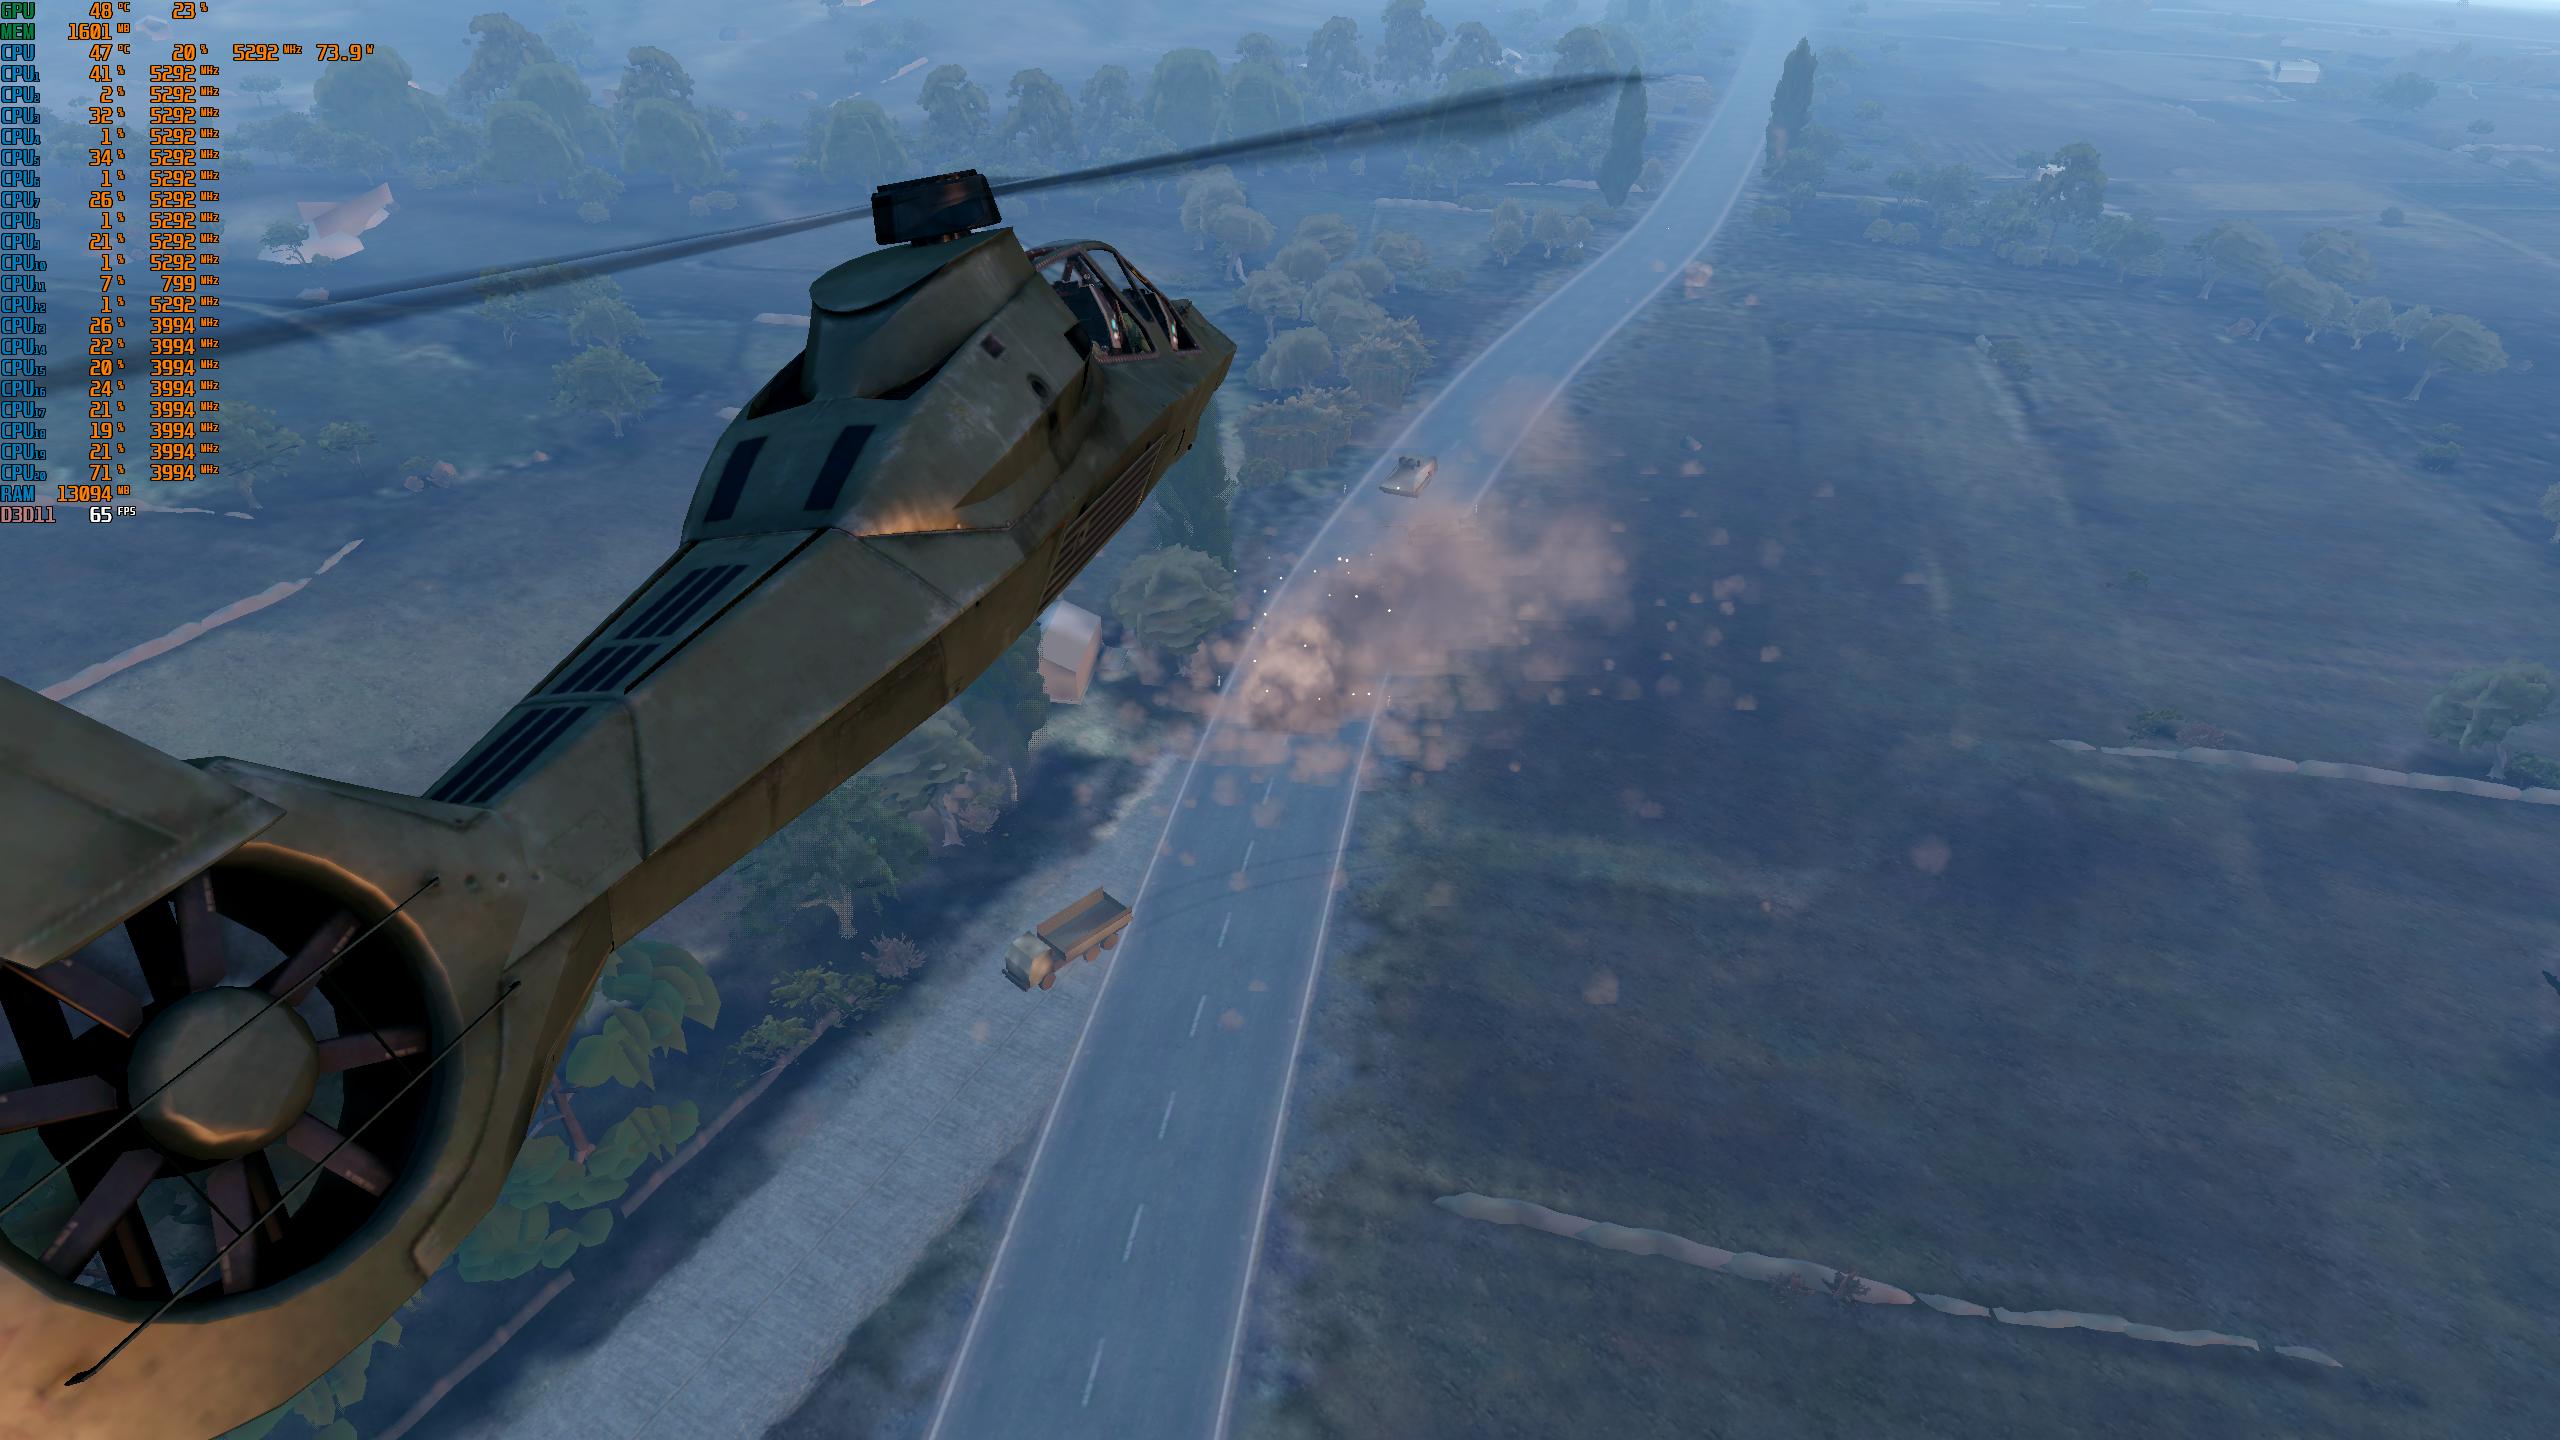
for some reason the game on 14th generation Intel processors loads only one thread - the latest and most inefficient one, with the lowest frequency
and in general only E cores are involved
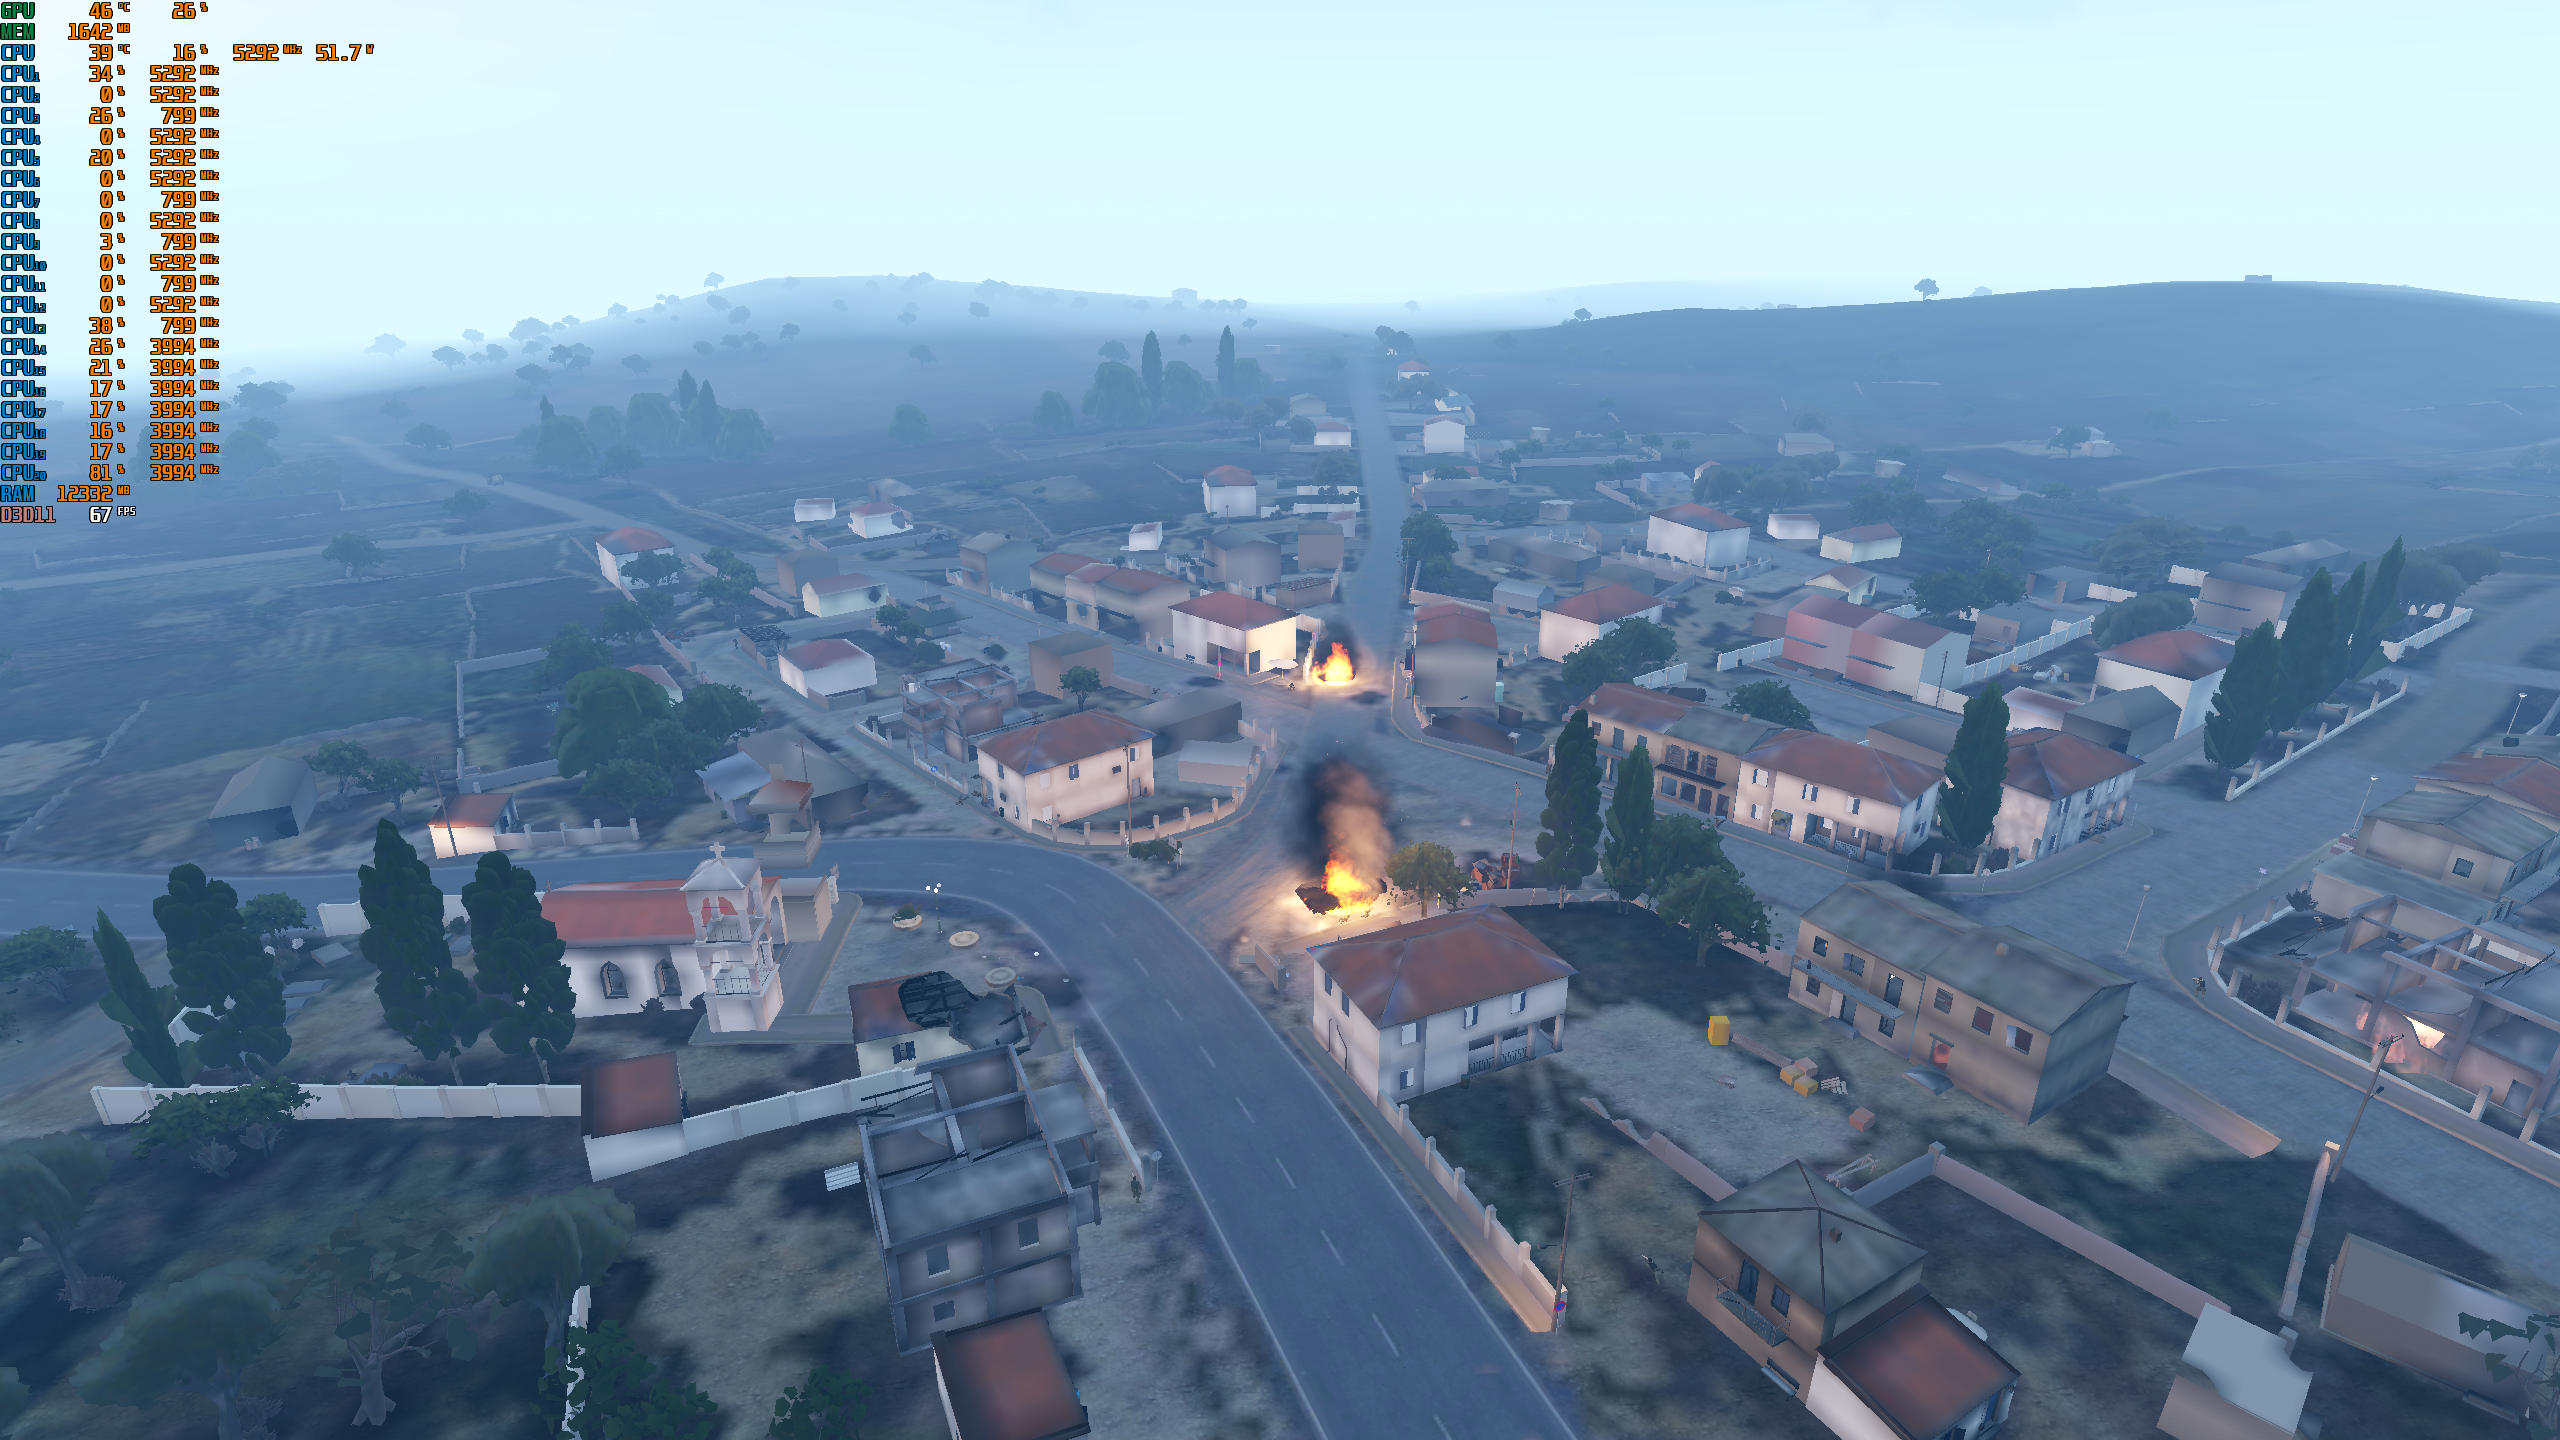
I've been looking for a solution all these days, finally found it - disabling E cores in the BIOS... But I was shocked in the first days, why the game chooses the latest and most ineffective thread and only E cores
whole cloud
The game doesn't choose anything, it lets the operating system choose
But maybe start parameter helps the.. the thing that sets the gaming thread flag -setThreadCharacteristics?
That tells windows, that the threads are for "Gaming"
knotty wraith
https://imgur.com/QscgrCh
it didn't work
 whole cloud
@wise sparrow I tracked the issue back to 2.12, from february 2023. Its still broken all the way back then.
I don't know whats going on there.
I have also seen youtube videos from 2/5/9 months ago, where it works fine.
But I tested over a dozen builds back till 2.12 and it was broken for me in all but one, and that one I retested and it was broken again on second try.
Either QA (and everyone else?) missed this for over 2 years, or something outside of Arma has changed  (and the 3 youtubers who's campaign gameplays I've watched don't have whatever that is)
knotty wraith
I suspect that Windows 11 will solve this, but I don't really want to check it)
https://imgur.com/UTT4lfJ
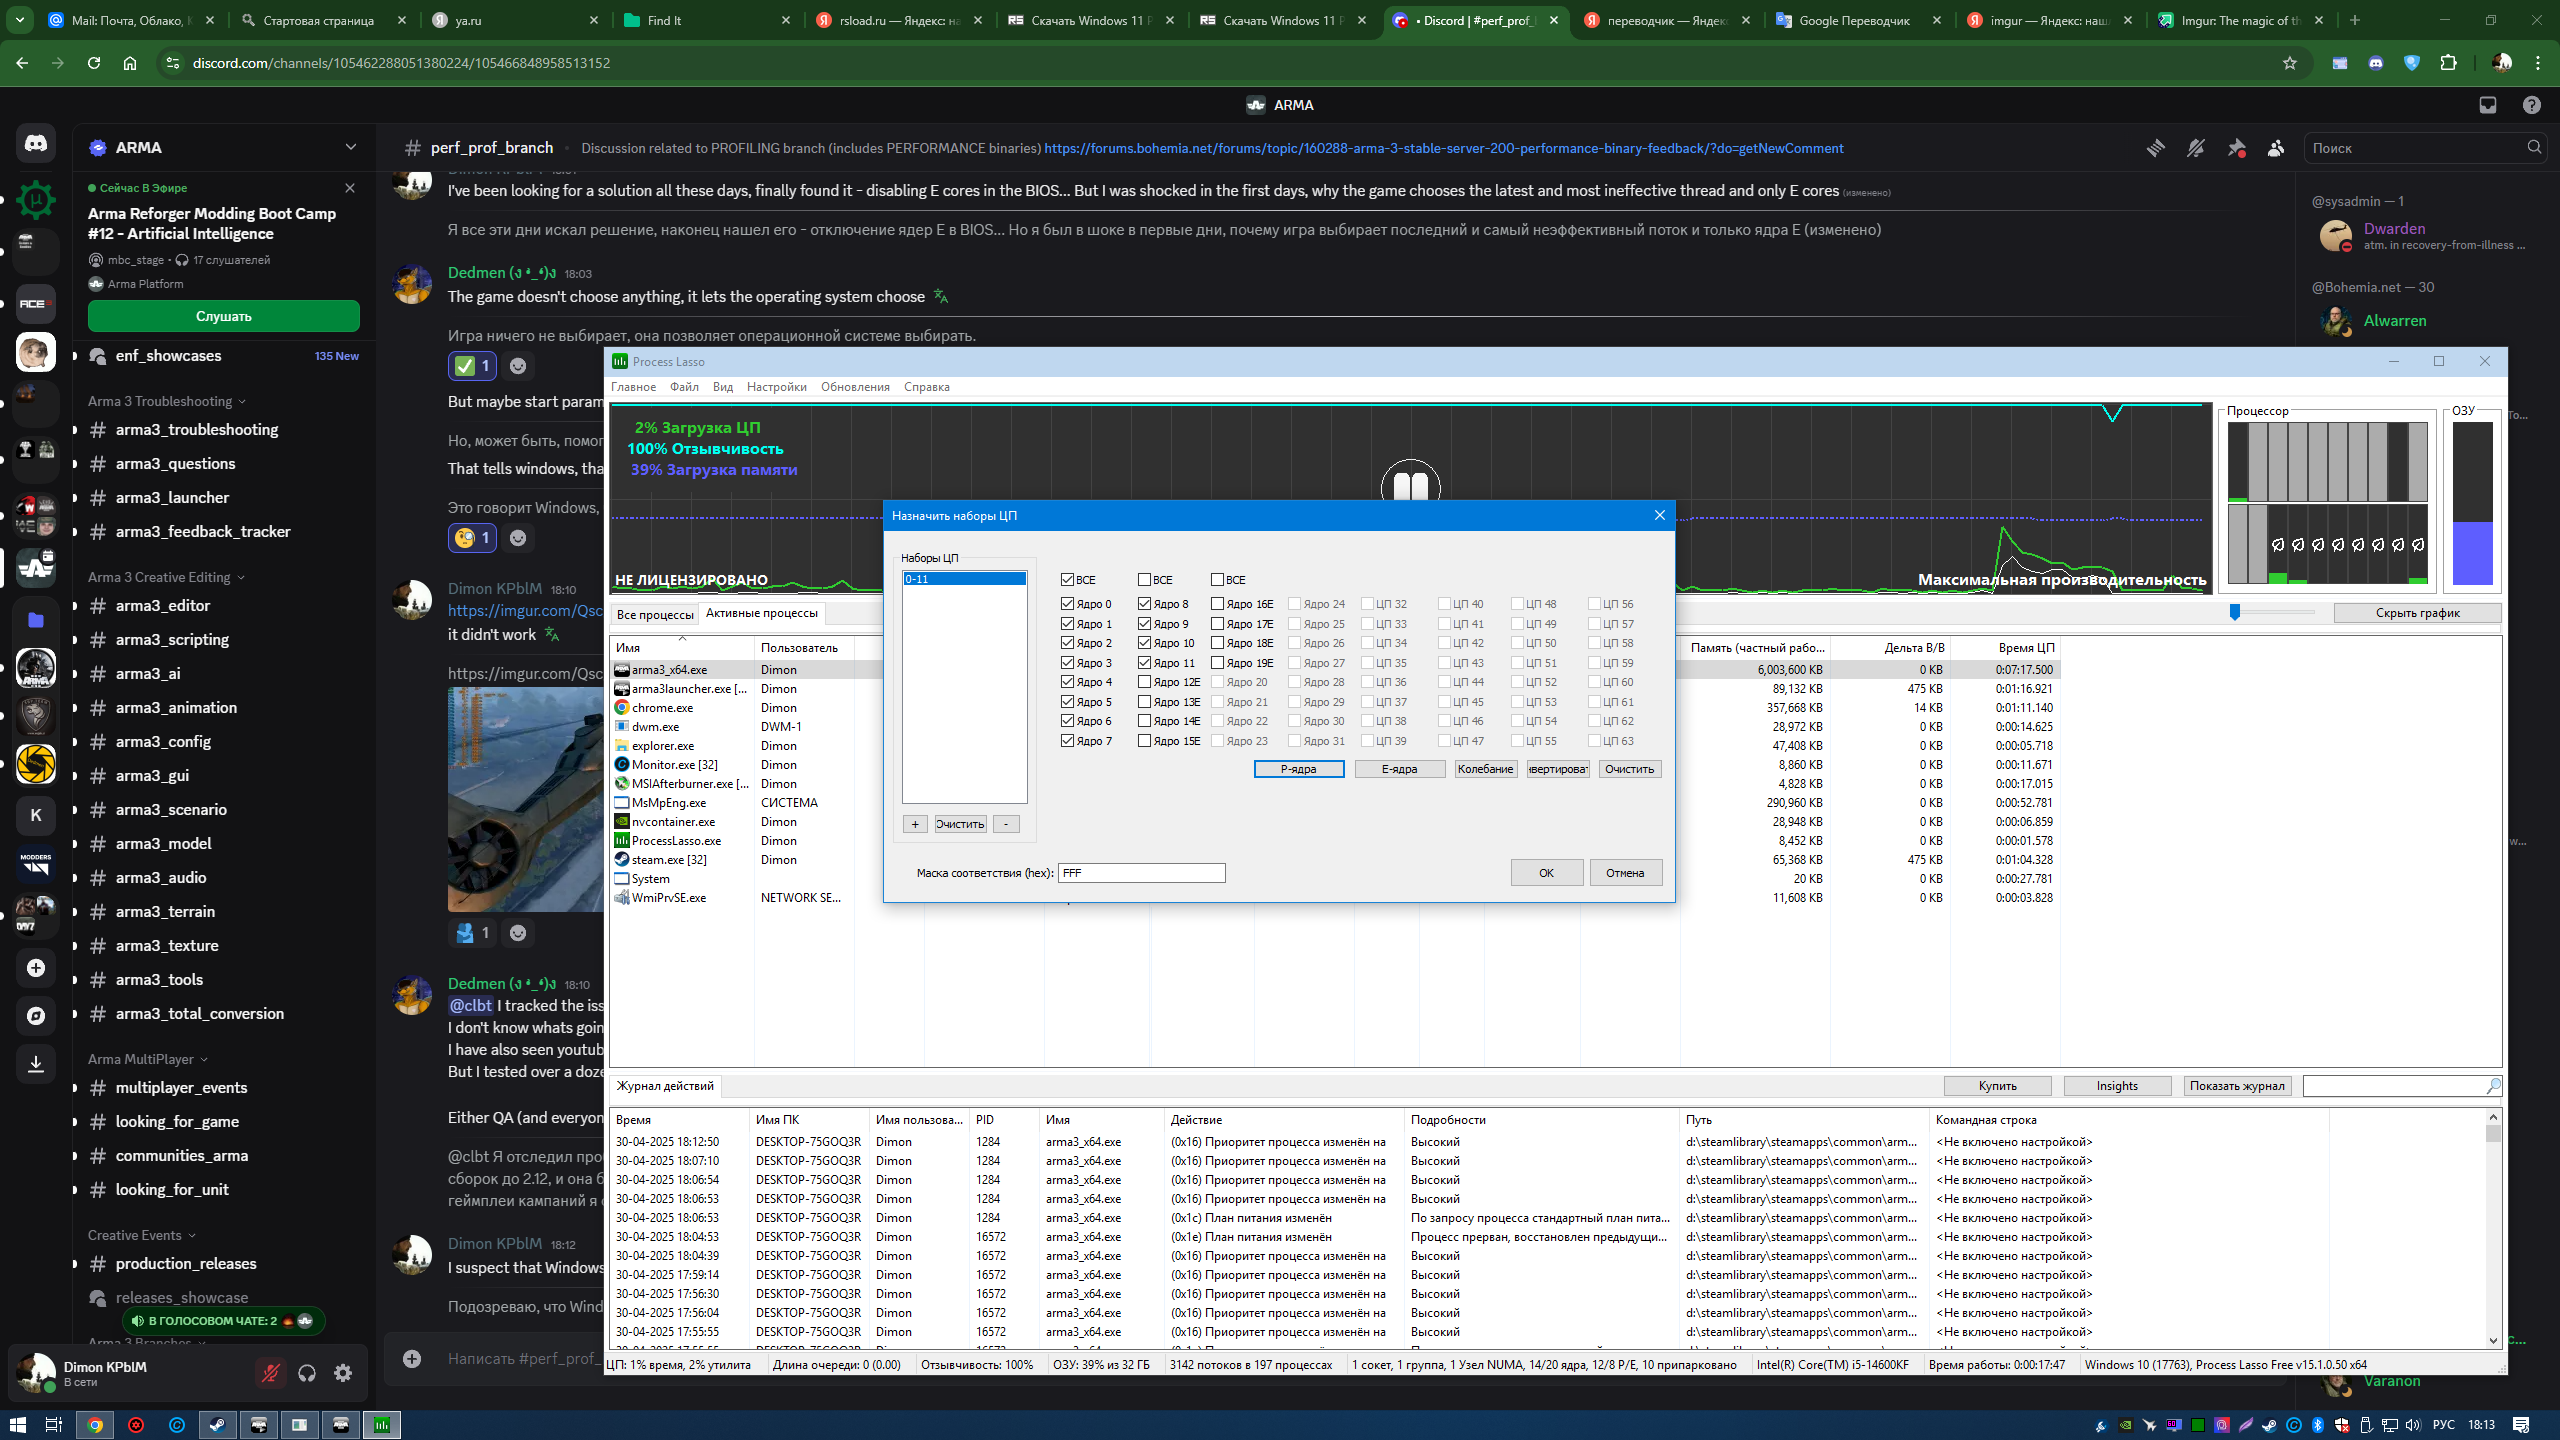
another fact is that simply disabling cores in Lasso doesn't help, terrible lags
 whole cloud
If you disable cores, you need to use -cpuCount parameter to tell the game about how many cores it has left.
It can detect how many cores you have, but not if any are disabled
 gritty wasp
first rule for any modern intel CPU: Disable HT and all E cores and forget.
potent sparrow
knotty wraith
I've been looking for a solution all these days, finally found it - disabling E ...
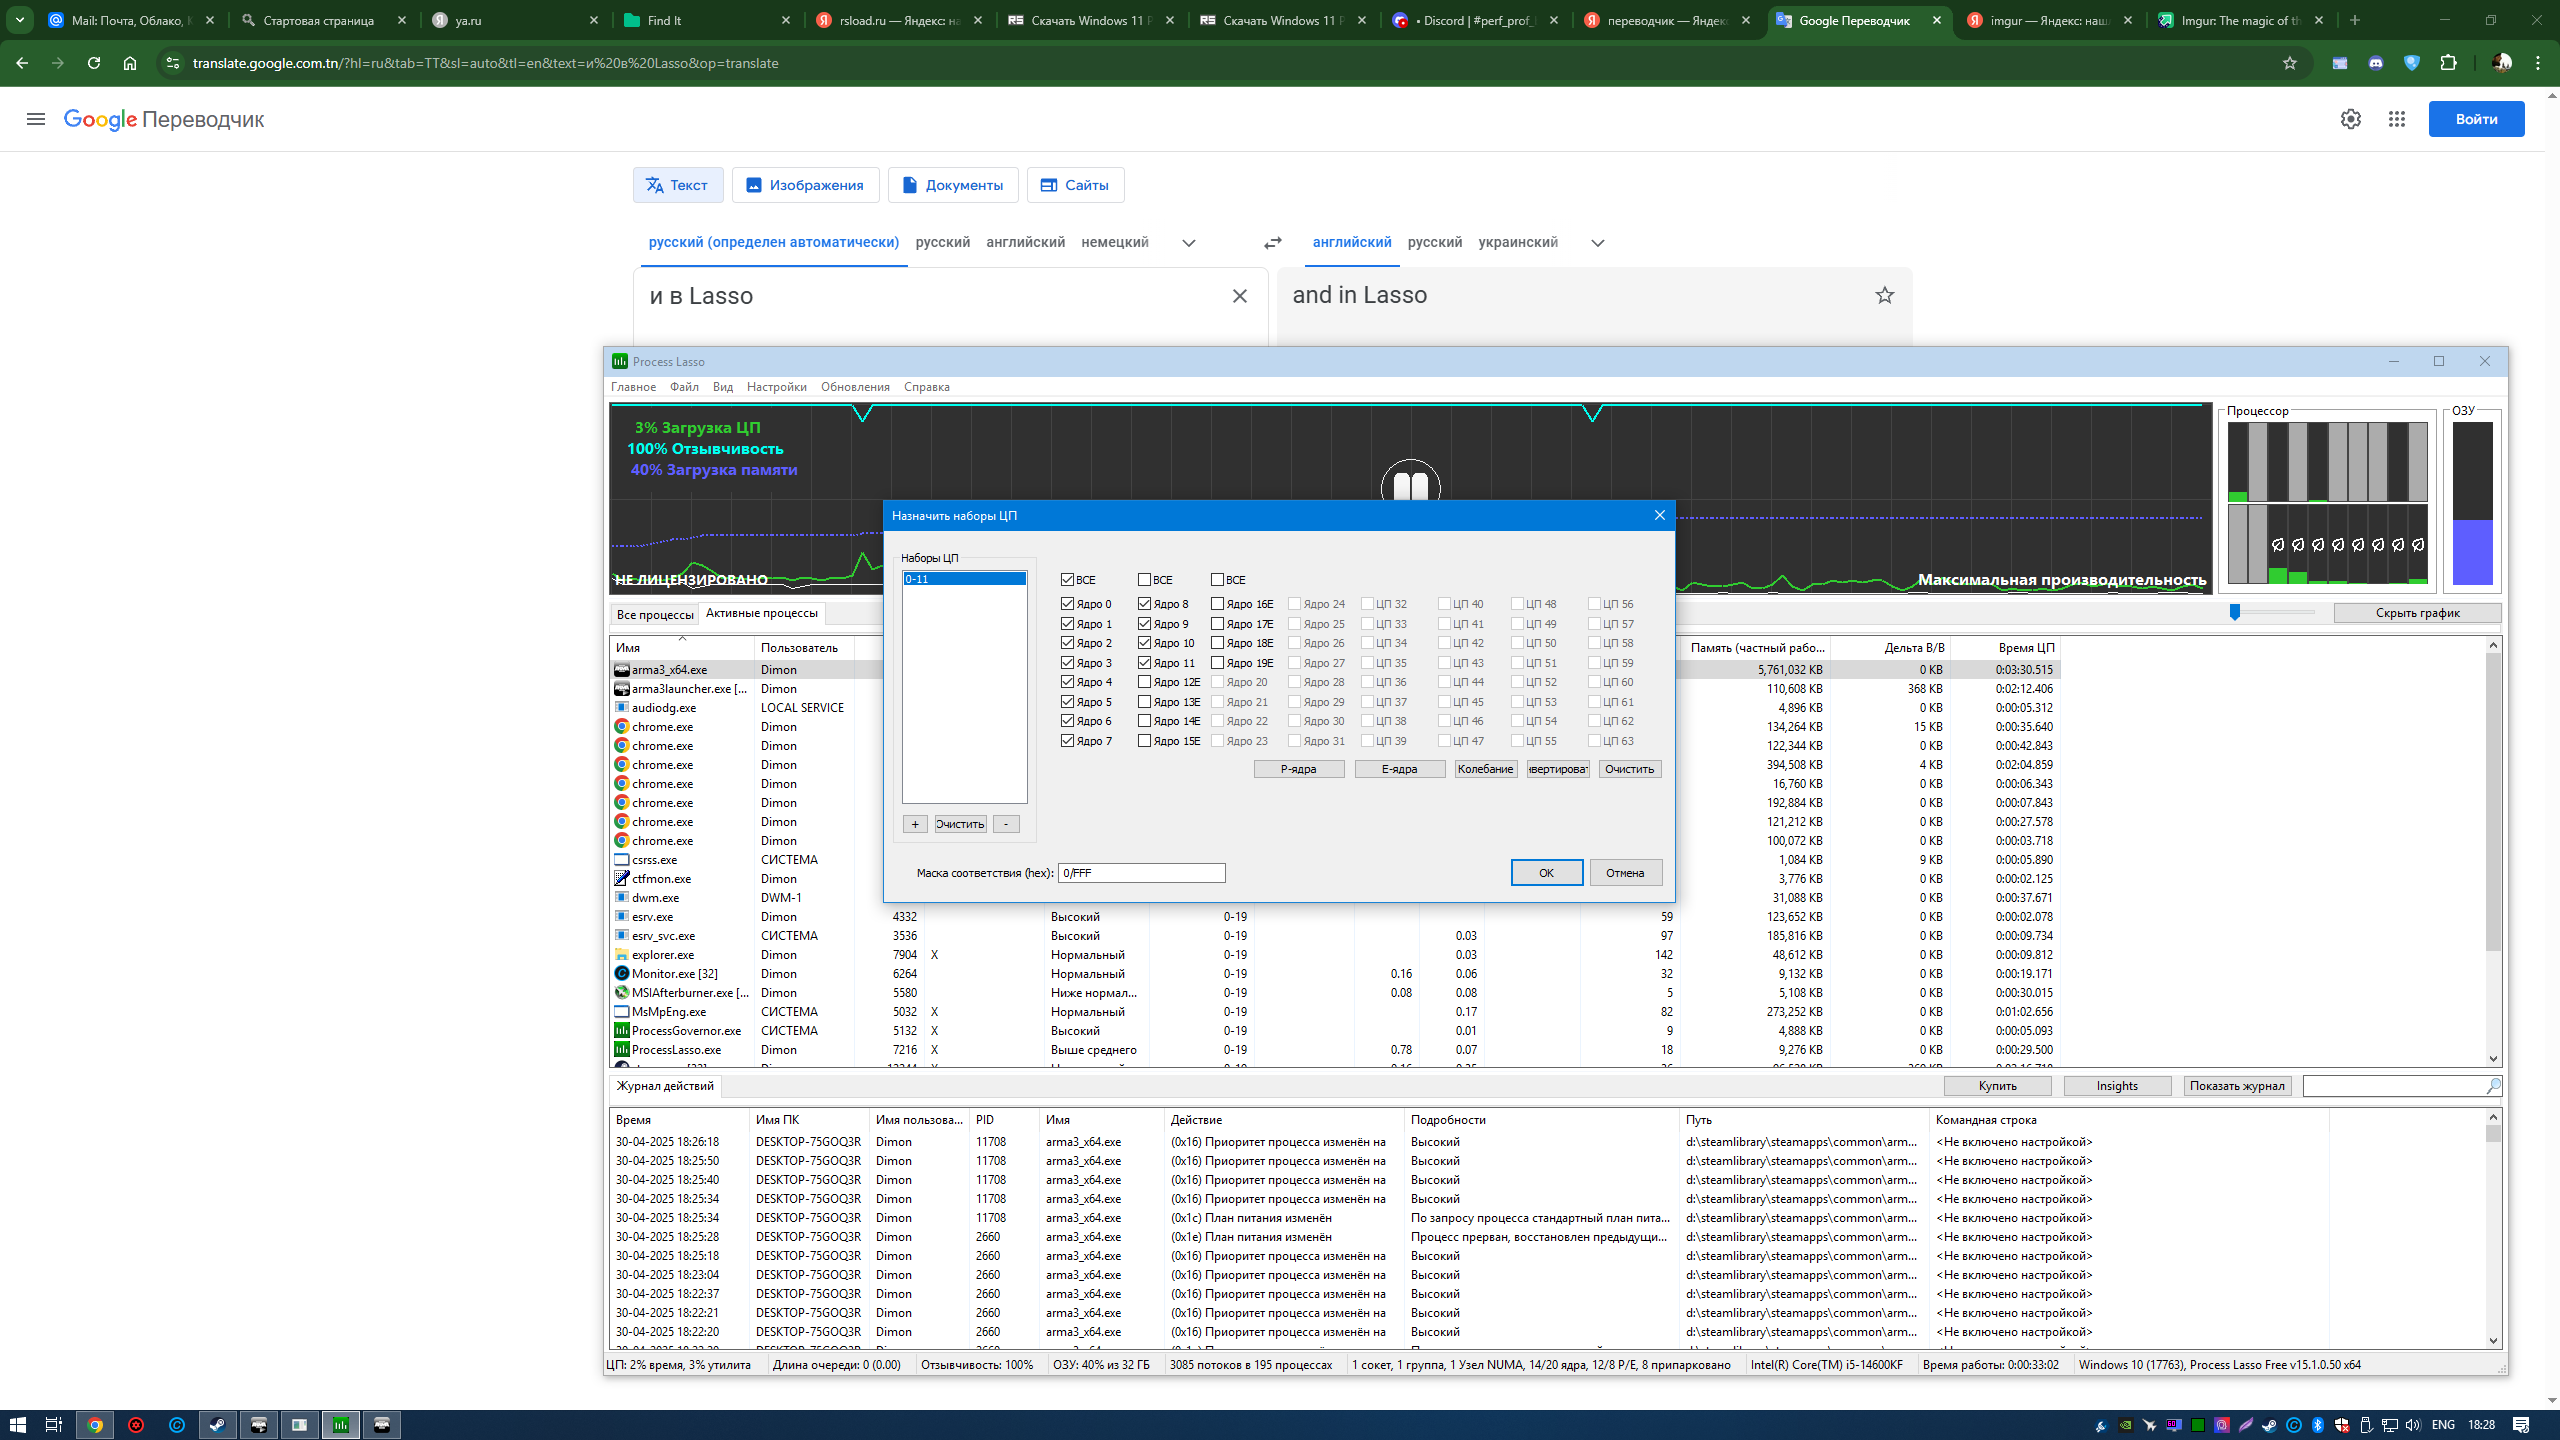
Process Lasso 😉
lets you lock whatever to whatever cores you want
knotty wraith
I didn't think that cpucount still works and is relevant) yes, thanks - I set 6 cores, E cores don't work
https://imgur.com/2KtU7tv

 potent sparrow
gritty wasp
first rule for any modern intel CPU: Disable HT and all E cores and forget.
potent sparrow
gritty wasp
first rule for any modern intel CPU: Disable HT and all E cores and forget.
or run your dedi on one of those and just use taskset -c 0-11 and lock it to one of the 6 perf cores 😉 - let the E cores run teamspeak
there is no reason to force disable E cores when you can tell windows or linux to don't use X for Y in software
wise sparrow
whole cloud
<@305391693367083020> I tracked the issue back to 2.12, from february 2023. Its ...
Hold on, even stable builds? And yeah didn't see it on the playthrough I watched before
inland dew
@whole cloud since you've implemeted this.
the related ticket can be closed
https://feedback.bistudio.com/T152279
potent sparrow
then process lasso (free version works - I bought it because it's awesome) it, that was how I locked arma to running on the X3D CCD before windows scheduler/drivers caught up 🙂
whole cloud
wise sparrow
Hold on, even stable builds? And yeah didn't see it on the playthrough I watched...
Yes
wise sparrow
Ain't that weird
potent sparrow
whole cloud
If you disable cores, you need to use -cpuCount parameter to tell the game about...
I knew about that - but it just occurred to me, does the same apply if you pin arma to specific cores via taskset/lasso, i.e. if you pin it to P cores on a P/E arch do you have to adjust cpuCount to the number of P cores?
whole cloud
You have to adjust the CPUcount, to how many cores are available
gritty wasp
whole cloud
If you disable cores, you need to use -cpuCount parameter to tell the game about...
they are not visible to system if disabled in bios
whole cloud
We weren't talking about bios
potent sparrow
whole cloud
You have to adjust the CPUcount, to how many cores are available
ah..interesting, I've used both Lasso and taskset to lock arma onto specific cores for ages but never occurred to me to chang the cpuCount 😄 - brb breaking everything 😉
whole cloud
With the new multithreading stuff, it behaves quite badly if it has fewer cores than it thinks it has
potent sparrow
whole cloud
With the new multithreading stuff, it behaves quite badly if it has fewer cores ...
yeah that I've run into (or related), I got smart and tried to lock HC's to one set of cores per HC and the server to another - thinking that might be better....it very very much was not
potent sparrow
whole cloud
With the new multithreading stuff, it behaves quite badly if it has fewer cores ...
cores or threads, I.e. 7950X3D, 2 CCD's, each is 8C/16T, if I lock to CCD0 (the X3D one) should cpucount be 8 or 16?
whole cloud
Threads
knotty wraith
https://imgur.com/X7AAJkb
@gritty wasp
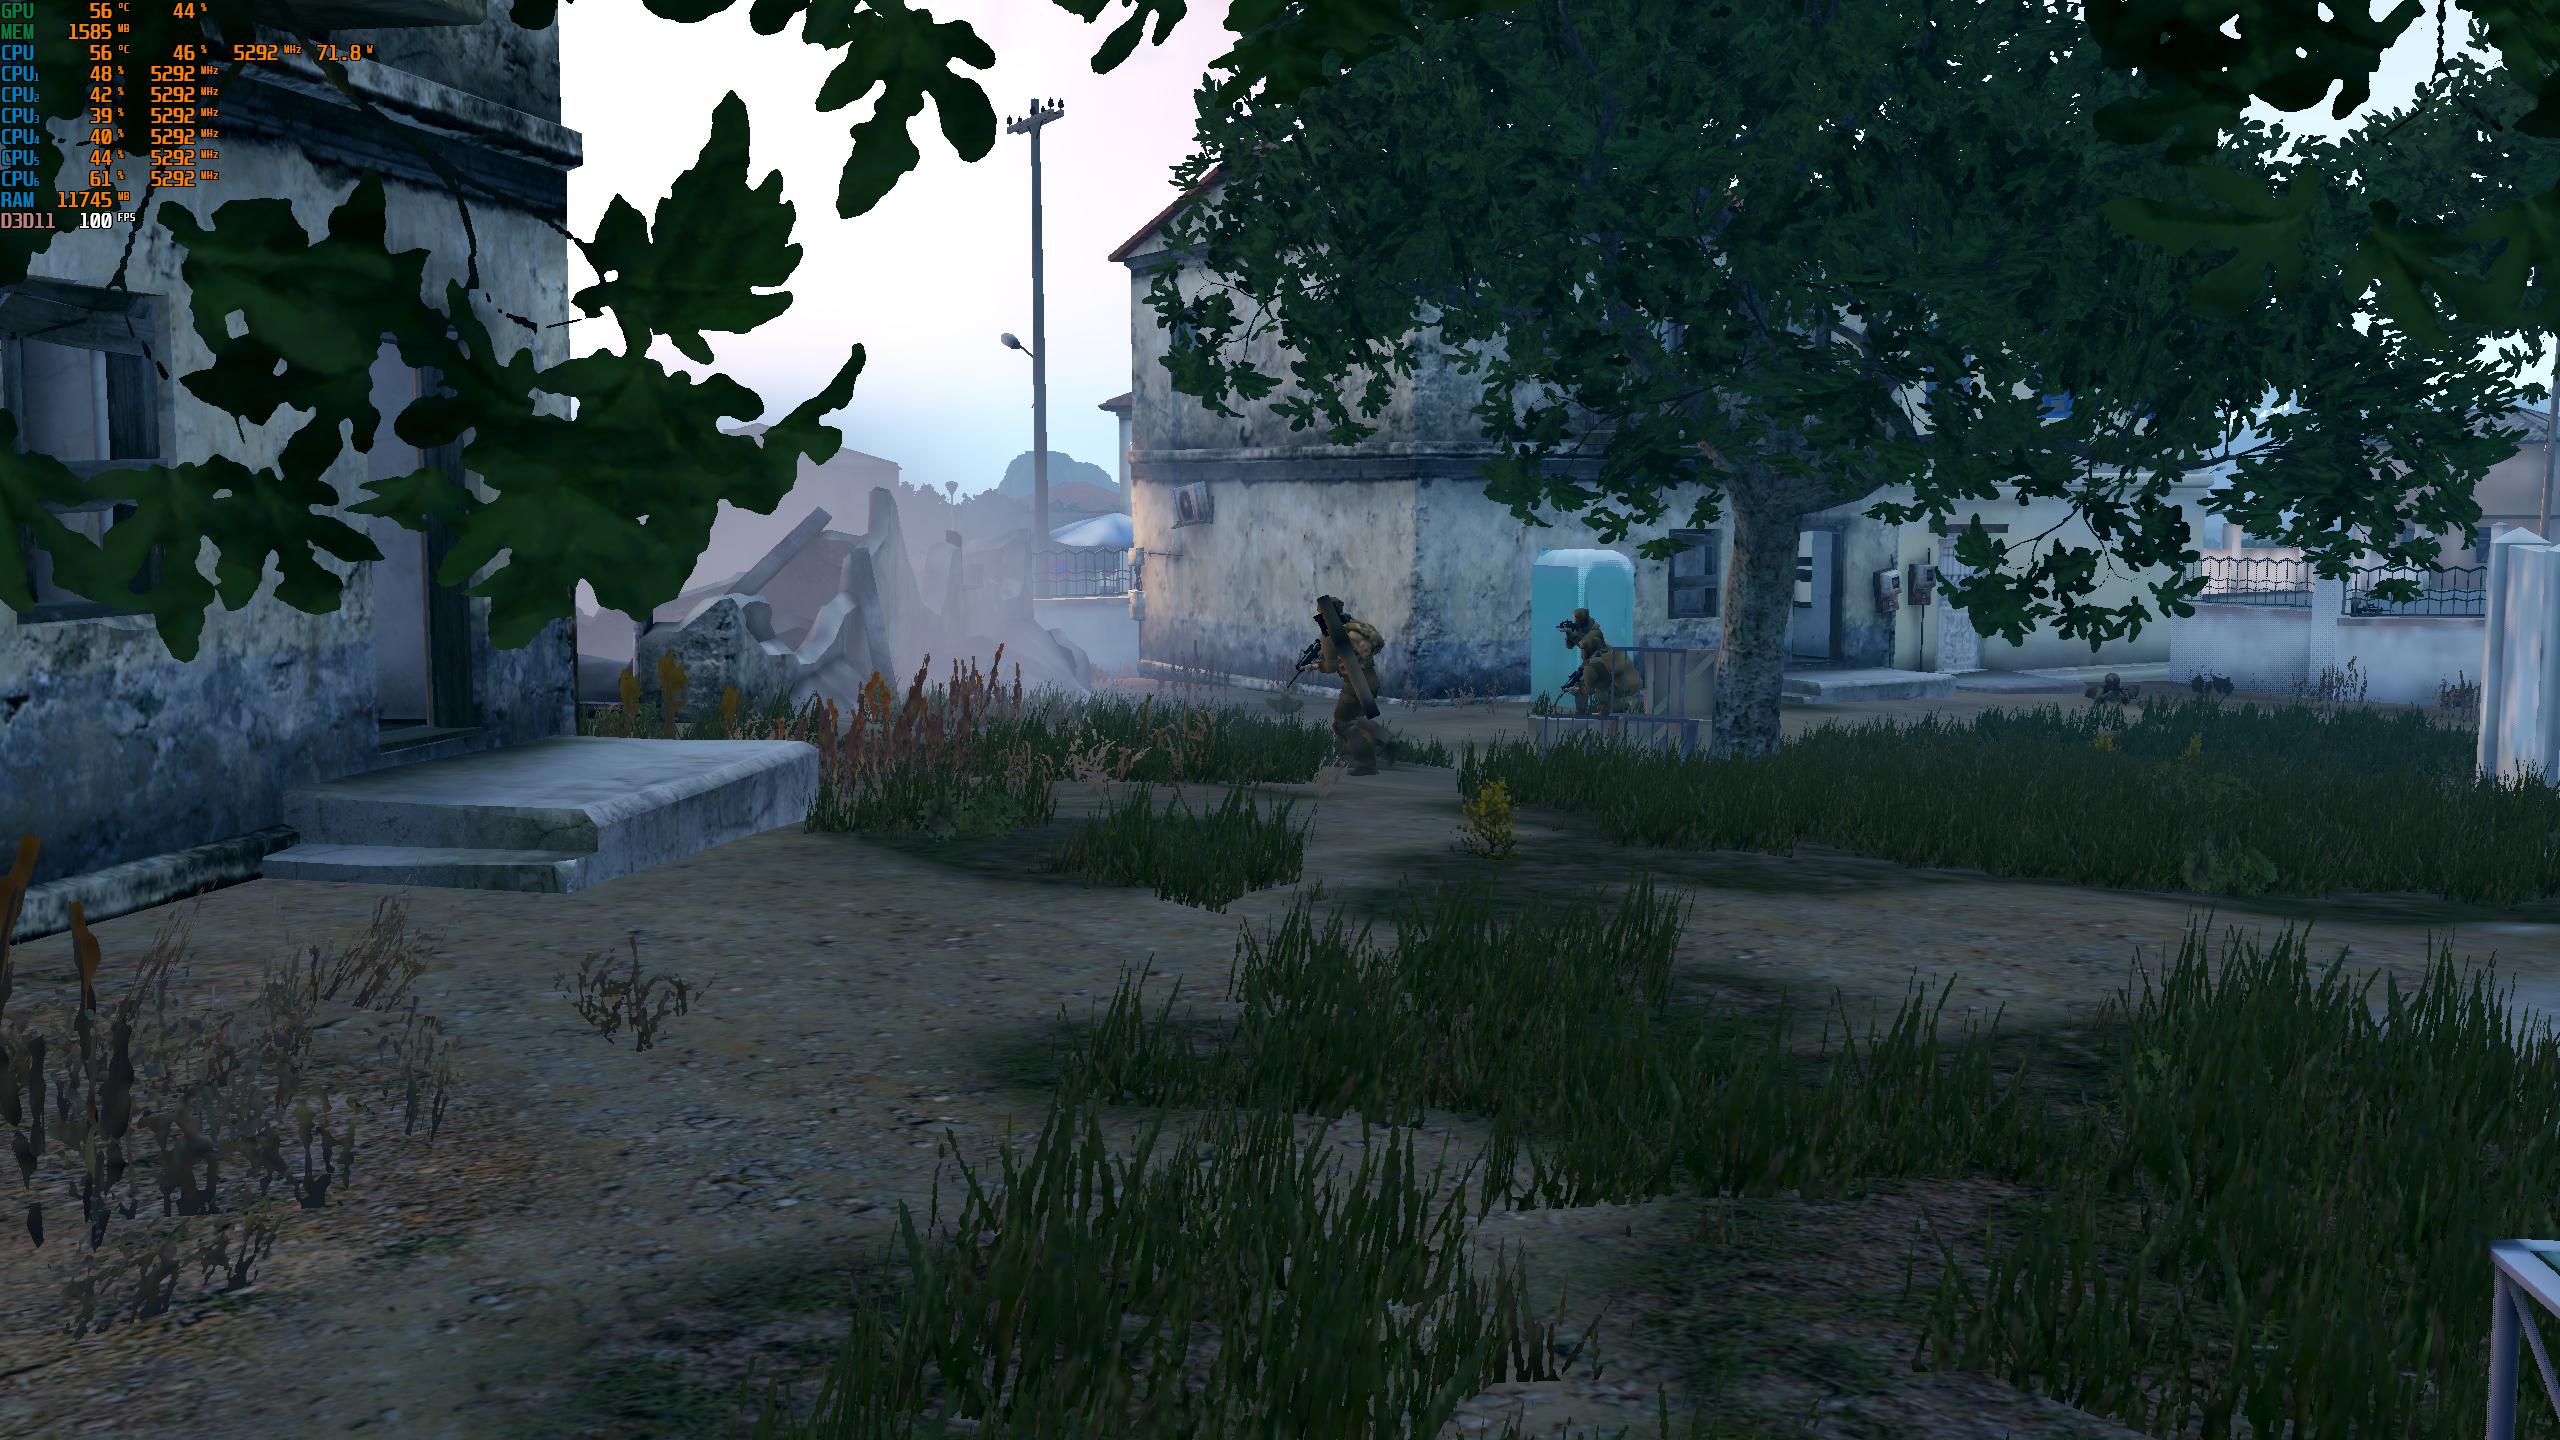
thanks for the tip - this turned out to be the best solution, disabling HT and E
the processor started working...
 potent sparrow
whole cloud
Threads
potent sparrow
whole cloud
Threads
🙂 ty, I put 16 then thought..hmm should ask
whole cloud
Well. CpuCount says how many threads Arma will spawn.
The real cores vs fake threads thing.. is a thing you'd have to test
heavy vortex
Well, 8 might still be better, but 16 will be fine.
fast hornet
16 is the correct value for one CCD on a 7950X3D. 8 cores, 16 threads.
potent sparrow
whole cloud
Well. CpuCount says how many threads Arma will spawn.
The real cores vs fake thr...
yeah I'll YAAB the options and see which plays nicest, for the server I'll just match taskset to cpuCount anyway which is 0-11
gritty wasp
There is no issues with core detection if you disable and forget. Think about it 😏
Extra heat from e cores can be converted in Hz for performance cores. For me there is noticable difference in YAAB
potent sparrow
gritty wasp
There is no issues with core detection if you disable and forget. Think about it...
off topic for here - but that can depend and only applies if the CPU is actually unlocked (7950X3D aren't they'll only boost to their locked freq limit) and they are thermally capped - in my case its never thermally capped - if they are actually unlocked (9950X3D's are and will boost to their TJMAX) then its different, arma is CPU heavy but it's not stress-ng on 32 threads CPU heavy
@whole cloud well...damn 🙂 - that's a shiny little boost for 16 in the box ~10% (everything else was identical)
 inland dew
spiral pond
potent sparrow
<@90532520101183488> well...damn 🙂 - that's a shiny little boost for 16 in the ...
inland dew
spiral pond
potent sparrow
<@90532520101183488> well...damn 🙂 - that's a shiny little boost for 16 in the ...
sframe cheat to get a capture of that 0 fps / mini freeze could be of interest.
the drop is normal but shouldnt be that extreme
inland dew
inland dew
<@90532520101183488> since you've implemeted this.
the related ticket can be clo...
might also be obsolete and thus can be closed?
https://feedback.bistudio.com/T123355
potent sparrow
spiral pond
`sframe` cheat to get a capture of that 0 fps / mini freeze could be of interest...
ran it again identical to run with the frame drop, same result +/- 3% (69.9) second time, never dropped below 43 - so yeah curious but can't reproduce I'm an idiot, I ran the wrong params 👀
whole cloud
inland dew
<@90532520101183488> since you've implemeted this.
the related ticket can be clo...
I don't remember implementing that xD
whole cloud
inland dew
might also be obsolete and thus can be closed?
https://feedback.bistudio.com/T12...
No I like that one
heavy vortex
Wait, is that still an issue? 
whole cloud
Probably not
inland dew
whole cloud
I don't remember implementing that xD
maybe not you, but a separate pip distance slider is now there and doesn't affect pip quality, as before it was only select quality and thus also automatically a preset distance, depending on quality, with no separate slider
whole cloud
Oh right now I remember
inland dew
so the ticket is about adding that pip distance slider and separate pip distance from pip quality.
thus ticket implemented and can be closed
i guess so...
 naive osprey
Profiling server and non-profiling clients may have a potential issue with.... animations or something? Still have no idea what happened at the end of the video, never seen it before
https://outplayed.tv/arma-3/daRg5n

Outplayed - The ultimate capture app for gamers. While playing, it automatically captures your best moments and biggest plays. When the match is over, relive your best (and not so best) moments by watching them in the match timeline.
Not home so I can't replicate right now
fast hornet
"he's hacking" 
 fair swan
AI in static weapons were appearing about 10 meters in front of their seated positions, then snapping back to normal location every few seconds. Issue was resolved by switching the server back to main branch.

The weapon they were sitting in would also rotate when they appeared back at normal position for a very short amount of time, almost unnoticeable but can be seen in the pic above
magic elm
What Dedmen said about socket bandwidth had me curious so I upped mine from 25 to 128 and ran smothly. Wish my rcon had been working so I could get hard stats will try that again tomorrow but looking at the logs even trying to put the server into desync with 50 people we just couldn't. There was some small local desync but theres nothing as far as pending messages between the server and HCs, no transport layer issues and no backlogs I could find
whole cloud
The particles disappearing being related to view distance doesn't make too much sense though, as people reported getting the bug after respawning, where they wouldn't be changing the view distance 🤔
Animations could be that one animation message sending I changed, but I think that was v28 or earlier
spiral pond
Are particle creations sent as network message, or rather created locally from other type of network messages?
If the latter, and always related to player position changes, could the camera source/source to determine what particles to draw not get updated?
Finally a debug of sorts to show amount of particles drawn, may help to understand better whats going on?
whole cloud
particle sources are network created, particles themselves are local
Huh interesting, just learned that object view distance, doesn't apply to particles. They still show when everything else is invisible
Messing with view distance yielded me no results
swift narwhal
whole cloud
Huh interesting, just learned that object view distance, doesn't apply to partic...
Yeah we tested yesterday night, this time his particles were present throughout the whole session. We tried messing with his view distance but nothing happened this time around...
inland dew
was just a coincidence then...
wise sparrow
Noticed missing particles yesterday when I loaded into a saved campaign mission, went away after loading up editor messing around throwing a smoke and loading back into the mission. So no clue what might've triggered it 🤷♂️
fading seal
I've had particles disappearing as well a few times over the last couple of weeks. It seemed kinda random but the most memorable moment was me being a commander in a spearhead sherman tank
Could it be related to VRAM? Sometimes when VRAM is full and it seemingly is trying to load more stuff into VRAM it'll turn into a 3 FPS dog until I run the flush and/or superflush command. I feel like the 3 FPS stutter fest and particles disappearing happened at somewhat the same-ish time
(unrelated question; anyone know why this channel doesn't want to stay in the sidebar? It's toggled on in the channel overview thingy but as soon as I change channels it's gone) Never mind... apparently it was muted 😂
 opal hound
What could cause somebody to become stuck in the lobby without being able to pick a slot or press OK?
We've upped MaxMsgSend as suggested before and it's still happening occasionally
whole cloud
Cannot press OK until slot is selected.
Clicking on a slot, just sends a request to the server for that slot. If the server refuses it, then you won't see yourself pop into the slot.
Could also be that the server is lagging (like when mission is being loaded at start) that it doesn't send response
 fair ore
whole cloud
Huh interesting, just learned that object view distance, doesn't apply to partic...
fair ore
whole cloud
Huh interesting, just learned that object view distance, doesn't apply to partic...
...significant performance opportunity?
opal hound
What do you mean by mission loading, Is there something separate to the mission file download?
We haven't added anything to refuse picking a slot and it's only started since we switched to profiling server. Is there any data we can grab to troubleshoot?
whole cloud
fair ore
...significant performance opportunity?
no
whole cloud
opal hound
What do you mean by mission loading, Is there something separate to the mission ...
after mission file download, the server loads the mission. loads terrain, spawns the objects, runs init scripts.
During that its essentially frozen
opal hound
I believe this is before mission file download
whole cloud
Other players can slot, just one player can't?
opal hound
Yeah
fair ore
whole cloud
no
Insignificant performance opportunity?
whole cloud
Maybe its a missmatch because of non-profiling branch client?
I think server RPT should log if a role selection is refused, but it happens so rarely that might also be broken.
If client reconnects, they can slot?
whole cloud
fair ore
*Insignificant* performance opportunity?
About as significant as joey
opal hound
Yeah they're likely stable clients, I can try to get an RPT from them
They've been verifying/reinstalling and having the same issue so no, rejoining doesn't fix it
Yes
Interesting, I'll see what I can find out
maybe lol, but they're complaining in the support channel so seems unlikely
fair ore
whole cloud
About as significant as joey
so very significant
whole cloud
probably not
 quaint flame
 craggy matrix
anyone heard of the parachute extesion mod ?
craggy matrix
anyone heard of the parachute extesion mod ?
wrong channel
foggy vine
foggy vine
Hmm. Would it display 3D usage like that from thermal throttling only in that ca...
Same shit different day, just had it happen from the usual alt-tabbing in and out. GPU 3D cache usage remains at 100% when this happens. Sometimes taking a few seconds to get back to normal, sometimes minutes.
 jagged hemlock
opal hound
What could cause somebody to become stuck in the lobby without being able to pic...
jagged hemlock
opal hound
What could cause somebody to become stuck in the lobby without being able to pic...
I my self got a long time problem that by using my mouse button which emulates pressing ";" for PTT, after some time i also can't choose slot which is fixed by lobby reentry and choosing slot without pressing it.
whole cloud
Everytime you change the mods you're launching, Arma has to recreate the AnimDataCache.
That takes 10+ seconds. But luckily it caches it and if its cached it takes only about 1 second to load the cache.
That's of course annoying if you change mods often, having to endure that slow loading.
But, if we throw multithreading at the creation, the non-cached start, with my modset goes from 15 seconds down to 5.
8 lines of code, 10 seconds faster game start
And I can feel better about CPU utilization.

 restive pilot
did you also multithread the config loading?
whole cloud
No, can't do that because it contains scripts and thats a mess
restive pilot
what about caching it?
whole cloud
but I want to try caching it, that should cut off 9 seconds but that might not work well
Configs with #if could enable/disable config entries based on date.
Which doesn't go well with a cache
whole cloud
I planned to do config cache since 2021.
But then in january this year I made a improvement that shortened the config merge time from 17 seconds down to 2.
Cache to save 17 seconds very worth it, cache to save 2, eh. That is not config parse though, that is the merge step post parse (so after the #if troubles above are already resolved)
I could also cache stringtables, but then I discovered binarized stringtables, which load alot faster. And improved our stringtable parser too so that is now also very minor 😄
(Now I just need the CUP mods to use binarized stringtables 😢 )
whole cloud
Found another second, with a single-character code change.
Every filename in every pbo is stored as a deduplicated string. That would save memory if the same string appears in multiple places.
But, filenames in PBO's should be unique, there should never be the same file in multiple PBO's, so duplicates don't happen and we pay time for that deduplication.
After fixing that.
~60% of pbo loading time, is spent setting up a lookup table so we can find which file is at a specific offset in the PBO.
We only use that table for debug logging. Setting up the table is also quite inefficient.
We check for every inserted file, that there are no duplicates. But its not possible to have duplicate files inside one pbo (atleast with a properly made pbo)
And we re-sort the table after every insert. Instead of sorting once at the end, there's even a todo comment on it saying to sort it only once 😰
If we first insert all and then sort, the code is alot faster and its also just 1/3rd the lines of code to do it.
It is so much faster, that it doesn't even show up in profiling anymore.
PBO loading from 3 seconds down to 0.5.
Saving all the precious seconds.
Another 1.5 seconds to be had if mods would use script bytecode 😢
Another 2 seconds if mods would binarize their configs.
Another second if mods would binarize their stringtables.
restive pilot
you can binarize stringtables?
quaint flame
Are Vanilla stringtables binned?
whole cloud
in 2.20 yea
restive pilot
speaking of stringtables, is this doable?
https://feedback.bistudio.com/T190844
I would love to be able to localize to a language independant of game language
whole cloud
no
We only load the strings that are needed
Well okey technically yes.
By re-loading all stringtables for that lookup
 analog acorn
whole cloud
in 2.20 yea
analog acorn
whole cloud
in 2.20 yea
Does that mean they'll no longer be readable?
whole cloud
We still include the unbinarized xml's in the pbo's if you want to read them
 autumn timber
at least with a properly made pbo
Custom obfuscated pbos breaking in 3... 2... 1... 😆
 silk pewter
 autumn timber
Last time I checked (must have been over half a decade ago), I think that the game just took the first available file with a name, but unpackers would overwrite it on disk with a second one, if you had them unpack the whole file to a directory
Or was it the other way around? I don't remember. Not that I care. Throwing it here as trivia 😀
whole cloud
Well if obfuscated pbo's break.. Fine by me
I just broke some last year
whole cloud
Now that I got my game start down to 35 seconds.
And to 33 by setting process priority to highest, during the loading 😄
Do I want to save another 8 by caching the config and stringtable 🤔
patent sky
preload the game on windows startup, instant start up times 😄
 heavy galleon
quaint flame
patent sky
preload the game on windows startup, instant start up times 😄
Click to run for Arma, why not 😄

 scarlet jolt
sounds like windows is the problem. Bare metal arma 3 2025?
fast hornet
complete assembler rewrite in 2026
 spice dirge
FPGA clients in 2027
fast hornet
Arma 3 ASICs in 2028
silk pewter
inb4 ArmaOS® 2035
whole cloud
My v28 with empty animcache takes 70 seconds till main menu
the new one takes 47 seconds 😮
restive pilot
heavy galleon
If it's not Hannah Montana Linux, I'll riot
is a different Montana ok?
whole cloud
oh wow. Stringtables can actually run through preprocessor? Why
restive pilot
whole cloud
oh wow. Stringtables can actually run through preprocessor? <:meowsweats:7076260...
splitting and #including them?
whole cloud
Aw caching configs doesn't work, or would be too much effort to make work.
I could do stringtables, for about 2 seconds saved
 fiery crescent
I keep following this channel, and wanted to say that it is amazing how much you guys do for us!👌👍😊🥂
swift narwhal
I keep following this channel and wonder why it hasn't been renamed to #dedmens-dev-diary 
 worldly badge
"guys" yeah indeed we have bunch of Dedman
autumn timber
The contents of this channel would unironically be a great source for a lecture at a gamedev conference.
The title should have something about skeletons in the closet 😛
quaint flame
autumn timber
The contents of this channel would unironically be a great source for a lecture ...
Thanks for the ear worm
silk pewter
quaint flame
Thanks for the ear worm
"spooky scary skeletons"?
quaint flame
silk pewter
"spooky scary skeletons"?
I got some skeletons in my closet and I don't know of someone knows it so before they throw me inside my coffin a close it...
silk pewter
glad I didn't know that 😎
potent sparrow
silk pewter
glad I didn't know that 😎
Eminem
silk pewter
oh, I found "liltoe" xD
fair ore
autumn timber
The contents of this channel would unironically be a great source for a lecture ...
tech debt: a saga
light cargo
a saga of treadmill work
 real creek
dedmen documentary when
 obsidian condor
Would they have to wear a bandana face mask in it though?
 verbal shell
whole cloud
I planned to do config cache since 2021.
But then in january this year I made a...
verbal shell
whole cloud
I planned to do config cache since 2021.
But then in january this year I made a...
Why the CUP ones specifically?
whole cloud
They are big
verbal shell
Ah, well, fair
potent sparrow
fair ore
tech debt: a saga
Arma 3 Brownfield: Always code as if the guy who ends up maintaining your code will be a violent psychopath who knows where you live.
whole cloud
https://github.com/ValveSoftware/GameNetworkingSockets This is basically what our netcode does, but in alot worse and more amateurish 😄
Maybe we could just switch to that 🤔
The cool thing is that it handles NAT traversal. No more port forwarding just to invite a few friends to your local hosted server.
Just host server, and steam invite friend and it just works? that'd be neat
Their ACK is alot nicer.
We just have a bitfield of 32/64 acks.
They do it with RLE encoding 🤔 Very schmart
fast hornet
imagine a world with only ipv6 and without NAT.. the dream
 ripe anchor
whole cloud
<https://github.com/ValveSoftware/GameNetworkingSockets> This is basically what ...
ripe anchor
whole cloud
<https://github.com/ValveSoftware/GameNetworkingSockets> This is basically what ...
that would be amazing specially since my isp decided to force implement cgnat
woven loom
whole cloud
<https://github.com/ValveSoftware/GameNetworkingSockets> This is basically what ...
That would be game changing, literally even
potent sparrow
fast hornet
imagine a world with only ipv6 and without NAT.. the dream
You can have that world any day now* (* any day now is not contractually binding and may be 50 years from now - if depression over the fact that we are still using 32 bit unsigned numbers as the global defacto routing system strikes - consult you doctors, side effects of IP6 may include happiness, not having to deal with CGNAT ever again)
opal hound
Getting a lot of
22:14:17 Sound: Error: File:  not found !!!
22:14:17 Sound: Error: File:  not found !!!
22:14:17 Sound: Error: Multi-stream: Load failed, stream  not found !!!
22:14:17 Sound: Error: Multi-stream: Load failed, stream  not found !!!
22:14:17 Sound: Error: Multi-stream: Load failed, stream  not found !!!
22:14:17 Sound: Error: Multi-stream: Load failed, stream  not found !!!
22:14:17 Sound: Error: File:  not found !!!
22:14:17 Sound: Error: Multi-stream: Load failed, stream  not found !!!
22:14:17 Sound: Error: File:  not found !!!
22:14:17 Sound: Error: Multi-stream: Load failed, stream  not found !!!
is this a profiling thing or a mod acting up? I haven't seen it before
 void badger
Probably a bad mod
opal hound
I can't grep it out of my mods folder, and the mod set hasn't changed for a month or so
silk pewter
 restive turtle
dedmen doing gods work out here
restive turtle
dedmen doing gods work out here
 whole cloud
opal hound
Getting a lot of
```
22:14:17 Sound: Error: File: not found !!!
22:14:17 Sound:...
whole cloud
opal hound
Getting a lot of
```
22:14:17 Sound: Error: File: not found !!!
22:14:17 Sound:...
There were no changes to file or sound
scarlet jolt
another staurday operation, immediately server CPU started periodically spiking to 100% and server fps would drop to 0 for a few seconds. Turning off all the other services we have running except for Teamspeak minimized it but I dont know if it resolved it
ope this might not be relevant information anymore since I think we are on the V28 server
Still gonna try a slow frame capture and see what that reveals
 pale carbon
Was this branch updated recently? today i started getting terrible stutters when in gunfights, making the game unplayable. Disabling all mods and DLC didnt fix anything either. When switching to the main branch the stuttering is fixed.
opal hound
The last update is in the pins, 5 days ago
restive pilot
pale carbon
Was this branch updated recently? today i started getting terrible stutters when...
in multiplayer?
 elder path
Since the last update to profiling, my dedicated server has had serious desync issues with no obvious cause. This does not seem to affect every player, either. Is anyone else experiencing this?
scarlet jolt
Is there any guidance anywhere how to read one of these trace files?
I've got it open in perfetto and I am realizing I have got no clue what I'm actually looking at
 violet elbow
elder path
Since the last update to profiling, my dedicated server has had serious desync i...
violet elbow
elder path
Since the last update to profiling, my dedicated server has had serious desync i...
Changes to networking were made, might wanna double-check your basic.cfg?
elder path
violet elbow
Changes to networking were made, might wanna double-check your basic.cfg?
Where are these changes detailed?
 crystal haven
Just a little teaser of an in-game admin panel using ctrlWebBrowser for a framework I'm working on
And another teaser of an in-game garage ui using ctrlWebBrowser for the framework I'm working on (still a wip)
heavy galleon
violet elbow
Changes to networking were made, might wanna double-check your basic.cfg?
Wouldn't the worst case scenario with "old" basic.cfg be the same result?
pale carbon
restive pilot
in multiplayer?
singleplayer
scarlet jolt
if your arma server is on the perf profiling branch but you aren't running the profiling.exe, do you still just get the perf enhancements or are you just running the base arma executable?
woven loom
The former
scarlet jolt
Ahhh... interesting. Thanks for the info
whole cloud
elder path
Since the last update to profiling, my dedicated server has had serious desync i...
Check the affected player in the player list on the map screen.
Do they have low bandwidth? Desync? High ping?
elder path
whole cloud
Check the affected player in the player list on the map screen.
Do they have low...
It does show up as desync in some cases, yes. I mentioned more info from further troubleshooting in #server_windows
It seems to be related to the newest version of the profiling branch primarily
I have reverted the server to the previous one and made changes to my basic.cfg to bring it in line with what others have suggested here after a lot of searching through old threads
I'm going to keep poking at the issue and see if it continues or is fixed- Unfortunately I can't do much testing because it's such a random issue and doesn't affect everyone, meaning I need a larger group of players- Not easy on short notice
whole cloud
I think the desync number on map screen. Would mean the player has low bandwidth, such that the server isn't even managing to send out the messages that would be needed
elder path
That makes sense, yes
whole cloud
Keep an eye on the bandwidth numbers.
If they really are low, it really can only be bad ping or packet loss
elder path
I'm hoping the adjustments I made to my basic.cfg settings help mitigate that. I have very little knowledge of the network side (I'm a hardware guy primarily) so this is pretty arcane to me
Also, will do
scarlet jolt
How's the V29 server for large scale stuff now, is it stable enough to put my group through 4 hours of arma on it now?
heavy galleon
scarlet jolt
How's the V29 server for large scale stuff now, is it stable enough to put my gr...
Try it, let me know, thx 
inland dew
still on v5, because of smoke and other stuff...
heavy vortex
Got a six-second bout of network message pending with DS + local client. Not sure if working as intended.
naive osprey
scarlet jolt
How's the V29 server for large scale stuff now, is it stable enough to put my gr...
I've had v29 on a server ranging from 90 to 160 players since it came out, only notable issue is that packet loss and desync are much more noticeable than before, though the frequency of said desync has dropped significantly.
whole cloud
heavy vortex
Got a six-second bout of network message pending with DS + local client. Not sur...
probably because your socket maxBandwidth is limiting it
heavy vortex
There's no basic.cfg, for what that's worth.
whole cloud
yeah default is 2MiB, might be tight for a local client
 deft oak
whole cloud
yeah default is 2MiB, might be tight for a local client
deft oak
whole cloud
yeah default is 2MiB, might be tight for a local client
Any recommendations on what to bump it to now on v29? Or do the recommendations for basic.cfg from v27 still hold true for the v29 changes.
whole cloud
It will only use as much as it needs and has
so can't really be too high
The problem with local clients is that application layer ignores bandwidth, but transport layer still obeys it. That causes the pending messages missmatch
if you raise transport layer high enough that it can handle all that should go through (which local client will be able to) then that problem won't happen
crystal haven
When using the ctrlWebBrowser I'm getting multiple lines of the following in the rpt while the UI is open:
12:08:40 UpdateTexture 7027
12:08:40 UpdateTexture 7028
12:08:40 UpdateTexture 7031
12:08:40 UpdateTexture 7037
...
Is this due to using it as a display an not a dialog?
whole cloud
That sounds like I forgot some logging
crystal haven
What are some more ideas/plans that you have for ctrlWebBrowser?
whole cloud
None at the moment
silk pewter
can it emulate IE6?
fast hornet
silk pewter
can it emulate IE6?
 heavy galleon
Is there a chance we would ever get arm64 server binary?
You know, with cloud providers offering more and more arm64 servers.
Guess it wouldn't be as simple as switching the compiler  (but perf prof would be awesome for testing it
  )
)
woven loom
wouldn't raw performance be much worse anyway?
restive pilot
heavy galleon
Is there a chance we would ever get arm64 server binary?
You know, with cloud pr...
0 chance because many things in Arma are written for x86 x64 specifically
heavy galleon
ay caramba
 grizzled summit
heavy galleon
Is there a chance we would ever get arm64 server binary?
You know, with cloud pr...
grizzled summit
heavy galleon
Is there a chance we would ever get arm64 server binary?
You know, with cloud pr...
Pray to Eden that Arma 4 does 🙏
heavy galleon
woven loom
wouldn't raw performance be much worse anyway?
Don't think so  apple silicone showed that arm is competitive. And companies are investing heavily into it now too.
woven loom
yeah, it's workload dependent though from what i've seen, and depends on what you're after (efficiency vs raw performance)
silk pewter
you can wait for Dedmen's absolute final confirmation on the topic, but I would not hold my breath: as Leopard20 said many things are written for a different architecture and ARM64 support is not a priority at all
woven loom
i guess if ARM servers are much cheaper to rent than x86 and performance is similar for the game server, then it has a lot of advantages?
i don't think i've seen game server specific benchmarks though
heavy galleon
silk pewter
you can wait for Dedmen's absolute final confirmation on the topic, but I would ...
Yeah, will wait a week 
Priority surely not, or even on a list anywhere, but would be cool to add it to the list!
grizzled summit
I scrolled up and found nothing, is profiling fixed with the issue it was having with missing ID's?
heavy vortex
What issue with missing IDs?
silk pewter
heavy galleon
Yeah, will wait a week <:kappa:984132940571230318>
Priority surely not, or even...
please don't hold your breath for a week
grizzled summit
heavy vortex
What issue with missing IDs?
Sorry - Didn't see your response, let me grab the error code
bin\config.bin/RscDisplayMain/controls/TitleSingleplayer.textureNoShortcut
The little black box buttons dissappear
On the main menu and in servers, meaning you can't join a multiplayer server
I believe it ONLY happens when loading a mod with missing cfg's or something? I just moved to stable branch, and was already 2 hours late to an operation so I didn't dig much deeper
 storm crag
The debug corner is so fun

 median belfry
I learned yesterday how to use the web browser and was thinking to make some UI with it, it looks pretty good, gonna try to revamp all the ui now, thank you for that Dedmen  the only thing was I notice is that the fading in effect sutters some times, probably because of arma? idk
potent sparrow
woven loom
i guess if ARM servers are much cheaper to rent than x86 and performance is simi...
arm servers can have comparable performance to x86 but it is somewhat nuanced when performance matters the software often has to be tailored to the hardware and even then x86 crushes arm for raw perf (perf per watt is more contentious) - proper servers running EPYC's are hard to beat
fast hornet
arm servers also typically have lots and lots of (slow-ish) cores, so not something arma greatly benefits from
restive turtle
potent sparrow
arm servers can have comparable performance to x86 but it is somewhat nuanced wh...
i run an EPYC rn
its pretty good
potent sparrow
fast hornet
arm servers also typically have lots and lots of (slow-ish) cores, so not someth...
yep, game servers are an exception in that they like higher freqs/IPC/X3D (mostly because the engines where written with those processors in desktop use as the target)
they like lots of RAM as well (but lots in the desktop sense, so 64GB) not the server sense (where 256GB is kinda standard these days and 512/768GB isn't exceptional)
last place I worked if you counted the RAM in the DB cluster is was ~1.5TB (and then there was the slave clusters..) - kinda blows my mind since my first computer had 16KB of RAM 😈
fast hornet
2mb for me 😉
But yeah, 1TB and more memory is pretty normal now, especially for hypervisor systems. 256/512GB has been normal for so long that companies are throwing away systems with that amount.
 smoky ridge
does anyone know what exactly a GIF pre stack size violation error is?
quaint flame
smoky ridge
does anyone know what exactly a GIF pre stack size violation error is?
Nvm
 shell lion
@whole cloud
I send you a pm, of some crashes from users or server over the weekend with perf 2.18.152803/2.18.152842
potent sparrow
fast hornet
2mb for me 😉
But yeah, 1TB and more memory is pretty normal now, especially for...
Still waiting for the 48GB DDR5 to come down so I can upgrade from 64 to 96 - meanwhile servers are into the TB's - 10 year old me wouldn't believe the kind of computing power I have access to these days at home
fast hornet
my past self would not have believed i'd casually have 16c/32t at home. I'm still at only 32GB though, bigger modules just were sooooo slow last time i looked
oh yeah, also sent you a crash memdump Dedmen 🙂
potent sparrow
fast hornet
my past self would not have believed i'd casually have 16c/32t at home. I'm stil...
I'm on AM5 so no real point going over DDR5-6400 so I just went with 2x32GB of that - wanted the 48's but I was already way over the line on the "missus acceptance factor"
fast hornet
also on AM5 .. but i'm running DDR5-6000 at 28-35-35-59. Won the chip lottery a bit by getting modules with really good hynix chips.
but looks like you can even get 64gb and 96gb cl26 kits by now.. 2 years of ddr5 production doing wonders 😄
potent sparrow
fast hornet
but looks like you can even get 64gb and 96gb cl26 kits by now.. 2 years of ddr5...
aye, I built this when the 7950X3D just came out - world moves on fast still 🙈
fast hornet
haha.. also on 7950X3D. Basically had the whole system ready for 1-2 weeks already, just waiting for the CPU delivery
 elder cradle
median belfry
I learned yesterday how to use the web browser and was thinking to make some UI ...
elder cradle
median belfry
I learned yesterday how to use the web browser and was thinking to make some UI ...
This seems cool, like tarkov hideout. What is this contraption you’re creating?
median belfry
elder cradle
This seems cool, like tarkov hideout. What is this contraption you’re creating?
its from my survival mod a3s, for the last year I'm working on a huge update, its gonna be crazy when its done
https://steamcommunity.com/sharedfiles/filedetails/?id=1278609853
inland dew
please -> #hardware_vs_arma or #offtopic_hardware
potent sparrow
median belfry
its from my survival mod a3s, for the last year I'm working on a huge update, it...
small world, was looking at that the other day 😄
heavy vortex
smoky ridge
does anyone know what exactly a GIF pre stack size violation error is?
Means you confused the SQF parser enough to break it. Usually a missing bracket somewhere.
restive pilot
GIF?
potent sparrow
restive pilot
GIF?
suspect he meant GIAR
heavy vortex
there's GIAS as well I think?
I don't know what the letters mean. There could be 20 different ones for all I know.
silk pewter
Gröss Inkompetence About Skripting!!
potent sparrow
silk pewter
Gröss Inkompetence About Skripting!!
De' mughchu'be'bogh DayajlaHbe'chugh, bIlughbe' 'oHbe' QaghwIj'e'.
smoky ridge
potent sparrow
suspect he meant GIAR
nope, GIF
Also apologies, i thought i had put it in #arma3_scripting
heavy galleon
silk pewter
_please don't hold your breath for a week_
I'm starting to turn slightly purple 🟣
 quartz rampart
heavy galleon
I'm starting to turn slightly purple 🟣
quartz rampart
heavy galleon
I'm starting to turn slightly purple 🟣
stop drawing on your self in class while you are bored.... that does not count
whole cloud
Has anyone noticed a speed difference with non-http mission downloads since v29?
With the better netcode, the server should be able to send alot more data faster
patent sky
whole cloud
Has anyone noticed a speed difference with non-http mission downloads since v29?...
Ruining my hard work 
whole cloud
crystal haven
When using the `ctrlWebBrowser` I'm getting multiple lines of the following in t...
oopsie, that should've been a #if
Thank you

There are actually quite a few more of these, like ExecuteJavascript which actually logs the scripts you throw in
whole cloud
heavy galleon
Is there a chance we would ever get arm64 server binary?
You know, with cloud pr...
Mac already has a arm binary 🤣
But its not worth the time, so no.
whole cloud
grizzled summit
bin\config.bin/RscDisplayMain/controls/TitleSingleplayer.textureNoShortcut
Its a broken mod, something with camofaces I think that breaks all the UI configs
heavy galleon
whole cloud
There are actually quite a few more of these, like ExecuteJavascript which actua...
Worth it for me!
(Literally in the process of unpacking a Pi)
light cargo
pi running arma 3? screams oh no
median belfry
Dedmen if I use SendConfirm via js how is the best way to send the string back ? since JSDialog only uses boolean
light cargo
there are better arm systems and how about risc? :)
whole cloud
median belfry
I learned yesterday how to use the web browser and was thinking to make some UI ...
There should be no stutter. Like youtube videos and twitch streams ran just fine.
But there could be some lag when the browser starts up.
Is that interaction menu, a new browser instance spawned every time? that's pretty fast
median belfry
median belfry
Dedmen if I use SendConfirm via js how is the best way to send the string back ?...
I ended up just using SendAlert -> JSDialog -> ExecJS back with the data, but I thought Sendconfirm would get back the string automatically with JSDialog
whole cloud
median belfry
Dedmen if I use SendConfirm via js how is the best way to send the string back ?...
no crossposting 😠 I'll get to your message sometime
median belfry
whole cloud
There should be no stutter. Like youtube videos and twitch streams ran just fine...
Yeah, it's a new browser instance every time. But is there any other way to do it? The browser instances close as soon as the dialog closes. The only alternative I can think of is using a hud, but then you can't interact with it.
median belfry
whole cloud
no crossposting 😠 I'll get to your message sometime
my bad
whole cloud
I don't know if you can maybe keep a dialog open, but hide/disable it so it doesn't capture click.
Probably not
restive pilot
whole cloud
I don't know if you can maybe keep a dialog open, but hide/disable it so it does...
make it possible to transfer the ctrl
ctrl ctrlSetParent newDisp
that way you can move it to display 0 or 46 and disable it without closing it (and bring it to your own dialog later)
heavy galleon
light cargo
pi running arma 3? _screams_ oh no
For a "test server" where you pretty much only check mods. Great
whole cloud
restive pilot
make it possible to transfer the ctrl <:notlikemeow:700311897937018890>
`ctrl ct...
Mh yeah I think that would work.
But for 2.22 if someone remembers
restive pilot
well if you can allow displays to be deactivated that's also good too
whichever's easier
whole cloud
moving a control seems easier
median belfry
can steam influence the webbrowser ? because for like 5minutes everything was lagging, delayed and transitions didnt feel smooth at all. even an restart of arma didnt help
 light cargo
median belfry
can steam influence the webbrowser ? because for like 5minutes everything was la...
light cargo
median belfry
can steam influence the webbrowser ? because for like 5minutes everything was la...
checked steamwebhelper cpu or similar? iirc this inconsistency was partially talked about and the feature is running under the webhelper instead of its own cef
median belfry
light cargo
checked steamwebhelper cpu or similar? iirc this inconsistency was partially tal...
cpu mem gpu everything looked fine. running 32gb ram 7800x3d rtx 3080
magic elm
whole cloud
Has anyone noticed a speed difference with non-http mission downloads since v29?...
Significant improvement. At least 50% faster if not more
We’re also getting a loss less infinite loading screens or people with higher pings failing to connect
 charred pagoda
whole cloud
Has anyone noticed a speed difference with non-http mission downloads since v29?...
charred pagoda
whole cloud
Has anyone noticed a speed difference with non-http mission downloads since v29?...
I noticed that downloading speed on non-http is limited only by socket max speed now
patent sky
median belfry
can steam influence the webbrowser ? because for like 5minutes everything was la...
Sidenote, you might wanna replace those item icons/images with your own 😄
Don't want Nikita knocking on your door
heavy vortex
My connection had a bad packet loss day yesterday (DSL training) and I was getting kicked off a server for signature verification failures literally every minute, despite everything else working ok. While you're messing with the netcode, you might want to make that code a bit more... fault tolerant.
whole cloud
median belfry
can steam influence the webbrowser ? because for like 5minutes everything was la...
Steam IS the webbrowser
whole cloud
charred pagoda
I noticed that downloading speed on non-http is limited only by socket max speed...
Increasing socket speed might be an interesting experiment then
whole cloud
heavy vortex
My connection had a bad packet loss day yesterday (DSL training) and I was getti...
Maybe next month 🫂
whole cloud
2.18.152860 152863 152866 new PROFILING branch with PERFORMANCE binaries, v30, server and client, windows 64-bit, linux server 64-bit
- Tweaked: Improved game start speed
- Fixed: Multithreading related crash (Thanks @chilly geyser )
- Fixed: Crash while ADS and switching to spectrum device while remote controlling a unit (Thanks @uneven bluff )
- Fixed: Animation hitching (Thanks @wise sparrow )
If you don't want to use the Steam branch, the files are also available for alternative download here:
https://drive.google.com/drive/folders/15p9j7C2nHUt6NoVfChX4YFuqzFXzblJh
Note: There are separate Dll files that also need to be placed into Game folder.
whole cloud
whole cloud
2.18.~~152860~~ ~~152863~~ 152866 new PROFILING branch with PERFORMANCE binaries...
 humble zenith
Are there different server config tweaks for perf now? What are the optimal settings?
opal hound
Highly dependent on your server specs but the general recommendation is here #perf_prof_branch message
vale shoal
Hm, is anybody seeing some unusual server behaviour with the latest prof? The complete machine hang itself away suddenly. The only thing I saw on the Arma 3 instance (Server) was "Parsing configs", then nothing. No response at all to Windows. Had to reset the machine. It could be coincidence but I don't know honestly.
Additional to that, the .rpt was basically empty after loosing connection to RDP. This are the last lines:
Allocator: D:\Servers\arma3\altis\Dll\mimalloc_v219_20250213.dll [] [] PhysMem: 64 GiB, VirtMem : 131072 GiB, AvailPhys : 58 GiB, AvailVirt : 131068 GiB, AvailPage : 67 GiB, PageSize : 4.0 KiB/2.0 MiB/HasLockMemory, CPUCount : 14 =====================================================================
fast hornet
have v30 running on our testbox for ~5 hours now, no crashes or other problems so far.. but apart from me connecting once as a test it usually has no clients.
vale shoal
vale shoal
Hm, is anybody seeing some unusual server behaviour with the latest prof? The co...
Was there changed something in the config parsing process by any chance? If yes, if it helps, I use obfuSQF. Maybe there is a conflict somewhere.
analog acorn
potent sparrow
opal hound
Highly dependent on your server specs but the general recommendation is here htt...
in the context of that post what is sockets.maxBandWidth referring to, I'm familiar with the other settings in cfg but that isn't one I remember seeing
ahh it's its own config class (found it on github in someone elses file)
weak panther
- fly any plane e.g. wipeout
- during fly, eject
- while you fly in seat exec
player setPos [5298.72,5613.71,-0.000198364] - my UI stuck, cannot press buttons, cannot close pause menu via Esc key
given coordinates for example, it seems that any execution of setPos will give such behavior. after move out from seat setPos work ok
silk pewter
some disableUserInput at work here? 😓
 fading shuttle
is there any good way to time how long it takes to initialize mods to compare to before?
whole cloud
vale shoal
Was there changed something in the config parsing process by any chance? If yes,...
There was a change with pbo loading, but only with profiling binary.
And I don't see how that would fail 🤔
whole cloud
weak panther
1. fly any plane e.g. wipeout
2. during fly, eject
3. while you fly **in seat** ...
Is that new?
Why would anyone teleport themselves while ejecting
whole cloud
fading shuttle
is there any good way to time how long it takes to initialize mods to compare to...
a stopwatch 😄
From launch button press, to main menu
fading shuttle
do rpt timestamps work bc it showed there i got 25 seconds without profiling and 28 with 😭
loading about 18 gigs of mods
analog acorn
The file size of the mods isn't really the problem. One mod with terrains, high-detail models, high-res textures, and lots of sounds could add a lot of file size, but none of that will be actually loaded until it's used in the game. The mod loading time is affected by the number of mods, and the size of the configs within those mods.
fading shuttle
operation trebuchet and first contact
it's a lot of configs and pbos
at least 364 config.cpp files
whole cloud
It also depends on how often you start the game.
On first start (when mods or game binary changed) stuff is cached, second start only loads the cache.
Creating the cache is now much faster too though.
But second start is still always faster than first start
fading shuttle
ok ill go try that
yeah
after two runs it went down to 18 seconds total for the rpt
whole cloud
vale shoal
Was there changed something in the config parsing process by any chance? If yes,...
if its obfuscated, and you can narrow it down to it (like load vanilla, but add that obfuscated pbo). Then you can send me that pbo and I can check why
vale shoal
whole cloud
if its obfuscated, and you can narrow it down to it (like load vanilla, but add ...
The client seems to work fine with obfuscated pbos, I joined on server with v29 without problems. Just played for like 5 min but nothing happened.
 steady cairn
performance improved since new update?
heavy galleon
analog acorn
The file size of the mods isn't really the problem. One mod with terrains, high-...
Please word it differently.
The loading time is affected by the number of pbos
You then have people who will go around and confidently say that they mega repack because "one mod loads faster than 70  "
"
 ember owl
Just had this issue a few times over the course of the past two days. I used to not have this so figured I'd echo it. I play in windowed fullscreen.
restive pilot
are you guys sure it's not a driver issue? (specifically nvidia ones which are terrible recently)
foggy vine
ember owl
Just had this issue a few times over the course of the past two days. I used to ...
Do you use Discord overlay?
ember owl
foggy vine
Do you use Discord overlay?
Yeah that is probably it- they also just had an update recently for it as well.
Cheers
 red thorn
vale shoal
Hm, is anybody seeing some unusual server behaviour with the latest prof? The co...
red thorn
vale shoal
Hm, is anybody seeing some unusual server behaviour with the latest prof? The co...
someone of my clan had the same issue as client
joining the server resulted in complete PC freez
had him revert to v29 with no problems joining
I myself had no problems with v30
whole cloud
Like worst case, if there really is a problem with obfuscated pbo's. The worst that could happen is 100% CPU load and the game freezing.
And that is at game start during the splash screen, not mid game.
red thorn
I don't thinks its related to obfuscation of pbo's since the mission was not obfuscated and the all the mods (at least the first pbo of each can't check all) wasn't either
I checked by opening the pbo's with pbo manager -> error shows when pbo is obfuscated
 azure roost
I’ve got an issue where my PC seizes up on profiling at the splash screen. Only way out is to power button out of it.
It’s only occurring on profiling.
I also tried turning off discord overlay.
Even with no mods it does the same.
Tried validating files, even full reinstall.
Only thing I may need to check is drivers as I’m fairly certain they’re up to date but not 100%. Only started happening with this prof update and it’s only happening to me of the bunch from my group
 uneven kernel
I had that a wee while ago, funnily enough spamming escape fixed it. It went away eventually, never found anything in the .rpt or what the cause might've been
whole cloud
Well we increase the main threads priority now, during start up it runs as a high priority.
But windows shouldn't let any process kill/freeze the system, even if they are a high priority thread that runs at 100%.
But maybe we're triggering a windows bug then?
Is that not similar with what happened back then with the -setThreadCharacteristics on old windows server versions? Was that not the same, some system freezes? Don't remember
@azure roost @vale shoal @red thorn which Windows version (as precise as possible) on the affected machine?
vale shoal
whole cloud
<@311237832184299521> <@287583007336955905> <@365450861389807616> which Windows ...
Windows Server 2022 (21H2, Build 20348.3453)
fast hornet
what hardware and/or hypervisor is running it? No problems here with two arma v30 servers on different systems, also on Win2022 10.0.20348.3453
whole cloud
I don't know what would peg cpu load too 100%.
When I start a local server, it sits at 0% usage after initial loading.
Maybe it would run if you manually lower process priority? And then could analyze with vTune to see what its doing?
red thorn
ok got a correction: the freez didn't happen at server join but at game start like the others
he has Windows 11 Home (24H2, Build 26100.3915)
whole cloud
If I complain about it to microsoft, Raymond Chen will make a blogpost about something I'm doing wrong and that its actually my fault 😄
silk pewter
then learn from it and fix it! 😆
isn't CPU 100% load a good thing? people complain when the game uses 10%, when it uses 100%, IDK how to please them :p
whole cloud
⚠️ We replaced prof v30 with 152863
Removed: increased thread priority during startup
Fixed: Crash in ctrlSetModel (Thanks @subtle vapor )
knotty wraith
@subtle vapor - the experimenter https://www.youtube.com/@andreigud
 knotty wraith
I kindly ask you to add a description of the innovations to Google because the site is not working
 silk pewter
knotty wraith
I kindly ask you to add a description of the innovations to Google because the s...
silk pewter
knotty wraith
I kindly ask you to add a description of the innovations to Google because the s...
aren't they pinned?
knotty wraith
silk pewter
aren't they pinned?
my apologies, i thought only the last message was pinned
potent sparrow
silk pewter
isn't CPU 100% load a good thing? people complain when the game uses 10%, when i...
 fast hornet
is that xkcd?
potent sparrow
fast hornet
is that xkcd?
Yeah, 1172
foggy vine
Swapped to profiling branch literally less than an hour ago, kept alt-tabbing around from Arma to stuff like Windows Explorer and VSCode while I was loading the VR terrain...
... and Arma crashed without a memory dump.
RPT
whole cloud
foggy vine
Swapped to profiling branch literally less than an hour ago, kept alt-tabbing ar...
fullscreen-windowed mode?
foggy vine
Yup
whole cloud
Mh. Well maybe a one time fluke 😄
heavy vortex
It usually hangs on a black screen rather than crashing, right. It's not expected to survive unlimited alt-tabbing.
whole cloud
yes, it tries to open a message box from rendering code but fails and gets stuck
heavy vortex
IME it usually survives unless I get bored and alt-tab during a loading screen.
foggy vine
It usually survives my endless alt-tabbing even on a black screen, but that's good to know
heavy vortex
ACE death screen doesn't count :P
whole cloud
I found a new issue with our friend linked-lists again.
Game freezes (sometimes 10+ seconds) when opening server browser.
The game is preloading all the signature files, but that itself is not what is slow.
The game doesn't want to keep opening and closing files, so it keeps a cache of open files.
But for that cache not to grow too far, it only caches 64 files (besides files that are locked open, like pbo's)
So when a new file is to be opened, but the cache is too full. We need to throw out one file.
So far so good.
Our file system has multiple levels of caches.
The next level is a request cache. Like reading 4096 bytes of file X at offset Y.
That is cached, so when the same file section is read again, it can pull that from cache instead of having to re-read it from disk.
That request cache is stored in two ways. One is a hashmap and another is a linked list.
The hashmap to quickly find requests to see if a file is already cached.
The linked list is used to store the order of how "recently" a file was accessed. Such that when the game is running out of memory, it can purge the oldest and thus most likely not needed anymore files first.
Now when we want to close a file, we first need to remove all references to that file from the request cache.
To do that, for every file we want to close, we iterate that linked list containing all cached requests and find the ones referring to the same file, and delete them.
Now, iterating a linked list of all file chunks that have been read before, quickly gets into the 100k items range, more with more mods.
If we want to close one file, we iterate 100k items in a linked list.
The signature loading code, loads all signatures, one or multiple per pbo. Even vanilla that's a thousand files.
A thousand times, iterating through 100k+ items in a linked list.. 
Brute force fix, we have the table which is a bunch of arrays, so I can multithread that. (10 second freeze, down to 2 seconds)
Better fix, have another hashmap that is indexed by just the file so we can quickly find all open requests belonging to a file.
// opening file can be very slow on XBox
// it is therefore a good idea to keep cache of recently opened files in case they are used again
Thank you xbox
 heavy vortex
Arma 3 doesn't actually support xbox at the moment, does it?
light cargo
heavy vortex
Arma 3 doesn't actually support xbox at the moment, does it?
it's from a earlier arma that was planned to be on xbox most likely
whole cloud
Neither does it read files from DVD (which is also a big thing in this code)
light cargo
why is that there?
heavy vortex
Feels like on any proper OS you could just let filesystem cache deal with that and comment out the whole thing.
inland dew
heavy vortex
Arma 3 doesn't actually support xbox at the moment, does it?
probably comes from OFP Elite on Xbox (2005)...
light cargo
ya there we go
whole cloud
whole cloud
I found a new issue with our friend linked-lists again.
Game freezes (sometimes...
Actually instead of another hashmap, I can store it directly on the file that is opened (it already stores a count of how many requests are open on it, just not links to the requests themselves).
That quickly hacked in, 10second freeze down to 0.4s
good enough 😄
Before, like 90% iterating a linked list, and a tiny bit spent actually closing the file.
To no linked list at all. A bit freeing memory of closed requests, closing the file, and the mutex now makes an appearance because its so fast.


That should also affect performance when using filePatching.
It basically affects all file closing, and filePatching opens and closes alot of files, potentially 
opal hound
ohhh that's what's going on with my server browser
I thought it was just that I had too many non-responsive servers in history
whole cloud
It gets worse the more files are in cache. And as I increased the maximum file cache size because people wanted more ram utilization... 😄
 celest sparrow
this is the way, give me some keep busy loops and stuff so it looks like its all working hard
potent sparrow
celest sparrow
this is the way, give me some keep busy loops and stuff so it looks like its all...
digging the HAL9000 profile image 😄
I used that as the status indicator in some employee performance tracking once (went green if scanned in job was under time, red if over time - no one got the reference, I was sad)
 vivid rune
whole cloud
It gets worse the more files are in cache. And as I increased the maximum file c...
vivid rune
whole cloud
It gets worse the more files are in cache. And as I increased the maximum file c...
Could this be also the reason for that YAAB has the tendency to be a little bit slower in the second run?
 azure roost
whole cloud
<@311237832184299521> <@287583007336955905> <@365450861389807616> which Windows ...
azure roost
whole cloud
<@311237832184299521> <@287583007336955905> <@365450861389807616> which Windows ...
Windows 22H2 OS Build 19045.5737 for my PC, playing not hosting.
 runic sigil
whole cloud
Well we increase the main threads priority now, during start up it runs as a hig...
runic sigil
whole cloud
Well we increase the main threads priority now, during start up it runs as a hig...
Found someone with what appeared to be this thread priority on startup bug
Message link is here, don't know if the rpts are useful anymore
#arma3_troubleshooting message
patent sky
yeah was looking at that one, its the v30.1 prof build so that should no longer have high thread prio, perhaps something else is causing the issue
whole cloud
vivid rune
Could this be also the reason for that YAAB has the tendency to be a little bit ...
Don't think so, yaab is generally faster for me in second run
Looks to be the multithreaded animation cache initialization.
But only failing for a handful of people is weird
whole cloud
@vale shoal are you doing some stuff like controlling cpu affinity, -cpuCount parameter, how many cores the game can use?
vale shoal
whole cloud
<@287583007336955905> are you doing some stuff like controlling cpu affinity, -c...
only in the bat I do start /high
I removed -cpuCount and -enableHT because you said it would give better performance
whole cloud
I can reproduce the freeze, but only if I tell the game to use more cpu cores than I actually have 🤔
vale shoal
start /high /wait D:\Servers\arma3\altis\arma3server_x64.exe -mod=@Exile;@RwG;@CBA;@EM;@EMR;@CUPW;@CUPU;@CUPV;@RHSUSAF;@RHSAFRF;@RHSGREF;@RHSSAF;@BWM;@USAFM;@USAFF;@USAFC130;@3CBE;@3CBV;@3CBVRETEX;@3CBVS;@AVMG; -servermod=@obfusqf;@ExileServer;@a3_infiSTAR_Exile;@a3_infiSTAR_vision;@infiSTAR_TM;@a3_infiSTAR_Exile_customApps;@SM_LGC;@ESM; -connect=127.0.0.1 -port=2302 -config=@ExileServer\config.cfg -cfg=@ExileServer\network.cfg -name=AVMG -profiles=D:\Servers\arma3\altis\BEC -autoinit -hugePages -bandwidthAlg=2 -limitFPS=120 -loadMissionToMemory -pid=altis.pid -malloc=mimalloc_v219_20250213
That's the full command
whole cloud
So guy in #arma3_troubleshooting had the freeze because he had 6 cpu cores, but told Arma it had 12 to use.
I can reproduce it when I tell Arma I have 16 but set affinity so it can only use 8.
And its not frozen, it just takes like.. atleast 10x maybe 100x as long to load the game, while also spinning the CPU at constant 100% during that
whole cloud
vale shoal
Hm, is anybody seeing some unusual server behaviour with the latest prof? The co...
I see cpuCount 14.
I spotted an issue in the code if cpuCount is larger than 16. Then the remaining threads would just spin at 100% load doing nothing.
But if you're only at 14 then that wouldn't be it
Jup I found it.
When we do a bunch of work in parallel (like calculating thousands of animation actions)
We first spin up all the worker threads, because they take a while to come out of their sleep. Even though they don't have any work submitted for them yet, they start hot spinning waiting for us to submit the work.
Then we set up the tasks, and submit them. Because the threads are hot they'll grab them immediately.
Then we wait for the tasks to be done, which most likely also causes main thread to grab one of them.
Then we disable the flag telling the threads to stay hot, so they can go back to sleep.
And we are done with the parallel work.
Problem with that, if there are too many threads and they cannot work.
Threads may grab work to be done, but because the operating system doesn't have enough cores, it will suspend the thread that was doing real work, and give cpu time to another thread.
That other thread won't find any jobs to do, because other threads grabbed them even though they're not working on them. And it see's the hot flag and keeps spinning at 100% cpu load doing nothing. Until the OS time's out, force suspends the thread.
And then we have a basically random chance on what thread gets woken up next.
With luck, its one of the ones that was actually doing work, which will finish its task, and then also go into a hot spin, waiting for more work which isn't going to come.
So we are playing random chance ping-pong, hoping to hit the threads that had actual work, until all threads that had work finished it.
And the way this work specifically is designed, is extra bad.
Each job processes 16 actions, and they have a config lookup which has a mutex at the top.
The mutex is likely to call to the OS, which the OS likes to use as a chance to suspend the threads.
So the threads that do nothing, just hot spin at 100%, making the OS think they are doing important work, and also not giving the OS any opportunities to suspend them, until the timeout expires.
The threads that are actually doing work, are constantly spamming the OS with opportunities to suspend them, so are much more likely to be suspended, letting the OS use the cpu core for one of the useless threads.
The fix, swap two lines of code. Remove the hot flag, before we wait for the work to finish.
That will cause the threads that can't find any work, to go back to sleep.
So simple  This multithreading stuff is very sensitive stuff
I assume this happens on the servers, because there are just other processes running that are hogging some cores. Even if the game can't use just one of its threads, this would send all the others into a hot spin, until that one thread gets its go at a cpu core
 cloud sky
But hey, you made the "why's da game not using more CPU" peeps happy!
whole cloud

 drifting karma

whole cloud
⚠️ We replaced prof v30 with 152866
Fixed: Extreme slowdown (might look like a freeze) when the game has less cpu cores than it thinks it should have
quartz rampart
whole cloud
Jup I found it.
When we do a bunch of work in parallel (like calculating thousa...
just mine some cryptop while they wait for work 🤣 that way BI could refinance your time 😛
charred pagoda
whole cloud
⚠️ We replaced prof v30 with 152866
Fixed: Extreme slowdown (might look like a f...
Is it related only for servers/clients that started with specified -cpuCount option?
whole cloud
Also servers without cpuCount, if something else was blocking cpu cores for some reason
 weak radish
@whole cloud How does the MT deal with the 12th, 13th and 14th gen P/E core architecture.
If one has a i7-13700 for example, should one use 8 for the 8 physical P cores, 16 for the 8+8 total physical cores or 24 for the total logical cores 8*2+8?
Can the game differentiate between the P and E cores when it automatically chooses an amount?
If the multi-threading is waiting for all the threads to complete then having jobs running on the E cores might be detrimental in some cases
fast hornet
you should restrict the server CPU affinity to the p-cores/threads and use the appropriate -cpuCount. So 16 for p-cores with 16 threads.
just letting it run on all cores is even worse performance-wise than using the e-cores only.
knotty wraith
weak radish
<@90532520101183488> How does the MT deal with the 12th, 13th and 14th gen P/E c...
Windows 11 will solve the problem with the correct load on all cores - personally tested, Windows 10 does not cope with this
whole cloud
weak radish
<@90532520101183488> How does the MT deal with the 12th, 13th and 14th gen P/E c...
it doesn't. Your operating system hopefully deals with it
fast hornet
Server 2022 also does not have the newer scheduler.. 2025 might, didn't test it yet. Might also be different between client (sets threadcharacteristics as "game") and server (doesn't set threadcharacteristics)
weak radish
So task manager set affinity it is then. Thanks 🙏
fast hornet
nah, you can just set it with powershell on launch
weak radish
fast hornet
nah, you can just set it with powershell on launch
Client via steam
fast hornet
ah ok.. would also work though .. you can just task schedule a script that runs every few minutes or something
Like that for example. The affinity number depends on your cpu though, might not be the correct value for yours.
Get-Process -name "arma3_x64" | ForEach-Object {
    $_.ProcessorAffinity = 65535
    $_.PriorityClass='AboveNormal'
}
for anyone on linux you can just do (say it's a 13500 which is a 6P core) taskset -c 0-11 <arma3commandasusual
cloud sky
fast hornet
Server 2022 also does not have the newer scheduler.. 2025 might, didn't test it ...
Or just disable the E-cores via UEFI with e.g. KVM Console
potent sparrow
disabling the e-cores is kinda silly when they are ideal for running stuff like teamspeak/voip solutions - linux has mechanisms built in to just say "you run there, and you run over there"
fast hornet
the powershell value is binary, read from the right.. so 0011 would be core/thread 0 and 1 enabled, 2 and 3 disabled.
But for some reason the command doesn't accept the binary value, you have to provide it as decimal or hex. Don't ask me why, microsoft. 🤷
cloud sky
Dunno, maybe it's optimization overkill but I try to keep all the CPU caches in Arma server's use as much as possible 😅
potent sparrow
cloud sky
Dunno, maybe it's optimization overkill but I try to keep all the CPU caches in ...
right...and saying "arma you run on the p-cores, everything else that's using CPU that matters you run on the E-cores" does that
the "just disable E-cores" thing needs to go away - it's silly
cloud sky
potent sparrow
right...and saying "arma you run on the p-cores, everything else that's using CP...
Do they have separate L3 caches?
potent sparrow
@fast hornet just slap 0b on the start - with 0b you can use binary 0b1111111111111111 (called a binary literal)
fast hornet
not sure powershell accepts that, but i'll try. Thanks 🙂
potent sparrow
fast hornet
not sure powershell accepts that, but i'll try. Thanks 🙂
it does, from v7 - https://learn.microsoft.com/en-us/powershell/module/microsoft.powershell.core/about/about_numeric_literals?view=powershell-7.5

Both integer and real numeric literals can have type and multiplier suffixes.
fast hornet
ah, not an option then.. i try to keep everything ps1 compatible so that it runs on every system.. not only those that have p7 installed
potent sparrow
fair, I've used zsh for well over a decade, I still write scripts in pure bash format because I don't want to have to worry if zsh is installed on the other end 🙂
fast hornet
but just providing the binary and then doing the conversion in the script would be possible
gritty wasp
whole cloud
So guy in <#141866231362879488> had the freeze because he had 6 cpu cores, but t...
can arma detect HT threads? If so, maybe startup parameter should not override detected value if it is unreasonable. max(detected, userSpecified)
 warm sedge
man i'm so glad, i don't know what you guys are Talking about 🙂
patent sky
gritty wasp
can arma detect HT threads? If so, maybe startup parameter should not override d...
startup parameter is exactly for when autodetect isn't working/correct (or when u wanna run with less cores). so relying on the detected amount to determine something is "unreasonable" doesn't make much sense
knotty wraith
@whole cloud
windows 11
Why does it work like this, the game just doesn't start (very rarely), with vpn it always starts
https://youtu.be/uaf8mTaZBPY
 whole cloud
Well it looks to be BattlEye, I don't know BattlEye
patent sky
knotty wraith
<@90532520101183488>
windows 11
Why does it work like this, the game just doesn'...
maybe try a different DNS (1.1.1.1 or 8.8.8.8)
whole cloud
or 9.9.9.9 😄
knotty wraith
patent sky
maybe try a different DNS (1.1.1.1 or 8.8.8.8)
thanks - it works)
azure roost
whole cloud
So guy in <#141866231362879488> had the freeze because he had 6 cpu cores, but t...
Yeah can confirm mine had 8 cores set in parameters when I only have 6 🤦
Working fine for me now though, thank you for looking into
whole cloud
Still the game will perform worse if the count is not correct
Instead of big lag's, you'll just have small ones
gritty wasp
patent sky
startup parameter is exactly for when autodetect isn't working/correct (or when ...
if it can not detect correctly and you ask more you will suffer. What is the point to allow that?
patent sky
gritty wasp
if it can not detect correctly and you ask more you will suffer. What is the poi...
doesn't detect correctly != can't use all cores
 slender lagoon
should we include the number of logical cores in cpucount or only the physical ones?
whole cloud
cpuCount is total threads
gritty wasp
slender lagoon
should we include the number of logical cores in cpucount or only the physical o...
DO NOT TOUCH IT. Let it autodetect
fast hornet
gritty wasp
if it can not detect correctly and you ask more you will suffer. What is the poi...
For scenarious like the intel CPUs or running multiple servers on one system. E.g. when you set affinity to the P-Cores only on a 13900, Arma can use 16 threads. But it will detect the total count which is 32 on that CPU. So you restrict it to 16 with -cpuCount=16
whole cloud
In my tests, including hyper threads performed worse in YAAB
gritty wasp
whole cloud
In my tests, including hyper threads performed worse in YAAB
having HT enabled almost always worse in almost all software. Very limited scenarios have benefits from it
gritty wasp
fast hornet
For scenarious like the intel CPUs or running multiple servers on one system. E....
My max example was wrong. I'm talking about reasonable values. 16 out of 32 detected - reasonable. 16 out of 8 detected - hmmm.
whole cloud
Users could have valid cases for intentionally wanting to harm their game. Like I had today to test this bug 😄
slender lagoon
I have HT enabled for years, it helped in the past
gritty wasp
slender lagoon
I have HT enabled for years, it helped in the past
In Pentium 4 HT
whole cloud
Closing a file:
Before: Even if there are 0 references in cache, still iterate through 150 thousand cache entries to see if there are any
After: We have an array of cache references, usually just a handful, iterate over array and delete them. Done. Bye!
Coming in v31
silk pewter
FPS + 1000 ?
gritty wasp
silk pewter
FPS + 1000 ?
in server browser
 indigo anvil
silk pewter
FPS + 1000 ?
indigo anvil
silk pewter
FPS + 1000 ?
More like: previously dormant code triggered resulting in crash
vale shoal
whole cloud
⚠️ We replaced prof v30 with 152866
Fixed: Extreme slowdown (might look like a f...
Works flawless, thanks for fixing it!
woven loom
whole cloud
it doesn't. Your operating system hopefully deals with it
would still suggest seeing if Intel is willing to test and add Arma 3 to APO whitelist https://www.intel.com/content/www/us/en/support/articles/000095419/processors.html
Also @weak radish you may want to try APO in advanced mode in the meanwhile https://www.intel.com/content/www/us/en/support/articles/000098240/processors.html

Intel
Explains Intel® Application Optimization for gaming optimization.
Intel
Explains Intel® Application Optimization Advanced Mode.
Support is much wider now
Supported Intel® Core™ Desktop and Mobile Processors with at least 6 p-cores or more.
whole cloud
Should've gone with AMD
weak radish
Sadly my OEM is a bit of a pain, disabled overclocking on i7-13700HX’s etc so I’m not sure if it’ll work. I’ll get it all set up tomorrow and see what works best for me
 dense light
getOrDefaultCall crashes the game when called with a nil value for the code argument on profiling and dev. Not on stable.
private _map = createHashMap;
// _map getOrDefaultCall ['thing']; // no crash
_map getOrDefaultCall ['thing',nil];
Wanted report no particles in game again but noticed that:
Game in pause menu says game ver is 2.18.152866
But launcher says Game version: 2.18.152405, Branch: profiling
And no particles on mission
patent sky
weak panther
Wanted report no particles in game again but noticed that:
Game in pause menu sa...
game and launcher version mismatch on profiling is normal, we dont build a new launcher for every prof build since there is no need
weak panther
On mission at one point particles gone, but after respawning they appeared again, I think it happened twice. I couldn't find a 100% way to get it
 turbid vortex
I can say I have encountered issue with some particles missing on stable, most notorious was smoke grenade, with smoke sometimes not being shown for some people. Maybe issue isn't exclusive to profiling, or maybe it got worse.
heavy galleon
Also had issues with particles yesterday, as I didn't see the impacts of my bullets when shooting si 1.1km. some shots I saw, some not. Almost full random
weak panther
build 152866, just joined on koth - no particles (bullets, smoke, explosions...)
 heady echo
having an issue where I can't join a server when on profiling, deleting mission files and restarting game etc still 50/50 chance of getting in. tested on normal version and have no issue.
heavy galleon
Has anyone had any crashes on v30, especially on dedicated servers?
ember owl
I've had two segfaults but I was also running JSRS at the time which is known to cause crashes so would take my experiences with a grain of salt.
heavy galleon
ember owl
I've had two segfaults but I was also running JSRS at the time which is known to...
The new one, or old one?
 edgy chasm
weak panther
build 152866, just joined on koth - no particles (bullets, smoke, explosions...)
edgy chasm
weak panther
build 152866, just joined on koth - no particles (bullets, smoke, explosions...)
same build, also had this issue a few times after destroying a bunch of vehicles, respawning, and teleporting back - no tracers, no explosions, no smoke stacks despite wrecks glowing orange, and no particles on bullet impacts
seemed temporary though, getting away from the area resolved it
azure roost
Since the newest update, got an issue where if I load arma on perf branch with mods it'll get to splash screen and just do not responding and crash. Repaired, tested with normal branch and it works fine.
Different to what I had before, have got the CPU Count set properly this time. Any mod at all, doesn't matter how many.
Any ideas?
azure roost
azure roost
Since the newest update, got an issue where if I load arma on perf branch with m...
Fixed, NVidia Graphics driver was out of date. Worth noting that it didn't cause a crash before this latest update/fix.
heavy vortex
Sometimes that's just timing. I don't think any actual display logic was changed recently.
ember owl
heavy galleon
The new one, or old one?
On new but all of my crashes were on client not server.
heavy galleon
Ah, we just played, no crash on dedi. JSRS was force loaded, but old one 
woven loom
No client side issues for me while playing today, but low player count (10-ish), mix of profiling and stable, server running stable. Very few small mods + CDLC
whole cloud
dense light
`getOrDefaultCall` crashes the game when called with a `nil` value for the code ...
 whole cloud
heady echo
having an issue where I can't join a server when on profiling, deleting mission ...
whole cloud
heady echo
having an issue where I can't join a server when on profiling, deleting mission ...
what does getting in mean? where and how are you failing
whole cloud
ember owl
I've had two segfaults but I was also running JSRS at the time which is known to...
Send me the crash reports
 latent sigil
Hello I cannot start the game while using profiling.
whole cloud
latent sigil
Hello I cannot start the game while using profiling.
Provide more details please
latent sigil
While using profiling branch from the steam the games get stuck at games logo splash screen. Tried starting with no parameters as well gets stuck at splash screen.
 frozen tundraBOT
Arma RPT
Arma generates a .rpt log file each time it's run, which contains a lot of information like the loaded mods, or any errors that appear, this log file can be very useful for troubleshooting problems.
To get to your RPT files press Windows+R and enter %localappdata%/Arma 3
Additionally see the wiki page for more info: https://community.bistudio.com/wiki/Crash_Files
To share an rpt log here, please use a website like https://pastebin.com/ (Set expiry time to 1 week or less) to upload the full log, that way the people helping you can take a look at it and try to figure out the problem you're having together with you.
Note: RPT logs can hold personal information relevant to your system, the game or others.
latent sigil
Pastebin
Pastebin.com is the number one paste tool since 2002. Pastebin is a website where you can store text online for a set period of time.
whole cloud
-exThreads=7 -enableHT
That is not "with no parameters"
that exThreads does nothing, and the enableHT more likely hurts you.
-checkSignatures
Why? Do you actually need that?
Ah its multiple RPT's smushed together
gritty wasp
whole cloud
<:hmmyes:1147624204909433022>
For me it crashes too.
whole cloud
Yes it crashes
gritty wasp
Ah. I thought you got error message instead of crash
latent sigil
whole cloud
> -exThreads=7 -enableHT
That is not "with no parameters"
that exThreads does no...
I saw in some guide to enable the HT, but dont see any impact if its enable or not
whole cloud
latent sigil
I saw in some guide to enable the HT, but dont see any impact if its enable or n...
Your game freezes, what does CPU usage show in task manager?
0%? 100%
latent sigil
one min i need to check it, I rolled back to normal
its around 30-40%, pc stays responsive only game freezes
whole cloud
Please get it to frozen, then ..
in task manager, under details.
Right click the game and create a "dump" "memory dump" something like that I don't know the english word
patent sky
"Create dump file"
latent sigil
ok
whole cloud
And send me that, probably pack it in a zip and upload somewhere like uh.
wetransfer or any of these file transfer websites.
That particle issue seems to be related to respawn right?
I heard it happen in koth, antistasi. Generally game modes that have respawn.
And I never had it, because I never respawn? 🤔
Maybe combined respawn with the far teleportation
whole cloud
If you use process lasso or any way to limit the game's CPU cores, you need to use the -cpuCount parameter to tell the game that.
It'll just start very slowly if you don't.
Even after the fix its still quite bad because there are many small tasks in this.
But generally people who don't mess with things won't have problems with this 
latent sigil
Thank you for your help 🙂
foggy vine
whole cloud
That particle issue seems to be related to respawn right?
I heard it happen in k...
Had it happen on a custom mission without respawns
patent sky
foggy vine
Had it happen on a custom mission without respawns
did it start happening randomly in the middle of the mission or right away from the start?
gritty wasp
whole cloud
That particle issue seems to be related to respawn right?
I heard it happen in k...
@heavy galleon did have it after respawn?
foggy vine
patent sky
did it start happening randomly in the middle of the mission or right away from ...
Hmm. Not quite sure honestly, didn't pay much attention, but it may have happened either at the very start of the mission or a little after the start before mid-length time period of the OP
autumn timber
whole cloud
If you use process lasso or any way to limit the game's CPU cores, you need to u...
Any way to detect being limited by the OS and maybe add a warning to the RPT in case someone is forcing an unreasonable number? (yeah, I know, the chances someone will read that warning are quite slim)
heavy galleon
whole cloud
If you use process lasso or any way to limit the game's CPU cores, you need to u...
Deddy daddy, what about overall particle limit. Lately we've had smokes disappearing, like the emittors were "reset" and all particles deleted.
Seems to be tied to some limit.
The particles from bullets use the same feature I would assume
^^ but that is global for everyone
whole cloud
The particle limit being a thing is old, and I'm not fixing that for now.
If new particles are spawned, exceeding the limit, the oldest ones are force-killed. But the old ones will recover because the emitters will still be running
heavy galleon
For us it looks like it gets triggered immediately
I'll try to find a video, I think I sent it to liquid few months back
Also weirdly if you alt tab as I did here, the smokes "reappear" and immediately get deleted. Almost like fi the limit didn't apply while in background
whole cloud
But the particles are still there, just forced down to very few.
That's not the issue where particles are completely gone
heavy galleon
Ok.
But for the respawn/teleport.
On Friday I think I encountered the missing particles. Didn't see impact of few of my shots, or shots of the sniper next to me, while he told me that he's hitting the bmp (and he was)
Neither of us were Respawned nor teleported.
whole cloud
Not seeing particles of sniper impacts a km away is also not new.
I've had that for years, it always felt unreliable
whole cloud
I have another idea, we'll try that in v31
heavy galleon
I'll keep an eye on it on Friday
whole cloud
With the allocator changes, the particle rendering was also moved around, to start a bit sooner.
But if it breaks something that should always break it, not work fine 95% of time but rarely break.
I'll try to move it back down and then we'll try and see 🤷
analog acorn
whole cloud
If you use process lasso or any way to limit the game's CPU cores, you need to u...
When this performance stuff comes to stable, it might be an idea to put a note in the SPOTREP that's like "hey, if you were trying one of these weird hacks for better performance, maybe stop, the default handling is better now and your hack probably wasn't helping anyway".
It's really nice all the information you give us about how this stuff works, but it's still tucked away in a corner of the Discord, which isn't great for info accessibility. It'd be helpful to have a permanent official source to try to combat all those years of dodgy YouTube videos giving counterproductive advice.
fast hornet
it's probably too late by now, people will still find one of those useless "guides" on steam community or elsewhere from 10+ years ago. But can't hurt as well 😄
spiral pond
i would make the two(?) parameters obsolete/deprecate and add new ones
this way you drop all the faulty use and encourage actual usage from now on/a reset by those who know what they are about/invest some time to get educated about them
 tacit frost
I returned to Arma after a long break and noticed that the performance in the profiling build has dropped significantly, in the sense that it is now about the same as in the stable version.
Before that, I last played around 02/20/2025 - then the difference between the versions was impressive, with an increase of literally tens of FPS.
I checked the performance in the same scenario.
opal hound
What's the scenario you're comparing?
tacit frost
opal hound
What's the scenario you're comparing?
 heavy vortex
autumn timber
Any way to detect being limited by the OS and maybe add a warning to the RPT in ...
heavy vortex
autumn timber
Any way to detect being limited by the OS and maybe add a warning to the RPT in ...
Yeah, there's https://learn.microsoft.com/en-us/windows/win32/api/winbase/nf-winbase-getprocessaffinitymask. Could use that to cap the cpuCount calculation.
I think the assumption was that setting affinity is quite rare and people who use it know what they're doing :P
whole cloud
But that wouldn't help with anything that sets the affinity after game start. Like task manager would be
heavy vortex
You mean actively using a UI to set affinity after starting the game?
autumn timber
heavy vortex
I think the assumption was that setting affinity is quite rare and people who us...
quite rare
To paraphrase: in 60% of the time they set it every time 😉
heavy vortex
Those people know what they did. The issue is people who just set something six months ago and forgot about it.
But I dunno. Maybe utilities like process lasso actually set affinity too late to be detectable at startup.
swift narwhal
For the first time I also just got no particles/effetcs bug, happened after I respawned in Antistasi need me to do something? (create dump or send rpt)
patent sky
@whole cloud do you still need/want a prof framecapture when someone has the no particles bug?
I assume he's running perf tho
swift narwhal
i am
ok effects came back randomly now (I checked my task manager after it happened and created a memory dump just in case, my RAM was on full usage, I closed my browser to free up some RAM, maybe it helped?)
heady echo
whole cloud
what does getting in mean? where and how are you failing
When I join for example EU#5 on koth, I click on join the server from the in-game server browser and I Just get a black screen. It hangs and you can see the load bar go upto around 5%. Its only been happening for 2 weeks. I've been on profiling for about 3 months now.
(I have tried joining different missions / servers too, its not just on the one server)
I leave and rejoin a few times sometimes It will work. sometimes I have to restart the game to get it to join. and I have tried switching back to the normal branch and it works normally.
heady echo
edgy chasm
seemed temporary though, getting away from the area resolved it
I've found to fix bullet impacts/smoke etc, that putting game into windowed mode and changing back to your regular settings fixes it too. just a temp workaround
inland dew
shouldn't have to do any of that
woven loom
whole cloud
Not seeing particles of sniper impacts a km away is also not new.
I've had that ...
I didn't really see MMG impacts at a distance too, few hundred meters, but i feel like that's normal possibly? No other particles were "missing" that I could tell
I have a feeling it's an interaction with grass rendering workaround that might be hiding impact particles (e.g. sinking them like units are sunk), or maybe they're not rendered that far out?
Or people just need more zoom
whole cloud
patent sky
<@90532520101183488> do you still need/want a prof framecapture when someone has...
yes
whole cloud
heady echo
When I join for example EU#5 on koth, I click on join the server from the in-gam...
Can you try manually going back to v28 using the google drive download, and seeing if that fixes it too?
whole cloud
2.18.152881 new PROFILING branch with PERFORMANCE binaries, v31, server and client, windows 64-bit, linux server 64-bit
- Tweaked: Improved performance of engine closing files (could in some cases cause lag spikes) (Thanks @edgy chasm )
- Fixed: Microfreeze when pressing "Next Target" key - https://feedback.bistudio.com/T191741
- Fixed: Potentially fixed sometimes missing particle effects (Please report if it happens again)
If you don't want to use the Steam branch, the files are also available for alternative download here:
https://drive.google.com/drive/folders/15p9j7C2nHUt6NoVfChX4YFuqzFXzblJh
Note: There are separate Dll files that also need to be placed into Game folder.
whole cloud
whole cloud
2.18.152881 new PROFILING branch with PERFORMANCE binaries, v31, server and clie...
inland dew
2.18.152881 new PROFILING branch with PERFORMANCE binaries, v31, server and client, windows 64-bit, linux server 64-bit
- Tweaked: Improved performance of engine closing files (coulFixed: Microfreeze when pressing "Next Target" key - https://feedback.bistudio.com/T191741
❤️
inland dew
if particles fix/reverting works, finally possible to upgrade from v5 😱
heady echo
whole cloud
Can you try manually going back to v28 using the google drive download, and seei...
I am in work but reading some stuff about cpu cores count up in the chat etc I might have messed with that I will try reverting all changes before Incase it’s a me problem lol , completely forgot about it
I’ll test later anyway
opal hound
Is it possible for me to check if a server is running profiling?
whole cloud
I think the server browser shows you the build number.
But whether perf or prof, no
opal hound
that's fine, that's what I needed
slender lagoon
what is the difference between perf and prof?
whole cloud
One does profiling, the other doesn't
 nocturne cairn
anyone know how to fix 'Files are not signed by a key accepted by this server'
opal hound
which files
nocturne cairn
literally just put the html in the html modlist loader on the startup and loaded the list into the files list
nocturne cairn
opal hound
which files
mods
quaint flame
nocturne cairn
rog thanks
opal hound
Anyway, still getting issues with both players stuck in the lobby screen and Wrong signature for file shortly after join
This only seems to happen on the higher traffic server of the two running profiling, players who cannot get past lobby on server 1 (high traffic) seem to be able to connect to server 2 just fine with the same session
Network settings have been tweaked but neither seems particularly network or performance stressed
fast hornet
opal hound
that's fine, that's what I needed
stumbled upon https://arma3-servers.net/version/2_18_152881/ a while ago.. no idea who runs the site etc. - but their gui version filtering is kinda neat 🙂
opal hound
okay thank you, that actually helps a lot. they are running different versions 🙃
1 is 152803 and 2 is 152881
whole cloud
Trying to figure out the "last" netcode bug.
Split messages need to be re-assembled.
For that the messages need to go into reassembly step in correct order.
There is a bug where, while a re-assembly of a message is active, a part of a different message comes in. And two different messages get spliced together and cause corrupted data to be processed.
So, the mess.
The server only accepts messages in a certain range, to filter out way too old messages.
That range is regularly moved up, when new messages come in.
But it doesn't consider when a old message was still missing, it can just move the range beyond it.
So when the message that we were missing, finally comes in. We just drop it because its too old.
Meanwhile the other code is still waiting for that message to hopefully come in, with thousands of messages depending on it, queued up.
Usually, when a guaranteed, ordered message was lost. The game cannot continue, it should just trigger a disconnect but it doesn't.
The ordering works such that each message contains the serial number of its predecessor.
The receiver then checks if it had already received the predecessor, if not then its queued up until it arrives.
So you'd think if one message in that long chain goes missing, everything would be held up until we disconnect.
But, we do not send the predecessor to the last ordered message, we set the predecessor to just the last message.
So, server sends a unordered message, that does not get queued up because it doesn't have any predecessor that could be missing.
Then the next ordered message comes in, we did get its predecessor so its fine, we let it through.
And.. We just successfully skipped over thousands of queued messages.
We missed thousands of guaranteed messages that should never go missing, and we have a big section of messages in the queue, that will never be resolved, because the missing part will never come in.
TCP does this by just refusing to accept new messages when there are too many ones queued up. But we just don't do that :/

gritty wasp
Meanwhile the other code is still waiting for that message to hopefully come in, with thousands of messages depending on it, queued up.
Hachikō will wait.
whole cloud
But, we do not send the predecessor to the last ordered message, we set the predecessor to just the last message.
Fixing that "works".
Instead of the ordering chain breaking and invalid messges being spliced together.
Messages just forever get pushed into the queue.. up to16gb memory usage and 11 billion messages in the queue 🤣
opal hound
Anecdotally, startup seems better after todays update, less (or less severe) CPU spiking
quaint flame
Did you look into that valve netcode thing you posted a few days ago? Anything usable from that?
whole cloud
Lots of usable things in there surely, but no.
whole cloud
No
median belfry
whole cloud
No
isn't the issue with items vanishing that guaranteed messages are getting lost?
whole cloud
No
ripe anchor
whole cloud
Lots of usable things in there surely, but no.
Usable things that will be implemented later on or nope?
heady echo
whole cloud
Can you try manually going back to v28 using the google drive download, and seei...
yes v28 works, I load in instantly to the server. The only difference i notice is I have a map loading screen pic on v28 where as its a black screen on newest version
just before it I reverted my cpu affinity etc and it still would hang on the loadscreen for ever, it was frozen in taskmanager.
heavy vortex
As a dumb test, try setting -cpuCount=4 (or some other suitably low value) and see if that fixes it with v31.
vivid rune
whole cloud
Trying to figure out the "last" netcode bug.
Split messages need to be re-assem...
Would this fix maybe also the connection error of clients to the server that caused by to long mod string? Workaround for that was to increase "steamProtocolMaxDataSize" size in the server config.
whole cloud
ripe anchor
Usable things that will be implemented later on or nope?
Potentially
whole cloud
heady echo
yes v28 works, I load in instantly to the server. The only difference i notice i...
Then it's something netcode, and not CPU related.
But why only you 🤔
Frozen in task manager?
Does the game generate freeze dumps to RPT folder?
If not then you can manually create a memory dump by right clicking it in the task manager details panel, with that I should be able to see where it's hung
whole cloud
vivid rune
Would this fix maybe also the connection error of clients to the server that cau...
No
gritty wasp
Let's continue with guessing. My turn. This will fix signature check kicks?
whole cloud
It would fix the game crashing when spamming several MB/s of publicVariable/remoteExec data to it
inland dew
have tested my 14900ks (32 threads, so 8 p + 8 ht +16 e), but with ht disabled in the bios, so 24 threads total (8 p + 16 e)
8 p + 16 e (24 threads ht off) and not using -cpuCount=24 - fps is similar to -cpuCount=8
-cpuCount=8 - fps is lower than with -cpuCount=24
avg of min fps and avg of avg fps after 7 runs per setting, not counting the 1st run
heavy vortex
So, server sends a unordered message, that does not get queued up because it doesn't have any predecessor that could be missing.
Then the next ordered message comes in, we did get its predecessor so its fine, we let it through.
Could this have caused loss of guaranteed messages even in the case where there wasn't a split message waiting for reassembly?
whole cloud
Yeah.
The split reassembly stuff is on a different layer than this problem
heavy vortex
Excellent
inland dew
somehow, fps is always lower, if one doesn't use -cpuCount...
all 32 threads (ht on) and not using cpuCount, results in lower fps than when using -cpuCount=32
same when 24 threads (ht off) and no cpuCount vs. -cpuCount=24...
but yeah, with ht on, fps is the lowest, cpuCount or not
inland dew
ok, p+e cores (ht off) and -cpuCount=24 it is then
whole cloud
The number of actually used threads is listed in the top of RPT.
Afaik the current limit is 16
All that enableHT/cpuCount does, is change that number.
inland dew
limitFPS works in a strange way...
if i do -limitFPS=500, it results in 330-333-337 fps max displayed in video settings right upper corner...
so i have to set it to a way higher number so it tops out at 500 fps max for real
fast hornet
server fps was always about ~10% below the set limit for some reason.. at least according to diag_fps
inland dew
default is 50. but it's never 50. max is like 46 or 47, i think
and that only occasionally
most of the time less than that
heavy galleon
fast hornet
server fps was always about ~10% below the set limit for some reason.. at least ...
and mine is set to 75 and I usually get 76 xD
inland dew
whole cloud
The number of actually used threads is listed in the top of RPT.
Afaik the curre...
oh! i see!
so setting cpuCount to >16, boosts fps, provided one really has more than 16, since auto detects only max 16. 👍
now i understand
 heavy galleon
Do you want the game to run on E-cores though? 
inland dew
heavy galleon
Do you want the game to run on E-cores though? <:haha:1092735305662091344>
fps is higher with e
having p+e on, but doing -cpuCount=8, results in lower fps
disabling e cores in the bios, also results in lower fps
tested that today and many times in past few years...
fast hornet
at least when i tested the server on a 13900 it was massively faster when i set affinity and cpuCount to the 16 p-core threads.. e-cores just messed things up. I'm just using the e-cores for other stuff like the system and database and such
patent sky
heavy galleon
Do you want the game to run on E-cores though? <:haha:1092735305662091344>
AMD has 16 core cpu's without Big/little architecture
heavy galleon
do you mean big.LITTLE?
(literally passed an course today that touched that topic  )
)
Anyway, which ones are those?
inland dew
fast hornet
at least when i tested the server on a 13900 it was massively faster when i set ...
that's not how it works thought...
when you have ht and e enabled in the bios, both at the same time, fps is the worst.
but if you have only p + ht or only p+e, fps is the best
patent sky
r9 9900X(3D) has 12 cores
9950X(3D) has 16
7000 series also has some iirc
inland dew
so fps was lower, not because of e, but because of having ht and e enabled at the same time
fast hornet
inland dew
that's not how it works thought...
when you have ht and e enabled in the bios, b...
that doesn't correlate with my findings at all.
heavy galleon
patent sky
r9 9900X(3D) has 12 cores
9950X(3D) has 16
7000 series also has some iirc
do those really have ecores?
patent sky
heavy galleon
do those really have ecores?
no, thats why I said "without Big/little architecture"
heavy galleon
ah, can't read
fast hornet
Current AMD series have chiplets with a number of cores on each of them. With X3D models one of those chiplets has the bigger cache while the other doesn't. Also communication/bandwidth is better within the same CCD compared to cross-CCD.
inland dew
hyper-threading hurts only if e-cores are also enabled.
if e-cores are disabled in the bios, so one has only p-cores, hyper-threading boosts fps, of course.
tested dozens of time in a3, with different patches, with way too many runs
since amd isn't hybrid, smt on amd doesn't hurt perf at all
heavy galleon
but, the chance of a long running task being put on ecore and you havaing to wait for it 
inland dew
so either disable ht in the bios or you disable e-cores
p+ht (no e) or p+e (no ht), fps is ~same
heavy galleon
or make arma not being ran on e-cores what so ever and keep them taking care of ts, windows, browser  the way they are intended to be used
inland dew
heavy galleon
or make arma not being ran on e-cores what so ever and keep them taking care of ...
well, like i already said - fps is higher than just running on p-cores
i have ht disabled in the bios, since i have e-cores and ht off = way lower cpu voltage and p-cores temperature or higher p-cores frequency at same voltage/temperature
so the choice is obvious - ht off (why split each core in 2), since you have 16 more real cores that are way more powerful than just threads and there are twice as many of them
(offtopic off...)
 gusty viper
inland dew
_limitFPS_ works in a strange way...
if i do -limitFPS=500, it results in 330-33...
gusty viper
inland dew
_limitFPS_ works in a strange way...
if i do -limitFPS=500, it results in 330-33...
The reason for FPS limiter being off is that the Arma process does not set a fine grained timer resolution. See also: #perf_prof_branch message
whole cloud
inland dew
oh! i see!
~~so setting _cpuCount_ to >16, boosts fps, provided one really has m...
No you don't understand. cpuCount is also limited to 16
inland dew
if so, why is fps consistently higher then, when using -cpuCount=24 (ht off) or -cpuCount=32 (ht on) vs. not using cpuCount with ht off or on, thus defaulting to auto 16?
not by much, but reproducible
min fps only marginally, but max fps one can easily see the difference, thus also slightly different avg, over multiple runs, 5-7+ runs (not counting the 1st run)
light cargo
huh strange
maybe something could be done about that
what's puzzling is how you get higher fps with e cores
fast hornet
he doesn't get higher fps with arma being on e-cores as well, but e-cores being enabled in general. Since the system scheduler can shift non-arma threads to the e-cores and thus leave more room for arma on the p-cores.
At least that would be more consistent with my own tests.
light cargo
oh okay
woven loom
One again I shall suggest that Arma 3 get an Intel APO profile 😄
Otherwise feels like BI has to fix an Intel/OS level issue
inland dew
you can use Intel APO though, even if it doesn't have an arma specific profile.
helps in many games that don't have a profile
i see that min and max fps fluctuate really a lot, for my liking (not within margin of error)
so will redo tests, just comparing avg fps that is somewhat ok
min fps difference from run to run up to 10 fps sometimes
max fps difference from run to run can be even higher
woven loom
inland dew
you can use Intel APO though, even if it doesn't have an arma specific profile.
...
You can, but I think that's somewhat experimental per my understanding. Different from if Intel specifically tunes a profile for the game.
inland dew
sure. but one can try and see if it still helps
slender lagoon
inland dew
if so, why is fps consistently higher then, when using -cpuCount=24 (ht off) or ...
placebo effect?
inland dew
rerunning everything, killing all unnecessary background stuff and pc reboot on each parameter change, for max consistency
inland dew
ok, between 8p+8ht+16e, 8p+16e (no ht no cpuCount) and 8p+16e (no ht with cpuCount) there is less than 2 fps min difference and less than 1 avg fps difference...
so whether one limits to 8 threads only or auto 16 max (8p+8e?) - there is no difference...
no affinity used!
will now try using affinity and cpuCount
heavy vortex
win10 or win11?
inland dew
10
inland dew
fast hornet
at least when i tested the server on a 13900 it was massively faster when i set ...
done affinity from 0 to 15 in task manager, with ht enabled in the bios + cpu count 16 and fps is bad...
heavy vortex
Try setting affinity a bit higher than cpuCount.
 empty goblet
inland dew
done affinity from 0 to 15 in task manager, with ht enabled in the bios + cpu co...
empty goblet
inland dew
done affinity from 0 to 15 in task manager, with ht enabled in the bios + cpu co...
check if your your primary and active threads aren't on the worst possible e-cores / non physical cores
woven loom
i think you need a spreadsheet 😄
heavy vortex
Apparently the listing order for these is P-cores first, with 0/1 as the SMT cores for one P-core.
So if you were doing 8-core affinity with HT enabled you'd probably want 0/2/4/6/8/10/12/14.
 cold vale
TIL: -debug doesn't appear to be detected properly if included in a -par file
whole cloud
inland dew
if so, why is fps consistently higher then, when using -cpuCount=24 (ht off) or ...
Magic or placebo.
potent sparrow
fast hornet
he doesn't get higher fps with arma being on e-cores as well, but e-cores being ...
mine as well - 13500, taskset -c 0-11 was the best setup I found, I tried to be smart and taskset the cores more finely to number of processes (since 1 server/3HC's divided nicely into 12) it did not go well :D, in the end I just landed on "stay on the p cores"
knotty wraith
I checked Intel APO on ARMA - no effect
to get better fps on win 10 i played with lasso and cpucount, but after installing win 11 - it was not necessary: win 11 loads P cores correctly
as a result, I got the same fps on win 11 that I got on win 10 with the help of dancing and tambourines
but I couldn't get more fps on win 11, no matter how I twisted the cores up and down
inland dew
whole cloud
Magic or placebo.
i retested for several hours, with reboots for each setting change and yes, there is no difference between autodetect, -cpuCount=16 or 24.
the worst performer was -cpuCount=16 with affinity 0 to 15, whith hyper-threading on.
-cpuCount=8 with affinity 0 to 7, with hyper-threading off, was 2nd worst
-cpuCount=8, but no affinity, with or without hyper-threading, was 3rd worst
then -cpuCount= 16, 24 or autodetect, with hyper-threading on, were all kinda same.
the best was with hyper-threading off in the bios and autodetect or -cpuCount=16
basically, when one has hyper-threading on and/or locks arma to p-cores only via affinity, fps is the worst.
when no affinity, even if -cpuCount=8, it's limited to 8 threads total, but not specifically 8 p-cores, but also e-cores.
fps is higher this way, because although e-cores are slower and don't do much, it results in having access to more cache, since e-cores have separate/additional L1 and especially L2, per cluster of 4 e-cores
knotty wraith
as Dedman noted, this is not a game problem, but an OS problem...
slender lagoon
Thank god i switched to amd
knotty wraith
slender lagoon
Thank god i switched to amd
I'm sure Groove is doing this for the sake of the test, he has the opportunity.
out of interest 14900ks is the best processor for a server? is there an analog for amd? sorry for offtopic, but just since the topic about 14900 ks came up
Sorry it's not in English, but you'll understand the gpt rating
 slender lagoon
he kept testing for days he probably had a brain melt down 😂
 plain trout
#hardware_vs_arma should be the better source
fading seal
inland dew
i retested for several hours, with reboots for each setting change and yes, ther...
So, in theory, isolating L1 and L2 to a single thread could give a little boost? In my case L2 and L1 are shared by a "real" core and a "ht" core for example
I'll probably still be bottleneck-ed by my old ass CPU but I remember this boosts CPU mining as well
whole cloud
cold vale
TIL: `-debug` doesn't appear to be detected properly if included in a `-par` fil...
correct, there are a few parameters that don't work in -par file.
Some need to be, because they need to be applied before files can be loaded.
I can probably put debug into both though. You might just miss it with early logging
The par file needs the config parser.
The config parser has the ability to store context, and context is only used if -debug is enabled. So -debug must've been read before reading the par file, otherwise the context's in that config parsing would be lost.
But in practice thats probably not an issue
Also there is a check for exThreads in par file, that tells you that it didn't take effect because it doesn't work there.
But the other parameters that also don't work there don't report it
-exThreads can be specified via command line onle, not in the .par file
including typo
Our code actually lets you set cpuCount in par file.
But it has no effect because the job system was already initialized before that.
Actually the par file is loaded before the job system loads.
But the cpuCount is only checked before the par file and a second time after the job system was initialized 😄
light cargo
odd
cold vale
Yeah I figured most people don’t use the par file so some behavior may have fallen through the cracks but this is for a test env so not really an issue I can’t work around. I only noticed because the web browser commands threw an error/warning about the missing arg.
whole cloud
btw argo had a -cpuAffinity parameter. Which theoretically I could enable.
Not sure if that actually works well
whole cloud
cold vale
Yeah I figured most people don’t use the par file so some behavior may have fall...
And thats because you then noticed that the context was missing?
Not the commands throwing the error because -debug wasn't set right?
cold vale
Yep, checked the RPT and it was significantly smaller than usual lol
light cargo
whole cloud
btw argo had a -cpuAffinity parameter. Which theoretically I could enable.
Not s...
with some adjustments that could work for excluding e cores without going into the bios
whole cloud
Also taking that chance to add some warnings.
17:38:12 WARNING! Process affinity was attempted to be set to more cpu cores than the system has (36 out of 32). Wanted mask: 0xFFFFFFFFF Available mask: 0xFFFFFFFF
17:38:14 Process affinity forced to 0xFFFFFFFF (requested 0xFFFFFFFFF)
17:38:15 WARNING! specified cpu count, and cpu affinity, do not add up to the same number. cpuCount: 12 affinity:32. Remove -cpuCount parameter, the affinity parameter will set the count.
17:42:32 WARNING! CPU Count is higher than available CPU cores according to affinity mask. Performance will be inhibited! Wanted: 16 Available: 2
This also detects when the affinity is set by task manager or process lasso.
But only if it happens very early before the job system is initalized
17:56:46 -exThreads= can only be specified via command line, not in the .par file
17:56:46 -minimize can only be specified via command line, not in the .par file
17:56:46 -maxFileCacheSize= can only be specified via command line, not in the .par file
17:56:46 WARNING! CPU Count is higher than available CPU cores according to affinity mask. Performance will be inhibited! Wanted: 16 Available: 3
inland dew
well, if one can't specify specific threads as affinity, but only total number of them, it doesn't help, imho
whole cloud
You can set the affinity mask for the whole process.
I thought about maybe doing thread pinning too, but nah
inland dew
if you don't want to disable ht/smt in the bios, but want to avoid it, using affinity, then you have to be able to select specific threads, not just their total number
heavy vortex
Might be a misunderstanding. The affinity mask gives full control over which CPU cores the process will use.
What's not defined is which Arma threads end up on which cores.
inland dew
heavy vortex
What's not defined is which Arma threads end up on which cores.
cpuCount no, but affinity should.
if no, then it's not any better than cpuCount
whole cloud
task manager cpu 0 and 1 == -cpuAffinity=0x3
whole cloud
inland dew
cpuCount no, but affinity should.
if no, then it's not any better than cpuCount
Where did you get the idea that the cpu affinity parameter, would not set the cpu affinity?
light cargo
and wouldn't it be useful to have thread count parameter or that's scope creep?
heavy vortex
That's what -cpuCount does.
inland dew
whole cloud
Where did you get the idea that the cpu affinity parameter, would not set the cp...
in your warning messages, affinity:32
whole cloud
That is the count, by counting how many bits are set in the affinity mask
light cargo
also i saw #community_wiki why 2.22 despite it being on profiling ? means it'll supposedly land to stable after that much testing?
inland dew
i think that doing affinity as only "good" for sever owners
whole cloud
light cargo
also i saw <#105465701543723008> why 2.22 despite it being on profiling ? means ...
"why"
What else would it be if not that?
light cargo
is there a reason for the parameter to be in hex instead of decimal?
heavy vortex
lol
whole cloud
light cargo
is there a reason for the parameter to be in hex instead of decimal?
it supports both. You might even be able to do octal if you wanted
light cargo
whole cloud
"why"
What else would it be if not that?
oh it could land on 2.20 because why not
whole cloud
light cargo
oh it could land on 2.20 because why not
Because 2.20 is already closed
light cargo
Ahhhh got it!
heavy vortex
It's not gonna be very readable in decimal :P
light cargo
feature freeze when rc opens?
inland dew
because if you do affinity, as player (not server owner with 1 machine and more than 1 server on it), you cut off access e-cores that have additional cache, thus higher fps
so better to use cpuCount or autodetect, so it uses like 8 threads, but not specific, rather any, so arma can access e-cores additional cache
fast hornet
knotty wraith
out of interest 14900ks is the best processor for a server? is there an analog f...
For an Arma 3 Server the absolute best would be the X3D-CCD of a 9950X3D if you wanna go all in.. nothing will come close.
inland dew
linux -> amd 3d, windows -> intel
just as player -> amd 3d
restive pilot
whole cloud
it supports both. You might even be able to do octal if you wanted
is binary with 0b supported too?!
whole cloud
-cpuAffinity only works on windows. Because.
whole cloud
restive pilot
is binary with 0b supported too?!
inland dew
but yeah, please, implement/port it
might be useful -> no lasso
fast hornet
is -cpuAffinity in v31 already? Or will it come in the 2.20 perf versions? 🙂
inland dew
practical for server owners
whole cloud
fast hornet
is -cpuAffinity in v31 already? Or will it come in the 2.20 perf versions? 🙂
I did that stuff today
woven loom
fast hornet
For an Arma 3 Server the absolute best would be the X3D-CCD of a 9950X3D if you ...
Is there an advantage of the 9950X3D vs 9800X3D? Can A3 server actually use the extra cores?
fast hornet
woven loom
Is there an advantage of the 9950X3D vs 9800X3D? Can A3 server actually use the ...
you'd put the rest of the system threads onto the other CCD, so A3 would have the X3D exclusively.. besides that, no, no advantage over the 9800X3D.
woven loom
Ah okay that way
scarlet jolt
well, I've managed to break something.
Working on a mission, right click play as unit on a guy, spawned in and instantly froze, RPT spamming something about freeing memory and had to force quit the game.
opal hound
I had a similar thing yesterday but I think it was just me running out of memory
21:46:35 Longest free VM region: 4161123216 B
21:46:35 VM busy 116 GiB (reserved 94 GiB, committed 22 GiB, mapped 339 MiB), free 130956 GiB
21:46:35 Small mapped regions: 52, size 245760 B
21:46:35 Emergency memory free, freed 8 KB
21:46:35 Virtual memory total 131072 GiB (140737488224256 B)
21:46:35 Virtual memory free 130956 GiB (140612833492992 B)
21:46:35 Physical memory free 22 GiB (23948861440 B)
21:46:35 Page file free 11 GiB (11805655040 B)
21:46:35 Process working set 8.7 GiB (9319452672 B)
21:46:35 Process page file used 21 GiB (22974926848 B)
``` x about 50
Some odd numbers in thereYup same as mine
14:32:54 Emergency memory free, freed 8 KB
14:32:54 Virtual memory total 131072 GiB (140737488224256 B)
14:32:54 Virtual memory free 131053 GiB (140716983119872 B)
14:32:54 Physical memory free 14 GiB (15080443904 B)
14:32:54 Page file free 24 GiB (26225020928 B)
14:32:54 Process working set 5.1 GiB (5522493440 B)
14:32:54 Process page file used 13 GiB (14373502976 B)
14:32:54 Longest free VM region: 134607568 B
14:32:54 VM busy 19 GiB (reserved 5.2 GiB, committed 14 GiB, mapped 336 MiB), free 131053 GiB
14:32:54 Small mapped regions: 32, size 135168 B
@scarlet jolt Can you replicate?
empty goblet
whole cloud
You can set the affinity mask for the whole process.
I thought about maybe doing...
ok, but ... what could you use to tell arma3(server) process which CPU use as the primary cpu for the primary thread ? ... meaning , using out command-line parameters
ie let say the core 6 is the best core of all the cores 😁 hence i want that core to be the the primary core for the primary thread (for now the most intensive/important thread)
plain trout
empty goblet
ok, but ... what could you use to tell arma3(server) process which CPU use as th...
You limit the top frequency of the other cores. That will make Windows choose the one that has the highest clock speed
empty goblet
and no i don't trust Microsoft kernel scheduler, because in 101 of 100 cases it got the answer wrong
plain trout
That’s an older workaround for the 7950x3d when their drivers still had issues properly utilising the cached cores
empty goblet
plain trout
You limit the top frequency of the other cores. That will make Windows choose th...
sorry to burst your hope bubble there but not even that work
plain trout
It worked with the 7950x3D.. at least for gaming
empty goblet
worked is the correct definition, past sense, not anymore (and it was only with the certain AMD driver/AGESA versions)
for intel it was worse, always
scarlet jolt
heavy vortex
<@275726520641781767> Can you replicate?
nope, I've been trying but no luck
heavy vortex
5.1 GB is kinda small as a working set. Do you use -maxmem to constrain usage?
scarlet jolt
Nope
woven loom
fwiw i just tried in a blank mission on stratis, no mods, and it was fine. So definitely more going on
heady echo
whole cloud
Then it's something netcode, and not CPU related.
But why only you 🤔
Frozen i...
I can't recreate it on v31. Its now working as intended 🙂
If it happens again I'll create a dump, its strange because I reinstalled twice etc, All I've done since then is go back to v28, then I verfied files on steam and its fine now.
thin wyvern
empty goblet
ok, but ... what could you use to tell arma3(server) process which CPU use as th...
For client set affinity to some cores 0,2,4,6 game still see 8 cores...from .rpt w/ affinity=155 in batch file CPUCount : 8 😕
and get fps drop

I get best min fps on my 5800X3D w/ ht or cpucount
woven loom
For a 5800X3D you probably don't need to do anything. On my 7800X3D I just let the game auto-detect
thin wyvern
And I have set priority to Above normal in registry for arma3_x64
thin wyvern
woven loom
For a 5800X3D you probably don't need to do anything. On my 7800X3D I just let t...
Look in .rpt file how many cores game see
8 right?
woven loom
Can't check right now but I think it's 8 yeah
thin wyvern
Test YAAB w/ cpuCount=16
woven loom
Why though, it's unnecessary
thin wyvern
Look in my pic and you will see that I have best min fps with that patrameter or ht on
SMT is on in bios
woven loom
Your FPS results look like they're always within 2-3 fps. That's equivalent. YAAB has some run to run variation in fps anyway.
Min fps is especially going to vary a bit because the benchmark involves lots of AI and they can behave somewhat randomly
thin wyvern
w/ cpu or ht I get >60 but if I set affiniry to some cores I get lower or some drop to 2 fps 🤔
 woven loom
From what I can see, CPU count 16 result is the same as HT enabled CPU count 8 is the same result as affinity FFFF
System affinity is 1-2 fps lower on average
thin wyvern
With cpu and ht game report 16 cores in .rpt
woven loom
Yeah because HT just doubles CPU count
thin wyvern
woven loom
System affinity is 1-2 fps lower on average
But fps drop?????
woven loom
Yes, so you can turn on HT because you get slightly higher fps when you enable it.
Or change CPU count to 16. For the game it's the same effect.
Don't bother with affinity
thin wyvern
W/ affinity set, game always report CPU count 8 🤷♂️
And have fps drop if affinity not set to 0,1,2,3 or 4,5,6,7 order 🧐
woven loom
So the issue is that you want to set affinity while enabling the HT parameter?
thin wyvern
woven loom
So the issue is that you want to set affinity while enabling the HT parameter?
No
heavy vortex
555 affinity is only six cores, so I sure hope you set cpuCount 6 for that one.
thin wyvern
heavy vortex
555 affinity is only six cores, so I sure hope you set cpuCount 6 for that one.
Yes I miss one 5 👴
5555
And I only set affinity in batch and don't use cpucount or ht
heavy vortex
Hmm. My conclusion with most of these tests is that 881 is still extremely intolerant to having even slightly less cpu resources than it's expecting.
thin wyvern
Like this START "ArmA 3" /affinity 155 "C:\Igre\steamapps\common\Arma 3\arma3_x64.exe" -setThreadCharacteristics -hugePages -malloc=mimalloc_v219 -cfg=test.cfg -name=test -world=empty -ShowScriptErrors -noPause -noPauseAudio -debug "-mod="
heavy vortex
Trouble with 8-core affinity is that other processes might still hit those cores a bit.
woven loom
I am just confused why you want to set affinity when setting ht or CPU count give you the same performance benefit as setting affinity, and with less headache
thin wyvern
heavy vortex
Trouble with 8-core affinity is that other processes might still hit those cores...
That why I try 5555 to set affinity to "real" cores
woven loom
On the newer Intel CPUs it makes sense, on AMD I think it's mostly pointless given the tiny benefit
heavy vortex
woven loom
I am just confused why you want to set affinity when setting ht or CPU count giv...
It's a reasonable lack of trust in the OS putting threads in the right place. But yeah, for A3 perf branch it doesn't seem to work well.
thin wyvern
I don't try w/ SMT off in bios..maybe in next few days
empty goblet
thin wyvern
For client set affinity to some cores 0,2,4,6 game still see 8 cores...from .rpt...
completely different problem ... i care about what the primary thread uses as it's home-core first and then about the rest of available cores / affinities
thin wyvern
empty goblet
completely different problem ... i care about what the primary thread uses as it...
For server that is 💯
heavy vortex
It should follow that SMT off will have similarly bad performance. Unless there's something else going on.
empty goblet
i know how 'trick' it as workaround (not via game engine) but it's not perfect and has some flaws
heavy vortex
In that case Arma's still expecting a whole 8 cores to itself.
woven loom
There is no reason for normally configured processors to turn off SMT
empty goblet
thin wyvern
For server that is 💯
there is no 100% ... , imagine server CPU has 16 (or 32) cores ... i want primary thread to be at 6th core and use ALL cores for the rest
thin wyvern
woven loom
There is no reason for normally configured processors to turn off SMT
Yes but for test I will try that
thin wyvern
empty goblet
there is no 100% ... , imagine server CPU has 16 (or 32) cores ... i want prima...
That is best core on that cpu?
woven loom
heavy vortex
It's a reasonable lack of trust in the OS putting threads in the right place. Bu...
I guess, I just think that operating systems do a mostly fine job unless it's with something funky like Arrow Lake etc. Especially with X3D chips, most of your performance comes from the cache, the threads are usually being fed pretty well.
empty goblet
the flaws i know is that
- A. windows kernel assigns random core to the primary thread
- B. windows kernel assigns last core to the primary thread
- C. sometimes the A or B cores are HT sometimes not
plus - D. if running multiple processes sharing same core, theirs primary threads ends on the same core from A or B and C case even after the load is already distributed (delayed start)
- E. cases A to D happens even if using manual forced affinity across multiple cores
woven loom
If the frame times are fine and you can't tell then 1-2 fps difference is academic
empty goblet
so while i have makeshift workaround solution how mitigate this, it's flawed
empty goblet
empty goblet
the flaws i know is that
* A. windows kernel assigns random core to the primary ...
also this ends badly if you have like 4 or dozen server processes running on the same system and the windows kernel scheduler decides all the primary threads will run on last core 🤣
and no the (in example) last core isn't the fastest or gold or least used etc.
hence i would prefer way to designate desired primary core for primary thread of the process w/o being forced to do it manually with messy workaround (which come with other problems)
thin wyvern
Until AMD and Intel along with M$ fix this, we're screwed.
empty goblet
empty goblet
hence i would prefer way to designate desired primary core for primary thread of...
hence why i would like to know if this is doable or not, i know there is way to define target core for (new)threads
thin wyvern
I'm ignorant about Linux but maybe you can try there
thin wyvern
woven loom
If the frame times are fine and you can't tell then 1-2 fps difference is academ...
5fps difference is not the problem but fps drop is
 plain trout
In windows 10 I was able to manually set which cores a process was allowed to use. I’m not sure if 11 still allows that access
runic sigil
It does, in basically the same way (task manager in details tab is the easiest)
(Called core affinity)
It's less needed most of the time, since 11 has a better scheduler for the most part
Process Lasso works for setting it persistently on a process, other ways as well (Process Lasso has to be running for it to do that though)
woven loom
thin wyvern
okay but then don't use affinity?
here are my results
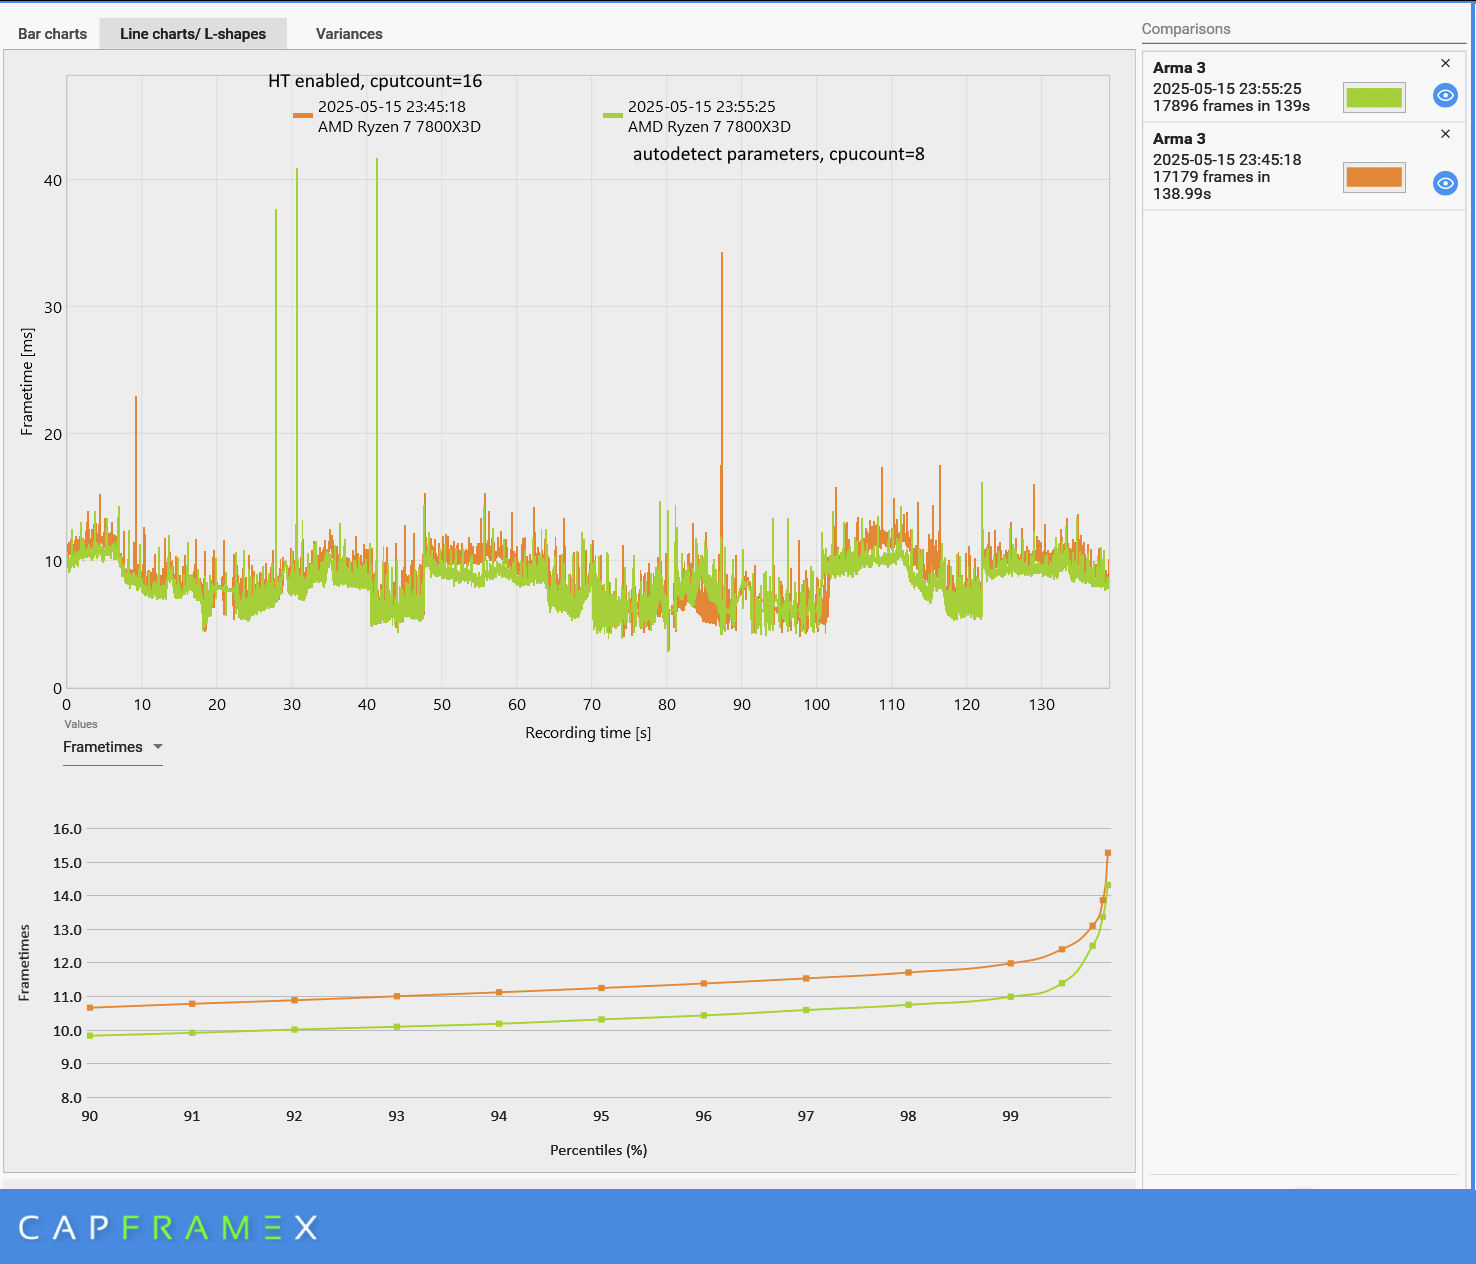
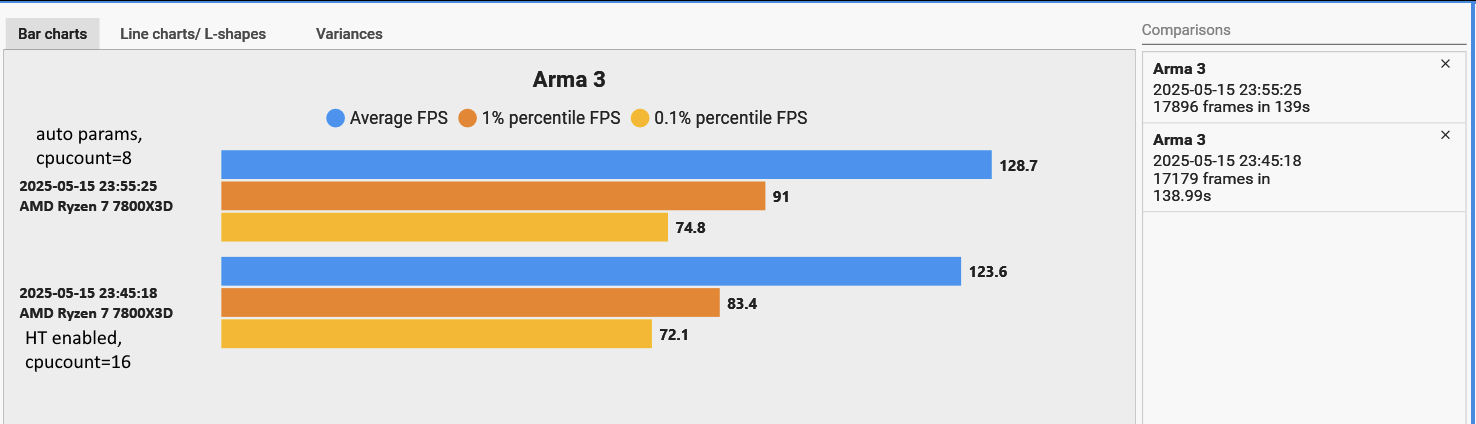
HT enabled does measurably worse by 3-5 fps
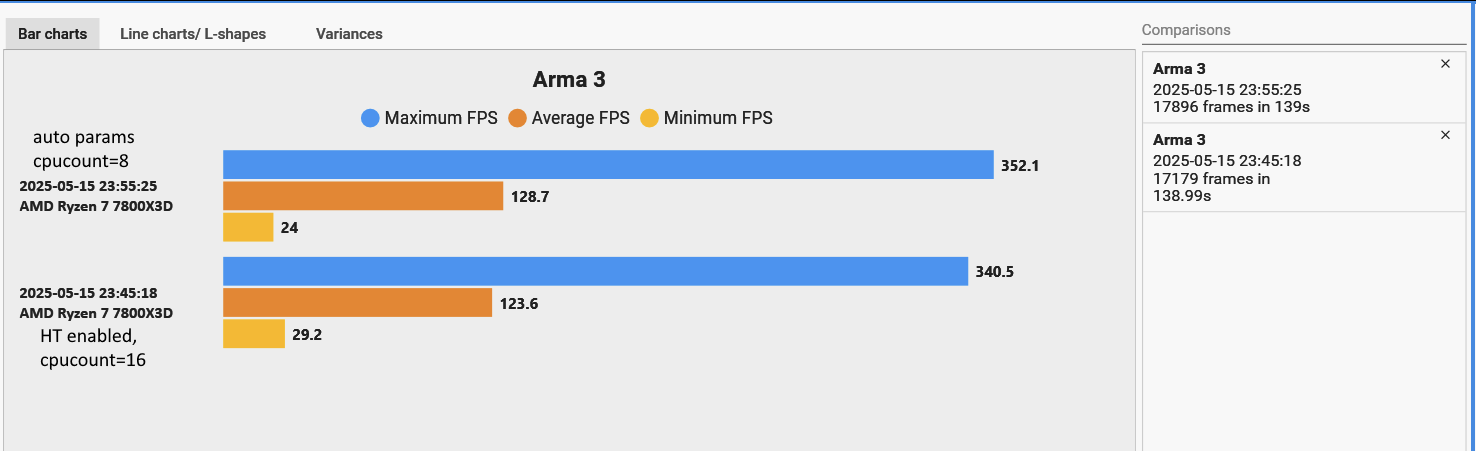
If you look at absolute minimum fps, it is higher for HT. But there will always be some random frames that drop really low in YAAB. It is meaningless, because overall in my case the game does better without manual affinity settings and without HT parameter.
You want to see averages along with 1% slowest or 0.1% slowest fps/frame times. And the autodetected parameters (i.e. cpu count 8) does better than HT.
(BTW when i say CPUcount=8 or CPUcount=16, i am just reporting what i see in the RPT file. I am not setting cpucount parameter manually ever).
I did not change anything with affinity.
Using an alternative memory allocator like mimalloc will gain you much more benefits than trying to control the affinity and stuff in my opinion. see: https://github.com/GoldJohnKing/mimalloc/releases

GitHub
mimalloc is a compact general purpose allocator with excellent performance. - GoldJohnKing/mimalloc
whole cloud
scarlet jolt
well, I've managed to break something.
Working on a mission, right click play a...
Vanilla? Mods? Reproducible?
whole cloud
empty goblet
ok, but ... what could you use to tell arma3(server) process which CPU use as th...
Switching between CPU's is not supported by us.
The affinity affects the "primary cpu" so if you use some external tool, to move the process to a different cpu before it starts, then the affinity would affect there
Oh you mean which core.
We don't do thread pinning as I wrote above
whole cloud
thin wyvern
For client set affinity to some cores 0,2,4,6 game still see 8 cores...from .rpt...
The game cannot see externally applied affinity and the native Parameter doesn't exist till next update
I can add you a parameter to pin main thread though.
We at some point used to pin the main thread to the core that it started on. The code is there
scarlet jolt
whole cloud
Vanilla? Mods? Reproducible?
modded, tried to follow my steps but no repro
thin wyvern
woven loom
Using an alternative memory allocator like mimalloc will gain you much more bene...
empty goblet
whole cloud
I can add you a parameter to pin main thread though.
We at some point used to pi...
that one would be useful
whole cloud
empty goblet
that one would be useful
-cpuMainThreadAffinity=0xFF
done
 rustic swallow
I can't log into the game with profiling. I click start the game but it doesn't start what's wrong?
whole cloud
how did you install profiling? steam branch?
rustic swallow
yes
whole cloud
Is any RPT file being created?
Starting via Arma launcher, it doesn't open a popup saying it crashed?
rustic swallow
Let me try to record on video what's going on
I think it will be clearer and easier this way.


 restive pilot
rustic swallow
https://youtu.be/YfRpJJ4wE8Y
restive pilot
rustic swallow
https://youtu.be/YfRpJJ4wE8Y
try unchecking cpuCount and exThreads
rustic swallow
It didn't help 😦
rustic swallow
rustic swallow
It didn't help 😦
IT HELPED! Thanks, I just had to wait.
rustic swallow
my fps in YAAB is 51.5 without mods and 23 with mods. nice👍
quaint flame
Wth are these mods
silk pewter
20FPS mod
quaint flame
silk pewter
20FPS mod
I mean. What mod runs so intensively during yaab. We should find that mod and bann it
fading seal
fading seal
So, in theory, isolating L1 and L2 to a single thread could give a little boost?...
Well, I gave it a try and virtually no difference 😢 (on a 2700x anyway)
 real creek
quaint flame
Wth are these mods<:meowsweats:707626030613135390>
real creek
quaint flame
Wth are these mods<:meowsweats:707626030613135390>
Webknight's FPS reducer™️ (ACE3 compat)
fading seal
also, profiling does give a significant-ish boost in FPS even on older hardware (about 9-ish FPS more), in case anyone was wondering 😛
fast hornet
btw. that board you're running the 2700X on most likely also supports a 5700X3D. That would be a massive upgrade for relatively low cost 🙂
fading seal
Yeah I know but it's not the right time 😜
woven loom
Also use mimalloc if you aren't already
woven loom
woven loom
Using an alternative memory allocator like mimalloc will gain you much more bene...
This thing
fading seal
I'll give it a try some time. Worth a shot I guess
weak radish
woven loom
Using an alternative memory allocator like mimalloc will gain you much more bene...
Does minalloc still provide as big a boost compared to the current Intel allocator?
heavy vortex
Probably not, because perf doesn't do as many allocations as it used to.
woven loom
I didn't try with the latest binaries but up until two months ago it still did
It used to be that the lock_pages variant provided the most benefit but now that's default behaviour
Like for me it was a good 10% (~10 fps)
heavy vortex
IIRC there was also a flaw in some mimalloc versions that was fixed recently, so that would compensate.