#perf_prof_branch
1 messages · Page 17 of 1
 whole cloud
whole cloud
whole cloud
multithreading has been enabled by default since the first Arma 3 release in 2013
 raven delta
Is this best practice also?
Large Page support - enabled
Extra threads - DISABLED
Hyper-Threading - DISABLED
whole cloud
yes
raven delta
Lovely
We saw a 20FPS increase with those changes.
And CPU count can be left untouched rather than setting the amount of physical cores?
 orchid mesa
raven delta
We saw a 20FPS increase with those changes.
And CPU count can be left untouched...
orchid mesa
raven delta
We saw a 20FPS increase with those changes.
And CPU count can be left untouched...
yes, unless for whatever reason you want to limit how many cores the game can use
whole cloud
raven delta
We saw a 20FPS increase with those changes.
And CPU count can be left untouched...
The game already knows how many physical cores you have, there is no reason to tell it that
raven delta
orchid mesa
yes, unless for whatever reason you want to limit how many cores the game can us...
Yep, if you run multiple servers on the same machine for example
 vague frost
Is the current profiling version of the server/client got this fandangle new stuff yet or is it client branches only atm?
I read that dev and prof branches of client both have the multi-T
wondering if i can throw it on server and have a tickle.
whole cloud
Profiling server and client are equal
vague frost
love ya work boys ❤️
 heavy vortex
raven delta
Is this best practice also?
Large Page support - enabled
Extra threads - DISABL...
heavy vortex
raven delta
Is this best practice also?
Large Page support - enabled
Extra threads - DISABL...
Assuming that you mean "don't specify exThreads" rather than "-exThreads=0"
raven delta
Yup
 stark falcon
2.18.152567 - The disable AI buttons seems to not be working in MP slotting from 3den, both the rectangle at the bottom, and each of the individual ones.
whole cloud
Known and fixed yesterday
 waxen raptor
whole cloud
Profiling server and client are equal
waxen raptor
whole cloud
Profiling server and client are equal
Hey im sorry im bit out of touch, is this version released or yet to be?
whole cloud
See pinned messages for changelogs
whole cloud
2.18.152588 new PROFILING branch with PERFORMANCE binaries, v20, server and client, windows 64-bit, linux server 64-bit
- Added: RscDisplayPassword now stores the server address in the "guid" variable on the display
- Tweaked: The game now uses about 400MB less memory, and 32bit has about 1GB more available memory
- Fixed: Steam Rich Presence would display "__cur_sp" for single player missions if they were only setting the mission name in the editor attributes
- Fixed: CT_WEBBROWSER wrong handling of keypresses (wrong keyCode in JavaScript and missing JS KeyPress event triggers)
- Fixed: Could not disable AI or deselect slots in role selection
If you don't want to use the Steam branch, the files are also available for alternative download here:
https://drive.google.com/drive/folders/15p9j7C2nHUt6NoVfChX4YFuqzFXzblJh
whole cloud
whole cloud
2.18.152588 new PROFILING branch with PERFORMANCE binaries, v20, server and clie...
 vivid rune
- Tweaked: ...and 32bit has about 1GB more available memory
To bad that this cannot be tested, yet
whole cloud
dev branch (do we do 32bit dev branch? 🤷 )
vivid rune
Are these changes actual in 32bit dev branch?
whole cloud
in the next one
vivid rune
The more interesting thing for me would be a 32bit linux server exec but this is not included in dev branch.
whole cloud
(next prof)
1 second at 380fps
43 thousand allocations total.
0 for drawing water
0 for physx
0 for drawing terrain
22k for scripts (can't fix that)
3k multithreading (graph connections between tasks... could somewhat fix that if i wanted to.. but about 7 per frame? eh)
Same run at 40fps limit
again 1 second, at 40fps
3.6k allocations per frame
atleast 1.5k from scripts, hard to count them all
234 multithreading (6 per frame yep.. whatever)
From 1000 allocations per frame last week, down to 90 now. And more than half of it is scripts.
I didn't do any benchmarks, but surely this would have some kind of impact right?
Also optimized config and xml loading, so maybe game starts a bit faster now? haven't measured.
vivid rune
Factor 11. At least there are smoother frame times i would say.
The question is, how big is the allocation thing on the frame in percent actual.
whole cloud
Probably very little
Anyone still have crashes with lambs danger?
After the last fix for it, there haven't been any new reports of it.
raven delta
We’ve had 3 ops with all LAMBS modules - no issues
 woven loom
whole cloud
(next prof)
1 second at 380fps
43 thousand allocations total.
0 for drawing wat...
woven loom
whole cloud
(next prof)
1 second at 380fps
43 thousand allocations total.
0 for drawing wat...
Probably may help make older systems run smoother, reduce pressure on memory... Will test after the 31st
But I'm sure others will too, by then
Unlimiting the engine bit by bit 
(byte by byte?)
heavy vortex
How come scripts are doing so many more allocations at higher frame rates?
 analog acorn
heavy vortex
How come scripts are doing so many more allocations at higher frame rates?
analog acorn
heavy vortex
How come scripts are doing so many more allocations at higher frame rates?
The first set of numbers is [appears to be] the total for the whole 1s run (380 frames) and the second set is for each frame (out of 40). First one works out at about 58 script allocations per frame, I think. Second one works out at 60,000 script allocations total.
So the higher frame rate is doing both fewer script allocations per frame, and fewer script allocations in total.
heavy vortex
Yeah but that makes even less sense :P
 restive pilot
It could be a different environment with different scripts (or same scripts under different conditions)
 void badger
whole cloud
Anyone still have crashes with lambs danger?
After the last fix for it, there ha...
void badger
whole cloud
Anyone still have crashes with lambs danger?
After the last fix for it, there ha...
Did you push a fix in v20? I got another crash last week with v19, Linux+LAMBS
Also using LAMBS Dev FWIW
void badger
Idk about anyone else, I'm having the issue where units on headless clients do not follow orders (see: move orders) with current Perf binary. Works normally on stable
whole cloud
heavy vortex
How come scripts are doing so many more allocations at higher frame rates?
Per frame scripts, run per frame. More frames, more scripts, more allocations from them.
Then there are also scripts that only run every few seconds, and scheduled scripts.
Maybe that one second had more than the other one. That's hard to control for, I just picked a second.
Scripts don't matter anyway because they don't get fixed
whole cloud
void badger
Did you push a fix in v20? I got another crash last week with v19, Linux+LAMBS
No.
You got another crash last week, but you didn't send me any crash report 🙂
I need all the crash reports
whole cloud
Oh.. linux 
I run a linux server with lambs AI on it on profiling. And so far didn't have any issues
void badger
It could also be related to another mod I'm running maybe but that's quite fun to try and figure out...
The most consistent things are that they seem to be floating point exceptions, and they seem to happen after an explosion involving a vehicle, but of course when I'm testing and trying to repro nothing happens...
So could be PhysX related?
whole cloud
possibly. But its weird that floating point exceptions are even enabled
 chilly geyser
whole cloud
(next prof)
1 second at 380fps
43 thousand allocations total.
0 for drawing wat...
chilly geyser
whole cloud
(next prof)
1 second at 380fps
43 thousand allocations total.
0 for drawing wat...
Already in v20, or in next v21?
whole cloud
it says (next prof), and was posted after the v20 changelog
 crystal oasis
Anyone experience some bugs with hatchet when profiling is on?
crystal oasis
sometimes doesn't let you dismount from chopper at all
yesterday everyone just glitched inside of it and couldn't get out
when multiple players are in
whole cloud
Been playing a bunch with it, including a big mission last weekend. No problems (except waypoint, I couldn't get it to work either but I didn't know how to use it in the first place)
crystal oasis
Hmm
whole cloud
Allocations in yaab over 1.5 yaab runs.
Indeed, somehow the memory usage keeps increasing, even in the second run. Even though all resources should've been loaded by now

 honest fulcrum
Could it be something like vehicle texture randomization from bis_fnc_initVehicle when the mission restarts?
whole cloud
honest fulcrum
Could it be something like vehicle texture randomization from bis_fnc_initVehicl...
not 150mb. Maybe 2 at most. Textures are vram not ram
1.5 yaab runs, result in +153mb usage.
And that is even if you only start recording at the second yaab run, where all assets were already loaded.
over 3.5 minutes, 5gb allocated and freed again in 1.5mil allocations..
How about we turn that 1.5mil down to.. 3? 
heavy vortex
If you do a third YAAB run, does it add another 153MB? :P
whole cloud
I don't have enough ram to record so far 😄
 light cargo
huh, finally getting there to the kind of observation i got?
it's a "leak" because it's not releasing the ram occupied
whole cloud
yaab run and return to main menu (does not unload terrain)
30.5mb of objects (normal, terrain is still there)
25+7mb of filecache (normal)
16MB of AI Map (that's weird)
15MB of animations (yeah they stay cached?)
9+8+8MB meshes (cached? and terrain iss till loaded)
nothing really crazy
Need to retest but switch to VR to unload the terrain after
vivid rune
Highly speculative: What if there is somewhere in the engine a hardcoded "upper limit" for some memory budget of files/cache/AI/etc. that's kicks in and want to free memory where it is not needed?
 heavy galleon
Where does one upload this 
 whole cloud
heavy galleon
Where does one upload this <:copium:925376582980341791>
whole cloud
heavy galleon
Where does one upload this <:copium:925376582980341791>
7z compress
whole cloud
Or send me the small one first to see if I even need the big one
heavy galleon
ok
 swift drift
Any ideas why?
21:30:33 Server load: FPS 21, memory used: 3485 MB, out: 0 Kbps, in: 106 Kbps, NG:0, G:0, BE-NG:0, BE-G:0, RQ:0, Players: 15 (L:0, R:0, B:0, G:15, D:0), JIP (T:19 Q:50038)
21:30:43 Server load: FPS 21, memory used: 3498 MB, out: 1 Kbps, in: 101 Kbps, NG:0, G:2856, BE-NG:0, BE-G:0, RQ:0, Players: 15 (L:0, R:0, B:0, G:15, D:0), JIP (T:38 Q:49781)
21:30:53 Server load: FPS 21, memory used: 3500 MB, out: 0 Kbps, in: 93 Kbps, NG:0, G:2567, BE-NG:0, BE-G:0, RQ:0, Players: 15 (L:0, R:0, B:0, G:15, D:0), JIP (T:1 Q:49592)
21:31:03 Server load: FPS 20, memory used: 3501 MB, out: 0 Kbps, in: 96 Kbps, NG:0, G:1547, BE-NG:0, BE-G:0, RQ:0, Players: 15 (L:0, R:0, B:0, G:15, D:0), JIP (T:0 Q:49483)
Seems getting unstuck when someone joins the game.
and out values are back to ```
22:37:17 Server load: FPS 77, memory used: 3114 MB, out: 5277 Kbps, in: 1122 Kbps, NG:0, G:1125, BE-NG:0, BE-G:0, RQ:0, Players: 14 (L:0, R:0, B:0, G:14, D:0), JIP (T:3 Q:53495)
22:37:27 Server load: FPS 77, memory used: 3121 MB, out: 5456 Kbps, in: 1148 Kbps, NG:0, G:20624, BE-NG:0, BE-G:0, RQ:0, Players: 14 (L:0, R:0, B:0, G:14, D:0), JIP (T:5 Q:53625)
22:37:37 Server load: FPS 72, memory used: 3125 MB, out: 7117 Kbps, in: 1230 Kbps, NG:0, G:0, BE-NG:0, BE-G:0, RQ:0, Players: 14 (L:0, R:0, B:0, G:14, D:0), JIP (T:8 Q:53725)
22:37:47 Server load: FPS 68, memory used: 3129 MB, out: 10819 Kbps, in: 1234 Kbps, NG:0, G:1005, BE-NG:0, BE-G:0, RQ:0, Players: 14 (L:0, R:0, B:0, G:14, D:0), JIP (T:19 Q:53863)
How replicable is that?
swift drift
Normal coop mission for me [with mods] + 2 HC + #monitords 8
after around an hour of gaming it happened for the first time
playercount 15
it happened at total of 3 times
heavy vortex
The 20fps lock might be a clue, but not for me.
swift drift
first time it was around 70-90 fps, [Fps limit 120]
it just stopped sending data to players for 2 minutes
no logs, because commandds doesn't leave them I believe
rpt - no script error [just some standard RHS stuff] and "referenced" nonnetwork things
[extended logging]
heavy vortex
If the frame rate isn't locked low then profiling probably won't help.
swift drift
4 january - it was all working nicely, 11,18 january - I was doing reforger missions, 25 january - it happened [performance - profiling branch]
setup similar
heavy vortex
In the case you pasted, someone left the game rather than joining?
Or two left and one joined?
swift drift
we had a random guys without mods trying to connect [and the game started working after joining failure]
like getting "poked" / "jump started"
one guy left is just a coincidence
he left quite a bit before 3rd stuck
Joining in middle of "stuck" phase
not starting it [according to logs]
heavy vortex
My other observation would be that the guaranteed queue is still changing, so it can't be entirely jammed.
Maybe that's forwarding data from other clients though.
swift drift
yep. Game was running, bots did move and shoot and it all synced after getting unstuck.
server dedicated [and had quite a bit of free resources] and I was able to connect to it without problems, so that's out.
chilly geyser
swift drift
server dedicated [and had quite a bit of free resources] and I was able to conne...
Was absolutely same issue, use CaptureSlowFrame and check what reason of this fps drop
swift drift
chilly geyser
Was absolutely same issue, use CaptureSlowFrame and check what reason of this f...
Server FPS were at twenty, due to 7 air units fighting (with miniguns and rockets), city being demolished and filled with craters, enemy and friendly infantry fighting + new reinforcement coming (spawning via script).
The problem is with server reporting back, but not sending data to players.
whole cloud
probably logged in RPT that it was overwhelmed?
swift drift
whole cloud
probably logged in RPT that it was overwhelmed?
I can send you rpt if you want, but
part 1:
=====================================================================
== D:\Arma 3 Server\arma3serverprofiling_x64.exe
== "D:\Arma 3 Server\arma3serverprofiling_x64.exe" -port=2305 "-[skipped] "-serverMod=@3CB_BAF_Equipment;@3CB_BAF_Equipment_ACRE_compatibility_;@3CB_BAF_Units;@3CB_BAF_Units_ACE_compatibility_;@3CB_BAF_Units_RHS_compatibility_;@3CB_BAF_Vehicles;@3CB_BAF_Vehicles_RHS_reskins_;@3CB_BAF_Weapons;@3CB_Factions;@ace;@ACE_Armor_Adjuster;@ACRE2;@BackpackOnChest__Redux;@CBA_A3;@cTab_NSWDG_Edition;@CUP_ACE3_Compatibility_Addon__Terrains;@CUP_Terrains__Core;@CUP_Terrains__Maps;@CUP_Terrains__Maps_2_0;@Enhanced_Movement;@GRAD_Civilians;@Gruppe_Adler_Admin_Messages;@Gruppe_Adler_Captive_Walking;@Gruppe_Adler_Trenches;@HWK_AMS_SYSTEM__CORE;@KAT__Advanced_Medical;@LAMBS_Danger_fsm;@LAMBS_RPG;@LAMBS_RPG_RHS;@LAMBS_Suppression;@LAMBS_Turrets;@No_40mm_Smoke_Bounce;@No_40mm_Smoke_Bounce_RHS_compat__Fixed__Gone_Smoky_;@No_Hit_Animation;@Project_RACS_2023;@Project_RACS_SLA_2023;@Prone_Launcher;@Queen_and_Country;@RHSAFRF;@RHSGREF;@RHSSAF;@RHSUSAF;@RKSL_Studios__Attachments_v3_02;@RR_Immersive_Maps_by_LAxemann;@S__S;@S__S_ACRE_Compatibility;@S__S_New_Wave;@Simple_Craters;@Suppress;@VS_ACE_Static_Line_Jump;@ocap;@Deformer;@Immersion_Cigs;@HWK_AMS_SYSTEM__RHS;@SDS_Ace_optionals_Alternative;@Hal_Evolved__updated_forked;" -enableHT -malloc=mimalloc_v217_20250103 -limitfps=120 -maxFileCacheSize=6152 -loadMissionToMemory -hugepages

Original output filename: Arma3RetailProfile_Server_x64
Exe timestamp: 2025/01/20 18:04:18
Current time:  2025/01/25 16:19:39

Type: Public
Build: Profile
Version: 2.18.152588

Allocator: D:\Arma 3 Server\Dll\mimalloc_v217_20250103.dll [] []
PhysMem: 64 GiB, VirtMem : 131072 GiB, AvailPhys : 16 GiB, AvailVirt : 131068 GiB, AvailPage : 28 GiB, PageSize : 4.0 KiB/2.0 MiB/HasLockMemory, CPUCount : 16
=====================================================================
22:25:14 Ref to nonnetwork object 857009: ace_tracerwhite2.p3d rhs_B_762x39_Ball
22:25:14 Ref to nonnetwork object 857011: tracer_red.p3d rhs_ammo_556x45_M855_Ball
22:25:14 Server: Object 2:14451 not found (message Type_126)
22:25:14 Server: Object 2:14471 not found (message Type_126)
22:25:15 Ref to nonnetwork object 857016: tracer_red.p3d rhs_ammo_556x45_M855_Ball
22:25:15 Ref to nonnetwork object 857018: tracer_red.p3d rhs_ammo_556x45_M855A1_Ball
22:25:15 Ref to nonnetwork object 857019: tracer_red.p3d rhs_ammo_556x45_M855A1_Ball
22:25:15 Server: Object 2:14450 not found (message Type_126)
22:25:15 Server: Object 2:14470 not found (message Type_126)
22:25:15 Server: Object 2:14450 not found (message Type_466)
22:25:15 Server: Object 2:14451 not found (message Type_466)
22:25:15 Server: Object 2:14454 not found (message Type_466)
22:25:15 Server: Object 2:14455 not found (message Type_466)
22:25:15 Server: Object 2:14473 not found (message Type_466)
22:25:15 Server: Object 2:14495 not found (message Type_466)
22:25:15 Server: Object 2:14496 not found (message Type_466)
22:25:15 Server: Object 2:14472 not found (message Type_466)
22:25:15 Server: Object 2:14470 not found (message Type_466)
22:25:15 Server: Object 2:14471 not found (message Type_466)
22:25:15 Ref to nonnetwork object 857024: tracer_red.p3d rhs_ammo_556x45_M855_Ball
22:25:16 Ref to nonnetwork object 857029: tracer_orange.p3d rhs_ammo_762x51_M118_Special_Ball
22:25:16 Ref to nonnetwork object 857030: tracer_red.p3d rhs_ammo_556x45_M855_Ball
22:25:16 Ref to nonnetwork object 857036: tracer_red.p3d rhs_ammo_556x45_M855_Ball
22:25:17 Server: Object 2:14067 not found (message Type_126)
22:25:17 Ref to nonnetwork object 857039: tracer_red.p3d rhs_ammo_556x45_M855A1_Ball
22:25:17 Server: Object 2:14455 not found (message Type_126)
22:25:17 Error: Error during SetFace - class CfgFaces.Man_A3.Face04 not found
22:25:17 Error: Error during SetFace - class CfgFaces.Man_A3.Face04 not found
typical spam only
nothing about being overwhelmed / script errors [one at the end, due to OCAP, but that was after the mission end]
unless:
16:34:36 In last 10000 miliseconds was lost another 860 these messages.
16:34:46 f16 Overflow
hard to find sometimes with 125376 lines...
but at the same time f16 overflows doesn't match the time the problem happened.
found server console log :}
1st time it happened.
20:38:07 Server load: FPS 38, memory used: 2997 MB, out: 86045 Kbps, in: 122 Kbps, NG:0, G:4845, BE-NG:0, BE-G:0, RQ:0, Players: 15 (L:0, R:0, B:0, G:15, D:0), JIP (T:6 Q:42387)
20:38:17 Server load: FPS 41, memory used: 2979 MB, out: 0 Kbps, in: 133 Kbps, NG:0, G:0, BE-NG:0, BE-G:0, RQ:0, Players: 15 (L:0, R:0, B:0, G:15, D:0), JIP (T:19 Q:42546)
20:38:27 Server load: FPS 44, memory used: 2977 MB, out: 0 Kbps, in: 106 Kbps, NG:0, G:0, BE-NG:0, BE-G:0, RQ:0, Players: 15 (L:0, R:0, B:0, G:15, D:0), JIP (T:19 Q:42551)
[skipped]
20:39:07 Server load: FPS 47, memory used: 2936 MB, out: 0 Kbps, in: 92 Kbps, NG:0, G:0, BE-NG:0, BE-G:0, RQ:0, Players: 15 (L:0, R:0, B:0, G:15, D:0), JIP (T:3 Q:42547)
20:39:17 Server load: FPS 42, memory used: 2982 MB, out: 67168 Kbps, in: 110 Kbps, NG:0, G:0, BE-NG:0, BE-G:0, RQ:0, Players: 15 (L:0, R:0, B:0, G:15, D:0), JIP (T:6 Q:42548)
20:39:27 Server load: FPS 46, memory used: 2987 MB, out: 4920 Kbps, in: 103 Kbps, NG:0, G:0, BE-NG:0, BE-G:0, RQ:0, Players: 15 (L:0, R:0, B:0, G:15, D:0), JIP (T:5 Q:42552)
at the time: object not found (message Type_98) and (message Type_466) spam for a while
 woeful rivet
Hey is there any issues on this branch that causes your game to freeze your entire PC when a explosion happens?
heavy vortex
Well, no-one reported that yet.
And explosions are pretty common so it's probably an issue at your end, or a combo with unusual mods.
Also if anything freezes your entire PC then it's probably not just Arma at fault.
woeful rivet
fair enough its just started to happen to me continously out of no where and none of my friends who are playin have the issue either
Ill do some testin tomorrow and come back to u
 warm venture
Can someone help me? i’m new in arma 3.
 worldly badge
Then ask for it
 restive turtle
swift drift
unless:
```
16:34:36 In last 10000 miliseconds was lost another 860 these messa...
restive turtle
swift drift
unless:
```
16:34:36 In last 10000 miliseconds was lost another 860 these messa...
@whole cloud had this happen to me when i was on profiling too
when someone joined did the exact same thing.
although my server would permanently lock up and crash xd
7:24:47 Server can't keep up, too many incoming network messages. Remaining in queue: 6178
chilly geyser
restive turtle
although my server would permanently lock up and crash xd
Absolutely same reports in your dm @whole cloud
woven loom
tfw slidin in to his dms with crash reports
void badger
Does anyone else have issues on latest perf where units on the headless client don't respond to orders?
Frankly it doesn't even affect performance from my testing so I'd suggest to not use headless at all (I think dedmen said the same) but figured I'd ask
heavy vortex
I was gonna say someone else reported that, but it was you as well :P
whole cloud
140player 3 weeks ago, with multiple HC's, no problems reported from back then
 gritty wasp
Can we expect perf with optimized allocations on Patch Tuesday?
whole cloud
There are more things I need to get done before I can push it, probably not
chilly geyser
void badger
Frankly it doesn't even affect performance from my testing so I'd suggest to not...
Im using HC too, and all looks like hc for AI only is just useless thing now.
Server FPS abolutely same with/out HC
 fallow mason
whole cloud
140player 3 weeks ago, with multiple HC's, no problems reported from back then
fallow mason
whole cloud
140player 3 weeks ago, with multiple HC's, no problems reported from back then
what hardware you have to handle that ammount of players?
whole cloud
fallow mason
what hardware you have to handle that ammount of players?
wasn't my server, don't know
whole cloud
I did a new yaab run test.
One yaab run, start recording, Pause menu "Repeat". Second yaab run. Pause menu "Repeat", end recording.
That way I have the memory at the point where the game is "empty" during the loading screen before starting the mission. And because the first YAAB run preloaded all objects, the second shouldn't have put anything new into caches.
19 million allocations. 12.99GB alloc, 12.95GB dealloc.
49MB increased memory usage, over a full YAAB run (2m50s?)
4MB Are Nvidia drivers
4.5MB in ogg audio file 🤔 Could be cache maybe?
2.6MB more audio files
2.3MB Physx library
15MB animations (That is indeed weird, they should still have been cached from last mission. But the cache might have thrown out animations from last mission and loaded them anew. Doesn't look like a leak)
2.7+6.8MB filecache
800Kb lights on entities, 2381 allocated, 0 deallocated. (This must be bad timing of when I started and stopped recording, I tested them and they do deallocate)
6MB in rendering code, unsure about this. Its deallocating alot of it, just not all. Looks more like cache not leak.
gritty wasp
If values consistent every time for 2 runs you could run 4 5 times to check where it grows the most
whole cloud
No I can't because I don't have enough ram for that
gritty wasp
In theory cache can leak too if it doesn't hit and cache again
woven loom
Clearly you need 128GB RAM system 😄
whole cloud
I found that one part of rendering, that is quite slow and that cannot be multithreaded. Actually has the most number of allocations inside it (2.6 million).
Without allocations it hopefully gets considerably faster 🤞
heavy galleon
whole cloud
No I can't because I don't have enough ram for that
Just get massive swap 
light cargo
but storage is much slow, think of the hdd users
heavy galleon

woven loom
whole cloud
I found that one part of rendering, that is quite slow and that cannot be multit...
What you really need is DX12 DirectStorage 😛
(i don't know what you really need lol)
What would you do without allocations though? Like just one big allocation or...?
heavy vortex
Usually this sort of stuff is allocating and freeing similar chunks of memory repeatedly. Sometimes it's plain unnecessary. Sometimes you can maintain a buffer between iterations.
whole cloud
woven loom
What you really need is DX12 DirectStorage 😛
no, we don't
whole cloud
woven loom
What would you do without allocations though? Like just one big allocation or......
We have thousands of small allocations.
That we allocate, and shortly after throw away again.
Allocate one big buffer, put all the temporary things in there, and then throw the buffer away once at the end.
light cargo
paging slows down systems because storage is much slower than the ram even pcie is slower than ram
much worse on hdds especially fragmented ones
heavy galleon
yes
however, again, entierly unrelated to the problem at hand 
light cargo
okay
 autumn timber
light cargo
much worse on hdds especially fragmented ones
autumn timber
light cargo
much worse on hdds especially fragmented ones
Any HDD user that takes Arma seriously has already upgraded their drive to SSD (at least!). I just checked and a 250GB SSD would cost me the equivalent of 18 Eur right now.
I see you advocating supporting low-end hardware here and there and I can't help but think that you're implicitly speaking of your own hardware.
If this is truly the case, you really should consider if it wouldn't make more sense for you to simply upgrade your PC, if you care about Arma performance so much.
Otherwise, it would be asking Dedmen to effectively waste his time doing optimizations that only a small percent of players will notice. Players that will also be upgrading their hardware with time, so those optimizations would become even more irrelevant with each consecutive month
light cargo
ok
whole cloud
All the latest optimizations are already ignoring 32bit btw. And @vivid rune please stop using 32bit on Linux. Better sooner than later. So you're not surprised if we decide to drop it.
woven loom
whole cloud
We have thousands of small allocations.
That we allocate, and shortly after thro...
Got it, thanks!
 slender yew
Heya! So we want to run both the profiling branch as well as install the creatordlc, but historically we used -beta "creatordlc" in the steamcmd branch, what's the best way to do both?
whole cloud
use creatordlc and grab profiling branch binaries manually from google drive.
Not sure if best way, but easiest. Atleast for now while google drive setup is simple, it becomes a bit more involved next update
heavy vortex
You could have an extra steamcmd running on profiling branch, and then copy the exes. It's only 5GB :P
light cargo
it's easier to just put profiling branch exes from gdrive indeed
light cargo
whole cloud
use creatordlc and grab profiling branch binaries manually from google drive.
No...
can easily script that
after every update replace exes
 carmine stump
any consensus on setting threaded optimization on or off?
 opal hound
which one?
heavy vortex
Yeah, I don't know which setting you're talking about there.
 naive osprey
Probably talking about this
#perf_prof_branch message
As far as I am aware, unless you're explicitly having crashes/obvious issues, you shouldn't add them (if they are even still in at all)
heavy vortex
Yeah, the purpose of those flags is to test whether specific optimizations are the cause of problems you're experiencing. It's a bit more fine-grained than switching back to stable.
light cargo
carmine stump
any consensus on setting threaded optimization on or off?
if it works, dont touch it
restive turtle
Praise be Dedmen
whole cloud
carmine stump
any consensus on setting threaded optimization on or off?
What is that?
woven loom
....they might be referring to threaded optimization option in nvidia control panel settings
whole cloud
I don't like guessing what someone might mean, if they could also just tell us
whole cloud
okido.
When we do object intersections with animated objects. We need to compute the animation and store it in a buffer.
That buffer is ~200KiB per object that's animated.
Previously that buffer, used to be 6 separate allocations.
I first merged it into one allocation per.
Which gives us:
Over one yaab run, 18436 allocations, and 18431 deallocations.
Total volume is 3.7GiB
Then I added a pool allocator that doesn't deallocate and instead keeps the memory and re-uses it.
Out of 18436 allocations, 18269 were re-used with existing allocated memory, getting rid of the allocation completely in these cases (it only allocates if there are no free ones available)
And the remaining allocations if the pool is full, go into a pre-reserved memory region (up till 128MiB) which is very fast too.
This wastes 128MiB virtual memory and ~36MiB real memory. So 32bit is not going to get this.
~110616 allocations, first down to 18436, then down to 167
And this was on the hot path for things like explosions and AI visibility checks
I didn't properly measure the performance impact fps wise, but surely this has to do something
light cargo
dedmen, sorry to interrupt and excuse me, when you play sessions with your group, could you try looking at performance on the side while playing? that would be the place where you are playing for longer periods since you said you dont have time to look at stats after long periods
limiting the memory does not do anything for me
whole cloud
light cargo
dedmen, sorry to interrupt and excuse me, when you play sessions with your group...
Uhm yes. I always do that?
I always look at performance, I can't measure memory allocations over long sessions
light cargo
oh okay, my apologies, you didnt observe high memory usage on the longer sessions?
whole cloud
And I'm not limiting memory use, I'm limiting allocations, which impacts performance, not so much memory use
light cargo
i see, thank you!
whole cloud
light cargo
oh okay, my apologies, you didnt observe high memory usage on the longer session...
Not so far that I would've noticed it
light cargo
guess its just my memory that is cursed then :(
sorry for wasting time, anyways carry on
whole cloud
Total YAAB run now
32 million allocations, for 18.42gb.
That's ALOT more than the 19 million I had last time...
14 million just for shadows (8.5gb), can probably get rid of that (And that's also why its more than last time :D)
800k for wind emitting map (helicopters emit wind.. and thats basically it), I can get that down to 0
700k for every entity for every particle being spawned (This code is a bit stupid, we have an array that's always 16 elements, but we make it allocate instead of just using a static array 🤔), Fixed now
700k for the position/orientation information for every entity for every particle (can probably get rid of it)
Another 700k for wind emitters.. that's hard to fix, to be looked at.
700k for particles being spawned, can probably get it to 0, need to see if its multithreaded or not.
650k for rendering structured text. Super annoying, but I'm wondering where does that even come from? YAAB doesn't render text, and the HUD elements that would, are all hidden 🤔
1 million for rendering objects, that's hard but might be possible
500k for rendering UI controls (again.. all controls are hidden though??), can probably get it down to 0
500k for visibility checks (multithreading tasks for particle visibility are all allocated per-task, whoops), easy fix
400k for animations, I know how to fix that, already planned
360k for rendering proxies on soldiers (vest,backpack, weapon attachments), Probably fixable
62k scripting... whoooopsie. Every eventhandler and isNil and FSM conditions, copy the compiled code before executing it. Should probably not do that
34k for steam tags for workshop items..... while you're in the middle of running YAAB? wuht?
500k physx, can't do anything about that
I kinda want to get it all done before I release profiling. Probably skipping prof until next week. This should only take me a couple days.
I wonder how shadow performance is going to be impacted, getting rid of so many allocations... We shall see.
whole cloud
Mimalloc provides a noticable performance improvement, just by being a better allocator.
Completely taking these allocations out of the game, should definitely be noticable, and everyone will get that improvement even without using a custom allocator.
The risk is just memory usage, because I'm keeping buffers allocated, instead of giving them back to the allocator.
But in practice, so far this is just a few hundred MB, and with the recent update we just saved 400MiB so.. probably fine.
Also technically... I now have multithreading capable allocators I could throw at the scripting system, so we can enable multithreaded scripts. but... better not attempt that 🤣
 somber plank
yet :D
 eternal kraken
whole cloud
Mimalloc provides a noticable performance improvement, just by being a better al...
eternal kraken
whole cloud
Mimalloc provides a noticable performance improvement, just by being a better al...
we all know that youre already thinking about to do it, see and accept you destiny 😁
autumn timber
so we can enable multithreaded scripts. but... better not attempt that 🤣
For the record: this would have the potential to break third party extensions, as we were always told that we can assume all extension calls will happen from a single thread
whole cloud
That thread btw now hops around and can also happen from non main thread.
But it's always from the script "thread" and I haven't heard of any extensions breaking yet 😄
autumn timber
No, I mean that right now you're guaranteed that you won't have two extension calls happening in parallel, right? 😬
In other words: extensions can now use globals without the need to guard them with mutexes
whole cloud
autumn timber
No, I mean that right now you're guaranteed that you won't have two extension ca...
Yes
carmine stump
woven loom
....they might be referring to threaded optimization option in nvidia control pa...
correct
restive pilot
whole cloud
Mimalloc provides a noticable performance improvement, just by being a better al...
Actually if the memory was getting fragmented befoe due to all these different allocations you might save some memory I guess? 😅
 empty goblet
whole cloud
Total YAAB run now
32 million allocations, for 18.42gb.
That's ALOT more than t...
empty goblet
whole cloud
Total YAAB run now
32 million allocations, for 18.42gb.
That's ALOT more than t...
with so many shadow allocations one would expect shadows till horizon ...
heavy vortex
carmine stump
correct
My recollection is that it's beneficial for A3, but a couple of YAAB runs should tell you either way.
woven loom
carmine stump
correct
I basically never touch that option, it's set to auto by default iirc
But I've also never tried. Seems to be something that might have driver level interactions so didn't seem worth messing with.
woven loom
whole cloud
Total YAAB run now
32 million allocations, for 18.42gb.
That's ALOT more than t...
Maybe I'm missing what render text means, but YAAB does have text that I would think is rendered... When it flashes "BECHMARK STARTING" at the beginning...
Similarly when it displays the results it displays a UI and graphs etc.
whole cloud
exactly thats what I mean, yet its rendering text. somehow
its probably so stupid to be rendering invisible text
carmine stump
heavy vortex
My recollection is that it's beneficial for A3, but a couple of YAAB runs should...
set it to off and I went from 57 to 58 on yaab
light cargo
oh huh
heavy vortex
Might just be a dead option then, unless you did like 10 runs on each :P
woven loom
Yeah 1 fps avg is pretty much within margin of error
If you see an improvement in frame times (1% lows etc) then you may be on to something
honest fulcrum
The allocations for shadows are really interesting, especially the memory those consume. I don't know much about how a game like arma renders them besides knowing that there's the stencil shadows and then more soft shadows, but I was wondering what kind of work it's doing that cause it to have as much frame impact as it does, or if maybe it's the sheer quantity of allocations as you raise the drawdistance?
whole cloud
As far as I understand it, these shadow allocations (one is a cache item, the other is an array of floats inside each cache item), store where on the terrain surface, shadows are. Per vertex.
Its a bit confusing to me because, this is really only for terrain surface, but we also have shadows on buildings, that are already purely calculated on gpu, so.. why?
No idea.
whole cloud
whole cloud
Total YAAB run now
32 million allocations, for 18.42gb.
That's ALOT more than t...
14 million shadow allocations, down to zero (during the yaab run, in total its two, but they were already allocated at game start).
Overall. ~22.6million allocations, for 11.24GB.
So roughly 10mil and 6gb less than before the shadows fix.
I can see that overall, it allocated 3 million shadow segments over the yaab run (its weird that the last test had 7 million... I probably changed my shadow settings in the meantime, ugh. Gotta have to re-run proper comparison sometime) out of which 99.94% could be fulfilled by freelist in new allocator, so re-using memory that's already there.
So in this YAAB run, that would be 6 million allocations gone, for a memory overhead cost of 2MiB.
I think, those 14 million, were actually with shadows turned off.... I only turned them on earlier today for testing...
There's something else to fix there some other day. Atleast they are cheaper now.
700k for the position/orientation information for every entity for every particle
Mh, I'm now seeing 2.9 million of which 600k for particles.
This was also first YAAB run, not second, so its all messy, don't have time to run a proper test now, but atleast the shadows thing worked.
Also these position things, I'm now sure I can fix.
We didn't have a threadsafe pool allocator before, now we do
I need to re-run proper comparisons but I'll do that when all things are done.
chilly geyser
I hope I understand correctly what Dedmen is talking about. Does optimizing memory allocation mean that there will be fewer misses in the processor cache due to the fact that it is now saved and used instead of constantly being rewritten?
 fickle geyser
whole cloud
As far as I understand it, these shadow allocations (one is a cache item, the ot...
fickle geyser
whole cloud
As far as I understand it, these shadow allocations (one is a cache item, the ot...
isn't it for the stuff like the commands that allow you to get lighting values?
was that even affected by shadows? 
whole cloud
chilly geyser
I hope I understand correctly what Dedmen is talking about. Does optimizing memo...
No.
It means less time wasted to find free chunks of memory
whole cloud
fickle geyser
isn't it for the stuff like the commands that allow you to get lighting values?
No, that doesn't consider shadows, I didn't know we had some shadow info available
heavy vortex
chilly geyser
I hope I understand correctly what Dedmen is talking about. Does optimizing memo...
Malloc calls are themselves a bit of a pointer chase. So yes, but not for the reason you're thinking :P
For small mallocs, the cost of the malloc call is typically much higher than the cost of accessing the memory you got from it.
In some of these cases there would also be a coherency advantage. 16 small mallocs won't necessarily give you 16 chunks in close proximity.
woven loom
whole cloud
As far as I understand it, these shadow allocations (one is a cache item, the ot...
Is there some quality setting that renders shadows "on CPU"?
I vaguely remember people saying that some low settings use CPU rendering / more CPU calculations
 leaden relic
woven loom
Is there some quality setting that renders shadows "on CPU"?
leaden relic
woven loom
Is there some quality setting that renders shadows "on CPU"?
Setting it to low uses CPU iirc
heavy vortex
That's the story, but if there's a difference in CPU usage between low and high in the current stable branch then it's very small. Low->off is a large jump however.
Maybe there's a code branch that's only used on very limited GPUs.
 spiral pond
whole cloud
As far as I understand it, these shadow allocations (one is a cache item, the ot...
spiral pond
whole cloud
As far as I understand it, these shadow allocations (one is a cache item, the ot...
Could this be the "terrain shadows" introduced some time with A2:OA?
Not sure if tech even worked in A3. It might not have been ported to the new rendering engine?
restive turtle
Old Man Kju coming out the shadows
whole cloud
spiral pond
Could this be the "terrain shadows" introduced some time with A2:OA?
Not sure if...
Yes.
It is enabled in engine code, but there is a separate enable switch in shader code, which I don't know if it's on.
But I think it has to be on otherwise it would mangle some data.
Whether it does something though, dunno.
I'll have to look into that someday
woven loom
Confirming arma runs on arcane magic
whole cloud
Linux server such a pain, I got it now that all AI's on server, are stuck in running animation, but not moving.
Change mods doesn't help, restarting server doesn't help.
Profiling v5 is fine though 
v12 also broken
v9 also broken
v7 also broken
v6 also broken
v5 is still fine
v20 with -perfFlags=noaicoro;noaivismt , is broken
 knotty wraith
whole cloud
Linux server such a pain, I got it now that all AI's on server, are stuck in run...
knotty wraith
whole cloud
Linux server such a pain, I got it now that all AI's on server, are stuck in run...
Windows Server 2008 rules, at least I'm ahead somewhere 😏
whole cloud
@void badger #perf_prof_branch message is that on linux?
autumn timber
Are you complaining about running linux servers when hunting for bugs, in general, or complaining that these issues that you mentioned above happen only on linux? 💀
whole cloud
the bug only exists on linux, even though it should run the same code as windows
void badger
whole cloud
<@263149622078210048> https://discord.com/channels/105462288051380224/105466848...
Yes
whole cloud
In my case, AI reacts to enemies and shoots them, also goes prone like you would expect.
They just, cannot walk, and if they try, they are playing the animation for it, but not changing their position.
So for some reason, the position change that the animation is supposed to apply, is not applied. The rest is working
void badger
Exactly what I'm seeing too
It's complicated because I'm running LAMBS too and that may still be crashing from that (and Linux)
whole cloud
I'm also running lambs, no crashes anymore
void badger
I can't tell if there's a performance differential with and without headless yet since my testing was without players
void badger
whole cloud
I'm also running lambs, no crashes anymore
Weird.... I was getting those floating point exceptions but finally installed coredumpd so I can investigate further next time I try perf binary
whole cloud
well with v19+ its not crashing anymore
void badger
My v19 was the latest with that crash 😭
whole cloud
-perfFlags=noaicoro that start parameter, disables the thing that makes lambs crash
heavy vortex
whole cloud
the bug only exists on linux, even though it should run the same code as windows
You know about the similar bug with the Advanced Rappelling mod, right? On Linux servers the AIs all get stuck looking at the floor. That one's ancient.
I guessed there's a timing bug in the animation setup and Windows servers only work by luck :P
whole cloud
heavy vortex
You know about the similar bug with the Advanced Rappelling mod, right? On Linux...
I heard it, but I think I tried and couldn't repro
void badger
heavy vortex
You know about the similar bug with the Advanced Rappelling mod, right? On Linux...
That's linux only too? I didn't ever use it much anyway, but lord did it cause problems for a while...
void badger
whole cloud
I heard it, but I think I tried and couldn't repro
Best repro I can think of is boot something like Liberation and wander around to force AI to gen, almost half the teams that appear will be stuck sitting, but can still shoot
whole cloud
I have a reliable repro scenario now. But, I Bet once i build my own test server, itll work fine
woven loom
woven loom
Probably may help make older systems run smoother, reduce pressure on memory... ...
2.18.152567 seems about the same as 2.18.152588 in terms of average fps in YAAB
But i played the infantry showcase after a long while and FPS was 73-100 with the i7-5775C with the ultra preset settings. 100 fps on an empty map. Pretty impressive.
 glacial radish
I just did a fresh install and my mouse sens is super high when holding a gun. Without a gun my mouse movement is completely normal. Anyone can help me with that?
opal hound
Specifically on the perf branch?
glacial radish
Not sure if it has to do with this, but i have the branch installed, and wasnt sure if i should ask here
No matter how high or low I set the x/y sens slider, my weapon moves super fast with the slightest mouse movement. If theres another place to ask id be glad if someone could tell me
 deft oak
How are people using diag_captureSlowFrame in an automated way?
I'm thinking something simple like this inside a throttled loop on the server:
if (diag_fpsMin < 30) then
{
    diag_captureSlowFrame ["total", "30fps"];
};
If I'm understanding correctly this will capture a slow frame when the server fps drops below 30 for a sustained period (since diag_fpsMin is just the lowest of the last 16 frames you may miss the load spike). Should I also limit the number of times this can execute so it doesn't contribute to a death spiral if ones starting? Although it would be nice to have all that information.
On an unrelated note, how do I get the mpMessageDetailsServer to write? I have -networkDiagInterval=100 running and the networkDiagIntervalServer writes without an issue. It successfully wrote one time for me a few days ago but it hasn't since then.
woven loom
glacial radish
No matter how high or low I set the x/y sens slider, my weapon moves super fast ...
huh actually i felt that too today, but then thought that was just me
will compare with stable
gritty wasp
whole cloud
the bug only exists on linux, even though it should run the same code as windows
Compiler optimized away animations 😅
whole cloud
yeah that was an issue a couple times.
Update linux compiler, game crashes at startup because compiler removed a null check that it thought was useless
 cloud sky
whole cloud
yeah that was an issue a couple times.
Update linux compiler, game crashes at st...
cloud sky
whole cloud
yeah that was an issue a couple times.
Update linux compiler, game crashes at st...
Uh, so compilers can change the semantics of code? o.O
Bye determinism
whole cloud
Compilers have bugs too
cloud sky
Well then yeah
 weak radish
Hey, new here. I was just reading up on some ARMA stuff and came across the branch and this server, I'd like to try it out but I am not sure as to what needs to be changed. (i7-13700HX; 32GB Memory, 4080 Mobile)
I was also wondering if me running this branch would lead to any compatibility issues on servers
woven loom
Steam-> manage Arma 3 -> betas -> performance profiling branch
It'll auto download
Then just run it
It should be compatible with stable servers as such (since there are no data changes), but at times there could be experimental features that may break something
weak radish
woven loom
It should be compatible with stable servers as such (since there are no data cha...
Thank you. Any information as whether to enable Hyper-Threading / Largepage Support etc?
woven loom
Uh ignore the HT option, although apparently on Intel 12/13/14 series it might help so you can see if it does. Can enable large page support although seems it's enabled by default on windows now so may not do much. I have it on.
You may want to try a different memory allocator, for example https://github.com/GoldJohnKing/mimalloc/releases is pretty good

GitHub
mimalloc is a compact general purpose allocator with excellent performance. - GoldJohnKing/mimalloc
for me large pages + mimalloc made a difference
woven loom
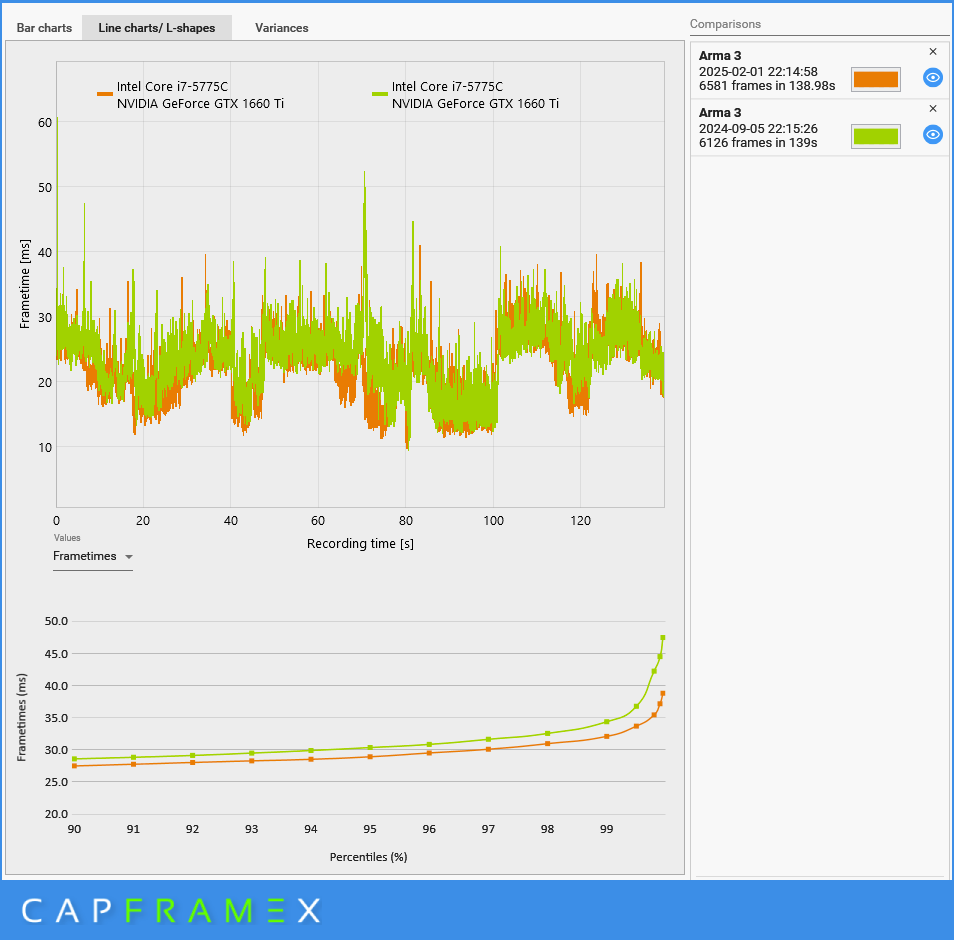
So i ran capframex, compared current build + current mimalloc to what it was in september.
1920x1200, ultra preset with YAAB standard settings used.
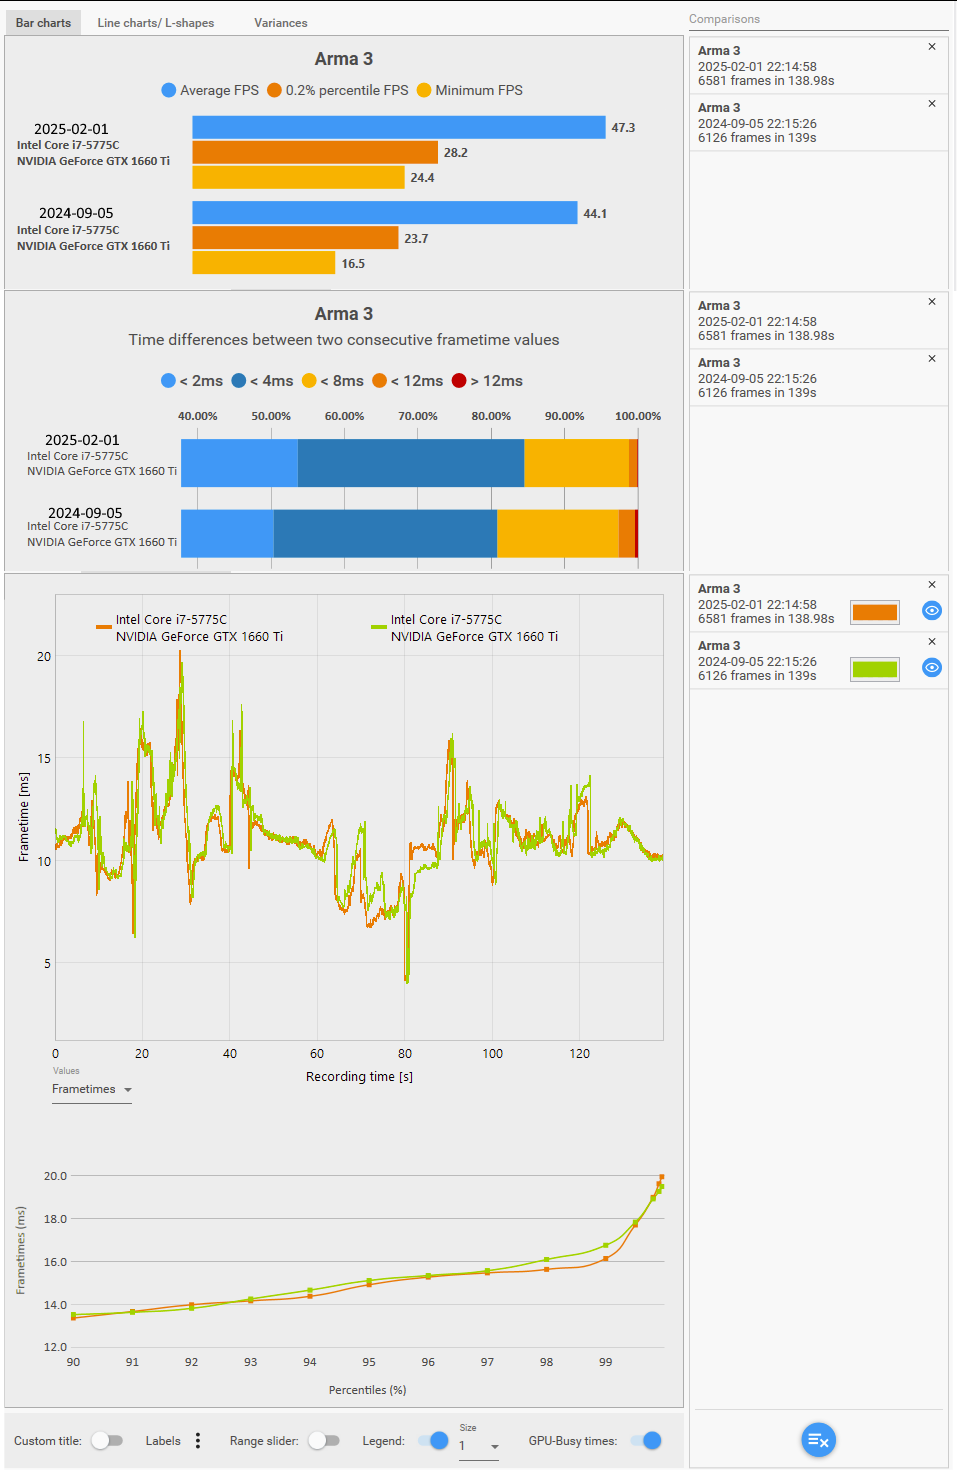
Frame graphs on the bottom are for GPUBusy (time GPU is actually rendering)... although thinking about it, that's harder to intepret than frametimes, so i'll also paste the frametime graphs
 carmine stump
threaded optimization off gave me 4% better lows, only did 2 runs
if someone else wants to test it.
knotty wraith
about the problem of the game crashing when minimizing with ALT + TAB, there is such an observation from players that you need to open the map (M), and then minimize the game... Perhaps this will help you solve the problem
knotty wraith
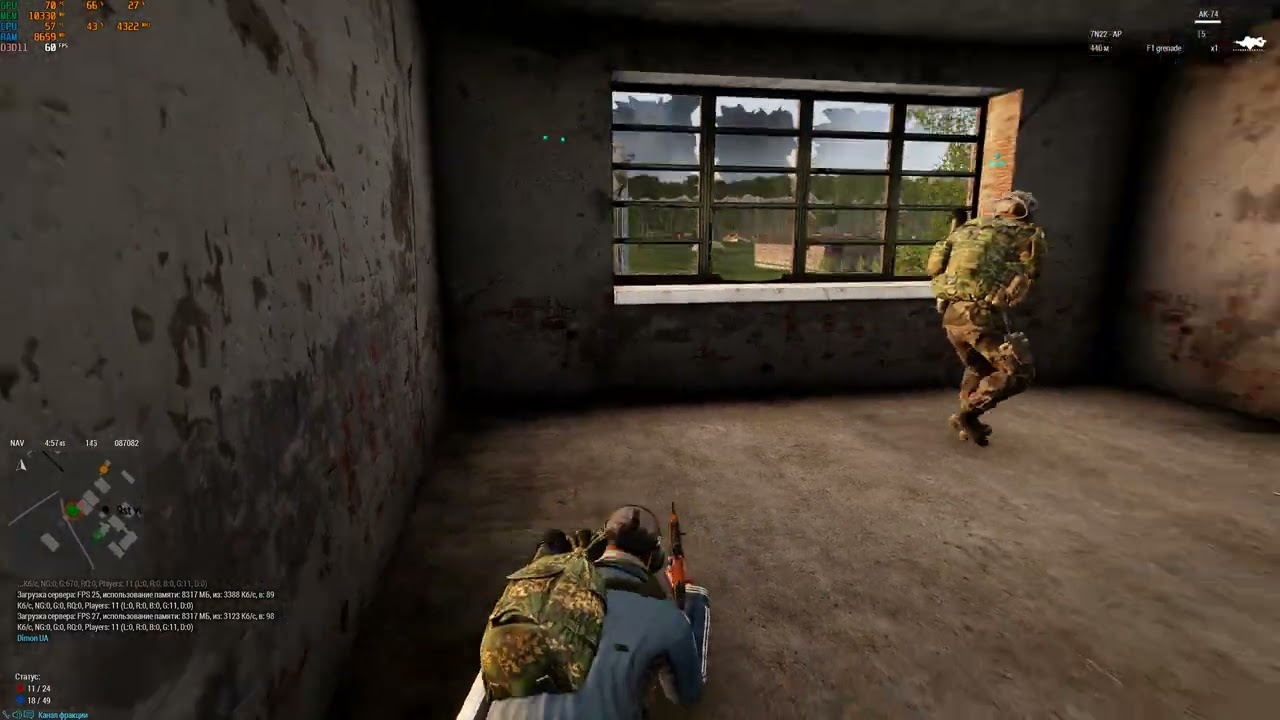
is it blinking again?
https://youtu.be/fc9PxbT-7oI?t=264
 light cargo
offtopic
for blinking entities i just set the client process priority to high and its solved
also offtopic dude
woven loom
How do you know it's off topic? Why does client process priority help with that? Makes no sense
 dark carbon
dumb question, does the multithreading work on 2.18?
light cargo
dark carbon
dumb question, does the multithreading work on 2.18?
mt been here since the beginning lol
whole cloud
dark carbon
dumb question, does the multithreading work on 2.18?
multithreading works on 1.0
light cargo
1.0-2.18*
 plain trout
Because I didn’t follow it here. Have the H-60 performance issues been addressed or is the mod just to much for some machines?
whole cloud
I don't have issues with h60 perf. But there was waypoint following issues which I still dont know what about
 silk summit
light cargo
mt been here since the beginning lol
silk summit
light cargo
mt been here since the beginning lol
Since Arma 2 according to some 
 inland dew
A2 patch 1.07 (June 2010)
[71143] Improved: -cpuCount=4 is now default on computers with more than four logical CPUs to prevent hyperthreading causing performance problems. If you want to use more CPUs, use -cpuCount=N to override this.
[71117] Optimized: Geometry loading in now optimized for multiple cores. Extra threading now enabled by default on computers with more that 2 CPUs. New possible -exThreads values: 5 (thread geometry loading only) and 7 (thread all)
inland dew
A2 OA patch 1.56 (November 2010)
Improved: -exThreads=3 now default for dual cores.
Improved: -cpuCount defaults improved for 6 or more than 8 CPUs.
dark carbon
whole cloud
multithreading works on 1.0
i mean does the new stuff work on 2.18, i havent been following along closely in recent months
whole cloud
the latest improvements are still in experimental
dark carbon
thank you, and also thank you
whole cloud
Okey continuing.
Last run
25k/s allocations for the entity transform (position, orientation, speed)
4.5k/s for 2D UI rendering (even though there is none visible in YAAB)
3.6k/s for visibility checks through particles
The UI rendering.. Seems to be a bug in YAAB BIS_fnc_textTiles.
Mid game, while no UI is visible.
a title effect is still active, saying the YAAB text.
The display is visible, the display contains 100 control groups, which are all visible.
Each of the 100 groups, contains the YAAB text (screenshot), but the text itself, is 100% transparent.
Every frame, the game iterates through 100 groups, each of them create a temporary UI viewport for their child items, to try to render text, which the game then detects is actually invisible and skips.
What a waste. Should just close the cutRsc instead of making it invisible.
The effect is created by benchmark.sqf, line 105.
BIS_fnc_textTiles
YAAB gives it a duration of 3.2 seconds. But BIS_fnc_textTiles only fades out all controls in their UI.
It never closes the UI that it opened.
So if you run it once, you now have the game forever processing 100 controls groups with invisible text, every frame.
 inland dew
@queen owl 👆
whole cloud
whole cloud
Okey continuing.
Last run
25k/s allocations for the entity transform (position, ...
Possible fix for the titles.
Close the display yourself, 4 seconds after starting it
[] spawn {
Sleep 4;
private _display = uinamespace getvariable ["RscTilesGroup", displayNull];
closeDisplay _display;
}
entity transform.
two yaab runs, 9.3 million allocations, all caught by 14.6mb cache.
But that is only base entities, there are separate ones for more complex ones like vehicles and soldiers. But the separate ones seem to be so small that they don't even show up
All 25k/s allocations of that, gone.
3.6k/s for visbility checks, gone.
UI, oops I forgot about that one..... Gone now.
next one are particle sources with 3.5k+3.5k/s
The allocation graph is fun, you can see exactly where the title text is being rendered, a big blob of structured text processing at the start of the benchmark

yaab is now down to 13 million allocations over the whole run.
I started last week at 32 million allocations.
I can still remove another 700k for particles, and 500k for ui rendering, 400k for animations...
eternal kraken
when you're done with YAAB you can check the allocations here 😁 -> http://moerderhoschi.bplaced.net/public/tools/arma3/CPU_TEST_MISSION/
whole cloud
230k gone I forgot what this was
460k gone (wasting 1mb of ram 😢 ) animations
500k gone UI rendering
700k gone particles
1.3 million gone sorting render objects
150k gone AI visibility
Ah there, found the entity transform for Soldier units, 118k. Not gonna bother yet.
Also analyzing allocations in one yaab session used to be a 4-5gb logfile, down to 900mb now
9.9 million left
800k is only the text rendering at start of benchmark, don't think I'll fix it.
700k is wind, I need to fix that but that one is pretty annoying. (That's currently the biggest problem, followed right by...)
Still 700k in particles (actually one per entity being spawned), but that one is also quite annoying, I think that I cannot fix.
500k for rendering proxies on soldiers.. ugh.
350k for particle drawing, I overlooked that one multiple times, oops, gone.
autumn timber
That must be a funny feeling to see that devs themselves are using the mission that you created, years ago, for benchmarking the game and make optimization decisions based on what your mission outputs 😄
whole cloud
700k for wind, lol. I fixed these ages ago, but its in a profiling branch only thing.
And I had that turned off for me 😄
32 million down to 9 million, in one week ✅
Good enough for now.
Now I just need to fix a bug and a freeze and look at a few crashes and fix the broken AI animations on linux, and then we can release 💀
Soon peoples! Very soon ☠️
empty goblet
whole cloud
230k gone I forgot what this was
460k gone (wasting 1mb of ram 😢 ) animations
5...
i do wonder is there any significant increase of the allocations when minimap / compass / clock etc. are visible ?
whole cloud
Compass/clock are just models, shouldn't do anything really.
Minimap or map now... I think definitely due to how map rendering works
fickle geyser
Can't wait to see how much of a frametime difference it makes 
inland dew
gps enabled = -10 fps
both pannels enabled (left and right) = -20 fps 🫠
fickle geyser
Map controls are expensive yeah, I still remember ShacTac HUD eating frames due to usage of empty map control :D
light cargo
inb4 regressions will happen across the board on next profiling
heavy galleon
fickle geyser
Map controls are expensive yeah, I still remember ShacTac HUD eating frames due ...
I still remember getting 15 FPS on some maps when I fully zoom out in map 
 wise sparrow
It be that way especially with enh map loaded, vanilla ain't that bad thankfully
 random isle
inland dew
gps enabled = -10 fps
both pannels enabled (left and right) = -20 fps 🫠
random isle
inland dew
gps enabled = -10 fps
both pannels enabled (left and right) = -20 fps 🫠
i think its because its redrawing entire map on every frame correct me if im wrong
heavy vortex
I'm sure it does, but it's probably not doing that anywhere near optimally either.
restive pilot
Yeah it's definitely not optimal. Reforger's map is several times faster for instance.
Gib reforger map 
woven loom
Someone should also look at PiP, it's probably the thing that kills performance the most, even on high end systems...
(vehicle mirrors and cameras, pip panels)
 runic sigil
(and PiP scopes, both inner and outer PiP)
heavy vortex
PiP is innately expensive though. A lot of the rendering costs get doubled.
Maybe some things are being doubled that shouldn't be, but it's never going to be cheap.
woven loom
It's just that it seems heavier on the CPU than GPU (from what I remember last), probably because of objects and stuff, so feels like there could be room for improvement. I could be wrong of course. But it's a low quality low resolution image, most modern GPUs shouldn't have a problem with it. And if I'm not wrong, other games don't show the same performance hit with PiP.
And the more PiP cameras you have on scene, the slower they all become, making it incredibly distracting in vehicles that use them for periscopes and driving port windows/cameras
I hardly use it
whole cloud
woven loom
Someone should also look at PiP, it's probably the thing that kills performance ...
And how do you imagine fixing, having to render the scene multiple times?
Magic wand?
Render it in parallel to real scene? Don't think that's possible
Last I tested the pip impact was quite low, less than AI
woven loom
whole cloud
And how do you imagine fixing, having to render the scene multiple times?
Magic ...
I believe in
I don't know the details lol I just observe performance and GPU utilisation 😄
whole cloud
woven loom
I believe in <:Ded:876261046518706176>
That reminded my brain of https://www.youtube.com/watch?v=xS5e2qURoaQ

portal prelude boss fight soundtrack: chemical brothers believe btw: first vid ever!!! like this? then ill add more!
ow and yes this is an image of portal (not prelude) but this a cooler pic
woven loom
Lol
woven loom
Is good track
whole cloud
whole cloud
700k for wind, lol. I fixed these ages ago, but its in a profiling branch only t...
bug is fixed, freeze turned out to be a 0 byte mdmp, crashes whatever. broken AI I've narrowed down to 27 changes across 143 files 🤣
Maybe I can halve that tomorrow and find it and fix it fast enough to push prof in the afternoon
swift drift
Any info for server freezing sending data to all players? (It happened to me in both the performance and development branch). A quick fix is for one player to return to the lobby and back to the game (it fixes the moment data is requested to load a player).
whole cloud
I have not heard of that yet
swift drift
swift drift
Any ideas why?
```
21:30:33 Server load: FPS 21, memory used: 3485 MB, out: 0 Kb...
Here is my first report
whole cloud
🤷 I would need to reproduce it, or see it happen live (and then attach profiler to it)
Otherwise I have no idea
swift drift
22:31:13 Server load: FPS 30, memory used: 3064 MB, out: 3807 Kbps, in: 107 Kbps, NG:0, G:738, BE-NG:0, BE-G:0, RQ:0, Players: 8 (L:0, R:0, B:0, G:8, D:0), JIP (T:17 Q:49470)
22:31:23 Server load: FPS 22, memory used: 3211 MB, out: 78536 Kbps, in: 132 Kbps, NG:0, G:860, BE-NG:0, BE-G:0, RQ:0, Players: 8 (L:0, R:0, B:0, G:8, D:0), JIP (T:3 Q:49814)
22:31:33 Server load: FPS 27, memory used: 3194 MB, out: 1 Kbps, in: 109 Kbps, NG:0, G:130, BE-NG:0, BE-G:0, RQ:0, Players: 8 (L:0, R:0, B:0, G:8, D:0), JIP (T:16 Q:49866)
22:31:43 Server load: FPS 26, memory used: 3168 MB, out: 0 Kbps, in: 111 Kbps, NG:0, G:220, BE-NG:0, BE-G:0, RQ:0, Players: 8 (L:0, R:0, B:0, G:8, D:0), JIP (T:7 Q:50218)
22:31:51 Zachi uses modified data file
22:31:51 Player Zachi connecting.
22:31:52 Player Zachi connected (id=[censored]).
22:31:53 Server load: FPS 27, memory used: 3144 MB, out: 38462 Kbps, in: 85 Kbps, NG:0, G:603, BE-NG:0, BE-G:0, RQ:0, Players: 9 (L:1, R:0, B:1, G:7, D:0), JIP (T:16 Q:50296)
``` Last saturday too.
-limitfps=120 -maxFileCacheSize=6152 -loadMissionToMemory -hugepagesHT is enabled too
- 2x HC
heavy vortex
How many times has it happened now?
swift drift
heavy vortex
How many times has it happened now?
Total of 7 or 8 times in 2 plays [6-7 hours of active gameplay]
whole cloud
But its super weird that the server is not freezing but running just fine
heavy vortex
I am quite surprised that this is possible. But then it seems like that would narrow the cause down quite a lot :P
whole cloud
The only things limiting outgoing, are bandwidth limits and maxmsgsend.
But that cannot cause 0kbps outgoing
heavy vortex
No way for positional updates to just get skipped entirely?
whole cloud
Well if nothing was going on at the time they could be
But looking at the traffic before and after, it loks like there was stuff going on
The world time would need to stop, and no objects change position. Then it could go to zero traffic
but the timer cannot stop if its outputting frames
heavy vortex
IIRC there were AIs running around. And it looks like plenty of incoming data.
swift drift
Yep there was an active AI + players combat. Air units [AI], mortar strikes [AI] [with craters], coupled with the ongoing infantry firefight and reinforcements coming [both sides, no zeus spawned units. since AI orders and respawns is controlled by a mod].
dark carbon
whole cloud
Last I tested the pip impact was quite low, less than AI
an ability to enable/disable PiP via script would be handy
means we could bind it to user action and more tightly control when it’s rendered for the player
 torn gate
hi, quick question. anyone have experience with running the prof server branch and HC on the same box?
chilly geyser
swift drift
HT is enabled too
Just turn off HC. I had this problem and after turning off HC everything has been working stably for more than 10 days.
gritty wasp
HT and HC different things
woven loom
swift drift
+ 2x HC
Radek has HCs enabled as well
woven loom
whole cloud
Last I tested the pip impact was quite low, less than AI
I tested ™️
Summary:
- FPS hit from enabling PiP (low) on my system is 30% (40 FPS) for the location i tested on Altis. Going to ultra reduces FPS another 8%. In empty VR it was 18% for low and 36% for ultra.
- PiP impacts both CPU and GPU. For my hardware, at low settings the CPU is the bottleneck. At ultra settings the GPU is the bottleneck (although depends on number/complexity of surrounding/rendered objects -- not sure exactly what).
- Changing PiP draw distance primarily seems to impact the CPU.
- Multiple PiP displays (at least with PiP=low) increase the CPU bottleneck and each screen renders very poorly. I'm assuming that even on ultra it will still be CPU limited since the increase in CPU load is substantial. (again, for my hardware). (edit: it's more complicated -- see discussion below)
See linked album for case by case screenshots with settings, performance overlays and observations. https://imgur.com/a/WFzDS2t
Hardware:
Core i7-5775C
GTX 1660 Ti
32GB DDR3-2133
Intel 660p 1TB NVMe SSD
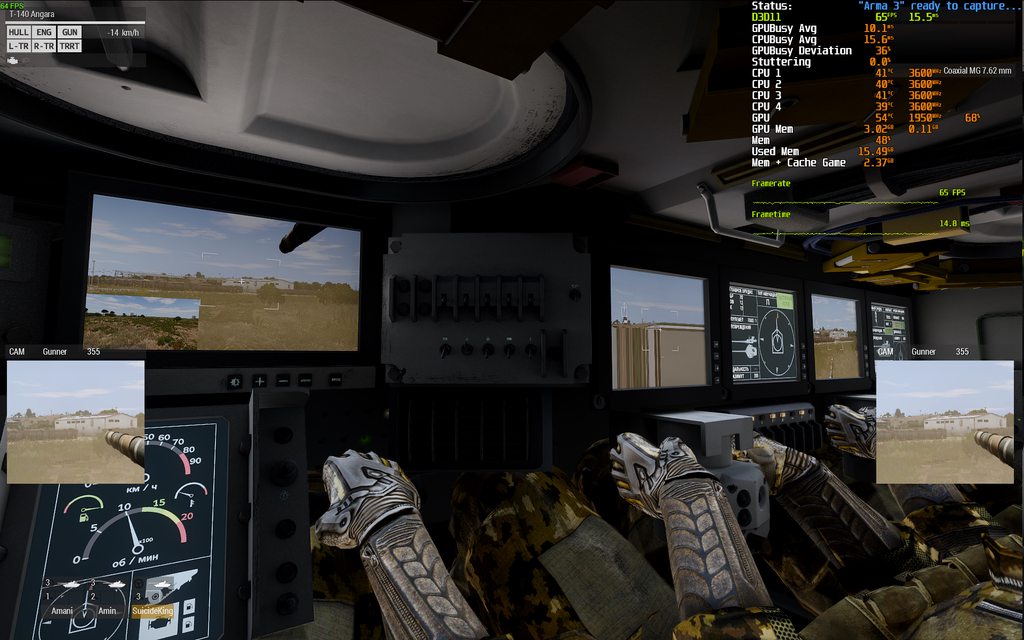
(also yes seems the T-14's gunner's console pip display has rendering issues)
whole cloud
Multiple screens shouldn't make a difference, because it only renders one pip per frame
woven loom
ah maybe that's why the others feel laggy, they're running at fractional frame rates of the first?
But either way, multiple screens do make a difference (compare t-14 screenshot vs the varsuk), although admittedly it could be some other variable influencing frame rates as well 🤔
Actually I can test this in the varsuk with the virtual HUD displays -- i don't know how to turn off the physical screens in the T-14 though so can't test scaling to the same extent.
Thing i'm curious about is, why is the CPU being impacted when PiP draw distance increases? Is there extra/duplicated object related simulation stuff going on for PiP?
woven loom
whole cloud
Multiple screens shouldn't make a difference, because it only renders one pip pe...
Can definitely confirm there is an impact on the CPU with multiple screens.
So in this scenario, I begin CPU limited with one PiP screen (tank commander of the Varsuk). GPU Utilization is 90%.
Adding the driver and gunner's views drops the GPU utilization by 10% and lowers GPUBusy time (and increases deviation from CPUBusy). CPUBusy itself doesn't seem to vary much.
Frame rates don't appear to be impacted much in this scenario though, which is interesting. It's almost like what happens with VSync 🤔 Like the CPU has capped the render frame rate even though it could go faster.
(Ultra PiP with 1500m pip draw distance)
Ah actually no it's just what you're saying
Since only one PiP per frame is rendered it's probably just splitting GPU time across all the PiP screens
whole cloud
The thing is, pip just runs another render cycle. All the optimizations I do to that, also apply the same to pip.
Theoretically we might be able to overlap some parts of pip. But thats quite hard.
Because its doing the same things, and it was written to not run in parallel, a bunch of global variables are reused and would conflict
woven loom
Ah, okay. sadness
crazy how much CPU overhead another render cycle seems to have though 😅
void badger
Ray-traced reflections when? DLSS4?
silk summit
whole cloud
The thing is, pip just runs another render cycle. All the optimizations I do to ...
3X Frame Generation on PIP 😅
 patent sky
Just upgrade to DX12 and implement FSR and/or DLSS. imagine how many frames we could have
no need for all those pesky multithreading optimizations
empty goblet
btw. about the FPS not affected some games with PIP, if it's PIP on rifle optic, i remember one game did all that actually in single render pass because they used wider FOV and viewcone for less occlusion which included both eye position and the optic
but that was possible because the angle of view was nearly same
whole cloud
whole cloud
bug is fixed, freeze turned out to be a 0 byte mdmp, crashes whatever. broken AI...
Found it, single line of code.
Caused AI that was far away from camera (there is no camera on server :)) and was not simulated in main thread, to not load terrain around them.
But why it only affects linux I still have no idea.
knotty wraith
when is the new prof?)
woven loom
patent sky
Just upgrade to DX12 and implement FSR and/or DLSS. imagine how many frames we c...
ironically upscaling will be entirely useless for Arma 3 because it's mostly not GPU limited (even PiP) 😄
patent sky
woven loom
ironically upscaling will be entirely useless for Arma 3 because it's mostly not...
Frame gen fixes that 😄
using AMD's Fluid motion frames at home with Arma 3 i get 2x the frames
woven loom
Well... FG also needs 40-60+ fps base frame rate for the latency to not be bad 😛
DX12 rendering optimizations would have been great though -- imagine if you could render PiP scenes in parallel threads on the CPU 
whole cloud
knotty wraith
when is the new prof?)
tomorraw
 cold vale
I feel like frame gen in Arma would be a case resulting in finding some pretty bad artifacts
empty goblet
cold vale
I feel like frame gen in Arma would be a case resulting in finding some pretty b...
even more edge shimmer and vegetation weirdness ontop of the Z-fighting hell
cold vale
It's already bad enough without any frame gen lmao
woven loom
I'd rather have DLAA than upscaling, but even with 8x SSAA GPUs aren't bothered mostly
empty goblet
fixing the z-fighting on textures would be immense boon to eyesight
heavy galleon
empty goblet
fixing the z-fighting on textures would be immense boon to eyesight
Have you tried flying on the Columbia map?
Z fighting near water edges was so bad I wanted to pull my eyes out.
 rapid elbow
We need z-peace.
patent sky
I need ZzZZzzzzZZzz's 💤
gritty wasp
whole cloud
tomorraw
Prepare your benchmarks, boys
 crude sedge
I'm excited!!
whole cloud
So.... Due to... "Issues", There might be problems trying to deploy profiling. We're trying, but if it doesn't work today, then we won't push on a Friday due to the weekend risk if something isn't working right.
knotty wraith
whole cloud
So.... Due to... "Issues", There might be problems trying to deploy profiling. W...
You can always roll back to the previous version, but we can test it well on the weekend because there will be a lot of players
gritty wasp
If it is extremely unstable, release on Friday will ruin weekend for players that autoupdate by steam.
And obviously noone would fix it on Saturday.
Deploy just on Google drive would be nice.
light cargo
its a lot more complex than that, and they cant drop systems prior win10 yet
whole cloud
Semi-scientific test of the memory allocators...
The result is certainly interesting.
-malloc=system
defaultAlloc:
Allocate:81us Deallocate:45us
Old pool allocator:
first run A:240 D:8
second run A:241 D:8
Old pool allocator, but configured to keep memory allocated and not free any:
first run A:248 D:6
second run A:20 D:6
New pool allocator
first run A:174 D:11
second run A:14 D:11
tbbmalloc (default)
defaultAlloc A:44 D:34
OldP A:244 D:8
OldP2 A:238 D:8
OldPK A:241 D:6
OldPK2 A:19 D:6
NewP A:172 D:10
NewP2 A:14 D:10
mimalloc_v217_20250103, I don't know if lock pages is enabled, I think its not
defaultAlloc A:24 D:9
OldP A:240 D:8
OldP2 A:236 D:8
OldPK A:238 D:6
OldPK2 A:19 D:6
NewP A:176 D:10
NewP2 A:13 D:10
our old pool allocator, uses pages as storage.
It allocates a new page (4096 bytes) if it has no more, and if a page becomes empty it deletes it again.
We can turn off that page deleting for performance, but that is never actually done in the game currently.
The performance, when it needs to get new pages is so utterly terrible.. Probably because it allocates in 4KiB chunks.
The new pool allocator pre-reserves its maximum memory usage (which is why we can't use it on 32bit, but on 64bit we have a few terrabytes of space we can reserve without issues), and allocates in 1MiB chunks, and doesn't give any memory back after its been allocated.
Its nice to see the mimalloc improvement so clearly.
Our new pool allocator is still faster than mimalloc, and every player gets the benefit without having to set a custom allocator.
Our new allocator is also multithreading capable, so we can use it in places where we could not use the old one.
The old one is used mainly in scripts, looking at its performance, I think I will replace it with the new one.
The downside of the new one is its not releasing memory, but if we set a maximum of 64MiB, then thats just the max it will waste, and its still so low that it doesn't matter.
cloud sky
whole cloud
Semi-scientific test of the memory allocators...
The result is certainly interes...
Witnessed a huge FPS boost (or more like no degradation of the initial excellent performance in AI & script heavy and complex mission) with "lock pages mimalloc" as it didn't release any memory and used large pages. If such feature/malloc will be added as default option, I can just imagine what kind of improvements the community will witness
empty goblet
whole cloud
Semi-scientific test of the memory allocators...
The result is certainly interes...
can we get option to customize size of pool allocator to be more than 64MB ?
whole cloud
no
empty goblet
{hopes crused in less than 1s}
whole cloud
its also not 64MB. Each one has a different limit, and I measured how much they roughly need, and then like 4x'ed it
knotty wraith
I'm already tired of warming up YYAB
 spiral eagle
I don't know if lock pages is enabled
latest mimalloc set lock pages enabled as the default (as long as the user has correct perms)
whole cloud
yeah I don't know the perms
spiral eagle
im pretty sure the RPT log should show if its enabled
or maybe the output could be deceiving in some cases, idk
cloud sky
I wonder if the game itself was able to set the required permission via Group Policy programmatically, it would need admin privileges though
whole cloud
Ah right RPT says HasLockMemory, it would say NoLockMemory instead, so its probably on
cloud sky
But if you haven't set the lock pages permission...? I'm confused
whole cloud
It checks if the permission is available
spiral eagle
tried updating mimalloc (with CMA exports) to latest major but it was not a fun experience ^_^
whole cloud
My new pool allocator doesn't use large pages.
Seems all I would have to do, is reserve 2MiB chunks, instead of 1MiB to get it.
But then, we allocate so few chunks, its not really worth it
cloud sky
Hmm I see
empty goblet
whole cloud
its also not 64MB. Each one has a different limit, and I measured how much they ...
-hugepages commandline used or irrelevant ?
light cargo
latest mimalloc uses huge pages regardless of the cmdline, it says in the release notes
whole cloud
hugePages only tells the memory allocator dll to enable huge page support. Nothing else
light cargo
it still needs the privilege configuration for locking them
empty goblet
anyway those new allocated pools are small right? compared to rest of allocated memory so using large pages isn't going to do anything significant
cloud sky
I wonder whether the translation lookalike buffer has any impact in this case
whole cloud
Large-page memory must be reserved and committed as a single operation. In other words, large pages cannot be used to commit a previously reserved range of memory.
nevermind can't use it anyway. I would have to always allocate the maximum size of the pool.
I don't like that
spiral eagle
does gjk truly just use the BI docs for adapting mimalloc as a CMA for a3?
because its very hard to debug any failures lol
failure mode is: fallback to tbbmalloc, dont output any error in rpt
empty goblet
uh?
empty goblet
did it even load on startup ?
spiral eagle
i would assume that it tried loading it, then silently failed
because it shows up as a memory allocator in the launcher
which means that the exports are there at least (if im not wrong)
empty goblet
yes if it fails load the allocator, it goes back to tbb4 allocator and if that fails (or is missing) it uses system one
empty goblet
spiral eagle
because it shows up as a memory allocator in the launcher
unless just using wrong filename
spiral eagle
filename?
i wont bother with it too much, esp if dedmen's cooked up something better
but gjk hasnt gotten around to mimalloc v3 yet, so ig we dont know for sure
empty goblet
if your allocator filename is eatmemoryfast.dll then commandline shall be-malloc=eatmemoryfast 😁
spiral eagle
ye no it was without the ext, pretty sure
empty goblet
and must be placed where other allocators are, \Dll\
patent sky
empty goblet
if your allocator filename is eatmemoryfast.dll then commandline shall be`-mallo...
Didn't know you could use chrome as an allocator
spiral eagle
i could step through the whole cma init thingy in something like x64dbg but i dont feel like getting dispatched by BE lmao
empty goblet
patent sky
Didn't know you could use chrome as an allocator
it could be worse, imagine internet explorer 😁
 tawdry gazelle
whole cloud
My new pool allocator doesn't use large pages.
Seems all I would have to do, is ...
tawdry gazelle
whole cloud
My new pool allocator doesn't use large pages.
Seems all I would have to do, is ...
The most perf improvements introduced by mimalloc is "eager commit" (that's how Microsoft calls it). huge page is just a bonus.
whole cloud
Yeah I'll try what the difference is in benchmark
tawdry gazelle
It sounds simple: allocate a memory page at the first alloc request, then reuse that page when new alloc request happens. (if the page is large enough to hold new alloc size)
whole cloud
2.18.152618 new PROFILING branch with PERFORMANCE binaries, v21, server and client, windows 64-bit, linux server 64-bit
- Changed: Updated Steamworks SDK to 1.61 (Requires new steam_api.dll)
- Tweaked: Memory allocation optimizations
- Fixed: Crash when MagazineUnloaded eventhandler is set and magazine is unloaded in Arsenal
- Fixed: Inflate decompression would freeze the game if there were extra bytes at the end (Thanks @quartz rampart )
- Fixed: Base64 decode would not recognize padding characters and produce extra bytes at the end
- Fixed: -init= command line parameter did not work
- Fixed: AI on linux would get stuck in animation and not move
If you don't want to use the Steam branch, the files are also available for alternative download here:
https://drive.google.com/drive/folders/15p9j7C2nHUt6NoVfChX4YFuqzFXzblJh
Note: There are separate Dll files that also need to be placed into Game folder.
whole cloud
whole cloud
2.18.152618 new PROFILING branch with PERFORMANCE binaries, v21, server and clie...
I have not done any ingame benchmarks.
I expect the improvement of
v20+default alloc -> v20+mimalloc
to roughly match
v20+default alloc -> v21+default alloc
whole cloud
tawdry gazelle
It sounds simple: allocate a memory page at the first alloc request, then reuse ...
That is what we are currently doing. But that is not eager commit.
We reserve a large chunk, but only commit a new page once we access it (when system triggers a page fault).
eager commit is committing (faulting all the pages) everything of the large chunk, ahead of time.
I'm testing now what difference eager commit makes. In theory it should get rid of the NewP A:172 D:10 first allocation time
honest fulcrum
I'm getting some application hangs, I unloaded all mods, unchecked the memory allocator and left Large-page support enabled.
It seems to happen going into the editor- if I load direct in to a stratis mission with the mission file parameter, that seems to work okay but if I try to change the map to anything else, or if I try to enter the editor from the main menu it also hangs
whole cloud
Yep something is broken, we're reverting, weirdly, my game still runs fine rn, but the prof build doesn't
patent sky
Reverted 😢
honest fulcrum
It happens 😄
whole cloud
whole cloud
That is what we are currently doing. But that is not eager commit.
We reserve a ...
part 1, mark pages as readwrite right away, instead of manually telling OS to commit them later which doesn't actually do anything.
16:56:31 NewFA A:116 D:10
16:56:31 NewFA2 A:14 D:10
And with "eager commit"
16:59:35 NewFA A:31 D:10
16:59:35 NewFA2 A:16 D:11
But, this improves the first allocation time only, so when the pool is grown. While the game is running and memory usage is not increasing, that wouldn't happen.
And I don't want to deal with the extra cruft that comes along with eager commit, so won't do that
vivid rune
V21 hangs. There are a lot of these at the end of the rpt:
16:33:12 StreamSource: a3\map_altis\altis.wrp; TellGFromOffset: 68; WantedOffset: 0; WantedSize: 154507904; ReadedID: 1660969728; MapGrid: (813,1490341408); ReadedIndex: 1660969728
patent sky
whole cloud
Yep something is broken, we're reverting, weirdly, my game still runs fine rn, b...
@vivid rune
 clever roost
working perfectly for me
 orchid void
hangs for me
patent sky
clever roost
working perfectly for me
It has already been reverted, sure you are still on 21?
naive osprey
Just to note on v21 (I realize the data is probably useless at this point)
Been running YAAB on repeat constantly, and every subsequent run is~2 avg FPS lower.
9 runs in without restarting, went from ~63 avg FPS down to ~44 avg FPS.
Additional runs after 9 (ran 15 times) seem to keep avg FPS around 44.
v20 does not have the same issue.
Unloading Altis after YAAB and trying to load Livonia in editor crashed.
Know nothing about memory allocation, however ram has increased by 400~MB from the first run.
whole cloud
The freezes are not related to the memory allocator though, its related to the linux animations fix 😦
heavy galleon
Hmmm, maybe drop windows support?

 clever roost
grammatical mistakes are the frosting of coders cakes
whole cloud
I blame RV for making adding nothing possible at all
Only happens on terrains that have objects, so opening editor in VR, and launching game with world=empty didn't cause issues
clever roost
im in altis
honest fulcrum
I was able to get into 3den on stratis a few times with the mission file param too, but couldn't change maps
whole cloud
it clobbers the memory with random garbage, if it happens to be zero it will work fine. But that chance isn't very high
light cargo
hotfix getting pushed asap or next week?
whole cloud
Trying nowish
patent sky
He's making me work overtime 🙄 😂
vivid rune
Great thing that you find it so fast.
tawdry gazelle
whole cloud
That is what we are currently doing. But that is not eager commit.
We reserve a ...
yes you are right.👍 I may not expressed it correctly.
tawdry gazelle
whole cloud
part 1, mark pages as readwrite right away, instead of manually telling OS to co...
Will it affect worst case performance? or fps stability?
mimalloc does bring a lot benefits on worst case fps.
whole cloud
I don't think so. It only affects when memory grows beyond what is in the freelist. Which is rare, even during spikes.
And even if, only the first spike per whole game run, would do it
void badger
whole cloud
The freezes are not related to the memory allocator though, its related to the l...
You're welcome :)
autumn timber
Did you eventually find why the issue was only happening on linux?
whole cloud
autumn timber
Did you eventually find why the issue was only happening on linux?
no, it should've happened on windows the same
analog acorn
the invisible hand of Bill Gates reached out and flipped one bit
whole cloud
AI was not telling terrain around them to load in.
Same on windows and linux. I guess on windows there is something else somewhere that would cause the terrain to load anyway even while the AI requests are ignored
tawdry gazelle
whole cloud
I don't think so. It only affects when memory grows beyond what is in the freeli...
Will there be a case that more and more memory are taken, resulting a continuous growth?
whole cloud
No, each pool has a max size. If it goes beyond it uses normal allocator
tawdry gazelle
okay i see
whole cloud
mh yaab used to have a big spike in the middle, this looks weird

#perf_prof_branch message my capframe graphs used to look like that.
Now I have this. Something must be wrong with my PC 🤔
 gritty wasp
what happen on 100sec? camera turn from KAMAZ to city?
whole cloud
I have never seen this in RPT before
18:37:44 Error: EntityAI SubSkeleton index was not initialized properly (repeated 51x in the last 60sec)
18:37:44 name: Land_i_Stone_HouseSmall_V1_dam_F, shape: a3\structures_f\households\stone_small\i_stone_housesmall_v1_dam_f.p3d, index: -1, matrices: 518:39:21 oldSize-1 != list.Size() 39 ,38
18:39:21 Offending nonprimary object 25feb974080:O_MBT_02_cannon_F,<null>
but v20 also has it 🤔
v20 vs v21 doesn't look that good 🤔
but my PC is being weird

Due to "technical issues" the new prof won't be today :harold:
"Arma uses only one core" 🤡
 spiral eagle
is that vtune?
void badger
Confirmed, set -cpuThreads to 4 for maximum multithreaded performance!!!
whole cloud
ye
spiral eagle
oneapi sdk takes too much space ^_^
think i needed it for gjks mimalloc also. dependency on intel's compiler or something
whole cloud
uh just accidentally found another bottleneck in AI pathfinding that is easily solvable. Huh.
YAAB has a lagspike just after the bomb drop scene.
All the small sections, are line intersects that can run in parallel.
When AI scans for possible cover, it does line intersects around each object to filter out objects that are not actually usable cover.
we can do all of that in parallel now 😮
 heavy vortex
inAreaArrayIndexes lost the ability on profiling branch to handle an array of markers as input. Still works on 2.18 stable.
whole cloud
from what I can see, it still checks for string and uses it for markers, should still work 🤔 atleast on dev branch
heavy vortex
Apparently it's broken on dev too. Haven't tried it personally though.
Dev takes a lot longer to switch between :P
whole cloud
If its broken on dev then I blame KK 😄
But code wise it seems right, would need a repro
heavy vortex
["Therisa"] inAreaArrayIndexes [getPosATL player, 1000, 1000]
Ah, but you would need a marker with that name :P
but whatever, make a marker, put it in there.
It gives the same error with a marker that exists and a marker that doesn't.
whole cloud
That render optimization that made objects flicker.
Just saw it again because that is the slowest part of the frame.
We collect objects to draw. Then we do particles.
But we can do particles in parallel to normal objects :U
0.9ms saved at yaab's "benchmark started" point where it goes up the road
1.1ms at the still from above view when the plane bomb explodes (screenshot below thing)
whole cloud
whole cloud
uh just accidentally found another bottleneck in AI pathfinding that is easily s...
And AI pathing has been squished together
 heavy vortex
Is YAAB really doing that much physX
whole cloud
its at the start when it enables simulation for all vehicles
heavy vortex
ah ok
empty goblet
whole cloud
"Arma uses only one core" 🤡
cough, still low end of the ok segment 😁
silk summit
empty goblet
cough, still low end of the ok segment 😁
Only 3 and partially 4 are being used right? Would be awesome to use 5 and 6 too when possible
silk summit
whole cloud
https://discord.com/channels/105462288051380224/105466848958513152/1293248888949...
"Something must be wrong with my PC" is like every player's first thought when they run Arma for the first time 😅 
silk summit
whole cloud
uh just accidentally found another bottleneck in AI pathfinding that is easily s...
The Ai also seems to do redundant pathing when trying to mount/enter a vehicle. They move around, crawl, go prone and take cover when they should just run on a straight line for the vehicle and get in ASAP
whole cloud
silk summit
The Ai also seems to do redundant pathing when trying to mount/enter a vehicle. ...
unrelated
woven loom
Looking forward to more parallelism 😋
tawdry gazelle
spiral eagle
think i needed it for gjks mimalloc also. dependency on intel's compiler or some...
Nope. mimalloc does not rely on openapi sdk.
spiral eagle
tawdry gazelle
Nope. mimalloc does not rely on openapi sdk.
the vs project has the intel compiler set as a compiler though
but tbf you can just change it to use msvc iirc
the vanilla mimalloc doesnt use the intel compiler, seems like its something specifically set in ur project
tawdry gazelle
spiral eagle
the vs project has the intel compiler set as a compiler though
Ah I get it. You want to compile the code, not just using the dll?
Then you may install the standalone Intel Compiler, without openapi SDK. Or you may change the compiler to MSVC in VS project yourself.
I use Intel Compiler because it has better performance optimization than MSVC.
whole cloud
Found out, -setThreadCharacteristics doesn't work on most of our threads 🤣
It only works on the physx and file loading threads, because they use a 20 year old system, and everything else uses something newer and I forgot to put it into the new stuff.
So, it did mostly nothing 🤣
 quaint flame
dedmen fix
light cargo
oh actually, maxmem seems to have worked a little bit better
ram usage wasnt too high on arma 3 with mods
at most like 7gb
nvm about maxmem, just the ram usage has been better this time, im using profiling with scheduled mimalloc
i think the allocations fixes improved the overall ram usage for me
naive osprey
light cargo
i think the allocations fixes improved the overall ram usage for me
You sure you're using v21, cause it was reverted very shortly after it was launched.
light cargo
naive osprey
You sure you're using v21, cause it was reverted very shortly after it was launc...
using whatever is current on steam. didn't dedmen push part of the allocation fixes?
naive osprey
They DID, but reverted it.
#perf_prof_branch message
light cargo
Ah i see, well what did go through is the reduced ram usage before the last big allocation fixes that warranted a revert
the 400mb less memory translates well to large quantities
vivid rune
?
light cargo
whatever, im weird
Tweaked: The game now uses about 400MB less memory, and 32bit has about 1GB more available memory
(i use 64 bits but also 64 bits benefits from it)
naive osprey
But.... The build was completely reverted? None of the changes are in the current profiling build
naive osprey
Ah, that was in v20. My bad.
empty goblet
whole cloud
Found out, `-setThreadCharacteristics` doesn't work on most of our threads 🤣
I...
that explains something
 vivid bear
Dedmen, any idea what causes CTAB crashes? Opening it and suddenly crashing. Got 2 guys in my unit who have noticed it more on profiling where as it’s fine for me etc
patent sky
whole cloud
Due to "technical issues" the new prof won't be today :harold:
Not today either 
empty goblet
vivid bear
Dedmen, any idea what causes CTAB crashes? Opening it and suddenly crashing. Got...
dumps?
vivid bear
empty goblet
dumps?
Didn't have logs enabled but they are now so will get them next time it happens
knotty wraith
Are we done - gone for the weekend?
empty goblet
knotty wraith
Are we done - gone for the weekend?
we know you want D work thru weekend but that's too cruel
knotty wraith
empty goblet
we know you want D work thru weekend but that's too cruel
the conversation was about a minor typo...
Well, I just clarified - nothing more
whole cloud
vivid bear
Dedmen, any idea what causes CTAB crashes? Opening it and suddenly crashing. Got...
send crashdump to mi+
vivid bear
whole cloud
send crashdump to mi+
Will send it when we next get it mate - not have the same issue with a blank dump like I had with the Hachet airframe?
whole cloud
The v21 would've been unstable anyway 😄
whole cloud
vivid bear
Will send it when we next get it mate - not have the same issue with a blank dum...
The dump would only be 0 bytes on stack overflow, there are many more crashes
heavy galleon
whole cloud
The v21 would've been unstable anyway 😄
I suddenly lost all respect for you.
WTF are those post process effects?  my eyes were flashbanged so much
somber plank
heavy galleon
I suddenly lost all respect for you.
WTF are those post process effects? <:WTFch...
Probably HDR, it can fuck with recordings
heavy galleon
ah... that is possible, I used to have the same issue
especially because if you use "TV and Movies" app to cut it, it fucks the metadata.
 use LosslessCut, works great! https://github.com/mifi/lossless-cut
spiral eagle
tawdry gazelle
I use Intel Compiler because it has better performance optimization than MSVC.
are these optimizations specific to intel cpus or
gritty wasp
patent sky
Not today either <:sadcat:1337449493226066103>
rule number one of software development!!1
Never release on Fridays if you want to have weekends!!!
patent sky
gritty wasp
rule number one of software development!!1
Never release on Fridays if you want...
prof branch is an exception 😄
Worst case scenario I need to spend 5-10 minutes reverting it
knotty wraith
wait until monday to find out you made a typo lol
tawdry gazelle
spiral eagle
are these optimizations specific to intel cpus or
No. It's compiling optimization. It works for all CPU.
spiral eagle
oki
ill give compiling it another shot
just want to test mimalloc v3
but perhaps its just better if i start from scratch by cloning and then inserting the cma exports. instead of trying to dump the updated stuff in ur fork
 lilac hearth
spiral eagle
just want to test mimalloc v3
lilac hearth
spiral eagle
just want to test mimalloc v3
I got best performance with mimalloc V207 (intel i9 9900k / all tests in YABB)
light cargo
how come
empty goblet
oh, it looks like v 2.1.9 is out for mimalloc
knotty wraith
weekend is over? our schedule - what to expect) ✍️
@empty goblet Raise Dedmen's salary - he is our hero and post a bill for where to donate
whole cloud
Linux crash because stack overflow because coroutines only have 64KiB of space 🤣
What a pain, so that'll increase memory usage 🤔 Which 32bit doesn't like, so probably disable also that perf improvement on 32bit
plain trout
Or abandon 32bit ….
gritty wasp
One man with phenom affected
void badger
I am shocked you're clinging to a 32bit binary, let alone for Linux
I thought the marketshare for 32bit linux was nil
whole cloud
I'm not for linux, that's the one we'll drop the soonest
void badger
Linux outright or 32bit?
whole cloud
lol
carmine stump
ah yes, 32bits support is super important
W64 bits makes up 96.55% of users on steam.
heavy vortex
Rest is Linux?
analog acorn
I'd suggest, somewhat speculatively, that Linux is used for servers more than it is for clients. So while the number of machines using it directly isn't that high, it does have a bigger indirect impact.
Our Linux server is also used for other things and having to convert it, or pay for a second Windows server alongside it, would be very annoying
carmine stump
damn, only 2.22% of cpus run above 3.7ghz!
whole cloud
How nice the world could be if these gaps between multithreading stuff weren't there
 heavy vortex
looks like the main thread is no longer the main thread
spiral pond
is the main reason why remaining parts cant be MT that a computation may impact a following "element"/simulation? or what other(s) reasons are the limiting factor(s)?
whole cloud
You cannot access the same data from multiple places at the same time
spiral pond
Even for a "read"/if the data wont be modified [if you can tell that for certain] ?
Or is it about cache/ram/vram/etc access?
runic sigil
Reading can have issues too,
Consider whether the data gets read before or after the data gets modified by a different thread.
whole cloud
spiral pond
Even for a "read"/if the data wont be modified [if you can tell that for certain...
I can't tell that for certain
That already failed on AI for example.
I tried to make it prepare multiple AI grid cells in parallel.
But then one group tries to access a cell, which's pathfinding info is only just being filled and dies on half complete data
spiral pond
If you cant, you cant. I am mainly curious to understand the limitations/reasons.
Possibly with some out-of-the-box thinking or looking at techniques other engines/systems use, for a subset there may or may not still be approaches to try.
ie for the pathfinding info - setting a flag/lock that its "in process" is too slow/too much overhead created?
Another reason for asking is that it appears collision checks can make up a decent amount of the main thread runtime (a few percent).
Each check is fairly quick, yet with 100s, it adds up. If putting them into jobs by itself wouldnt be too expensive, and it would be safe to MT these checks - cant say if positional data is changed within a frame or only for the next. Collision vs ground probably should be safe at least, is it not?
heavy vortex
Probably not because it often needs to generate the ground.
Kinda like the AI example. It certainly could be reworked for multithreading but it's not necessarily straightforward.
spiral pond
Some further for those interested (some applies here, some does not - some too much work)
Decent article - "fairly in-depth starting point": https://vkguide.dev/docs/extra-chapter/multithreading/
A few design insights and lessons learnt: https://www.reddit.com/r/gamedev/comments/pe3nwt/how_do_i_conceptually_approach_multithreading/
Similar but older: https://www.reddit.com/r/gamedev/comments/44fux4/multi_threading_in_game_development/
Somewhat related: https://www.reddit.com/r/GraphicsProgramming/comments/1fzoios/performance_and_frame_analysis_metaphor_refantazio/
https://www.reddit.com/r/gamedev/comments/1ar6zjg/breakdown_of_cpu_budget_in_a_typical_modern_game/
https://mamoniem.com/behind-the-pretty-frames-elden-ring/
woven loom
nice. i only dabbled in this stuff informally back in college, and that was mostly just reading OpenMP tutorials, e.g.
Introduction to OpenMP tutorial from Lawrence Livermore National Lab.
https://hpc.llnl.gov/documentation/tutorials/introduction-parallel-computing-tutorial
Other resources: https://www.openmp.org/resources/tutorials-articles/
Under the section "Potential Benefits, Limits and Costs of Parallel Programming", the LLNL tutorial mentions:
- Amdahl's Law
- Complexity
- Portability
- Resource Requirements
- Scalability
I think it's just a really solid "fundamentals of parallel computing" type piece, been a decade since i read it though.
naive osprey
If you setObjectTexture out of index, it will seemingly reset all texture indexes to default. Only happens on profiling
getObjectTextures player; // ["a3\characters_f\blufor\data\clothing1_co.paa",""]

player setObjectTexture [0,""]; // ["",""]
player setObjectTexture [1,""]; // ["",""]
player setObjectTexture [2,""]; // ["a3\characters_f\blufor\data\clothing1_co.paa",""]
player setObjectTexture [3,""]; // ["a3\characters_f\blufor\data\clothing1_co.paa",""]
Also decent article on UE(mostly 4) options of handling MT (and laying out general important principles):
https://www.guneetsasan.com/home/multithreading-unreal
whole cloud
spiral pond
If you cant, you cant. I am mainly curious to understand the limitations/reasons...
Other engines lay out their data and code in a way that it doesn't happen.
whole cloud
spiral pond
Another reason for asking is that it appears collision checks can make up a dece...
Where can you see that? Because I don't see that in my testing. There was only explosions which is already fixed, and AI (which is not main thread anymore) which is also fixed.
Like enfusion for example, has a resource loading system. If a resource is not ready, it gets queued up in a multithreading safe way. But for that you get objects popping in gradually.
Arma says "I need something now, load it if it's not there" which doesn't have objects popping in, but causes lag spikes and causes threading problems if multiple places want the same object.
That is just basic design that prevents optimization here.
spiral pond
Yeah. RV wasnt designed for MT obviously. Beyond the existing MT system from A2 for some parts, I'd say all your work along with the introduction of the Enfusion scheduler has brought very, very impressive improvements.
Probably anything beyond would require larger rewrites/considerable more efforts (and for the most part less gains).
whole cloud
The recent Linux bug where AI wouldn't move.
Was a multithreading issue because they needed to load in terrain cells, which they can't do. So for that I implemented a cell request queue to fix it.
It's possible but a lot of work to gradually update such things
I wanted to do the render instancing processing in multithreaded. But I saw that they do the model loading I described above inside there, so I cannot do it. But I can do some overlap still which should bring most of the improvement anyway
spiral pond
whole cloud
Where can you see that? Because I don't see that in my testing. There was only e...
One instance I can still remember from my testing last year: Vehicles naturally have to do collision checks - its per wheel. So if you have 30-50+ (tanks especially due to more "axis"), it adds up. The best way to see is the shift(?) + LMB dc on a scope to select and visualize all of them in the current frame
whole cloud
With AI sim, they do target scanning, which quite easily goes multithreaded and async. But, groups also run script, and if any script deletes/creates targets, while another group is scanning targets, we very likely crash.
whole cloud
spiral pond
One instance I can still remember from my testing last year: Vehicles naturally ...
Problem with that is the checks need to be finished in the same frame.
And there is too much space between the vehicles.
I could run all wheel checks in parallel, but with just 4 the overhead is too large and it would reduce performance.
You could iterate all vehicle simulation twice, first collect all wheels, then do collisions in parallel, then apply results. But that also would be slower than it is now.
Could build a system where each vehicle, registers all it's wheels, so that you know beforehand which will be needed (you still don't know because not all vehicles will get simulated) and could preprocess them efficiently.
spiral pond
Sample of the visualization


As said it may not be worth it - it just stood out to me that collision checks overall do make up a fair amount
whole cloud
spiral pond
Sample of the visualization
You are showing network packet processing, and the async AI pathfinding process.
One isn't vehicle simulation, and the other isn't even main thread.
spiral pond
As said - sample of the visualization (scope selection). Not of the cases I was referring to

This might be one
(from Malden with A3 assets - our SPE terrains with lower terrain cell size and tanks seem to cause a bigger impact)
i think this should be another collision case type - at times they can be quite "heavy". this may even be from an infantry


that should be one with SPE

while sound is async, maybe its still worth to look into its 3d calcs

(on the server sound is not from what i recall, yet the server doesnt compute sounds for vehicles i think - just some for infantry and objects)
empty goblet
whole cloud
I wanted to do the render instancing processing in multithreaded. But I saw that...
solution could be model loading/request queue ?
whole cloud
empty goblet
solution could be model loading/request queue ?
Which is a task too big to be done
empty goblet
whole cloud
With AI sim, they do target scanning, which quite easily goes multithreaded and ...
ouch so that would need queue for scanning targets and MT safe creation/deletion of targets
empty goblet
spiral pond
while sound is async, maybe its still worth to look into its 3d calcs
note, xaudio2 v2.9 exists but Microsoft decided to not distribue automatically until certain revision of W10
for older Windows 8.1,8,7 it needs to be distribued manually with the application/game
https://learn.microsoft.com/en-us/windows/win32/xaudio2/xaudio2-redistributable#xaudio-29-api-differences-compared-to-xaudio-27
one of new features is option to specify which CPU core XAudio 2.9 should use for its audio processing thread, tho auto option picks what OS suggests
xaudio v2.9 has tons of fixes compared to 2.8 and 2.7 and if i understand correctly better timer chunks etc.
but i'm not even sure if the engine auto uses 2.9, 2.8 or 2.7 on W10/W11, that's something Dedmen could answer
whole cloud
2.18.152632 new PROFILING branch with PERFORMANCE binaries, v21, server and client, windows 64-bit, linux server 64-bit
- Changed: Updated Steamworks SDK to 1.61 (Requires new steam_api.dll)
- Tweaked: Memory allocation optimizations
- Fixed: Crash when MagazineUnloaded eventhandler is set and magazine is unloaded in Arsenal
- Fixed: Inflate decompression would freeze the game if there were extra bytes at the end (Thanks @quartz rampart )
- Fixed: Base64 decode would not recognize padding characters and produce extra bytes at the end
- Fixed: -init= command line parameter did not work
- Fixed: AI on linux would get stuck in animation and not move
- Fixed: -setThreadCharacteristics wasn't applied to the main engine threads
If you don't want to use the Steam branch, the files are also available for alternative download here:
https://drive.google.com/drive/folders/15p9j7C2nHUt6NoVfChX4YFuqzFXzblJh
Note: There are separate Dll files that also need to be placed into Game folder.
whole cloud
whole cloud
2.18.152632 new PROFILING branch with PERFORMANCE binaries, v21, server and clie...
empty goblet
whole cloud
2.18.152632 new PROFILING branch with PERFORMANCE binaries, v21, server and clie...
bad news ... instant server crash on WS2019 old steam_api64.dll
whole cloud
crashdump please 🥺
patent sky
whole cloud
Remember that this, as listed in multiple places, needs the new steam_api.dll. If you don't put that in (its included in all the downloads) everything will crash at start.
Same as when you go back to v20, but keep the new steam_api.dll, the old version will crash if the dll missmatches.
We include the old version of the dll in the google drive downloads, in case you need to go back.
empty goblet
oh, that's likely it
gritty wasp
heavy vortex
`["Therisa"] inAreaArrayIndexes [getPosATL player, 1000, 1000]`
So is this KK fault? 🤫
 pallid pebble
whole cloud
Remember that this, as listed in multiple places, needs the new steam_api.dll. I...
pallid pebble
whole cloud
Remember that this, as listed in multiple places, needs the new steam_api.dll. I...
does steam update the dll itself when updating via steam branch?
Otherwise I gotta go poke some peeps
pallid pebble
 Oki
Oki
whole cloud
gritty wasp
So is this KK fault? 🤫
yes
if you set the 6th parameter to true, the "isPosWorld" one, it'll work.
I think on profiling branch specifically though, it is hardcoded to false
orchid void
posted my quick benchmarks in #hardware_vs_arma
whole cloud
I'm mainly interested how mimalloc v20, compares to non-mimalloc v21
Whether its closer, or on-par, or better
 vagrant zodiac
Is there expected to be any benefit to run mimalloc with v21?
whole cloud
Yes, but I hope its less than before
orchid mesa
whole cloud
I'm mainly interested how mimalloc v20, compares to non-mimalloc v21
Whether its...
i didn't test that - but in my very limited testing of default alloc and mimalloc on v21, mimalloc was only ~7% better avg fps and identical lowest fps (yaab graph)
playing koth however on default alloc was significantly worse than mimalloc
like, 30% worse avg and 50% worse lows
lows in general actually seem worse on v21, while playing koth
also seems like the longer i play, the worse my avg fps is getting. normally while inside the ao im sitting between 90-120 fps, on v21 im at an almost constant 60-80
 mint sun
whole cloud
2.18.152632 new PROFILING branch with PERFORMANCE binaries, v21, server and clie...
mint sun
whole cloud
2.18.152632 new PROFILING branch with PERFORMANCE binaries, v21, server and clie...
i got false positive on new steam_api.dll as dlc unlocker, any ideas?
whole cloud
mint sun
i got false positive on new steam_api.dll as dlc unlocker, any ideas?
false positive where? can you show me that?
mint sun
whole cloud
false positive where? can you show me that?
mind if i dm you?
orchid mesa
orchid mesa
also seems like the longer i play, the worse my avg fps is getting. normally whi...
reverted back to v20, fps is normal again
knotty wraith
I can't log in to the server
17:05:56 BEServer: registering a new player #2132563847 17:05:57 Client: Dimon UA - Kicked off because of invalid ticket: Invalid ticket - Ticket invalid 17:07:57 BEServer: registering a new player #106753536 17:07:58 Client: Dimon UA - Kicked off because of invalid ticket: Invalid ticket - Ticket invalid 17:13:22 BEServer: registering a new player #1984109239 17:13:24 Client: [KPblM]KpeBetka - Kicked off because of invalid ticket: Invalid ticket - Ticket invalid
 hallow lantern
knotty wraith
I can't log in to the server
`17:05:56 BEServer: registering a new player #21325...
hallow lantern
knotty wraith
I can't log in to the server
`17:05:56 BEServer: registering a new player #21325...
same here
but steam didn't update libsteam_api.so on linux
whole cloud
After you updated on server side?
hallow lantern
Yes, only changed arma executable
whole cloud
hallow lantern
but steam didn't update libsteam_api.so on linux
its in linux64 subfolder, its two files.
They are included in the google drive downloads
Mh only one file is included in google drive
hallow lantern
whole cloud
its in linux64 subfolder, its two files.
They are included in the google drive d...
Ah I just updated with steamcmd
whole cloud
steamcmd is supposed to do it, but maybe we got that wrong
whole cloud
knotty wraith
I can't log in to the server
`17:05:56 BEServer: registering a new player #21325...
Is that also linux?
I have tested it on my linux server and didn't have issues. But i manually replaced the libraries
knotty wraith
I don't even see the server in the list, I only connect directly
whole cloud
Verify that your server has the new steam dll
knotty wraith
whole cloud
Verify that your server has the new steam dll
 hallow lantern
I got a libsteam_api.so and libsteam.so inside the arma 3 directory
I also have another libsteam_api.so inside the linux64 subdirectory, is that correct?
whole cloud
hallow lantern
I got a libsteam_api.so and libsteam.so inside the arma 3 directory
I also have ...
the linux64 subdirectory is the one that matters
whole cloud
knotty wraith
update 6 days ago, so no, you don't have it
whole cloud
hallow lantern
I got a libsteam_api.so and libsteam.so inside the arma 3 directory
I also have ...
both of these into linux64 folder
your libsteam_api.so should've been updated, but I think your steamclient.so did not
knotty wraith
I downloaded this half an hour ago
 whole cloud
your libsteam_api.so should've been updated, but I think your steamclient.so did...
whole cloud
whole cloud
your libsteam_api.so should've been updated, but I think your steamclient.so did...
So with these, that should work
whole cloud
knotty wraith
I downloaded this half an hour ago
Ah that is the time of when we packed it.
whole cloud
knotty wraith
I downloaded this half an hour ago
You have steamclient64.dll in your server folder right?
Please make a backup of your old one, and try this.
I think we've just missed that we need to update that one for the servers too
eternal kraken
the 313 kb should be the new steam_api64.dll, the old has 292 kb
naive osprey
Running YAAB on repeat in comparison to v20
v21 has fewer FPS spikes, however seemingly has issues with average FPS as time goes on.
PhysMem: 64 GiB, VirtMem : 131072 GiB, AvailPhys : 46 GiB, AvailVirt : 131068 GiB, AvailPage : 54 GiB, PageSize : 4.0 KiB/2.0 MiB/HasLockMemory, CPUCount : 8
Memory in MB - As shown in Task Manager
Avg FPS

v21 - Default Malloc (tbb4malloc_bi_x64.dll)
4977    5047       5125       5101      5123       5201      5207       5215       5232
66 FPS  63.3 FPS   59.7 FPS   56.7 FPS  56.0 FPS   56.4 FPS  46.1 FPS   47.4 FPS   46.8 FPS

v20 - Default Malloc (tbb4malloc_bi_x64.dll)
5204       5113       5130      5218       5201      5225      5199
67.2 FPS   66.0 FPS   66.0 FPS  65.4 FPS   66.2 FPS  66.1 FPS  65.3 FPS


v21 - MiMalloc
4750       4810       4882      4885       4910      4923
66.9 FPS   63.7 FPS   61.8 FPS  54.7 FPS   55.9 FPS  55.9 FPS

v20 - MiMalloc
4755       4817      4831      4867       4892       4917       4925
65.8 FPS   67.5 FPS  67.2 FPS  68.6 FPS   67.6 FPS   68.2 FPS   67.2 FPS
whats your CPU?
naive osprey
eternal kraken
whats your CPU?
5800X3D. Could get more FPS, but I run very high settings.
knotty wraith
whole cloud
You have steamclient64.dll in your server folder right?
Please make a backup of ...
Just don't tell me it's because of Windows 2008
 hallow lantern
whole cloud
hallow lantern
whole cloud
steamclient.so wasn't updated, was 1y old, now works
whole cloud
knotty wraith
Just don't tell me it's because of Windows 2008
Nope (Make sure to make backups of your old ones)
We'll fix that soon
hallow lantern
Can confirm that with this perf, this error with lambs is fixed
 cloud nacelle
naive osprey
Running YAAB on repeat in comparison to v20
v21 has fewer FPS spikes, however se...
cloud nacelle
naive osprey
Running YAAB on repeat in comparison to v20
v21 has fewer FPS spikes, however se...
I can confirm this too. FPS degrades as time goes on in v21. Over 10 runs I lost ~8 avg FPS in YAAB (46.9 -> 38.2). I did not compare against v20
empty goblet
is there some issue with users not being able to join the new build ?
whole cloud
empty goblet
is there some issue with users not being able to join the new build ?
yes if not all steam dll's are correctly updated
We missed some in both steam and google drive
empty goblet
whole cloud
yes if not all steam dll's are correctly updated
ah, so w/o the the extra files the auth fails ... interesting it , there is no RPT nor console error
nope nope nope i'm blind
whole cloud
If you have steam client installed on the machine, steam pulls the files from there.
But if you only use steamcmd, it doesn't
empty goblet
2025/02/11, 13:57:17 Unknown entity: 'Oacute'
2025/02/11, 13:57:17 Unknown entity: 'Oacute'```everything works - thanks)
whole cloud
It would be nice to get a profiling frame capture, of the fps being degraded.
I'd just have to run yaab 20 times but I don't have time today
naive osprey
whole cloud
It would be nice to get a profiling frame capture, of the fps being degraded.
I'...
DMed with diag_captureFrameToFile 1 before/after YAAB
Lucky I didn't close my game lmao
spiral eagle
empty goblet
ah, so w/o the the extra files the auth fails ... interesting it , there is no R...
where may I access this "console", warden fella?
like i really want to print shit from my mimalloc but it doesnt go anywhere
wise sparrow
Got a just shy of 10 fps decrease on 3 back to back runs on YAAB, standard settings, should I return to main menu before each run or just restart after saving the run?
whole cloud
restarting should do the same as returning to main menu
knotty wraith
2.17 MiMalloc +3 FPS! from standard
patent sky
Fixed version is on the way ( I actually included all the dll's this time 😂 ) 🤞
naive osprey
patent sky
Fixed version is on the way ( I actually included all the dll's this time 😂 ) �...
You mean I gotta run YAAB 30 more times? 
whole cloud
the steam dlls don't make a perf difference
naive osprey
Oh that
knotty wraith
knotty wraith
2.17 MiMalloc +3 FPS! from standard
initially on standard I saw +4 fps, then with 2.1.7 another +3 - in total it's +7 fps!!!
https://imgur.com/452KzxU
p.s. hmm - mimalloc_v217_lock_pages
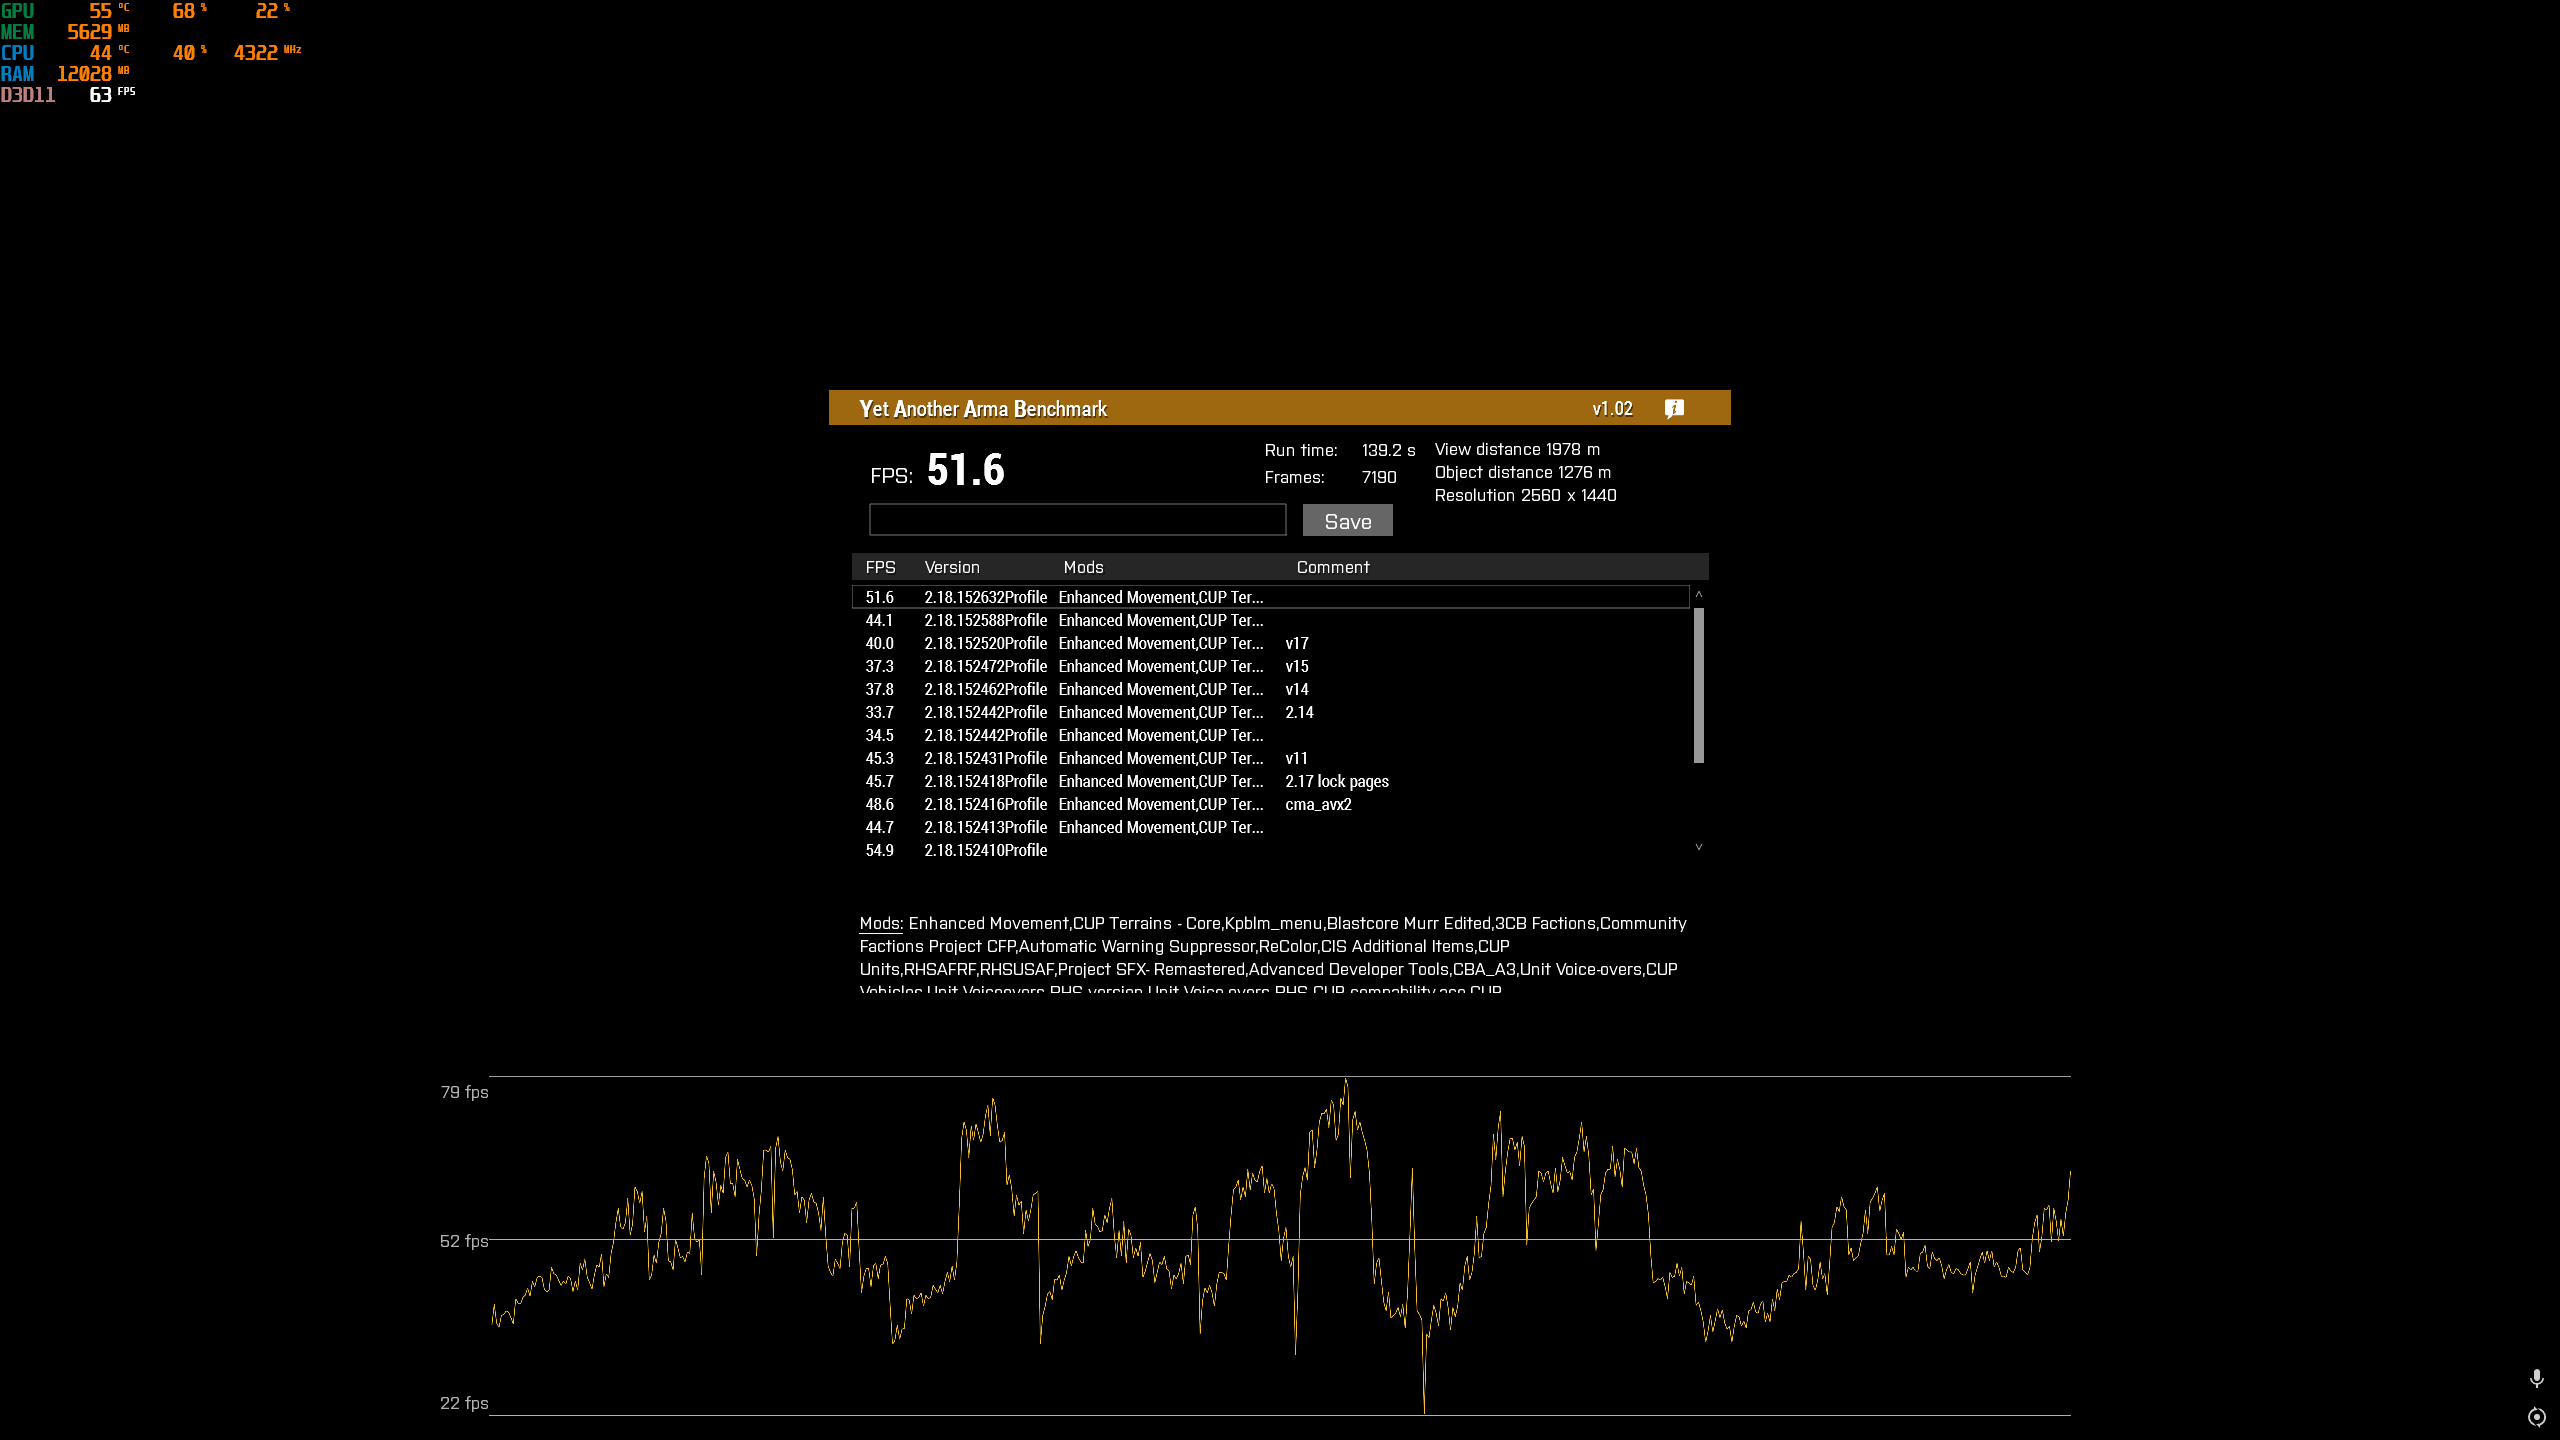 wise sparrow
i7 12700k, 32gb 3600MHz CL16, RTX 3070
Lock pages in memory enabled in Windows
-maxFileCacheSize=8192 -setThreadCharacteristics -hugePages
YAAB Scores:
https://i.imgur.com/KQIhSPc.png
 patent sky
Steam and Google Drive versions are now updated to include all the proper steam libraries
empty goblet
spiral eagle
where may I access this "console", warden fella?
the default engine server's console , also the console log, filename is defined in server.cfg , via logFile =
spiral eagle
aaa ok
vivid rune
Can confirm: YAAB goes slower and slower after every rerun(mimalloc_v217):
1st: 67,6fps
2nd: 63,4fps
3rd: 61,9fps
4th: 59,4fps
(but the animation studder is gone)
Edit: animation studder was there after restart but not so strong as in v20
Additional observation: After the 4th run I was going to a campaign mission. In there the slow rendering persists. Normally when I look into the sky I have 120fps capped. Now it was 85.
whole cloud
whole cloud
I wanted to do the render instancing processing in multithreaded. But I saw that...
Yeah. And there comes the problems with multithreading again.
Render passes are two parts, one is preparing all the render tasks, and second is executing them.
Currently we prepare on main thread, then execute the tasks in parallel and wait for them to finish, and then prepare the next pass.
Technically, it is possible to overlap preparing the next tasks, while previous tasks are executing.
Preparing tasks will "lock" the models that will be rendered, so that they are not unloaded while rendering, and afterwards they are unlocked again.
Not a problem in itself, we can only do that locking in main thread, but that is fine because we are in main thread.
But, this locking, behaves differently if it happens during render execution, and it checks that using one global variable.
So, there is this one global variable, that must be set to false when preparing, and true when executing.
Just looking at the rendering code you cannot see it, because its like 5 levels deep, hidden away.
If we can't prepare and execute at the same time, can we maybe prepare multiple in parallel? No, "locking" models is not safe and can only be done by main thread.
womp womp.
I can still do super mega ugly code, to fake that global variables value, only in main thread, so that only main thread thinks its not currently executing, when in reality it is. Its a whole bunch of fakery, it throws warnings and errors that I can ignore.
It would take quite some time to rewrite it properly and also make sure that mess doesn't actually cause any issues.
But.. It works..
Green is preparing work, pink is waiting for the jobs to be done.
For a whopping 0.1ms improvement 
And with a bunch more work, this could be done to the other green segments too, for maybe another 0.7ms improvement.
From 74fps to 78. Truly world changing right there.


Or.. I could turn back on the thing that caused flickering.
And turn the selecting objects to be rendered from 5ms down to 2.1ms, 74fps to 95fps.
empty goblet
whole cloud
Or.. I could turn back on the thing that caused flickering.
And turn the selecti...
need third option which terminates flickering for good
void badger
Secret fourth option: add more z-fighting at cost of additional 2ms per frame
lilac hearth
So goo so far!
 whole cloud
Yeah. And there comes the problems with multithreading again.
Render passes are ...
whole cloud
whole cloud
Yeah. And there comes the problems with multithreading again.
Render passes are ...
Mh but on second look something is off.
After the change, the preparing took much longer than before 🤔
whole cloud
lilac hearth
So goo so far!
That looks to be performing worse than v20 did though
lilac hearth
whole cloud
That looks to be performing worse than v20 did though
Yes, but I believe it may be an acceptable margin of error
The tests below in v20 were done with mimalloc 217
so 69.7 / 73.8 i think its acceptable
 lilac hearth
 kindred radish
https://imgur.com/a/eJjD5dy
kindred radish
https://imgur.com/a/eJjD5dy
I was curious about the Dev version, I'll test it here!
spiral pond
some reduction with 3 runs. seems mostly high fps getting lower


4th run a bit up again
but 5th and following with a big drop - after that seeminly stable at that level

on another note - possible to put these same named scopes (from a loop?) under a separate scope respectively please (dPr of 2nd has also very low coverage)
- wSimEJs under wSimR
- fmjPost under dPr
- memLo under wDraw
- lodUL under o1Draw


[all these seems to cover a "bigger" timeframe each]
lilac hearth
'
 inland dew
dev is for #dev_rc_branch. not for here
gritty wasp
v20 mialloc vs v21 default I lost 7-10fps.(90s to 80s) But v21 with mimalloc fps lower too. So probably not only allocator issue.
clever roost
were can i get the mimalloc packet into a dll?
clever roost
runic sigil
<https://github.com/GoldJohnKing/mimalloc>
thank you
fickle geyser
[[0,0,0], nil, [0,0,1]] inAreaArrayIndexes [[0,0,0], 1, 1];
I have code that reuses positions in an array/sets deleted elements to nil.
On profiling it started throwing errors. Apparently it does not like nils in the array anymore.
Error position: <inAreaArray [[0,0,0], 1, 1];>
Error 0 elements provided, 3 expected
Seems to be an issue both for inAreaArray and inAreaArrayIndexes. Could this be restored to previous behaviour?
carmine stump
need to revert 21
heavy vortex
@carmine stump You would need to say why.
carmine stump
losing performance over time.
I play at locked 60 for hours
now it went down to 30 after a couple of hours
light cargo
carmine stump
now it went down to 30 after a couple of hours
sure its not adaptative vsync doing a fluke?
 stone patrol
Hey guys, new here. I had just discovered the profiling thing a week ago and was happy with the increased performance. Did something happen between yesterday and today? FPS dropped quite a bit
opal hound
There was a release ~12 hours ago
you can read the messages above yours to see similar feedback
stone patrol
ohhh glad it's not a me thing
First of all thanks to the people working on this, made my Arma experience much better
Second of all, can someone link me to some instructions on how to go to the previous version?
orchid mesa
stone patrol
Second of all, can someone link me to some instructions on how to go to the prev...
Bohemia Interactive Forums
NOTE: 2.18. PROF/PERF up! you dont need a new client on the PERF/PROF server! there is a branch on steam you may use, but beware that sometimes data on Dropbox are newer due to manual build e.g. on weekend: special profiling Steam branch for Arma 3 following this wiki page : https://community.bis...
opal hound
might be slightly more difficult. Usually you just pull the exe from the google drive for whichever version you want (in the pinned messages). For this version you'll need to find dedmen's messages on downgrading steam_api.dll too
orchid mesa
google drive link in that post has all of the previous profiling versions, v20 is the one you want
stone patrol
opal hound
might be slightly more difficult. Usually you just pull the exe from the google ...
I just found a text file in the drive with some simple intructions yeah, thanks
stone patrol
I preferred going back to stock and just waiting it out. I'll give some feedback anyway in case it's of any use:
- CPU: Ryzen 7 5700x3D
- GPU: Intel Arc B580
- Started yesterday and got worse over time, went from 90FPS at KOTH clusterfuck, to 20FPS,
game/pc restarts did not reset performance(not sure, can't remember if that was the feeling caused by performance starting to go down fast after starting a gaming session) .
heavy vortex
Huh. People who measured YAAB falloffs did get a reset from a game restart, right?
stone patrol
heavy vortex
Huh. People who measured YAAB falloffs did get a reset from a game restart, righ...
Made a correction
vivid rune
heavy vortex
Huh. People who measured YAAB falloffs did get a reset from a game restart, righ...
Yes. But in game you can do a YAAB session and then go to a campaign mission and the slow fps persists. Only after restart it starts with higher fps again.
 scenic frigate
tried to drag the exe of v20 into my files now i just get an error code when i try launch
heavy vortex
You have to swap some DLLs too.
scenic frigate
heavy vortex
You have to swap some DLLs too.
where can i see how to do this?
heavy vortex
Probably easiest to switch to stable and then copy the v20 perf exe in. Unless the DLLs changed twice. Haven't really been following.
eternal kraken
this is the old DLL with 292 KB
the new one has 313 KB
you can also get them here: https://drive.google.com/drive/folders/1Fzgwwx4MC82jlsVWFZ8ID1ieYnoZOdL-
the old DLL only works with V20 perf 588 and lower!
scenic frigate
heavy vortex
Probably easiest to switch to stable and then copy the v20 perf exe in. Unless t...
@eternal kraken in the v20 download there 2 profiling exes do i put both in ones client ones server

 scenic frigate
legend ty
whole cloud
spiral pond
on another note - possible to put these same named scopes (from a loop?) under a...
1 yes
2 no
3 no, but we probably could get rid of some of them
4 no
whole cloud
fickle geyser
```sqf
[[0,0,0], nil, [0,0,1]] inAreaArrayIndexes [[0,0,0], 1, 1];
```
I have co...
it'll be same cause as the markers, if you set the isPosWorld (last) parameter to true, it'll work again, but I think you cannot do that on prof
inland dew
all players on our servers report really bad fps and reverting to stable
empty goblet
some players with profiling told me that 1st game theirs FPS is good but after missionEnd and new mission theirs FPS is miserable
server FPS seems fine to not be the issue so it likely is client issue
whole cloud
Yep all the same reports from everywhere.
Fraali sent me a good capture frame, I see roughly where the problem is, sadly not precise enough but I'll fix it today and we'll push v22
whole cloud
I hath spotted the problem. The wind emitter lists, the game would always delete the list, and then recreate them, causing memory free/allocate.
Now it seems the list is endlessly growing 😄
mmh yes

Ah well duh. I made this mistake a looong time ago.
There is a extra counter of how many entries are in that list, and even though I empty the list every frame, I forgot to reset that counter so it thought it has many entries, while it actually does not. And it allocates space to fit that many entries, even though they don't exist 😄
patent sky
Thats a lot of wind
whole cloud
There should always be 97 lists there.
Because I made that mistake, it was always growing.
Previously the optimization only ran if there were exactly 97 lists present, which is what it should always be.
But because I broke it, it was growing beyond that, thus skipped the optimization and again reallocated.
I saw that and just removed the exactly 97 check. So instead of skipping the optimization that unintentionally kept growing it, it now always ran into it.
That also means even first run YAAB results are invalid, this accumulates every frame.
inland dew
so tomorrow, i guess
whole cloud
no couple hours
opal hound
what emits wind?
whole cloud
helicopter blades
opal hound
ooohhhh
stone patrol
Ok that explains why this started to hit me hard when using the Blackfish in KOTH
Thats when I first felt the FPS drop
fickle geyser
whole cloud
it'll be same cause as the markers, if you set the isPosWorld (last) parameter t...
Will the cause be fixed eventually then?
whole cloud
fickle geyser
Will the cause be fixed eventually then?
KK is working on it
 void vine
Finally a real memory leak!
whole cloud
2.18.152635 new PROFILING branch with PERFORMANCE binaries, v22, server and client, windows 64-bit, linux server 64-bit
- Fixed: Performance degradation over time since v21
If you don't want to use the Steam branch, the files are also available for alternative download here:
https://drive.google.com/drive/folders/15p9j7C2nHUt6NoVfChX4YFuqzFXzblJh
Note: There are separate Dll files that also need to be placed into Game folder.
whole cloud
whole cloud
2.18.152635 new PROFILING branch with PERFORMANCE binaries, v22, server and clie...
 knotty magnet
Just a quick dumb question regarding over the time performance degradation which was now fixed, was this happening even on relaunching the game like the continuity of it?
whole cloud
it was getting worse, every frame that was rendered. The more frames the worse
autumn timber
whole cloud
it was getting worse, _every_ frame that was rendered. The more frames the wors...
So the faster the slower it ran 😎
stone patrol
whole cloud
2.18.152635 new PROFILING branch with PERFORMANCE binaries, v22, server and clie...
How can I apply this via steam? Without moving files around, just by restarting game?
And thanks for your work
whole cloud
right click, properties, beta
stone patrol
Cheers
 inner elbow
ahh so that's why. my 9800x3d was getting 120fps ave on yaab, from 180fps+
woven loom
autumn timber
So the faster the slower it ran 😎
the more you buy the more you save
naive osprey
naive osprey
Running YAAB on repeat in comparison to v20
v21 has fewer FPS spikes, however se...
Some more runs in YAAB with v22
Same settings as before.
Not experiencing any major FPS spikes on either malloc, where was getting significant spikes semi-often in v20.
FPS no longer degrades, and is roughly the same as v20.
Initial memory usage seems to be lower, though the ~70MB spike from third to 4th run with tbb4 is interesting.
v22 - MiMalloc
Mem        4740    4841    4873   4894  4914  4942
Avg FPS    67.1    67.1    66.0   68.0  67.2  66.9
Min FPS    32      46      43     46    45    42


v22 - Default (tbb4)
Mem        5012    5037   5065   5138   5135   5142
Avg FPS    65.9    66.1   67.1   66.4   64.5   65.2
Min FPS    33      40     46     43     42     44
Adding mimalloc is roughtly 1-2fps more than default.
How much difference did it make back in v20? I'd hope it was more than just 2fps?
inner elbow
can confirm. v22 im getting 180+fps on yaab now 1080p 9800x3d
20 mins ago i got 150fps
i know i need to run at least 3 times
 knotty wraith
very strange - I ran yaab 4 times and every other time it gave me a big difference
56.1, 51.8, 55, 51.6
https://imgur.com/zxBQxGQ
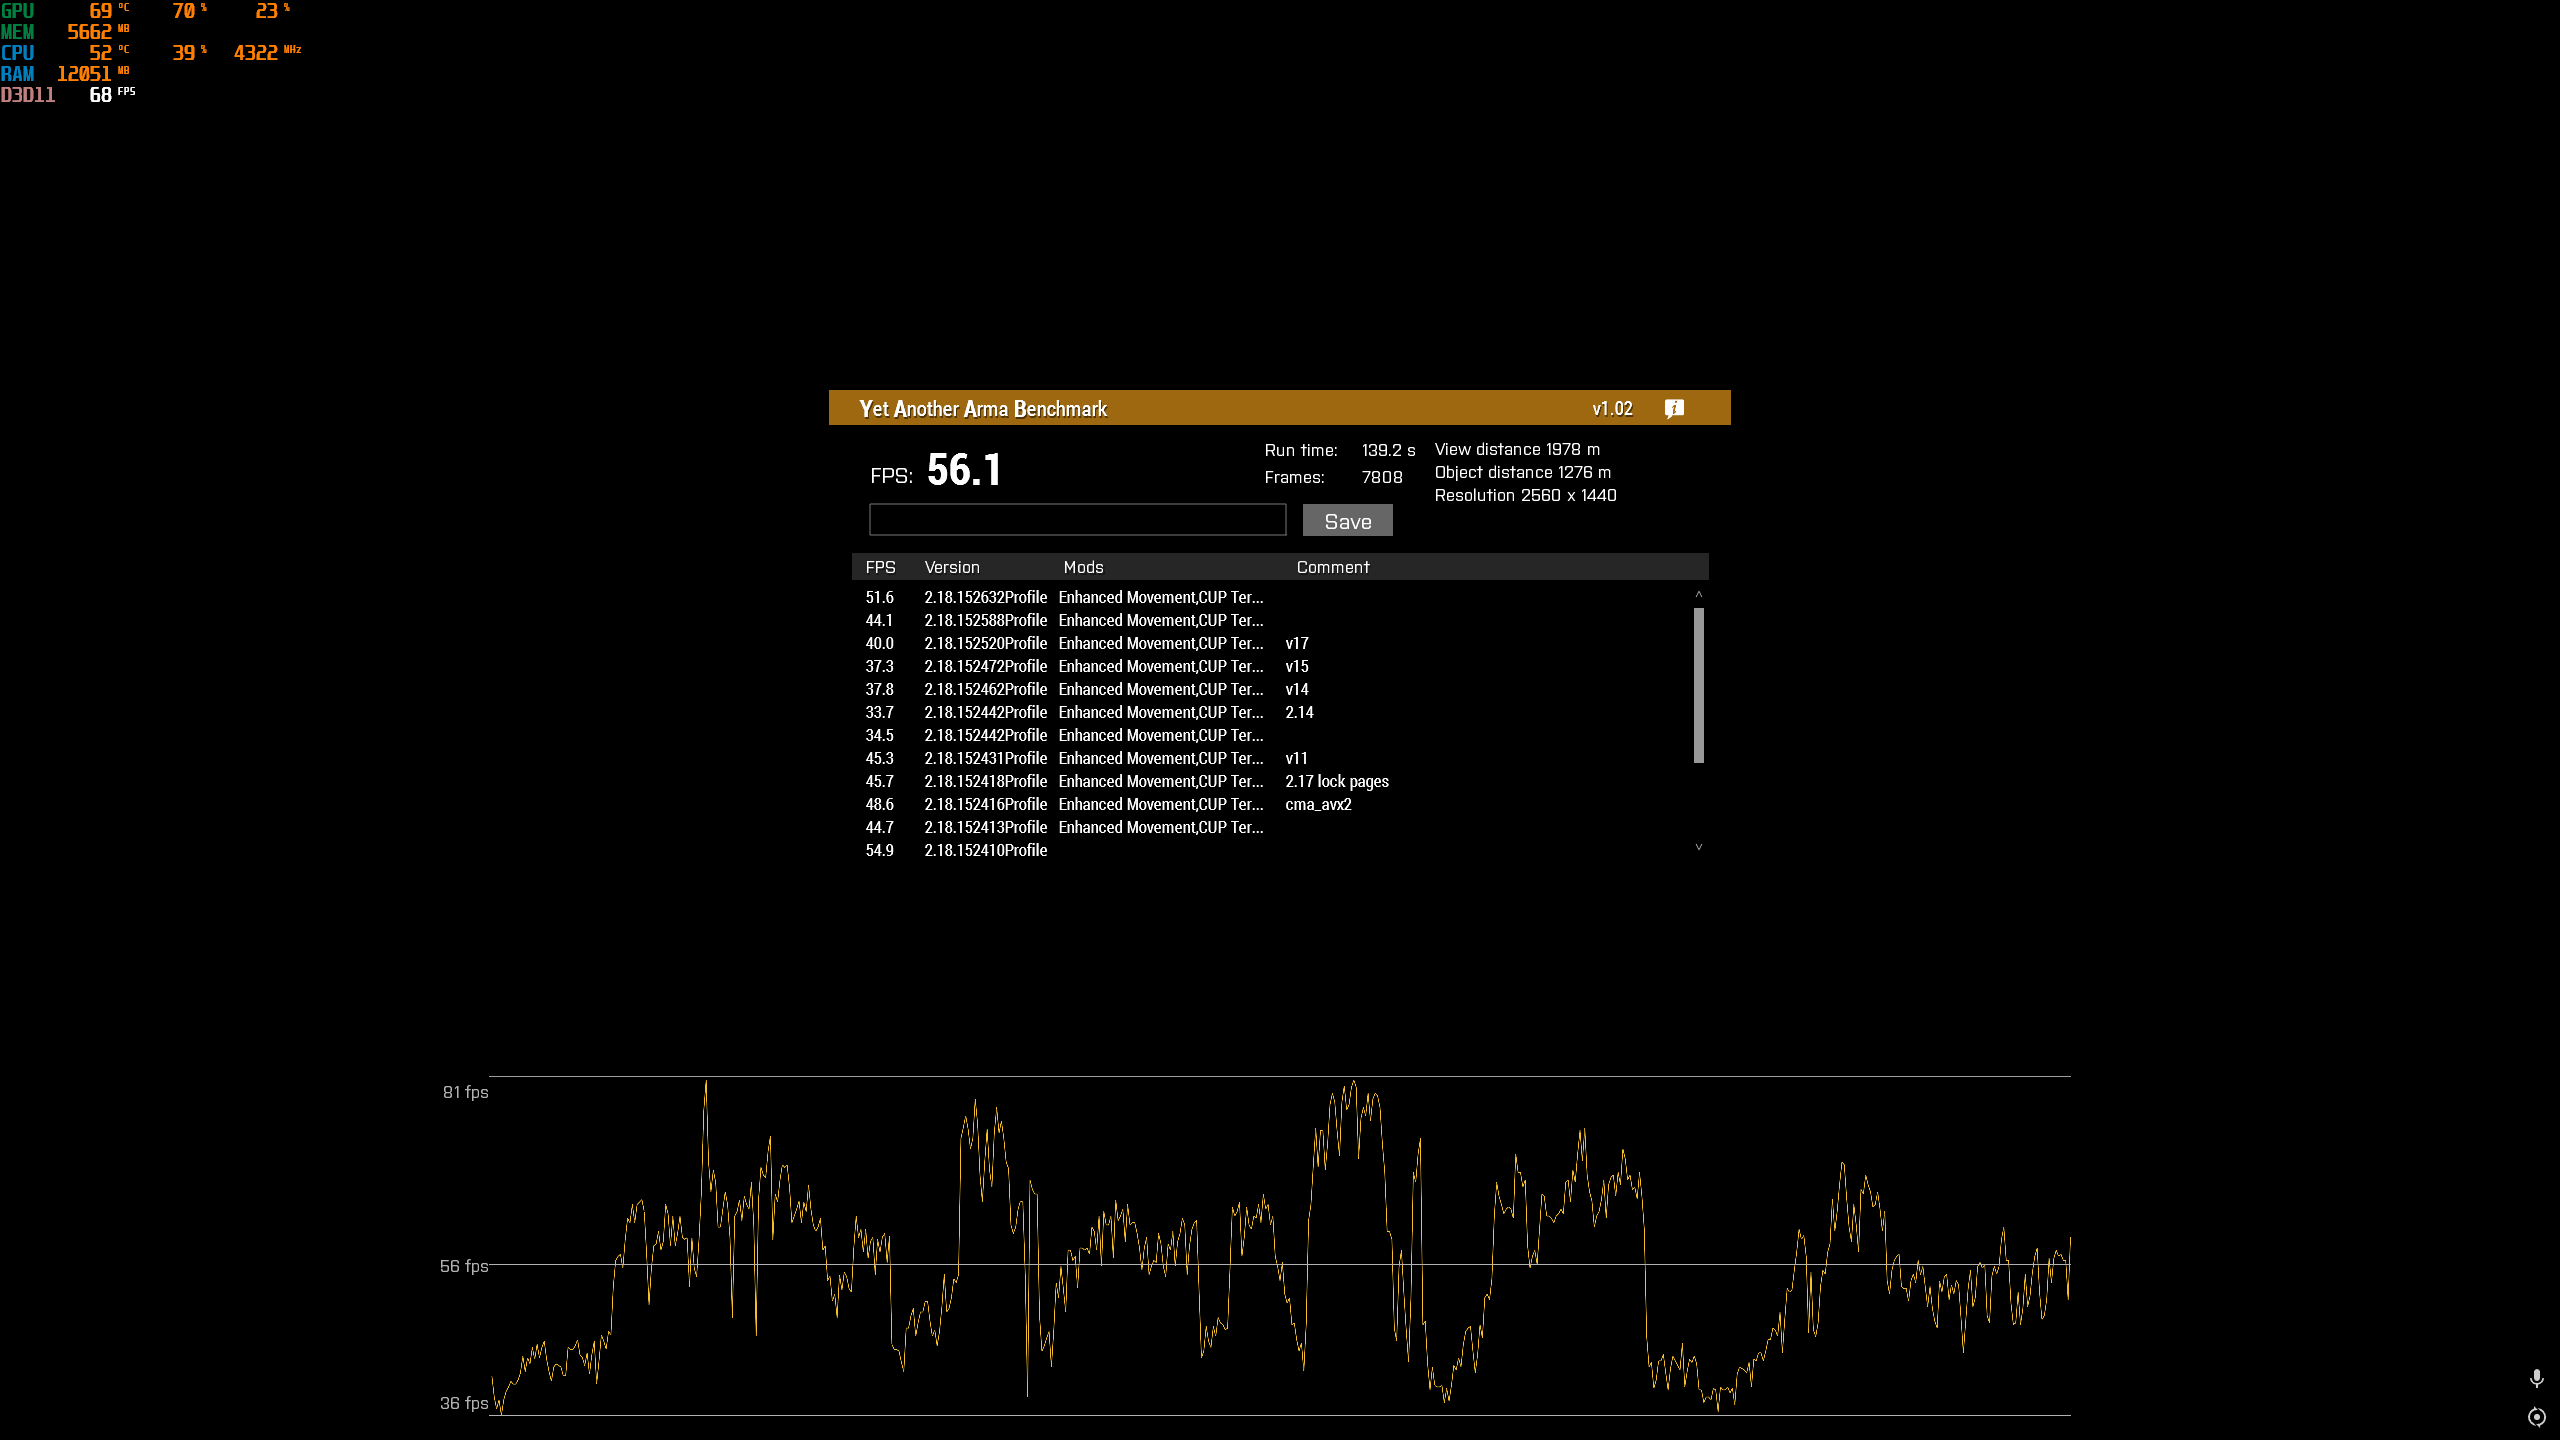 naive osprey
whole cloud
Adding mimalloc is roughtly 1-2fps more than default.
How much difference did it...
naive osprey
whole cloud
Adding mimalloc is roughtly 1-2fps more than default.
How much difference did it...
I could run standard settings to get higher FPS and test that way if you'd like, but was only a ~2 FPS diff on both v20 and v22 at the settings I have
whole cloud
No need, thanks
inner elbow
3 runs, including the 1st run ~189fps 9800x3d 1080p standard v214lockpages

v22 is good, thank you
whole cloud
There is something wrong with rendering in v22, but I didn't notice in all my testing yesterday and today so its probably fine 😄
Just spamming errors internally. It seems in retail the performance is not affected by it, no visual artifacts, no crashing 🤷
woven loom
I ran 3 runs and i got 106.8, 108.9, 105.6 with mimalloc 217 and the ultra preset
Compared to more or less similar 108 with v20
Does look smoother, although i haven't checked frame times or memory usage.
knotty wraith
I went through all the mallocs I have
gives the best fps 2.17 lock_pages
stability is of course dancing - but the highest fps is behind it

 whole cloud
There is something wrong with rendering in v22, but I didn't notice in all my te...
whole cloud
whole cloud
There is something wrong with rendering in v22, but I didn't notice in all my te...
Found it, the game is still rendering even when it shouldn't, for example behind loading screen
tawdry gazelle
tested mimalloc v219 (not published yet) against default on v22: 75fps vs 70fps, still +5% fps 😂
tawdry gazelle
tawdry gazelle
tested mimalloc v219 (not published yet) against default on v22: 75fps vs 70fps,...
a lot better than previous +15% fps. Great work!
knotty wraith
tawdry gazelle
tested mimalloc v219 (not published yet) against default on v22: 75fps vs 70fps,...
so for me 2.17 gives +12 fps v20 and v22
https://imgur.com/zxBQxGQ
tawdry gazelle
knotty wraith
so for me 2.17 gives +12 fps v20 and v22
https://imgur.com/zxBQxGQ
on perf v22?
knotty wraith
tawdry gazelle
on perf v22?
prof v22
2.17 lock_pages
I remind you ☝️
tawdry gazelle
mimalloc for Arma 3 v219 has released: https://github.com/GoldJohnKing/mimalloc/releases/tag/Arma-3-v2.1.9-20250212

GitHub
Changelog
Merge upstream changes v2.1.9, see https://github.com/microsoft/mimalloc#releases for details.
Update Intel® oneAPI DPC++/C++ Compiler to 2025.0.4.21.
Description
This is a port of Micr...
vagrant zodiac
ETA on battleye approval?
empty goblet
tawdry gazelle
mimalloc for Arma 3 v219 has released: https://github.com/GoldJohnKing/mimalloc/...
i can confirm this works, already tested before GJK released
q, related to profiling i noticed tons of spammy hundreds / second sometimes dozens per milisecond , in server RPT```
2025/02/12, 14:58:27 B_Heli_Light_01_dynamicLoadout_F: hidepg_8 - unknown animation source revolving (defined in AnimationSources::Missiles_revolving)
2025/02/12, 14:58:27 ➥ Context: [] L17 (mpmissions__cur_mp.Altis\core\server\fn_handleClientRequest.sqf)
2025/02/12, 15:40:09 I_E_Offroad_01_comms_F: antenna_2_3_damper_y - unknown animation source damper (defined in AnimationSources::Wheel_2_1_damper)
2025/02/12, 15:40:09 ➥ Context: [] L17 (mpmissions__cur_mp.Altis\core\server\fn_handleClientRequest.sqf)
...
2025/02/12, 15:00:20 B_static_AT_F: turret_shake_aside - unknown animation source reload (defined in AnimationSources::ReloadAnim)
2025/02/12, 15:00:20 ➥ Context: [] L17 (mpmissions__cur_mp.Altis\core\server\fn_handleClientRequest.sqf)
that's with default A3 content ... i assume this is related to profiling binary / -debug and thus no way to solve w/o removing that parameter?2.19 - Unfortunately, on my hardware the result is bad
 mint sun
setup 13700k , 3080,mem 64gb ddr5 5600mhz.
while using heavily modded (about 100gb of different mods) client mimalloc add about 20fps more then default in YAAB. So extreme settings ,2k res and 3500 view and object distance:
default - 65fps
mimalloc - 87fps
real world performance is next:
default interactive fallujah 100vs120 players same settings - 72fps
mimalloc interactive fallujah 100vs120 players same settings - 99-110fps
 full nova
autumn timber
So the faster the slower it ran 😎
full nova
autumn timber
So the faster the slower it ran 😎
welp VSync time
eternal kraken
with mimalloc v214_lock_pages i still get the best performance

Dedmens optimizations + mimalloc v214_lock_pages is my way to go
knotty wraith
eternal kraken
Dedmens optimizations + mimalloc v214_lock_pages is my way to go
It's trivial, but the components of your hardware are probably important
as well as ours...
eternal kraken
click on my name and see my discord bio
I7-7700K 4c/8t @4,6Ghz
48GB DDR4 RAM @3200 Mhz
RTX 3060TI 8GB
whole cloud
tawdry gazelle
a lot better than previous +15% fps. Great work! <:Ded:876261046518706176>
That is the info I wanted to hear 🫂
whole cloud
empty goblet
q, related to profiling i noticed tons of spammy hundreds / second sometimes doz...
Well yeah hidepg_8 is not a thing. If we have bugs in vanilla stuff, then that's how it is... But why did no-one notice that before.. And why has no-one else posted about it.
whole cloud
knotty wraith
It's trivial, but the components of your hardware are probably important
as well...
not for this channel 😄 I only care about relative comparisons, on same hardware. Not what hardware it is
empty goblet
whole cloud
Well yeah `hidepg_8` is not a thing. If we have bugs in vanilla stuff, then that...
seems like only me runs profiling binary server + -debug with lot of players with vanilla stuff and  while trying read server RPT
whole cloud
Well the logging also shows the error is caused by a script in the mission
Script might very well be running animation stuff and passing wrong parameters
empty goblet
whole cloud
Script might very well be running animation stuff and passing wrong parameters
right, it could be that ...
whole cloud
that log message is not new, the game side didn't change 🤷
empty goblet
whole cloud
that log message is not new, the game side didn't change 🤷
ye, i guess it's script related error, i will investigate with authors
on other hand the 2.18.150635, i noticed that in very specific case (128 AI fighting each other on server) server FPS ceased to have endless downward spiral (i unfortunately can't tell at which build that started to happen), so now the FPS seems to keep steady and not fall like before (after some hours went below 20, now it seems hold on 40+ after 2h)
wise sparrow
PhysMem: 32 GiB, VirtMem : 131072 GiB, AvailPhys : 23 GiB, AvailVirt : 131068 GiB, AvailPage : 25 GiB, PageSize : 4.0 KiB/2.0 MiB/HasLockMemory, CPUCount : 12
-maxFileCacheSize=8192 -setThreadCharacteristics -hugePages
HW:
i7 12700k, 32gb 3600MHz CL16, RTX 3070, installed on nvme ssd, lock pages enabled in Windows
patent sky
post image directly, not the imgur link
wise sparrow
uhh, i can't for some reason even tho I have verified
empty goblet
wise sparrow
uhh, i can't for some reason even tho I have verified
you need also acknowledge rules in #rules
wise sparrow
wise sparrow
`PhysMem: 32 GiB, VirtMem : 131072 GiB, AvailPhys : 23 GiB, AvailVirt : 131068 G...

 empty goblet
embeded links are extra behind another layer of verify
empty goblet
eternal kraken
with mimalloc v214_lock_pages i still get the best performance
it's quite interesting that those with lot of memory/fast memory still get way better result from the extra allocated locked memory
inland dew
so no need to disable any optimizations anymore, like ai?
or continue to use v5 as last good stable perm
whole cloud
inland dew
so no need to disable any optimizations anymore, like ai?
Well I expect it to be ok now.
inland dew
anybody here successfully using perf build higher than v5, on a pve server and not disabling any optimizations?
whole cloud
I do
knotty wraith
don't tell him - let him sit and wait
 vale shoal
inland dew
anybody here successfully using perf build higher than v5, _on a pve server_ and...
vale shoal
inland dew
anybody here successfully using perf build higher than v5, _on a pve server_ and...
yep, me
inland dew
whole cloud
Found it, the game is still rendering even when it shouldn't, for example behind...
so v23 tomorrow?
heavy vortex
wise sparrow
`PhysMem: 32 GiB, VirtMem : 131072 GiB, AvailPhys : 23 GiB, AvailVirt : 131068 G...
You might wanna try keeping that off the e-cores, so -cpuCount=8
wise sparrow
Huh, never thought of that, gotta try that out
Just been letting Arma auto-detect and only do the start params and malloc
 rain moth
So the Linux anim bug is finally fixed??
inland dew
apparently
 tacit frost
Today I noticed a couple of serious problems. Tested for over 3 hours.
Last time I tested on Sunday (over 7 hours in the same scenario), then everything worked perfectly.
- Regularly, every few minutes, FPS drops almost to zero or the game freezes completely for a few seconds, less often for 15 seconds. Most often this occurred after switching to another character, but not always.
- From time to time, a number of effects disappear, such as tracers and explosions.
spiral pond
The perf exe dumps memory data to rpt when you capture a frame. Would it be possible and meaningful to:
a) do this also on low/0 fps/mini freezes?
b) expose this as a cheat?
heavy vortex
I dunno, there are a lot of reasons for temporary low fps.
Most of them not having much to do with the game.
wise sparrow
heavy vortex
You might wanna try keeping that off the e-cores, so `-cpuCount=8`
saw a slight fps increase in 3 runs of yaab 👍
empty goblet
tacit frost
Today I noticed a couple of serious problems. Tested for over 3 hours.
Last time...
on 2.18.152635 ? make sure you got today's version
tacit frost
empty goblet
on 2.18.152635 ? make sure you got today's version
Yes, that's right. Tested after today's updates.
On Sunday, there were no above-mentioned problems.
naive osprey
empty goblet
q, related to profiling i noticed tons of spammy hundreds / second sometimes doz...
I do know this will happen when you createSimpleObject some vehicles, Like the Xi`an. Seemingly only happens on initialization of the model.
Can replicate in editor with. Unsure if it happens on stable.
createSimpleObject["O_T_VTOL_02_infantry_F", getPosWorld player]
We are talking about extremely low FPS like 0-4...
In the video I only showed the bug with effects, there FPS is normal.
 thin wyvern
tawdry gazelle
mimalloc for Arma 3 v219 has released: https://github.com/GoldJohnKing/mimalloc/...
thin wyvern
tawdry gazelle
mimalloc for Arma 3 v219 has released: https://github.com/GoldJohnKing/mimalloc/...
This version don't work. Every time when I use this version A3 switch to default tbb4malloc_bi_x64.dll. Look in your .rtp file.
naive osprey
thin wyvern
This version don't work. Every time when I use this version A3 switch to default...
Battleye is blocking it currently
https://i.imgur.com/EV9hHST.png


 thin wyvern
I run A3 w/o BE
naive osprey
Oh interesting
empty goblet
thin wyvern
This version don't work. Every time when I use this version A3 switch to default...
o.O you right, i can see that
cloud nacelle
thin wyvern
This version don't work. Every time when I use this version A3 switch to default...
Just checked and this is indeed true.
Logs:
"E:\SteamLibrary\steamapps\common\Arma 3\Arma3_x64.exe" -skipIntro -noSplash -malloc=mimalloc_v219 ...
Allocator: E:\SteamLibrary\steamapps\common\Arma 3\Dll\tbb4malloc_bi_x64.dll [2017.0.0.0] [2017.0.0.0]
empty goblet
it's not loading even on server
restive pilot
spiral pond
The perf exe dumps memory data to rpt when you capture a frame. Would it be poss...
The game does make freeze dumps tho
Tho it's only for relatively long freezes (> 1s iirc) not mini freeze
knotty wraith
naive osprey
Battleye is blocking it currently
https://i.imgur.com/EV9hHST.png
of course it was just released - have you tried disabling the battleye?)
naive osprey
knotty wraith
of course it was just released - have you tried disabling the battleye?)
I'm aware that it wouldn't work with battleye, not too concerned about running it currently
knotty wraith
naive osprey
I'm aware that it wouldn't work with battleye, not too concerned about running i...
ok, what are the claims then?
cloud nacelle
knotty wraith
ok, what are the claims then?
mimalloc_v219 does not work even with battleye disabled
knotty wraith
cloud nacelle
mimalloc_v219 does not work even with battleye disabled
How did you understand this?
cloud nacelle
knotty wraith
How did you understand this?
Look in the rpt file
thin wyvern
John King's 206,214,217 and 219 vs tbb4
 knotty wraith
cloud nacelle
Look in the rpt file
knotty wraith
cloud nacelle
Look in the rpt file
what exactly should I watch - please clarify
thin wyvern
knotty wraith
what exactly should I watch - please clarify
Allocator: C:\Igre\steamapps\common\Arma 3\Dll\tbb4malloc_bi_x64.dll [2017.0.0.0] [2017.0.0.0]
knotty wraith
thin wyvern
> Allocator: C:\Igre\steamapps\common\Arma 3\Dll\tbb4malloc_bi_x64.dll [2017.0.0...
cool, that's right - that's why I have 2.19 results by default
 silk summit
thin wyvern
John King's 206,214,217 and ~~219~~ vs tbb4
silk summit
thin wyvern
John King's 206,214,217 and ~~219~~ vs tbb4
So 217 is the best?
knotty wraith
silk summit
So 217 is the best?
Personally I have 2.17 lock_pages
thin wyvern
silk summit
So 217 is the best?
214 better min
tacit frost
spiral pond
The perf exe dumps memory data to rpt when you capture a frame. Would it be poss...
Here is a bug with FPS drop:
"expose this as a cheat?" - what do you mean?
opal hound
There are certain "cheats" (named after cheat codes that you can type in to activate certain things
Like FLUSH and SUPERFLUSH
tacit frost
opal hound
There are certain "cheats" (named after cheat codes that you can type in to acti...
Ah, okay. No, I didn't use cheats.
opal hound
They are not accusing you of cheating
They want to add the ability dump memory data to RPT as a cheat code/key combo
light cargo
restive pilot
Tho it's only for relatively long freezes (> 1s iirc) not mini freeze
this is why i have to use -nofreezecheck, avoids freezing for longer because of the minidump writing
light cargo
opal hound
Like FLUSH and SUPERFLUSH
i keep forgetting those exist
gritty wasp
tawdry gazelle
mimalloc for Arma 3 v219 has released: https://github.com/GoldJohnKing/mimalloc/...
For me the worst result.
214 lock pages - 106 fps
217 2025       - 108 fps
219            - 101 fps
TBB4           - 103 fps
Also noticed that in HWiNFO monitor Virtual Memory Load goes from 50% to 78-80% for all versions except 214. It goes 90%+
inland dew
gritty wasp
For me the worst result.
```
214 lock pages - 106 fps
217 2025 - 108 fps
2...
what ram capacity in gb, 16?
tacit frost
opal hound
They are not accusing you of cheating
I realized that it wasn't about cheats in the classical sense of the word. But I didn't understand what he asked me about.
Now I understand, thanks.
It's just... I don't speak English at all, and Google translate doesn't always do a good job. And sometimes it just turns out to be a meaningless set of words.
inland dew
people that have 16 gb ram or less, it's normal that fps isn't that good with mimalloc lock pages
woven loom
Yeah probably don't use lock pages with 16GB or less
gritty wasp
inland dew
what ram capacity in gb, 16?
-
- Also this is not sterile OS. Discord, Steam, probably microsoft spyware etc.
- virtual memory not equal to real. Real was quite empty
woven loom
Also i thought GJK stopped releasing lock_pages versions of mimalloc in the last few versions 🤔 I've just been using the regular one
opal hound
I think lock_pages was removed entirely because it had no real performance benefit?
Nope I was wrong, it's just unnecessary #perf_prof_branch message
inland dew
anyway, if 16 gb ram or less, one shouldn't use mimalloc lock pages, on client
as simple as that
thin wyvern
gritty wasp
For me the worst result.
```
214 lock pages - 106 fps
217 2025 - 108 fps
2...
219 don't work atm. When you try to use 219 you run tbb4 instead #perf_prof_branch message
 magic elm
Have the same issue with 219, no Battleye
thin wyvern
woven loom
Also i thought GJK stopped releasing lock_pages versions of mimalloc in the last...
You use lock-pages because that is default behavior Large Pages are always locked in physical memory, according to Large-Page Support from Microsoft. So, forget about lock-pages variants provided in previous releases, as it is always the default behavior.
woven loom
thin wyvern
You use lock-pages because that is default behavior ```Large Pages are always lo...
yeah, i am aware, i was just curious to see some here report using the lock pages version even with 217
thin wyvern
woven loom
yeah, i am aware, i was just curious to see some here report using the lock page...
Maybe because v217 have 2 version.
One from 2024 and sec from 2025
woven loom
ahhh okay i'm using the 2025 version
 oblique hearth
I'm hosting a local server for me and my friends and play co10_escape. After 2-3 hours the performance massively degrades sometimes. And from what i understood it is because of AI bottleneck (not 100% sure). Now i run the performance branch and have some questions: When i host a server ingame (not dedicated), is the AI already multithreaded? And are headless clients worth an idea, or is it pointless with already existing multithreading? Oh yea and i also saw that ACE has a headless option, but idk the exact purpose of that module, could it also be a relevant tool?
heavy vortex
Hmm. Not seen degradation with CO10 Escape.
Usually it cleans up after itself pretty well. AIs only exist near the player(s).
Maybe drop a zeus in and see what's happening.
oblique hearth
heavy vortex
Usually it cleans up after itself pretty well. AIs only exist near the player(s)...
I dont know if it is coincidence, but usually happens after nightfall on the 1:4 scale. Maps i remember were Livonia and Fallujah 2.0. Its really hard to know whats causing it.
oblique hearth
But it runs fine at the beginning, so it shouldnt be the map, or?
heavy vortex
I dunno, kinda depends where you are.
oblique hearth
Can i profile the usage somehow? E.g. get a stacktrace or something to know what eats performance when it occurs...
heavy vortex
Yeah. I should probably go back and try it, but Livonia has always been awful in every game mode and I doubt anyone's going to fix it.
oblique hearth
heavy vortex
Yeah. I should probably go back and try it, but Livonia has always been awful in...
But its a beautiful map with many buildings that make escape fun. :/
heavy vortex
If you do want a crack at profiling then https://community.bistudio.com/wiki/Performance_Profiling
oblique hearth
heavy vortex
If you do want a crack at profiling then https://community.bistudio.com/wiki/Per...
Thanks, thats super convenient that the branch provides frame capture
orchid mesa
certain particle effects appear to be bugged on v22, using the rhs mod i can't see the explosion effect of anti-tank missiles hitting their target
also when vehicles are destroyed, there is no smoke/explosions
orchid mesa
...and they spontaneously started rendering for me, particle effects are back
inner elbow
inner elbow
3 runs, including the 1st run ~189fps 9800x3d 1080p standard v214lockpages
upgraded to g.skill 6000 CL30 64gb kit, will yaab soon if i get 200fps ave

in v22
eternal kraken
post pics of YAAB and not of CPU-Z and state what you might will get, thats only spam
inner elbow
eternal kraken
post pics of YAAB and not of CPU-Z and state what you might will get, thats only...
wdym. i posted it on previous messages
eternal kraken
inner elbow
wdym. i posted it on previous messages
you post screens of your new DDR that has nothing to do with your last yaab screen, thats what i mean
inner elbow
okay
tawdry gazelle
cloud nacelle
mimalloc_v219 does not work even with battleye disabled
That's strange, the dll on github works fine on my machine...
Okay, I found the issue...
spiral eagle
<PreprocessorDefinitions>...MI_SHARED_LIB;MI_SHARED_LIB_EXPORT...</PreprocessorDefinitions>;
mayhaps?
would be nice if you could report back if thats not the issue, could use the details myself too 👀
tawdry gazelle
The issue that mimalloc_v219 wont load and falls back to default tbbmalloc has been fixed, please try this one:
https://github.com/GoldJohnKing/mimalloc/releases/tag/Arma-3-v2.1.9-20250213
Sorry for the inconvenience. 🥹
@empty goblet @naive osprey @cloud nacelle @magic elm @thin wyvern

GitHub
Changelog
Fix: Previously released version Arma-3-v2.1.9-20250212 won't load and always falls back to default tbbmalloc.
Description
This is a port of Microsoft's mimalloc memory allocato...
eternal kraken
now the dll is in use, thats great, thank you GJK. i need to do more runs to get more results but so far its good
 whole cloud
spiral pond
The perf exe dumps memory data to rpt when you capture a frame. Would it be poss...
whole cloud
spiral pond
The perf exe dumps memory data to rpt when you capture a frame. Would it be poss...
a) no. Memory != freeze. Freeze is cpu not ram.
b) already is, frame/sframe cheats. I think superflush does too
whole cloud
tacit frost
We are talking about extremely low FPS like 0-4...
In the video I only showed th...
For low fps I'd need a captureSlowFrame from profiling binary.
Its interesting to know that you have problems, but one person with mods having fps issues is not much of an indicator. And you showing the lags only happening when a script switches you into another body, makes me think the script is more involved
whole cloud
oblique hearth
I'm hosting a local server for me and my friends and play co10_escape. After 2-3...
AI itself is not multithreaded.
You can run the profiling binary (That is not the default on the branch, you need to switch to other exe), and find out yourself what is causing the lags.
spiral eagle
yay, managed to compile mimalloc v3
for some reason its size is a third of 219
i cant link anything 💔
but fps diff is -10% now lmao
1.7 million faults 😭
eternal kraken
eternal kraken
now the dll is in use, thats great, thank you GJK. i need to do more runs to get...
made another 2 runs, new mimalloc of GJK performs great for me. Again thank you GJK and thank you Dedmen for all your optimizations
 spiral eagle
mimalloc 2.1.9 seems to be inherently worse? https://github.com/microsoft/mimalloc/issues/983