#perf_prof_branch
1 messages · Page 12 of 1
 chilly geyser
 fast hornet
only use the 8 cores/16 threads with the x3d cache on 7950X3D
(but if you're running the client on Win10/Win11 the AMD driver should do that automatically. But for the server you'll have to set the affinity manually)
 dire wave
fast hornet
only use the 8 cores/16 threads with the x3d cache on 7950X3D
dire wave
fast hornet
only use the 8 cores/16 threads with the x3d cache on 7950X3D
i think 7950x3d has 16 cores 32 threads
fast hornet
yes, but only one CCD has the X3D cache, the second doesn't
chilly geyser
dire wave
i think 7950x3d has 16 cores 32 threads
But only 8 cores has x3d cache
 empty goblet
just make sure you got the recent updated chipset drivers and also board AGESA (UEFI) that fixed lot of the latency and core/thread distribution issues
 thin wyvern
Do we still need -setThreadCharacteristics?
 whole cloud
its still a thing
thin wyvern
thx
 heavy vortex
Does it set specifically for the main thread or for all of them?
matters more now than it used to :P
whole cloud
Is anyone here running profiling branch in Proton, with BattlEye?
 willow vault
dedmen, PM's? Got a freeze on YAAB.
whole cloud
crash and freeze dumps into my dms anytime
 eternal kraken
nice to hear that many of you get better performance, but for me or my testscenario i loose fps 😦
Arma 3 v.218.152368 Profile CPU Test min_fps 7 -> https://www.youtube.com/watch?v=5eXHe1pir88
Arma 3 v.218.152368 Stable CPU Test min_fps 6 -> https://www.youtube.com/watch?v=s415dqRDQcU
Arma 3 v.218.152302 Stable CPU Test min_fps 19 -> https://www.youtube.com/watch?v=gj0KMsoGAWg
Testmission -> http://moerderhoschi.bplaced.net/public/tools/arma3/CPU_TEST_MISSION/
whole cloud
😮 bplaced still exists? 😄
willow vault
whole cloud
Things always go wrong. Tomorrow then
chilly geyser
fast hornet
only use the 8 cores/16 threads with the x3d cache on 7950X3D
In yaab with v8 and cpuCount = 8 i have 118.4 fps, but when cpuCount=12 fps is 121
fast hornet
16 would be the correct amount, since the 8 cores have 16 threads (only that more than 12 crashes v8)
chilly geyser
cpuCount=12 and HT works fine
whole cloud
if you set -cpuCount, then -enableHT is ignored
fast hornet
oh and if you want to set the affinity manually you can use something like this in powershell. The values are the correct ones for the 7950X3D.. first 16 threads.
Get-Process "arma3_x64" | ForEach-Object {
    If (($_.ProcessorAffinity) -ne 65535) {
        $_.ProcessorAffinity = 65535
    }
}
 spiral pond
mpMessageDetailsServer-2024-11-04_17-41-46.txt remains essentially empty for me sadly 😭
Server values
time = 3717.173
like it should also add stuff in LAN with DS to it, right?
whole cloud
if it has one player then yea
spiral pond
Q:53867
Q:44439
for JIP queue with just one player and no inventory actions is high, isnt it?
whole cloud
yes
spiral pond
nice to have class name added after entity names now - may help narrow down some things
ThingX 1af84018b80# 725737: dummyweapon.p3d WeaponHolderSimulated was falling under terrain! Position corrected to ground [4529.36, 230.98, 2409.19]. Disable simulation to keep object under terrain.
Ref to nonnetwork object 893210: <no shape> #particlesource
Ref to nonnetwork object 1af770e6080# 716439: dummyweapon.p3d Item_U_SPE_US_HBT44_FrogSkin_Jungle
Ref to nonnetwork object 747758: spe_shell.p3d SPE_76mm_M1_M42_HE
samples
 gusty viper
Can confirm, removing -enableHT fixes mission load crash
And holy shit the frames, so nice! Miracle worker @whole cloud keep it the great work!
Is recommended to run without -cpuCount as well now?
chilly geyser
fast hornet
oh and if you want to set the affinity manually you can use something like this ...
cpuCount=8 and this tweak gives 123fps, lol
It is very strange, because chipset driver is newest and win11 have last updates
 opal hound
Why do you use the cpuCount parameter?
 vivid rune
Friend with 3060 and 3600 had 19% gain over vanilla.
chilly geyser
@opal houndBecause in v8 if u have more than 12 cores game just crash
dire wave
fast hornet
oh and if you want to set the affinity manually you can use something like this ...
Can i also use this? Im on 5800x3d
 sick arrow
Kinda stupid question. If cpuCount isnt set will game use max cores. I have no idea how many cores my processor has and there is no consensus on that.
fast hornet
dire wave
Can i also use this? Im on 5800x3d
No need, the 5800x3d only has 8 cores/16 threads and all of them have the x3d cache. It's only for CPUs that have one CCD with the extra cache and one without. (Or e.g. to avoid e-cores on intel CPUs)
vivid rune
1080Ti and intel 4960X: 29% gain over vanilla
empty goblet
something weird , tried run redux and it kept ending misison and restarting server within minutes
spiral pond
inArea script errors in server rpt?
vivid rune
6750XT 12600K: +15% gain over vanilla
 feral harness
spiral pond
inArea script errors in server rpt?
feral harness
spiral pond
inArea script errors in server rpt?
you're asking or you're telling?
 indigo anvil
empty goblet
something weird , tried run redux and it kept ending misison and restarting serv...
indigo anvil
empty goblet
something weird , tried run redux and it kept ending misison and restarting serv...
Running it locally just fine apart from the inAreaArray issues
 marble mason
1080 and 5950X only +4% over stable, idk what im doing wrong lol 85.5 > 89.2
vivid rune
90fps in YAAB? Wow. I have 70 with a better GPU.
You are probably in a GPU bottleneck. There is no more uplift to achieve. My buddy has with the old 6core CPU and the 1080TI something in the 30 fps.
He has a CPU bottleneck.
And you probably don't use the standard settings of YAAB.
indigo anvil
Interesting: https://community.bistudio.com/wiki/customWaypointPosition seems to be invisible. beforehand it was visible.
Got a bunch of " Accessing static object outside landscape (1024,820 out of 1024,1024 - 1024,1024)" spammed in the log.
 analog acorn
indigo anvil
Interesting: https://community.bistudio.com/wiki/customWaypointPosition seems to...
analog acorn
indigo anvil
Interesting: https://community.bistudio.com/wiki/customWaypointPosition seems to...
Custom waypoint visibility is (should be) affected by the waypoint visibility difficulty setting, so might be worth checking whether that setting's been changed for you
indigo anvil
analog acorn
Custom waypoint visibility is (should be) affected by the waypoint visibility di...
thank you, will do!
 void vine
anecdotally I am noticing a significant improvement in ai decision making on my >150 count reference mission
They seem much more attentive on v8 than the stable version
Mechanised infantry immediately run for cover after disembarking after an ambush, attack helicopters are flying at higher altitudes, static MGs notice attacks to their flanks etc.
 naive osprey
empty goblet
something weird , tried run redux and it kept ending misison and restarting serv...
naive osprey
empty goblet
something weird , tried run redux and it kept ending misison and restarting serv...
Can confirm strange restart behavior - Ran server for 30 minutes or so, was running great at 56 FPS, 100 people, then just.... restarted out of nowhere? Reverted to stable for now. No crash logs unfortunately
 solar root
v8 breaks overhead icons in KotH (not showing).
spiral pond
is it possible to open the "diag capture" dialog in the background with lower layer index if there is already one open (when using continuousCounter with diag_captureSlowFrame)? or a new dialog technically must alway be on-top?
spiral pond
cant get #captureSlowFrame to trigger with anything but 0 threshold
works: #captureSlowFrame total 0 0 0
not working: #captureSlowFrame total 0.01 0 0 or #captureSlowFrame total 0.01 0 1 or #captureSlowFrame total 0.01 0 2
 tribal pasture
solar root
v8 breaks overhead icons in KotH (not showing).
tribal pasture
solar root
v8 breaks overhead icons in KotH (not showing).
inAreaArray bugged, should be fixed soon
eternal kraken
captureSlowFrame works for me with 0.001
but not with 0.1
0.01 works for me too in eden editor
player addAction ["diag_captureSlowFrame [""total"", 0.1]",{diag_captureSlowFrame ["total", 0.1]},0,1.5,false]; // dont work
player addAction ["diag_captureSlowFrame [""total"", 0.01]",{diag_captureSlowFrame ["total", 0.01]},0,1.5,false]; // works
player addAction ["diag_captureSlowFrame [""total"", 0.001]",{diag_captureSlowFrame ["total", 0.001]},0,1.5,false]; // works
is this some new bug kju?
 spice dirge
do you really have drops to sub-10FPS?
eternal kraken
i did some more testing and run YAAB with the new versions v08(2368) & v07(2344) and get 52.2 FPS on both instead of 47.8 at stable(2307). Thats great so thank you Dedmen.
But with v08(2368) (min around 7 FPS) i get less performance on my testmission, with v07(2344) everything was like before in stable(2307) (min around 22 FPS). i also noticed a higher CPU usage of my system with v08(2368).
Dedmen i dont know if you have the time an interest for an investigation, if so here my comparence
Arma 3 v.218.152344 Stable CPU Test min_fps 18 -> https://www.youtube.com/watch?v=jzPyYwG0NQQ
Arma 3 v.218.152368 Stable CPU Test min_fps 8 -> https://www.youtube.com/watch?v=8rx-kro01dQ
Testmission -> http://moerderhoschi.bplaced.net/public/tools/arma3/CPU_TEST_MISSION/
thank you for all your work 🙂
eternal kraken
spice dirge
do you really have drops to sub-10FPS?
unfortunately, see my last post
but thats only in my testscenario
 nocturne obsidian
SO Arma 3 will finally run at 60 FPS now?
 ashen helm
no, but you'll see more FPS than less from now on it looks like
eternal kraken
dont get me wrong, dedmen is doing here a great work and improving the overall performance of the game. My overall performance also increases YAAB from 48 to 52 FPS. i only discovered that in my testscenario on my specific rig i got a performance drop, but maybe thats only on that screnario and maybe only on my rig.
spiral pond
eternal kraken
but not with 0.1
this works for me on the client: diag_captureSlowFrame ["total", 0.1, 0, false, 100];
on the server neither (0.1, 0.01 nor 0.001) (with toFile true)
with 0 it works - both client and server. it creates two captures. so indicates too something is bugged
its tricky to say as you dont get any confirmation/response if the chat or sqf command got accepted
sframe cheat triggers also for <20ms here

60 fps is 0,0166 s, aka 17 ms
isnt like 20 fps or less considered to be slow for total? (>50ms)
whole cloud
willow vault
~~https://drive.google.com/file/d/15yHe_oiTiXTyvo18oQ2Rju0LwewZqdWq/view?usp=sha...
Why gone? Want to see freeze 😢
whole cloud
eternal kraken
nice to hear that many of you get better performance, but for me or my testscena...
I'll get back to this, probably tomorrow
spiral pond
no longer can get the #debug on XXX commands to work 😐 #debug von still works tho
edit: only works using an external debugviewer - intended?
whole cloud
gusty viper
Is recommended to run without -cpuCount as well now?
My recommendation generally is to leave it at default, so don't set the parameter, the engine knows what its doing.
whole cloud
sick arrow
Kinda stupid question. If cpuCount isnt set will game use max cores. I have no i...
Yes. It also logs in RPT at the top, how many it uses.
whole cloud
naive osprey
Can confirm strange restart behavior - Ran server for 30 minutes or so, was runn...
cpuCount issue also affects server. But on server it only triggers once JIP queue grows larger than 20k.
That sounds like what you're seeing
whole cloud
spiral pond
no longer can get the `#debug on XXX` commands to work 😐 `#debug von` still wor...
tell me a specific one you're trying.
No change there for v8 though
spiral pond
yeah my bad. via external debug viewer it works
maybe i misunderstood:
Console - All server console prints, are forwarded to your client. Send to submitter what's on server console. Works as DebugAnswer for all writes into the console.
isnt this meant to make the other debug on to be visible - or not the debug on ones (just other things like "x joins" etc)
 hybrid cradle
Strange behaviour on latest prof, trying to load into ace arsenal with about 90 mods or so, instant crash upon loading... but NO mdmp generated
Verifying integrity to just triple check but very strange
spiral pond
Type_363 : 45203
in PZKW
hybrid cradle
Final line in both RPTs is ace adv ballistics beginning loading
spiral pond
remove cpucount and enableHT
 woven loom
Try with just ace ballistics?
hybrid cradle
spiral pond
remove cpucount and enableHT
they arent on
oh HT being hyperthreading
dont remember switching that on
thx anyway
whole cloud
spiral pond
yeah my bad. via external debug viewer it works
maybe i misunderstood:
> Consol...
It is only direct replies to commands.
debug logging that you enable that gets printed some time later, is not necessarily a reply
whole cloud
hybrid cradle
Strange behaviour on latest prof, trying to load into ace arsenal with about 90 ...
Have cpuCount 12 cores or less.
More than 12 cores crashes as soon as AI starts up (Its listed in changelog as known issue)
whole cloud
spiral pond
> Type_363 : 45203
in PZKW
hideObjectGlobal
(This is stupid, Seems like its also a bug with JIP queue)
spiral pond
eternal kraken
i did some more testing and run YAAB with the new versions v08(2368) & v07(2344)...
some consideration:
- profiling build is in general a little slower due to the profiling stuff - do you run the profiling exe or the standard exe?
- it would be useful to see a frame capture from scene(s) where its worse - there is a chance the MT, creation of the workers, makes it slower. unlikely but possible. only with a detail view one could tell moe. do you have a fps graph comparison?
- your demo scenario has a lot of AI influence (probably also PX - render possibly too with all the FX/particles for smoke/fire/etc) - would start with getting a better idea what is most impactful for this benchmark (using
framecheat with profiling.exe)
whole cloud
whole cloud
hideObjectGlobal
(This is stupid, Seems like its also a bug with JIP queue)
But that is weird.
That messge should only be in JIP queue ONCE per object. How do you get 45k of them 🤔
Or are you not talking about jip queue?
spiral pond
whole cloud
hideObjectGlobal
(This is stupid, Seems like its also a bug with JIP queue)
thanks! the scenario hides a % of vegetation for gameplay reasons. afaik @quaint flame had to use global to ensure all clients get the same hidden
whole cloud
But why did you write for PZKW?
That's not vegetation
spiral pond
10:54:34 Server load: FPS 45, memory used: 2920 MB, out: 28 Kbps, in: 4 Kbps, NG:0, G:0, BE-NG:0, BE-G:0, RQ:0, Players: 1 (L:0, R:0, B:0, G:1, D:0), JIP (T:0 Q:54620)
well thats the scenario (PZKW = panzerkampfwagen) - tank heavy mission
if its not vegetation, @quaint flame would need to say if he hides anything else
value stated is from
 whole cloud
Should be very easy to instead do non-global hideObject and remoteExec it locally

 quaint flame
Need to explain what?
spiral pond
why hideObjectGlobal in PZKW for trees, instead of local (and just sync the hide "algorithm" - ie every n-th)
_objects = nearestTerrainObjects [_position, ["Tree"], _radius, false, true] inAreaArray _area;
is the return here not consistent across client and server?
quaint flame
The trees are random
I can send 40k objects over network not problem.
Quest is if that's better.
We also had issues with hideObject where not all clients saw the same objects.
Also. Why is that an issue?
spiral pond
well it creates a big jipqueue. not a huge issue but not ideal
if _objects return is consistent, one could send a bool array instead from the server
quaint flame
It's a 6 player coop mission that lasts an hour..not much jip going on
whole cloud
updating the JIP queue is going on the whole time the mission is running. Not just when a player is JIP'ing in.
Every damage dealt, every inventory item moved. Needs to go over the 40k hidden objects
Probably still not an issue though, since it'll be async in 2.20
quaint flame
Just disable the parameter and see if it makes a difference @spiral pond
spiral pond
eternal kraken
i did some more testing and run YAAB with the new versions v08(2368) & v07(2344)...
doing a bit sample profiling the fps not being impacted is fairly obvious:
initial fps are grinding due to amount of tanks/vehicles - not yet optimized
whole cloud
physx is not optimized yet.
But then it should still be just as bad as it was before, and not worse 🤔
spiral pond
initial fps are grinding due to amount of tanks/vehicles - not yet optimized (repost due 2nd image wrong)


once combat starts other simulation parts become more relevant (infantry, vehicles, combat, ai, sounds, etc)
 whole cloud
Why is visUU so bad? that should be multithreaded now
spiral pond
once most vehicles are dead, render, ai, sound and particles take over - render and particles are good with MT


 whole cloud
Still pretty bad for visUU, but that'll scale with more CPU cores. Your CPU is just too bad 😄
spiral pond
AI MT is kinda impossible to judge (for me at least). sound is MT (see blow), but the separation to jobs seems not ideal (or rather cant be done better probably)
whole cloud
sound is not MT. Its only async, but on a single thread
 whole cloud
I should be able to move sound under render(wDraw). 50/50 chance of it not working 😄
spiral pond
overall your scenario doesnt benefit that much from MT and more worker threads
why less fps - would need a fps comparison graph (overall or better per major scope) of 2.18 stable/v0 perf vs v8 perf
could be MT is just not really efficient for that extreme scenario, or engine dynamically draws more resources when available for AI or other simulation
at least i think to remember Suma (Ondra) stating there is some dynamic adjustment based on current fps to computation (complexity or frequency/both) [ie on AI]
spiral pond
quaint flame
Just disable the parameter and see if it makes a difference <@165398963648724992...
for overall performance not really. PX3 impact way too dominant (and then AI)
 weak panther
Async Sound processing
Can errors in this also make sound problems with air vehicles that uses Sound Sets? it reported here (v8 not fixed it but maybe related)
https://feedback.bistudio.com/T124855#2698486
whole cloud
weak panther
> Async Sound processing
Can errors in this also make sound problems with air ve...
Can the new changes done in the last couple weeks, cause a bug that was reported 7 years ago? no.
The fix for the -cpuCount thing is now released
hybrid cradle
is that the same as -enableHT?
whole cloud
yes
weak panther
whole cloud
Can the new changes done in the last couple weeks, cause a bug that was reported...
that's not what was meant
whole cloud
The sound simulation should not have changed.
If you didn't mean the 7 year old ticket, why are you posting different bugs under that ticket?
indigo anvil
Seeing that there is an update on prof branch > "Did I miss something while having lunch? " > steamdb: profiling update: "37 minutes ago"
weak panther
whole cloud
The sound simulation should not have changed.
If you didn't mean the 7 year old ...
Because in my vision it looks like audio asyc (or unjustified delay, or broken speed of sound value, or any other...). I reported it thinking that the fix can be extended to fix 7year bug. If this fix can't affect fixing this bug in any way, then ok (pity), good to know
There was not meant at all that the profiling branch update caused this bug
eternal kraken
spiral pond
some consideration:
- profiling build is in general a little slower due to the p...
forgot to answer you, sry.
- i run the scenario with standard and profiling exe, no difference both drops down to 7 or 8 fps in V08.
- i can make a diag captureSlowFrame when my fps goes down to 8 and make a picture or export or a record and upload to YT if that helps you? For the Point with the FPS Graph comparsion you can see those Graphs on the left side on the screen in this 2 comparsion videos -> https://www.youtube.com/watch?v=8rx-kro01dQ & https://www.youtube.com/watch?v=jzPyYwG0NQQ
- what is frame cheat?
spiral pond
https://community.bistudio.com/wiki/Arma_3:_Cheats#FRAME - when running profiling exe you can get a capture snapshot everywhere at any moment (same as diag_captureFrame but you need console/a way to execute sqf)
for a comparison graph you could put the scripts from YAAB or use CapFrameX software

earlier sample from Dedmen
to nicely see visually when and how much the difference is over time
this then gives already a pointer from what phase of your benchmark scenario the fps loss is coming from
and with that you can make the frame captures to see why performance is (lower)
eternal kraken
i will check what is the fastest way to deliver the data and no problem, i run my own debug console since arma 2
but in the newest version of my testscanerio i already added the option to make diag captureSlowFrame
player addAction ["diag_captureFrame",{diag_captureFrame 1},0,1.5,false];
player addAction ["diag_captureSlowFrame",{diag_captureSlowFrame ["total", 0]},0,1.5,false];
i will make another record and when hitting 8 FPS i will make a captureSlowFrame, open details and upload to YT
whole cloud
slow frame with a threshold of 0 really has no purpose, thats just the same as captureFrame
eternal kraken
what should i use?
whole cloud
8 fps would be 125 ms.
so that'd be 0.1 threshold
kju said threshold is broken, but I don't believe that yet
eternal kraken
- diag_captureSlowFrame ["total", 0.1]; dont work, nothing happens
- diag_captureSlowFrame ["total", 0.1, 0, false, 100]; also do not work, nothing happens.
- what works is diag_captureSlowFrame ["total", 0.01, 0, false, 10];
so i get 10 times the diag window
but what then, so i got 10 frame captures but what to do with them, shall i expand specific parts of the windows what shall i loking for?
whole cloud
diag_captureSlowFrame ["total", 0.1];
Worked for me.
Run in debug console in editor. Place down a unit and pop
whole cloud
eternal kraken
but what then, so i got 10 frame captures but what to do with them, shall i expa...
Click on copy-all, and send that to me
eternal kraken
i will do
eternal kraken
whole cloud
`diag_captureSlowFrame ["total", 0.1];`
Worked for me.
Run in debug console in e...
not for me, see -> https://www.youtube.com/watch?v=3Eu_TVg70CQ
whole cloud
0.1 only triggers when you game drops below 10 fps
eternal kraken
ahhhhh
whole cloud
Your game seems to be running smoothly at 60fps in your video
it captures THE slow frame, which will be some time after you run the command
If there is no slow frame, then nothing to capture
Also. Lol. Youtube.
 whole cloud
just in my dm, discord will turn it into text file
The capture failed somehow. There are supposed to be multiple lines, there is just one and it has big gaps
 vagrant zodiac
Hmmmm
First go running V8. (Not had time to check other versions since last stable.)
5950X platform, training mission (MOUT/FIBUA with 50+ AI and lots of building.) Lots of mods including LAMBS AI.
So not a proper benchmark type test but a good way to try to experience/get a feel for 'real world' gains.
FPS gain for V8 seems variable but generally large. Areas where there's little to no gain may be limited by things that V8 doesn't change.
Lots of the play through was about 25% higher fps than previous.
As commented by someone else (I think), AI seemed to move much more quickly/be more decisive & aggressive too.
Very impressive.
whole cloud
I don't know where that AI stuff comes from. Maybe just because its higher fps
hybrid cradle
i would assume processing ai quicker = ai smarter/quicker decisions
as able to get through the "decision tree" quicker ig?
whole cloud
Yeah more frames == more steps in shorter time.
But I wouldn't expect fps to be so much higher to notice
vagrant zodiac
whole cloud
Yeah more frames == more steps in shorter time.
But I wouldn't expect fps to be ...
Perhaps LAMBS AI has a higher overhead so benefits more from the improvements?
Not sure either but quite an interesting result
hybrid cradle
when it comes to arma ai ive found small amounts of fps drastically improve ai performance entirely anecdotally
have got a pretty shitty performance modpack, may give v8 a try later today
are there any cool helpful things for loading prof with mods that ive been missing? dont really wanna type 90 mods out into a command line :/
whole cloud
hybrid cradle
are there any cool helpful things for loading prof with mods that ive been missi...
swap the exe files, and just use launcher normally
hybrid cradle
tried that before and got crashes, will try again after this game of warthunder and send mdmp to you if persists
whole cloud
eternal kraken
you're right it worked, where paste the 5k lines
Something is messed in the copy-all. Probably my fault...
Fixing the issues (replace "* Thread with "\r\n* Thread)
Physx (px3) is definitely taking a very long time. And in wSimA, we can see that its waiting for physx to finish. So that is a problem.
Also visUU is messed up somehow. I don't know whats going on there, there are huge gaps between the jobs its doing

Looks almost as if you run that on a quad core cpu 😄
eternal kraken
me and my rig are both old but still running fine 😜
whole cloud
Yeah I broke the copy all button :harold:
Its missing a line break before every "* Thread"
shift+copyAll would still work though
hybrid cradle
launches fine, told you the issue was between keyboard and chair 😝
says kjw, not on profiling branch, having forgotten x64, thus proving his point
yeah this works fine now
dire wave
goodevening, reporting my test with last version.
im getting way lower fps and lots of stutter when cpu count 16 HT OFF (110 fps yaab standars settings)
cpu count 8 HT ON no stutters and i get 120 fps same settings
(8 cores 16 thread, 5800x3d)
whole cloud
cpu count 8 HT ON
What actual start parameters do you set for that?
physx is just expensive and I can't see anything specific to fix. Its simulating 28 vehicles, like 6 or so times (Physx is a fixed timestep, the lower your fps, the more steps it runs per frame)
And for each vehicle, its doing a sweep (checking what ground surface and stuff its in contact with, which is alot of raycasts)
For vehicles far from the camera or not visible on the screen it can be optimal to only perform suspension queries every Nth update rather than every single update. The accuracy of the cached contact plane naturally diminishes as N increase, meaning that wheels might start to hover or intersect the ground for large values of N or even with values close to 1 in conjunction with large vehicle speeds and/or geometry that has low spatial coherence.
That would be possible, but we know what happens when a vehicle clips into the ground or a building... Probably a bad idea.
Physx multithreading, would actually only reduce the px3sim scope. Which is not the largest.
px3vehsimSweep, should only make a note that a vehicle wants to be simulated, that shouldn't take 0.06ms.
Looks like I can multithread the Sweep, but I don't know if physx will like that.
Definitely a very good test scenario, I'll take a look at itwhen I do the MT physx things
dire wave
whole cloud
> cpu count 8 HT ON
What actual start parameters do you set for that?
wdym? i just put 8 in cpu count value in launcher parameters and unchecked HT
whole cloud
dire wave
wdym? i just put 8 in cpu count value in launcher parameters and unchecked HT
If you uncheck HT, then thats not "HT ON" as you write
dire wave
sorry typo
whole cloud
And if you set -cpuCount, then the HT parameter is completely ignored.
So if you set CPU Count 8 and HT enabled. That means you are running CPU Count 8 and HT disabled.
8 Core 16 thread cpu
-cpuCount=8 -enableHT == 8 cores
-cpuCount=8 == 8 cores
== 8 cores
-enableHT == 16 cores
-cpuCount=16 -enableHT == 16 cores
-cpuCount=16 == 16 cores
So what you're reporting.
Running 8 is good performance.
Running 16 is bad.
Which does make sense to me, so the optimal is to just leave enableHT off
 cloud sky
I think it would be nice that the launcher would visibly disable the -enableHT option if user sets -cpuCount manually to prevent misunderstandings
whole cloud
Yeah would be neat
cloud sky
Can just imagine the number of users that enable/use both to "max" their FPS (because I've been one too 😁)
 orchid mesa
anyone else experiencing the top half of their monitors flickering black on profiling?
happens on my main monitor and side
also despite higher overall fps, it's extremely choppy feeling
getting >100 fps but it feels like 30 (getting frequent frametime spikes)
 restive pilot
vsync issue?
naive osprey
Might be your monitor skipping frames? I had that same issue a while back because of it
restive pilot
Did you get 100 FPS on stable?
orchid mesa
yes
hybrid cradle
got nearly double performance on prof compared to stable when dealing with impact particles
40fps low vs 85fps low on prof
spiral pond
whole cloud
kju said threshold is broken, but I don't believe that yet
clientside all thresholds work for me. only serverside via #captureSlowFrame can only get 0 to work
(and sframe doesnt seem to trigger only > 0.03/0.02)
hybrid cradle
Using my own benchmark in ace arsenal, not exactly a science but it was consistent
stable frametimes
0.13 max
0.01 min
0.0216 average
prof frametimes
0.1 max
0.005 min
0.00800951 average
good fucking job dedmen jesus christ dude
whole cloud
I don't understand what these numbers are supposed to tell me.
frametimes are usually measured in ms.
So you're saying your worst frames, are at 7692 fps?
hybrid cradle
diag_deltaTime 🫣
but yeah that seems about right with what im getting by looking at diag_fps
whole cloud
I mean what is your benchmark doing, to get such an extreme improvement?
I can't think of anything that would do so much
hybrid cradle
whole cloud
I mean what is your benchmark doing, to get such an extreme improvement?
I can't...
i just made it to measure particles for our mods guns so all im doing is just shooting at the ground to measure that as it was previously tanking fps by like 40 from 80
whereas now i struggle to get it below 90fps
whole cloud
Mh I guess particles running in parallel to sound could do that 🤔
 flint rampart
question i was reading something about dedmens multithreading improvements in the 2.20 update coming out. is there a way to test this out now? im so tired of low fps in koth lol
im on the profiling branch, im not sure if i have to try somethign else. i have hyperthreading and everythign enabled still getting horrid fps on a decent rig
hybrid cradle
its not a magic fix
flint rampart
not sure if im doing something wrong. i have a 5800x, 6800xt, 64 gb of ram
set cpu count to 8 since i have 8 physical cores, enabled hyper threading, checked extra threads and all the options
doesnt make a single difference from what i can tell
whole cloud
flint rampart
im on the profiling branch, im not sure if i have to try somethign else. i have ...
Profiling branch has the improvement.
Leave hyper threading off
flint rampart
ill try that. so just set my cpu count to my physical cores correct?
whole cloud
set cpu count to 8 since i have 8 physical cores
Well this doesn't make sense. If you have 8, then the game automatically detects that you have 8. Why would you tell the game something it already knows.
enabled hyper threading
If you set cpu count, then the hyper threading argument is ignored. If cpu count is set it does literally nothing
checked extra threads
Again, why, the game already knows that.
Just leave the parameters at default
flint rampart
ok ill try that
whole cloud
What do you count as "horrid" fps?
Your hardware, should be 40-70 in koth
flint rampart
i had them set more than likely due to outdated tutorials on fps improvements for arma
70 is good for me, im averaging 35 but im disabling it all and putting it to default. going to test that now
whole cloud
You can also use the profiling exe (seperate exe file in game folder) to analyze what your game is doing and why your fps is low.
flint rampart
good to know thank you!
dire wave
flint rampart
good to know thank you!
Download the perf branch youll notice a huge boost in performancd
flint rampart
dire wave
Download the perf branch youll notice a huge boost in performancd
ive been running the perf branch. i think as dedmen was saying i was probably negating that by setting my cpu count. im trying it all set to default params now
hybrid cradle
whole cloud
You can also use the profiling exe (seperate exe file in game folder) to analyze...
btw i assume theres no utility in prof to see how much time/vram etc individual p3ds are taking up right?
given profiling that would be a nightmare
flint rampart
*profiling performance branch
 night mulch
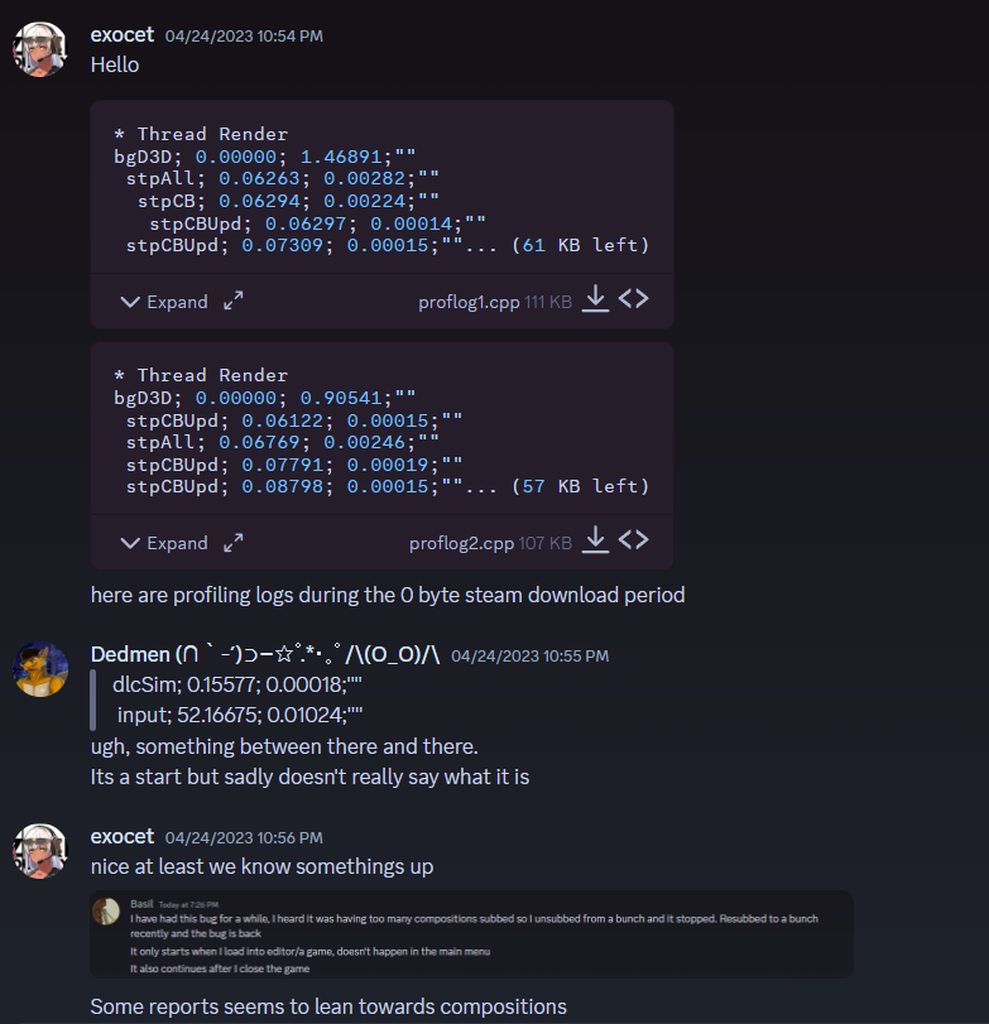
yo bro @whole cloud i finally found possible culprit of the stutter from infinite download loop 😨
its steamcbk
spiral pond
run prof.exe and when you have low fps, use frame (or sframe) cheat: https://community.bistudio.com/wiki/Arma_3:_Cheats#FRAME
then hit the "copy all" button and copy paste (ctrl+v) in here
flint rampart
that did the trick. setting the params was def conflicting. now im 55 to 70 fps in the city so far
night mulch
night mulch
look here in this frame it spikes
https://cdn.discordapp.com/attachments/3299784...
this behavior consistently repeats every few frames, just like the download loop repeating
its also consistent with the old logs i sent you, it happens between dlcsim and input
https://imgur.com/a/ttHwXm6
whole cloud
hybrid cradle
btw i assume theres no utility in prof to see how much time/vram etc individual ...
correct
whole cloud
night mulch
its steamcbk
We know that already
Question is, what is below steamCbk.
latest profiling has a bit more info there. But if it is empty as on your screenshot then 
It seems I have to blame steam
night mulch
i took that ss like 15 hours ago, i can try again with the latest profiling exe
whole cloud
If there is a statEval below it, then I can solve it, probably
But I'll mooost likely still need repro so I can narrow down the problem, its still a big surface to cover
Ah I just found a bunch more steam callback places that are missing scopes
night mulch
which leads me to believe its really steam asking about info of something subscribed from the workshop
this is what it says from steam downloads page during infinite download loop
https://cdn.discordapp.com/attachments/329978448938532868/1303381241235771464/HGHDd2N.png?ex=672b8bdf&is=672a3a5f&hm=157f1f33f2bcd08911ed0587d549cb1e174d9a7f776afb5905c0c5858ec26f1e&
whole cloud
It'll be one of the things we didn't tag for profiling.
One of them is receiving info of what content player is subscribed to.
And in there, is a bugfix for empty filenames to start redownloading files 🤔
night mulch
whole cloud
It'll be one of the things we didn't tag for profiling.
One of them is receiving...
whole cloud
Its listed as a steam bug workaround, but if that triggers. It could mean it would start downloads for possibly many subscribed addons/compositions
night mulch
I AM HAPPY WE ARE FINALLY MAKING PROGRESS AFTER YEARS 😭 😭 😭
night mulch
whole cloud
If there is a statEval below it, then I can solve it, probably
But I'll mooost l...
really still mysterious on what actually cause it, so i dont know how to repro, but i can maybe add like 200-300 of my current subscribed composition to a collection that you can subscribe to all instantly and see if it triggers the bug
and if anyone else wants to help test repro i'd really appreciate it 🙏
whole cloud
I'm building a test build to see if this is the issue
night mulch
thank you so much!!🙏
whole cloud
if you see steamMngSubCRet_EmptyFile then we have a jackpot
But also weird that it does it repeatedly, I'd assume just pulling the data once should be enough
night mulch
whole cloud
https://cdn.discordapp.com/attachments/556630072094883860/1303383509490073600/Ar...
im on it boss
why am i the only one who cant post gifs lol
command ran
diag_captureSlowFrame ["total", 0, 0, false, 15];
whole cloud
slowframe with threshold 0 doesn't make sense
diag_captureSlowFrame ["steamCbk", 0.01];
That
night mulch
idk thats what i was using in the previous cases
whole cloud
capture slow frame is made to capture slow frames. Doesn't really make sense to make it try to capture every 3rd frame
night mulch
night mulch
is it supposed to be like this
https://cdn.discordapp.com/attachments/3299784489...
i tried diag_captureSlowFrame ["total", 0]; and it shows the white screen like the above
night mulch
no, same white screen
whole cloud
Could also just use the frame or sframe cheat codes
night mulch
maybe re check the exe?
whole cloud
Seems I somehow buggered all profiling in that build..
But its just the v8 build with some couple scopes in steam 🤔
OH
stoopy
night mulch
have u tried on your end with the exe?
whole cloud
Its set for vTune profiling, disabling the normal one. Sorri
whole cloud
vTune would tell me more anyway, but setting that up is too much work
https://cdn.discordapp.com/attachments/556630072094883860/1303389434359844865/Arma3RetailProfile_DX11_x64.exe?ex=672b9380&is=672a4200&hm=98595739739670bea236a6131c322239fb9ddd0caa7c198fcbff6bb6e23cceb4&
Next attempt, I've actually tested it first this time
quaint flame
 night mulch
oke ty
whole cloud
quaint flame
You disabling all the other threads and total ordering is confusing me 😠
That is the one we already know about, not the one we're looking for

 whole cloud
Do you actually have the compositions triggering downloads issue, or might it be a different one, without downloads?
spiral pond
not subbed to compositions basically, only 100-200 mods
whole cloud
So probably a different issue than exocet
night mulch
 spiral pond
likely. i had/have only a similar issue if steam tries to update mods but cant (in a constant cycle) (cant say tho how much this impacts the game itself)
night mulch
uff still not showing more info
whole cloud
So we didn't find it yet 
night mulch
spiral pond
likely. i had/have only a similar issue if steam tries to update mods but cant (...
can you help me repro by subscribing to a collection of compoisitons
i'll make my 200-300 of my subscribed ones as colection
spiral pond

there may be a difference with the steamCbk if you have simulation active or not
in the background for you @night mulch there is the console open - aka simulation stopped basically?
night mulch
well its in 3den, and the stutters happen even in main menu
spiral pond
ok. may still be useful to check also during active gameplay
anyhow seems more scope labels to be added
night mulch
ok one sec
spiral pond
night mulch
well its in 3den, and the stutters happen even in main menu
-skipintro / -world=none - aka does it play a cutscene in the main menu or not?
night mulch
skipintro yes
whole cloud
Guess another try then
 night mulch
during gameplay bro lol
https://cdn.discordapp.com/attachments/329978448938532868/1303398979534585876/20241105234157_1.jpg?ex=672b9c64&is=672a4ae4&hm=10f015a27a735bcb130c7cde89ff687ee21385a4e5cb26d42859a546431bba85&

YO I CAN FINALLY POST EMBED
 whole cloud
I've gone through all steam callbacks and added scopes to all of them now..
https://cdn.discordapp.com/attachments/556630072094883860/1303399351539994694/Arma3RetailProfile_DX11_x64.exe?ex=672b9cbd&is=672a4b3d&hm=aebc3ff87572eb847207485e5801a12678bf7939043edcbb84029513883e29a4&
The uStatsSt will now spam alot
If there is still nothing there, then it must be fully on steams side
whole cloud
Okey not all
I missed the webbrowser 😄 But thats not relevant
whole cloud
But I did not miss
SubscribtionChanged inside SubscrictionChanged.hpp
night mulch
 whole cloud
Well
Also I'm joinking that for my 1337 stash
Then we're back to me having to repro it, and probably profiling steam
spiral pond


 autumn timber
Too bad that Time Travel Debugging would be too heavy to troubleshoot this
whole cloud
So the stats is simply, every stat taking a long time.
I hope steam is not doing a file write for every time we ask for the value of a statistic
With the 0.1ms it almost looks like it is
gtive me a way to subscribe (and unsubscribe again.. please) to a ton of compositions, and I'll try to try it tomorrow
autumn timber
I hope steam is not doing a file write
How about using Process Monitor on their computers to confirm or rule that out? (https://learn.microsoft.com/en-us/sysinternals/downloads/procmon)
whole cloud
If need be, I can probably make a file with a bunch of steam item id's work
That would be an option, but I'm not going to explain procmon now 😄
Also question, steam beta client?
autumn timber
whole cloud
That would be an option, but I'm not going to explain procmon now 😄
There you are: did that for you 🙃

Actually, this would probably also need narrowing by "Operation" too, to only show file accesses
FYI: This should do it
Not sure if you want to try that, @night mulch @spiral pond?
 whole cloud
It won't be Arma 3, it'll be steam client
night mulch
whole cloud
Also I'm joinking that for my 1337 stash
its real now, arma3 AI has become sentient and is actively trolling us 
night mulch
whole cloud
Then we're back to me having to repro it, and probably profiling steam
ok let me work on that compositions collection so you can subscribe to everyting at once
autumn timber
Hmm... but won't this be a steam.dll loaded into Arma3.exe, though? (I was not following this discussion, so you're most probably right)
whole cloud
I wonder if I can multithread it. If steam is the limit, it probably only has one thread on its end, so it wouldn't gain anything
whole cloud
autumn timber
Hmm... but won't this be a steam.dll loaded into Arma3.exe, though? (I was not f...
steam DLL talks to steam client via RPC
And steam client does the thing
night mulch
whole cloud
Also question, steam beta client?
yes, im on steam beta update
whole cloud
Considering this issue appeared recently. Might it just be steam beta update?
autumn timber
Oh, so the dll basically blocks while waiting for the RPC to execute
whole cloud
At least the lag that kju is seeing, not the redownload thing
night mulch
whole cloud
Considering this issue appeared recently. Might it just be steam beta update?
recently? lol look at the time stamp
https://imgur.com/a/ttHwXm6
and it has been happening way before that
spiral pond
writeFile or what operation would it be?
whole cloud
Wasn't the steamCbk profiling there back then?
Still might be different
spiral pond
there is a lot of stuff goign on
night mulch
whole cloud
Wasn't the steamCbk profiling there back then?
Still might be different
no, i can send u those logs again if u wanna take a look
whole cloud
I mean if steamCbk was in engine. And we don't see it back then, it wasn't executed and the problem was elsewhere
The logs don't help me
Maybe try not using steam beta, if it's different?
But the downloading and stats issues are different.
Kjus stats issue is new. The downloading one isnt
autumn timber
spiral pond
writeFile or what operation would it be?
If you're talking about the Process Monitor, then use the Event Class, instead, as seen on my second screenshot (but not for Arma3.exe, as Ded pointed out)
spiral pond
 autumn timber
Unless there is no point in checking this for the stat issue, since it may be something completely different...
 night mulch
whole cloud
I mean if steamCbk was in engine. And we don't see it back then, it wasn't execu...
night mulch
whole cloud
I mean if steamCbk was in engine. And we don't see it back then, it wasn't execu...
mmm makes sense
night mulch
whole cloud
Maybe try not using steam beta, if it's different?
But the downloading and stat...
ok ill try
 whole cloud
spiral pond
whole cloud
spiral pond
If you also do a capture slow frame to file. You can easily see Armas capture frame log file write. Right after we would expect steam to do something
spiral pond
 whole cloud
Uh oh. Writing usergamestats
spiral pond
endmission to trigger stat check
whole cloud
But it doesn't spam it.
And you ended mission, it probably would write at end
Because it probably also writes some stats at end
Sounds like it's not it

 night mulch
no difference on steam stable branch
whole cloud
spiral pond
Mh it complaining about rate limit is interesting though
But that's probably just for online submit, not for local storage
night mulch
not surprising tbh, the bug been around for years😂
spiral pond
 whole cloud
Give me some composition list I can sub tomorrow hopefully I can repropropri
 whole cloud
spiral pond
whole cloud
spiral pond
Super weird that it waits for dlc to be done, even though it's async. But that's not telling me anything new
night mulch
whole cloud
Give me some composition list I can sub tomorrow hopefully I can repropropri
okeeee
 light cargo
spiral pond
light cargo
spiral pond
you need to really filter things before starting to capture else procmon is unusable
spiral pond

thats all for the stats check

with arma3 process context - only pbo/ebo read/write excluded
light cargo
whats broken now?
night mulch
@whole cloud apparently im also subscribed to several compositions that are hidden/deleted/idk whats going on with it on steam
light cargo
night mulch
<@90532520101183488> apparently im also subscribed to several compositions that ...
that's normal/because the owner has made it friends only or private, you want to remove them because it causes problems with a3/launcher.
not a perf branch bug per se
night mulch
lol i dont think you understand what's been talked about here
light cargo
steam returns error/404 with those
Sorry
but i recall a issue with 404 addons causing problems with a3
not too long ago
just, i wouldnt worry about those unavailable compositions
you'd have to ask the owner about it if you know them and get it restored
you possibly can know that via web archive or something about querying items
anyways, sorry for the detour
whole cloud
night mulch
<@90532520101183488> apparently im also subscribed to several compositions that ...
Could it be that only failing compositions cause it...
night mulch
yeah it's a fair assumption, steam trying to request data for a composition that's been listed private so it keeps hitting a brick wall
willow vault
whole cloud
Why gone? Want to see freeze 😢
Sorry, I thought you downloaded it. It's back on, same link.
night mulch
but im subscribed to 1755 compositions
night mulch
whole cloud
Could it be that only failing compositions cause it...
that would be a nightmare though as anyone can private their compositions at any time
light cargo
make a steam collection for him of the desired test workshop items
night mulch
but idk how is the behavior in game, does it still show up 🤔
light cargo
unfortunately
well, it would not because steam removes it iirc
or rather it just fails or crashes
 fickle geyser
I wonder if calling unsubscribe via steamworks if it gets a 404 would fix it
light cargo
i've actually talked about this very issue with privated/unlisted items in the context of arma 3 behavior
light cargo
fickle geyser
I wonder if calling unsubscribe via steamworks if it gets a 404 would fix it
probably], you can always unsub yourself via steam website
fickle geyser
not really if you can't find the item on a list if it's privated
light cargo
best to not do that kind of "fishy" thing, because its a privacy violation to touch users subscribed items list
fickle geyser
it's not a privacy violation
light cargo
Well, without a consent prompt it is
why do you think loading a mod list prompts you for confirmation to subscribe to items you dont have?
im suggesting have a option with confirmation to check items and cleanup the invalid ones
Also a repair all loaded option
in the launcher
i think i might've opened a ticket about this issue with dead workshop entries
if you have a problem with the lack of preservation of items that get removed/unlisted, bother valve not bi :)
night mulch
@whole cloud ok so i've confirmed, privated compositions still show up on subscribed items on steam, but doesnt show up in game
light cargo
night mulch
<@90532520101183488> ok so i've confirmed, privated compositions still show up o...
that's correct behavior. the problem with those is the launcher. and he wont be able to subscribe to them if you send it
night mulch
and the infinite download loop only triggers after the game is loaded, not when youre still in launcher
light cargo
when it tries to load them from steam is where the issue happens, right?
anyways, here's the ticket i made related to what im talking about but in the launcher instead of in-game: https://feedback.bistudio.com/T182809
i feel it should get better handled by the launcher and game
night mulch
So we know that in the infinite download loop, steam is trying to download "workshop content".
The workshop has 4 data types: scenario, composition, mod, server
mods are checked by launcher before game starts, so i dont think is related since the issue is not present before game starts
server is just mods that are server side
That leaves us with composition and scenarios as possible causes
as for privated items, these 2 behave differently
privated scenarios are still visible in scenarios menu, and can still be downloaded and played normally.
Compositions however will simply not show up in 3den editor
This is an example of privated scenario showing up
https://cdn.discordapp.com/attachments/329978448938532868/1303423900088143904/20241106011941_1.jpg?ex=672bb39a&is=672a621a&hm=b87ba34beec7d81ec011e4c2931e6d38a04fc99dcd061851eccccf32738dc299&
 light cargo
the case with privated scenarios sound like they are locally loaded from steam cache
compositions seem to be unable to get downloaded
vivid rune
Interesting: I have a 16core 32thread maschine. I restricted the exe to 12cores. With the old v8 I had 70fps. With the new one and without the core limitation I had 65fps. I put the 12core back in and now I have 70fps again.
light cargo
vivid rune
Interesting: I have a 16core 32thread maschine. I restricted the exe to 12cores....
that's expected
night mulch
fickle geyser
I wonder if calling unsubscribe via steamworks if it gets a 404 would fix it
hmmm the problem would be if the creator privated the thing but then re publicize it
light cargo
night mulch
hmmm the problem would be if the creator privated the thing but then re publiciz...
okay then, seems like its somehow bypassing steam o_O
vivid rune
light cargo
that's expected
I don't see that this is a "expected" behavior.
light cargo
vivid rune
I don't see that this is a "expected" behavior.
Oh i see, when you limit it you get more fps? well the os and gpu need some cores, thats why it works better with less
less pegging in the cpu, better performance
idk, computer logic is weird
vivid rune
Make sense. This should investigated further: Can anymore test this and set CPU count to cpuCount=CPU cores -4 and comapre this to cpuCount=count of CPUcores?
light cargo
i tried -2 in my i7-4790k for a compile of a map in source engine and it significantly improved instead of freezing completely
 orchid pine
night mulch
but im subscribed to 1755 compositions
orchid pine
night mulch
but im subscribed to 1755 compositions

 inland dew
whole cloud
Profiling branch has the improvement.
Leave hyper threading off
inland dew
whole cloud
Profiling branch has the improvement.
Leave hyper threading off
why ht off?
fast hornet
was there a re-release/compile of v8 with the >12 cores crash fixed? Steam downloaded something for me but there is no v9 or something?
hm yeah, build number is 6 higher it seems
fast hornet
ah kk, missed that one
light cargo
inland dew
why ht off?
because pure cores are better than splitting threads for performance
 latent sigil
I have i5-12450HX processor it has 4 P cores and 4 E cores. And has hyper threading on P cores so therefore total 12 threads.
What should be my settings in parameters for this configuration?
Currently, I have set - CPU count to 12, Extra threads - ON (3 options also ON) and Enable Hyper Threading - ON.
 gritty wasp
Just launch test yourself. 1 hour of testing and 0 doubt.
Probably disable all options would be best.
I think HT almost never gives any advantage for any software. Maybe in Pentium 4 era it was a thing, but now...
latent sigil
orchid mesa
getting >100 fps but it feels like 30 (getting frequent frametime spikes)
Used to happen with me after I alt tab and come back to the game. Fps stayed around 50-60 but felt like 20. I found that autodetcting video settings removed the stutter and now the problem is gone now.
latent sigil
gritty wasp
Just launch test yourself. 1 hour of testing and 0 doubt.
Probably disable all o...
Did some tests. The best results I got is with HT disabled. Leaving extra threads ON.
But it is marginal improvement of 5-6℅ over my previous settings
 green sparrow
@whole cloud Which memory allocation should I use?
windows
intel
jemalloc
or from github
cma x64
minimalloc_v212
fast hornet
mimalloc_v214 has been out for ages 😉
green sparrow
anyone else have in fight a crash to desktop on v8
restive pilot
green sparrow
<@90532520101183488> Which memory allocation should I use?
windows
intel
jem...
The official one (intel tbb4)
dire wave
Changing mem allocator does actually makes any difference? Im using the default one (i guess mimalloc?)
 knotty wraith
Will there be any comments from the owners of servers with AI 150+? Who has spawn all over the map and behind it, and the whole range of vehicles from ground to aircraft?
It feels like there is a chat to discuss your sizes and personal impressions 🙂
 spiral pond
@eternal kraken would recommend to use CapFrameX for better fps comparisons - ps: as you can see with this old hardware there is also very little difference


you only need to adjust the time here if you want to auto end roughly at the same time; otherwise just hit f11 for it to start
 knotty wraith
 heavy galleon
> discuss your sizes
you really want that? <:wtf:1270370429445341205>
heavy galleon
> discuss your sizes
you really want that? <:wtf:1270370429445341205>
I'm afraid to even imagine what you understood from what I wrote
eternal kraken
spiral pond
<@229661410483896320> would recommend to use CapFrameX for better fps comparison...
you're totally right and i don’t expect miracles. my overall performance also improved since Dedmen started his arma spells. I know i should upgrade my rig but i don’t like to replace things which are still working and doing their job. I hope my boss has the same opinion 😄
spiral pond
spiral pond
`sframe` cheat triggers also for <20ms here
the limit works correctly today (aka > 0.02 / 20 ms / 50 fps) - maybe mixing things with frame/sframe/diag_captureSlowFrame can bug it out
spiral pond
spiral pond
not working: `#captureSlowFrame total 0.01 0 0` or `#captureSlowFrame total 0.01...
#captureSlowFrame still doesnt work for me. only with 0 as limit
spiral pond
eternal kraken
you're totally right and i don’t expect miracles. my overall performance also im...
so far the biggest improvements happen with render - if you are mostly CPU limited, probably wont help too much
some parts cant be improved much (with the MT/worker threads) as they have to happen one after another (mainly the unit-vehicle-combat-world simulation and also AI for the most part)
some parts Dedmen stated he still wants to look into (ie sounds, PX and some other parts)
fast hornet
my guess would be that 99% of players are CPU limited when it comes to arma.. unless you play on a laptop or something. Any dedicated GPU from the last 6-8 years should be able to handle arma easily.
Mine is so bored it doesn't even switch on the fans for arma 😂
spiral pond
this is not how the RV engine works
one part is still GPU (render) [plus particles and few other things] that still need to get computed
the MT and worker threads speed up that part. hence people do see 10-30% better fps (and should also lead to higher GPU usage)
however you wont see high usage for CPU as most of the simulation work is and has to be done on the main thread - you cant parallelize many tasks as they may depend on/influence each other. there is still some stuff handled by other cores/threads (ie PX, data loading - now AI, sounds, etc)
whole cloud
willow vault
Sorry, I thought you downloaded it. It's back on, same link.
Thank you, done.
I have seen the same thing in a different place today. But now only seen it twice in total. Seems like something is funky with the enfusion stuff, but it seems to be extremely rare 🤔
It took a task, said "Yeah, I'm working on it now!" and then... just didn't work on it. And the other thing waiting for the task to be done just gets stuck..
Scary 
whole cloud
inland dew
why ht off?
Because it crashed the game. And it also seems to perform worse.
whole cloud
latent sigil
I have i5-12450HX processor it has 4 P cores and 4 E cores. And has hyper thread...
What should be my settings in parameters for this configuration?
None. You leave everything at default.
whole cloud
latent sigil
Did some tests. The best results I got is with HT disabled. Leaving extra threa...
Note that when you set CPU Count parameter, the HT parameter is completely ignored.
So if you had cpu count set in your testing, then your testing was faulty.
whole cloud
green sparrow
<@90532520101183488> Which memory allocation should I use?
windows
intel
jem...
Just leave it at default
whole cloud
green sparrow
anyone else have in fight a crash to desktop on v8
Report all crashes to me, I need the mdmp file
inland dew
so if 4 cores 8 threads cpu, still better to not -enableHT?
whole cloud
spiral pond
so far the biggest improvements happen with render - if you are mostly CPU limit...
The cpu side of the renderer was improved. Not the GPU side.
If you are CPU limited, that's where most the improvements are. I did nothing on GPU side
whole cloud
inland dew
so if 4 cores 8 threads cpu, still better to not -enableHT?
I don't know. People can test if they want.
The recommendation is to leave it off. Or to control it with -cpuCount instead
green sparrow
whole cloud
The cpu side of the renderer was improved. Not the GPU side.
If you are CPU limi...
hey, i have fixed the crash
i have downloaded the profil new and then it worked
whole cloud
That's not how crashes work
fast hornet
saw the crash/memdump i sent you btw.?
whole cloud
it not happening doesn't mean its fixed. I still want to see what happened
whole cloud
fast hornet
saw the crash/memdump i sent you btw.?
Your messages are still on unread
probably tomorrow
fast hornet
no worries, work is work.. just wanted to make sure you didn't miss it 🙂
inland dew
whole cloud
I don't know. People can test if they want.
The recommendation is to leave it of...
when -cpuCount isn't used, then -enableHT might be a thing
whole cloud
yes. If cpuCount isn't used, then -enableHT counts how many threads you have, and puts that into cpuCount internally.
Most people set both cpuCount and enableHT which is nonsense
 smoky bridge
Hey folks, did they fix the thing which broke antistasi the other day?
Not sure what it was
whole cloud
yes
smoky bridge
Oh, that's great!
They've been doing wonders on that branch recently it seems
Wait, dedmen, you are working on it, afaik, right?
heavy vortex
The thing that broke Antistasi wasn't actually something that Dedmen was working on :P
smoky bridge
Oh well, I just heard on reddit that dedmen was working on the branch
not sure who is working on it, but honestly y'all are doing wonders to the game
Seeing arma run at a stable 60 fps is amazing honestly
vivid rune
inland dew
so if 4 cores 8 threads cpu, still better to not -enableHT?
I have an old 4C8T. My sweet spot are 5 Core used with cpuCount. But you should try and error by yourself with YAAB.
heavy vortex
Bear in mind that YAAB needs to be averaged over several runs for that sort of accuracy.
Difference between cpuCount 4/5/6 isn't going to be large there.
vivid rune
If you have only 4, it is.
you can see it also in the frame times.
5 is a smooth line in comparison to 6.
night mulch
@whole cloud i sent composition list for infinite download loop bug repro test via DM
willow vault
whole cloud
Thank you, done.
I have seen the same thing in a different place today. But now ...
It only happened once too, next run was fine.
spiral pond
profiling observations - tracy profiler
gritty wasp
fast hornet
my guess would be that 99% of players are CPU limited when it comes to arma.. un...
4k ultra can overwhelm gpu.
did someone check why fps drops in YAAB at scene where camera goes from KAMAZ to town. Is it because a lot of visible objects in scene?
 marsh ember
is Profiling fixed for Antistasi yet?
 midnight oyster
Does anyone else experience video memory overrun (VRAM exceeds total available on GPU) after 5-10 minutes of gameplay?
I tried setting the VRAM limiter in the parameters file and it didn't change anything [EDIT: I have an RTX 4070 12GB so I tried setting the limit to 6 GB (= 50%)].
 plain trout
Had a guy in my group that was unable to play due to a memory leak on profiling. I think it was on v7
woven loom
midnight oyster
Does anyone else experience video memory overrun (VRAM exceeds total available o...
Long ago, but the only solution i found was to set the texture quality to "high". For me it only used to happen with assets that had high res textures and on my 6GB GPU.
Hasn't ever happened on my 12GB 4070 Ti
marsh ember
naive osprey
https://discord.com/channels/105462288051380224/105466848958513152/1303777836431...
TY
midnight oyster
Does the memory allocator selection (ex. "mimalloc-v214-lock-pages") affect both RAM and VRAM allocation?
restive pilot
No
inland dew
midnight oyster
Does the memory allocator selection (ex. "mimalloc-v214-lock-pages") affect both...
not recommended if you have only 16 gb ram
midnight oyster
inland dew
not recommended if you have only 16 gb ram
I have 32 GB 6000 MT/s RAM (2x16GB), 12 GB VRAM on the GPU, and plenty of free SSD space for the system-managed page file.
Does the memory allocator selection affect the VRAM memory allocation on hardware like that?
naive osprey
midnight oyster
I have 32 GB 6000 MT/s RAM (2x16GB), 12 GB VRAM on the GPU, and plenty of free S...
I'd recommend running a benchmark like YAAB a few times with different configurations. I was using mimalloc, but was causing stutters after a while. Most people don't experience that, so your mileage may vary.
midnight oyster
naive osprey
I'd recommend running a benchmark like YAAB a few times with different configura...
I'm testing that as we speak 👍🏼
 stark falcon
Warning Message: Cannot load mipmap x.paa I've gotten this popup a few times on profiling this week, can't always reproduce, just wondering if anyone else has seen an increase in this error
tribal pasture
Seen this one for years randomly
 fair ore
I saw it for the first time the other day
midnight oyster
Conclusion from my battery of tests around changing memory allocator to resolve VRAM memory leak - no, the allocator isn't changing anything about the VRAM issue.
I'll try to pare down my mod list, maybe it's some old mod with bugged textures or a poorly-written script
hybrid cradle
anecdotally got about double performance on kp liberation today too
woven loom
midnight oyster
Conclusion from my battery of tests around changing memory allocator to resolve ...
Yeah afaik it doesn't deal with VRAM
quaint flame
Is there a chance to see Profiling Tags in the Profiling Binary.
spiral pond
you can do with ASP: https://community.bistudio.com/wiki/ArmaScriptProfiler#createProfileScope
from what i understand it doesnt support start and end tags yet to be able to profile parts of a function - might be wrong about that tho
whole cloud
quaint flame
Is there a chance to see Profiling Tags in the Profiling Binary.
What you mean? You want a list of all? What do you mean by see? and what tags?
quaint flame
I can send you an example later or maybe @spiral pond
I don't know the correct terminology for them.
spiral pond
do you mean scopes, aka the names, you see in the visual graph?
latent sigil
whole cloud
Note that when you set CPU Count parameter, the HT parameter is completely ignor...
On everything default my game keeps crashing during benchmark
whole cloud
latent sigil
On everything default my game keeps crashing during benchmark
Send me the crash dump
 restive meteor
Maybe a stupid question: How smoothly does the Standard and Profiling branch work together? Can this increase Desync between players running different versions? I noticed a lot of issues with AFM lately (Desynced Airframes).
whole cloud
It is supposed to behave the same in multiplayer.
spiral pond
ok. i guess Dedmen could grab it from the source - if he wants/its not problematic.
to have all scopes isnt really needed or helpful either imo. probably could grab the most relevant ones via tracy or filtering a bunch of trace files
whole cloud
90% of scopes are irrelevant
quaint flame
I wanna be able to define scopes myself.
To profile parts of a large script for example.
whole cloud
Yeah then the link kju posted above, with ASP
quaint flame
I see
whole cloud
night mulch
<@90532520101183488> i sent composition list for infinite download loop bug repr...
Immediately giving me some results.
It is hitting a breakpoint that I've set months ago and never got hit, of when a steam request doesn't contain all results and needs to be split up into multiple.
And that also showed I was missing some more profiling scopes, specifically the one that deals with receiving the list of subscribed content, that steam sends back.
Steam gives only 50 results, but says there are 311 total results. So we ask steam to send the next batch of results please.
That is interesting, but I don't see any lag spikes. Whatever is causing the lag spikes, is not in these 311 items.
whole cloud
Can I fix that dlcUpd with multithreading?
nope. If I do the requests in parallel, steam just queues them up.
 gritty wasp
Why this list need to be updated during game? For stats?
whole cloud
You can purchase DLCs while the game is running
hybrid cradle
oh that actually works?
iirc I had to relaunch to get RF to stop showing me watermarks...
gritty wasp
Game run ok. You probably can subscribe to scenarios too. But I doubt that they will download and apply during mission running
 unborn urchin
hybrid cradle
oh that actually works?
unborn urchin
hybrid cradle
oh that actually works?
supposedly, i dont think anyone in the world has actually tried it
whole cloud
hybrid cradle
oh that actually works?
Last I tried it did work
hybrid cradle
did you try it with dlc or cdlc
whole cloud
Don't remember. But all DLCs work the same there
night mulch
whole cloud
Immediately giving me some results.
It is hitting a breakpoint that I've set mon...
YAY!!!!
Immediately giving me some results.
Just wanna make sure, does this mean it triggered the infinite download loop on steam for you?
whole cloud
eternal kraken
i did some more testing and run YAAB with the new versions v08(2368) & v07(2344)...
Okey i got one problem.
The multithreaded AI visibility checks.
Previously the game would only run them in main thread, but also check against a time limit. If time is up it stops and does the rest next frame.
The new one spreads them over all worker threads, so it gets alot more done in shorter time. But the time limit was removed.
In that mission, it does 628 in a single frame. Out of which 46 are in main thread.
With the time limit, it would only do about 15 of them.
So now it gets them done alot quicker, doing 628 in 4ms.
But previously it would've aborted after like 2ms or less.
That makes the frame time spikey.
Problem with the multithreading is, if I split it in batches and check remaining time between each batch, we leave alot of performance on the table because we need to stop all the processing, check if we want more, and then spin up all the processing again.
I can easily limit it to say, only do 128 per frame. But we don't know if it'll be 128 very cheap, or 128 very expensive checks.
I can give all threads a time limit, the same limit 🤔 But thats so much effort :U
A bit later it even does 952, and from that 62 in main thread. Over 6ms.
whole cloud
night mulch
> Immediately giving me some results.
Just wanna make sure, does this mean it tr...
no. I got some results, but none that actually show a problem
night mulch
no i mean did you check steam client itself, does it start a download
whole cloud
night mulch
no i mean did you check steam client itself, does it start a download
Ah, no.
Ah it is trying to download something right now.
I'm running a mission inside eden
whole cloud
But I have no lag being caused by it
night mulch
ok right so i have to explain something about the weird behavior of this bug relating to profiling exe
night mulch
whole cloud
But I have no lag being caused by it
try stopping it, does it restart? from steam
whole cloud
It says "being aborted" for like 5 seconds, but doesn't abort. And then its back at "download starting"
night mulch
https://gyazo.com/6432bcf3433d952d1e808e58a7c13380 it should look like this, in the old client
 night mulch
whole cloud
It says "being aborted" for like 5 seconds, but doesn't abort. And then its back...
night mulch
whole cloud
It says "being aborted" for like 5 seconds, but doesn't abort. And then its back...

so we have repro
empty goblet
night mulch
https://gyazo.com/6432bcf3433d952d1e808e58a7c13380 it should look like this, in ...
restart STEAM client, if that doesn't help change download location and restart it again
oh wait, Arma 3 triggers it ? woah , i seen that and get it on other games too , usually games with workshop
night mulch
empty goblet
restart STEAM client, if that doesn't help change download location and restart ...
that doesnt work bro, this issue its been happening for more than a year, and we think its related to compositions, you can look up the discussion form here #perf_prof_branch message
empty goblet
there are several issues, one of them is no internet connection, unfixable until restart
the other one is failure to write / delete or SSD/HDD/controller disk error
night mulch
there has been numerous reports of people getting this bug after subscribing to compositions
and the issue begones when they unsubscribe from all
with the composition collection experiment dedmen also was able to reproduce this bug as seen above
empty goblet
see STEAM directory (where steam.exe is) if there is file named NTFStransationfailed
night mulch
negative
empty goblet
let's hope he can figure it out, but definitely seen similar problems caused to/with other steamworks workshop capable games
night mulch
night mulch
ok right so i have to explain something about the weird behavior of this bug rel...
ok so i will explain about this
When running the normal performance branch exe, the download loop will start a few moments after starting the game, and it will trigger the lag spike, just like seen in this example video #perf_prof_branch message
However when running profiling exe to do the capture frame, the bug behaved differently, it sometimes trigger after game start, but most of the time it doesnt, instead it will trigger if i disconnect my internet, and then reconnect again. Steam will then do the infinite download loop and this time it will lag spike
So if possible can you try these cases?
- running game with normal and performance exe instead of profiling
- running with profiling, but disconnect, and then reconnect to internet
one other variable that might be connected would be the privated compositions... those i cannot include in the collection, but im still subscribed to them
So that would also be worth investigating, and could be replicated by creating a new composition and privating it
night mulch
empty goblet
let's hope he can figure it out, but definitely seen similar problems caused to/...
If Arma3 dev cannot figure it out or the problem is on steam's side, Is it possible for BI to maybe report to steam about this issue?
otherwise it seems this problem will never go away 😢
 obsidian relic
empty goblet
restart STEAM client, if that doesn't help change download location and restart ...
obsidian relic
empty goblet
restart STEAM client, if that doesn't help change download location and restart ...
only fix for me was unsubscribing from compositions, otherwise every time I would start the game I would get steam start downloading in "loop" like above which would stutter my game for 10min or so, got fed up and removed all compositions and issue disappeared
iirc I reported it few yrs back(not a great report but as we can see, it was supposed to be issue of too many compositions, ~300 iirc)
found- https://discordapp.com/channels/105462288051380224/141866231362879488/897498503838842942
 stray slate
Have you got any answers? I've got same issue with you. https://imgur.com/pQwed2Y
I'm using profiling branch as well. Could it be a problem?
whole cloud
There are no answers. Yes its a known problem
empty goblet
stray slate
Have you got any answers? I've got same issue with you. https://imgur.com/pQwed2...
it reminds me on issue with culling vs view frustrum (many years ago)
stray slate
I just shifted to main branch and it seems no more flickering "for now"
Happy to see it in prof build not in main branch..
empty goblet
stray slate
Have you got any answers? I've got same issue with you. https://imgur.com/pQwed2...
just q, the group icon, is inside rendered view when that happens or outside ?
stray slate
Well since I came back to main branch now, I can't do further study but it happend even in bare eyes. (Not in zeus, no group icon)
empty goblet
ok, that was another bug years ago, so scratching off
stray slate
but feels like it happend in specific angles.
In other angles, flickering stopped. as video
knotty wraith
I caught this when I missed several parallel calls to equipment in my shopping store.
here, too, it seems that the unit is asking for its equipment for some reason, even when it’s dead
whole cloud
whole cloud
Okey i got one problem.
The multithreaded AI visibility checks.
Previously the ...
ok fixed.
I find the time of when it should stop. And every worker checks current time, and just aborts if time runs out.
With time limit of 5ms.
It can finish 935/1389 visibility checks.
While main thread only does 94. So I get about 10 times as much done (on my cpu), and still respecting the time limit now.
knotty wraith
at the same time it flickers when you move towards an object
stray slate
knotty wraith
at the same time it flickers when you move towards an object
Yes. I felt that too.
whole cloud
Though. Tbf. The time limit is set to target the game running at 20fps so.. Not the best... But whatever
knotty wraith
If you don't move it doesn't flicker
stray slate
I'm not understanding technical details.. but can I regard this as 'accident' while trying to improve arma 3 performance? 🙂
whole cloud
Yes. Its a known issue that will be fixed later, probably. I know where the fault is, but not why.
stray slate
Great. Happy to see it still developing. Thank you for your jobs.
empty goblet
whole cloud
ok fixed.
I find the time of when it should stop. And every worker checks curren...
ooh , does this also ease/fix that problem of the AI vis checks from turrets ? (the one you tackled with the limiter like 1-2 years ago ? )
whole cloud
That is in a different spot.
But most of that is also now fixed by multithreading yes
knotty wraith
does it make a difference if the AI is far within the map or outside the map?
whole cloud
everything outside the map is bad, because of generated terrain
On the steam downloading issue.
I... didn't notice this before.. But steam content downloading code, is spamming my log..
 knotty wraith
whole cloud
everything outside the map is bad, because of generated terrain
knotty wraith
whole cloud
everything outside the map is bad, because of generated terrain
for some reason I thought it was because of the coordinates
whole cloud
The terrain is split into a big grid.
If something wants to know what is nearby, it only needs to look at the grid cell and gets maybe a handful of objects to check.
But, everything outside of the terrain, gets put into the grid cell at the edge. So the edge cells get very large with many objects inside them, and all the objects outside think they are near eachother and need to check all the others
knotty wraith
but I have one question that gives rise to a problem: the player flies on a plane - an enemy AI plane spawns on his balance... An air-class missile has a damage radius of 12+ km... The AI spawns, immediately launches the rocket - the player is hit... I need to at least give the aircraft AI + 4 km to 12 so that the player has the opportunity to react
such distances in any case entail the placement of AI outside the territory of the map
 cold vale
Asking this here since I've not been following things for a bit and may have missed it, the hotfix that was released for 2.18 on the main branch is working in that we can mix main branch and profiling branch users on the same server now or no?
whole cloud
cold vale
Asking this here since I've not been following things for a bit and may have mis...
You can mix users that have the hotfix.
There might still be users that disabled automatic updates and don't install the hotfix. They would be bad
whole cloud
knotty wraith
but I have one question that gives rise to a problem: the player flies on a plan...
Yeah I don't know how to solve that.
cold vale
whole cloud
You can mix users that have the hotfix.
There might still be users that disabled...
Excellent, ty
knotty wraith
whole cloud
Yeah I don't know how to solve that.
there were definitely no losses in this before or we didn’t feel it
I really appreciate your work and am already working on options for how to rethink and deceive this, but I would really like there to be no such restrictions
or give the opportunity to turn it off situationally
whole cloud
knotty wraith
there were definitely no losses in this before or we didn’t feel it
I really app...
Your issue is also related to #perf_prof_branch message
knotty wraith
out of interest, such a question - commands like
https://community.bistudio.com/wiki/disableAI
https://community.bistudio.com/wiki/disableRemoteSensors
can influence this factor?
whole cloud
remoteSensors no.
AI target/autotarget could
Mh looking at it, I think it doesn't.
We might need to add a new disableAI for it to do that. And it would then be per unit. But I think adding that isn't worth it. Now that it runs so much faster
whole cloud
whole cloud
On the steam downloading issue.
I... didn't notice this before.. But steam conte...
And. Its the filename stuff I found yesterday.
If it cannot retrieve the filename for a workshop item. (Comment says it happens due to a bug in steam) it will request downloading them to get their name.
This was a workaround to a steam bug with missions.
Lets look at the filenames for compositions shall we?
What fileName, do compositions have..
Oh...........

Yeah unlike mission pbo's (Which are one file, with a name)
Compositions are just a folder with two files inside it. There is no name for a primary file inside them.
So if I just disable that bugfix for compositions. This issue should be fixed..
Can someone find me the FT tickets for this downloading compositions issue?
Because we don't want to miss when a user subscribes to new content. We re-fetch the list of subscribed items, every 10 seconds.
And every time the result arrives, we find that filenames for compositions are missing. And schedule a download for every composition.
Every 10 seconds, triggering download for hundreds of compositions. Not good.
This 10 second checking though, is only enabled if you
- Open the mission selection list
- Open the mission upload to workshop menu
- Have the Eden editor open and have its right side tree view switched to the custom compositions tab.
So.. this should not have been affecting anyone in main menu, or when playing missions.
I don't know why it got stuck trying to download, when it only would trigger once usually..
Notably, I forgot to add this for Zeus. But afaik zeus cannot handle mid-game composition subscribing anyway 🤔
Probably something to fix.. if someone wants to make a feature request ticket for it.
night mulch
whole cloud
So if I just disable that bugfix for compositions. This issue should be fixed..
 restive pilot
whole cloud
This 10 second checking though, is only enabled if you
- Open the mission select...
restive pilot
whole cloud
This 10 second checking though, is only enabled if you
- Open the mission select...
Speaking of main menu, can you add a scripting command to detect if a mission is running, in pre init? (i.e. not being in 3den/main menu/etc.)
I once found a solution using displays but it's not reliable
night mulch
The day this issue gets fixed would be one of the greatest days in arma history 😭🙏
night mulch
whole cloud
Can someone find me the FT tickets for this downloading compositions issue?
i dont think theres any, just some forum and reddit threads, and some messages on discord
 cerulean nacelle
whole cloud
Can someone find me the FT tickets for this downloading compositions issue?
cerulean nacelle
whole cloud
Can someone find me the FT tickets for this downloading compositions issue?
found this one https://feedback.bistudio.com/T171116
night mulch
whole cloud
This 10 second checking though, is only enabled if you
- Open the mission select...
does it not verify all subscribed compositions when the game starts?
also what is behavior for subscribed but privated compositions, since they dont show up in game
and why subscribed but privated scenarios still show up and is downloadable and playable but compositions are not
heavy vortex
whole cloud
ok fixed.
I find the time of when it should stop. And every worker checks curren...
The previous time limit was 2ms, right? Doesn't that mean perf will now be worse if the game was spamming the checks for bad reasons?
whole cloud
The previous time limit is the same time limit as it is now
heavy vortex
Ah ok.
night mulch
whole cloud
This 10 second checking though, is only enabled if you
- Open the mission select...
Do i need to make new FT ticket as well? i can also link the video explanation of the issue if needed
heavy vortex
whole cloud
Though. Tbf. The time limit is set to target the game running at 20fps so.. Not ...
Actually this might be worth addressing, because we found it was easy to hit the 20fps cap by flying an AI heli over a few squads of troops.
I guess it's like "did our position change by enough? Ok, redo all the vis checks".
gusty viper
What would time limit for vis checks be if targeting 60 fps? And how many checks can it then do?
whole cloud
night mulch
Do i need to make new FT ticket as well? i can also link the video explanation o...
no. I just want them so I can close them
whole cloud
gusty viper
What would time limit for vis checks be if targeting 60 fps? And how many checks...
The actual time limit, depends on how many fps you have.
How many checks it can do, depends on how expensive the checks are (how long distance, how many objects in the way or around that area) and how many cpu cores you have.
Can't really put a number on it.
The time things get a priority, but there doesn't seem to be any indication of what the priority means, and how the calculation into actual time works. And I won't figure that out.
night mulch
whole cloud
no. I just want them so I can close them
nice cant wait for the fix!!
whole cloud
whole cloud
The actual time limit, depends on how many fps you have.
How many checks it can ...
Like, I run at 50fps.
That gives the time limit 37ms to do AI visibility.
But it only needs 7
 knotty wraith
childish question - why in the game lobby the video card is loaded at 99% and therefore the FPS shows the one you can only dream of... what is it about this scene on the splash screen that it can fully correctly use hardware resources 🙂
whole cloud
knotty wraith
childish question - why in the game lobby the video card is loaded at 99% and th...
There is no simulation, no AI, basically no sound. There is nothing going on.
empty goblet
ok so what happens if someone runs at low fps low core count ie 20 on 4 , will the limit cause some failures in AI behavior ?
whole cloud
no
heavy vortex
Anecdotally, if your server FPS is low then AIs react more slowly, but I haven't seen a total breakdown.
whole cloud
Does it have anything to do with #perf_prof_branch ?
oh no, physx is so slow!

Don't fret! For Makephysxabitfasterbythrowingsomemorethreadsatit-man is there for you!
 heavy vortex
Really not sure how this is going to play out when server providers put 10 servers on the same box :P
whole cloud
Well hope they set cpuCount appropriately
heavy vortex
Kinda surprised that they didn't start using -maxmem more when the default behaviour changed. I don't think they watch too closely.
knotty wraith
whole cloud
Does it have anything to do with <#105466848958513152> ?
I’m embarrassed to ask, but where should I go if not here so that script commands will be better in the future?
whole cloud
If its a bug or feature request, a feedback tracker ticket. If its a scripting question, #arma3_scripting.
knotty wraith
I wrote - zero reaction
light cargo
whole cloud
If its a bug or feature request, a feedback tracker ticket. If its a scripting q...
wait, isnt bi taking bug/fr over chat too?
light cargo
knotty wraith
I wrote - zero reaction
maybe be patient please
light cargo
heavy vortex
Really not sure how this is going to play out when server providers put 10 serve...
those are probably going to go the virtualization route or learn to use -cpucount
heavy vortex
You can't expect reactions. Too many issues with Arma, and everyone has different ideas about what's important.
whole cloud
knotty wraith
I wrote - zero reaction
If you don't get a reaction, that means no-one wants to react. Which is very possible.
knotty wraith
heavy vortex
You can't expect reactions. Too many issues with Arma, and everyone has differen...
oh) smells like lobbying
whole cloud
I have also adjusted the game's fps target from 20 to 50.
So the AI checks now don't get to just drop the game down to 20 anymore.
light cargo
nice
eternal kraken
whole cloud
I have also adjusted the game's fps target from 20 to 50.
So the AI checks now d...
miracle worker
light cargo
single-handedly doing bi qol work, volunteering?
heavy vortex
I guess the resulting AI behaviour will be similar-or-better given the multithreading, although I still think it might be worth a look at why some cases are spamming checks in the first place.
light cargo
agreed
heavy vortex
Maybe dangerously close to looking at actual AI code :P
whole cloud
@night mulch you reported repeated lag spikes due to steam downloading compositions though.
But I cannot see that. I can see one download at game start. And then only in mission list or when in eden with the compositions tab selected.
But I'd think you didn't test it in exactly such a situation? It certainly won't affect actual gameplay. And also in main menu it should stop the lag pretty quickly
night mulch
whole cloud
<@441633826826092544> you reported _repeated_ lag spikes due to steam downloadin...
in my case and several others i've talked to and seen, the lag spike starts from game start and continues for a certain amount of time (variable), @obsidian relic reported lag spike ensues for around 10 mins, while in my case it can go up to 15-20 mins, afterwards it will stop
however, if i go to scenarios and play a workshop mission, the infinite download loop will restart again
 stoic void
whole cloud
I have also adjusted the game's fps target from 20 to 50.
So the AI checks now d...
stoic void
whole cloud
I have also adjusted the game's fps target from 20 to 50.
So the AI checks now d...
AI heavy mission on a server can go to like 30 frames easily, but a mission still remains mostly playable and AI responsive enough.
Would an FPS target of 50 dumb the AI down in those cases? Or is the performance gain big enough for that to be not a concern?
Also is that FPS target you adjusted a more global thing? Or just for those AI checks?
night mulch
if i disconnect internet connection, lag spike will stop, but when reconnected, lag spike starts again, until that certain amount of time has passed, after which it stops
heavy vortex
night mulch
in my case and several others i've talked to and seen, the lag spike starts from...
Might be regional, like it has a dependence on steam server performance.
night mulch
heavy vortex
Might be regional, like it has a dependence on steam server performance.
that, or it might be related to amount of subscribed compositions i.e more subscribed -> longer lag spikes due to more things downloaded
if the steam redownloading every composition hypothesis is true
whole cloud
stoic void
AI heavy mission on a server can go to like 30 frames easily, but a mission stil...
it is global.
There is also a global minimum time that AI will get.
In the cases that I've seen, thats enough to get all checks done.
If you have 12 cpu cores, the checks will now run about 10x faster.
While with my changed fps limit, the time available to do the work will be about 0.25x
And also the work is spread over multiple frames. Even if it ends up getting split, it will probably be done with stuff by the second frame.
Whereas previously it might've needed 8 frames to do it. I think overall it will still be faster
stoic void
Might be a useful value to have as launch parameter. Or have it be lower for dedicated by default. Since lower frames on a dedicated server are more acceptable.
But i am very interested of the results of all this regardless.
gusty viper
whole cloud
I have also adjusted the game's fps target from 20 to 50.
So the AI checks now d...
Sounds like the best solution. Why 50 though? Is it because max server fps?
fickle geyser
If you do not use the cpu count param is there any log entry about how many cores game decided to use?
PhysMem: 32 GiB, VirtMem : 131072 GiB, AvailPhys : 20 GiB, AvailVirt : 131068 GiB, AvailPage : 17 GiB, PageSize : 4.0 KiB/2.0 MiB/HasLockMemory, CPUCount : 12
I guess this?
heavy vortex
Yeah.
Oddly enough I don't think it tells you what memory cap it's using.
probably should.
whole cloud
gusty viper
Sounds like the best solution. Why 50 though? Is it because max server fps?
It is because thats what I deem acceptable for players.
I didn't consider server, I can make a special case to lower it for servers
heavy vortex
I like 50 for servers. Given that it's doing more checks at 50 now than it was at 20 before.
whole cloud
That system is designed to spread load over multiple frames.
if it can finish all in one frame, then it will do none the next frames.
It just makes the fps alot more inconsistent and spikey. Which is when you want to see smooth video. Server doesn't care about spikey.
heavy vortex
In practice it's not just smoothing spikes but acting as a rate-limiter for the cases where the checks are being spammed.
whole cloud
Even at 20fps target, the rate-limiter is still there
heavy vortex
Yeah, but now the rate-limited case is 20fps rather than 50fps :P
In the cases I've seen, I doubt the spam is useful versus other things the server could be doing.
Although there might be an issue with excess visibility checks flooding out the useful visibility checks.
vivid rune
but you don't know which are the "useful" one before you are do the processing.
heavy vortex
Well, a heli pilot shouldn't be checking against every unit every frame. I don't know if that's what's happening but I suspect it's something like that.
whole cloud
They are checking visibility to possible targets, which are in sensor range
AI cannot see, without looking.
gusty viper
So essentially the change from 20-> 50 fps gives the engine less time duration overall to do AI checks, but with MT now in place, more AI vis checks will happen regardless.
And the change makes it so that engine fps will not be dragged down to 20 due to AI vis checks only.
whole cloud
That is the plan
gusty viper
Nice
Is there any chance this internal rate limiter could be exposed to eg. the profile config file? Would love to set it to 60 and have the engine really try to stay at that rate.
whole cloud
No
light cargo
whole cloud
<@441633826826092544> you reported _repeated_ lag spikes due to steam downloadin...
what if you applied connection throttling or have a lot for the game to process?
light cargo
and try again, could/should be able to reproduce the issue possibly
yeah def could be a steam issue or a connection problem
woven loom
Just a data point for client, with the perf build as of last night PST, performance in YAAB was about identical to the perf build back in march and 4% faster than 2.18. No crashes or anything. Hyperthreading flag disabled.
vivid rune
woven loom
Just a data point for client, with the perf build as of last night PST, performa...
May I ask what CPU GPU and FPS you have? Do you have disabled VSync at the tests?
woven loom
I do not have vsync disabled but my monitor refresh is 165 Hz so it mostly doesn't matter when comparing runs to my own previous runs. It does hit the fps cap briefly on some occasions but we're really not interested in seeing if FPS briefly spikes to 300 fps or whatever.
CPU - 7800X3D
GPU - 4070 Ti
FPS - ~125 avg with perf binary, ~119 fps with stable.
I use mimalloc_v214_lock_pages.dll from https://github.com/GoldJohnKing/mimalloc/releases/tag/Arma-3-v2.1.4-20240424
midnight oyster
woven loom
I do not have vsync disabled but my monitor refresh is 165 Hz so it mostly doesn...
Do you conduct these YAAB tests without a mod pack loaded (100% vanilla)?
 clever roost
knotty wraith
I wrote - zero reaction
clever roost
knotty wraith
I wrote - zero reaction
Man I got a ft ticket to add more radar stuff, but importance is subjective
woven loom
midnight oyster
Do you conduct these YAAB tests without a mod pack loaded (100% vanilla)?
Yes
I'm running basically ultra settings but press S to load the YAAB standard settings.
Running ultra settings with a ~6k view distance, I get 60-70 fps iirc
Using standard preset + YAAB standard will result in much higher fps but also useless for me since I don't play like that. But it might be useful for comparisons.
spiral pond
Dedmen would it be feasible to expose scope durations via a sqf command akin to diag_fps in the profiling build for more in depth performance graphs (ingame)? (ie all from main thread up to 2/3 levels or > 0.1 ms, or a predefined set of scopes)
this would also allow getting a better idea how different missions/game modes/servers relate to the relevant scopes
whole cloud
spiral pond
Dedmen would it be feasible to expose scope durations via a sqf command akin to ...
diag_sqf? what is that?
What do you mean, reading out the performance data in script? no.
Adding scopes in script without ASP? possible
quaint flame
The latter is what I asked for yesterday. I totally forgot to send an example yesterday
spiral pond
doh.. typo. diag_fps - so instead of "just fps", the level below - diag_mainFrame/diag_getFrameData to return an array with said limit set of scopes from main frame with their duration
put differently similar to diag_captureFrame, yet to return the data to sqf land (only a small subset to keep the performance impact limited)
 worldly badge


 vivid rune
- right click on your Arma 3 in the steam client (library)
- properties
- betas
- switch to profiling
yes, you switch the branch. Like the stable were you get every time the latest version, so here, too.
 molten berry
Hey, I noticed that while in performance branch, the game still runs the arma3_x64.exe instead of the arma3profiling_x64.exe. Are these two the same on profiling or am i supposed to rename the profiling exe to replace the arma3_x64.exe like back in the day when it was just performance executables?
whole cloud
If you want profiling, you need to replace the exe
spice dirge
arma3_x64.exe is performance binary. Arma3profiling_x64.exe is profiling binary
midnight oyster
spice dirge
arma3_x64.exe is performance binary. Arma3profiling_x64.exe is profiling binary
I've done this incorrectly for 900 hours of Arma 
 void badger
Do we have any info on the bug with respawnOnStart where the respawn screen may sometimes not show?
Can't upload the rpt here but basically the game throws a huge fit over issues in showRespawnMenuPosition and related scripts
heavy vortex
Is it specific to the profiling branch?
void badger
It is infinitely more likely to happen when on the performance build, yes
Even in 2.16
 empty plover
maybe related https://feedback.bistudio.com/T183228
 crystal patrol
midnight oyster
I've done this incorrectly for 900 hours of Arma <:meowfacepalm:7873859971083141...
crystal patrol
midnight oyster
I've done this incorrectly for 900 hours of Arma <:meowfacepalm:7873859971083141...
No worries brother. I have also done this incorrectly for about the same amount of time. 🥹
opal hound
Profiling exe still includes the performance changes, no? It just also has some profiling tooling extra
whole cloud
yes
woven loom
It's apparently slower though iirc
ashen helm
which perf version was the last one without the annoying blinking of units and stuff? I thought I can handle this but I am about to have a seizure
opal hound
latest version wasn't doing it for me, maybe something specific causes it?
ashen helm
No idea. People been reporting it, I think Dedmen said he knows about it but no fix so far. Mods, no mods, no custom parameters, autodetected settings, unit equipment just blinks or outright moves away from dead bodies.
inland dew
v5 should be ok
when i reported blinking, it was on 30th of October, so after installing v6 that was released that same day
unless it was there even before v6, but i haven't paid attention
plain trout
the issues came with v6 for some people, but v6 was the one that had the actual performance enhancements
clever roost
Man I’m getting 120 fps when I normally get 40, what ever your are doing, it’s great
 flat nebula
Hey all, real quick, is the Perf branch known to cause some crashing etc?
naive osprey
Potentially, if you're running the latest and are crashing, send the crash dumps to dedmen
flat nebula
I keep getting 0xC0000005 - STATUS_ACCESS_VIOLATION, just want to check if this is known from perf branch before I do something drastic
flat nebula
naive osprey
Potentially, if you're running the latest and are crashing, send the crash dumps...
yeah, I'm running the latest. I'll send the log next time I crash and I'll downgrade or switch back to public branch. Thanks!
autumn timber
You need to provide more information/logs. 0xC0000005 literally means "something bad happened"
flat nebula
I will next time I crash
I just wanted to ask if this was a common thing from the performance branch, that's all
opal hound
crash dumps are in your LocalAppData/Arma 3 folder
they will be there now, you don't explicitly need to generate them
autumn timber
flat nebula
I just wanted to ask if this was a common thing from the performance branch, tha...
Well, no "something bad happened" should be happening in general 😉
opal hound
.mdmp and associated .rpt usually
midnight oyster
Ran YAAB with my oppressive modpack (360 mods) on the real latest profiling build, and it scored about the same as the main branch .exe .... take this with a grain of salt though given the modpack situation
How to you access previous versions of the profiling build .exe?
 real creek
like previous from this version? or really older ones? You can get up to 214 from the google drive links
gritty wasp
ashen helm
No idea. People been reporting it, I think Dedmen said he knows about it but no ...
Just use stable
 silk pewter
midnight oyster
Ran YAAB with my oppressive modpack (360 mods) on the real latest profiling buil...
silk pewter
midnight oyster
Ran YAAB with my oppressive modpack (360 mods) on the real latest profiling buil...
a truckload of salt will do 😄
test vanilla and report back, anything else is irrelevant 😉
 spiral thicket
Hey guys, just learned about this discord chat, I'm coming from nanner's optimization guide as a baseline and now realized my sins reading through some of these suggestions. Is the best 'baseline' recommendation for the average player to turn on profiling and set default? (for milsim, we get a lot of new guys etc). Is there a link to something considered the current 'standard' to set?
vivid rune
spiral thicket
Hey guys, just learned about this discord chat, I'm coming from nanner's optimiz...
Before you switch to profiling keep in mind that this branch is cutting edge in terms of development. You have to deal with unstable behavior of the client.
quaint flame
You want to run The performance binary for best performance.
spiral thicket
vivid rune
Before you switch to profiling keep in mind that this branch is cutting edge in ...
of course, I've been playing my whole life. I'd do anything 🥴
spiral thicket
spice dirge
arma3_x64.exe is performance binary. Arma3profiling_x64.exe is profiling binary
wait im seeing this now
vivid rune
spiral thicket
have I been trippling down on my sins?
Is having 'profiling' in the top left on the launcher not enough?
you're telling me that arma3_x64.exe that launches from the profiling A3Launcher isn't the right one and I've never actually tried the profiling branch? 😂
or wait it still includes the performance changes in the x64
analog acorn
The Perf/Profiling branch contains 2 alternative binaries. The default is the Performance binary, and you have the option to choose the Profiling binary. They are the same except that the Profiling binary includes additional options and logging for recording performance information.
spiral thicket
understood thank you.
plain trout
If you select performance branch on steam your exe gets replaced. You don’t need to do anything
If you want to use profiling you will have to download it. Read through the channel how and what you can do with it
spiral thicket
I see, I'll stick to performance since I'm trying to optimize for myself + the average joe
thanks for the explanation
I've also seen this reddit post talking about lossless scaling -- I've never once experimented with this but I assume it is entirely unhelpful?
otherwise I'll dig deeper etc
analog acorn
plain trout
If you want to use profiling you will have to download it. Read through the chan...
If you have the Perf/Profiling branch selected on Steam, you do not have to do anything extra to download the profiling binaries. They are included in the same branch, they're just not active by default. All you have to do is switch them in the game files.
The manual download is only needed if you don't want to use the Steam branch or want to use a specific previous version rather than the latest.
real creek
spiral thicket
I've also seen this reddit post talking about lossless scaling -- I've never onc...
Scaling/frame gen is not a panacea, your mileage may vary. Don't see it as optimization but it's worth giving it a shot esp. If you wanna run 4K
light cargo
analog acorn
If you have the Perf/Profiling branch selected on Steam, you do not have to do a...
note: the manual downloaded is needed if you want to run a cdlc server for instance, or its also useful if you're using the macos compatibility branch or a legacy previous version for testing
light cargo
spiral thicket
I've also seen this reddit post talking about lossless scaling -- I've never onc...
not recommended because of the potentially high performance costs.
performance branch is primarily boosting servers by a lot, clients, not so much unfortunately
best is use 100% scaling or lower (do latter if you have the capacity to ai upscale it back to the resolution) lower the display resolution if you want it to not look blurry due to the raw upscale
analog acorn
light cargo
note: the manual downloaded is needed if you want to run a cdlc server for insta...
so.......if you don't want to use the Steam branch or want to use a specific previous version rather than the latest. :U
light cargo
analog acorn
so.......`if you don't want to use the Steam branch or want to use a specific pr...
yeah i know, i was clarifying the specific use cases for other people :P
light cargo
hey, if i want to load profiling exe with the launcher, how would i do that? i cant specify exe name unless i use battleye
analog acorn
Rename the default (perf) exe to something else, and rename the profiling exe to the default name.
midnight oyster
spiral thicket
I've also seen this reddit post talking about lossless scaling -- I've never onc...
After about 100 hours of using Lossless Scaling in Arma, I can say this:
- if you can hit a 1% low of 60 FPS in your Arma session, you will be able to use Lossless Scaling with minimal frame gen artifacts (randomized loss of image quality) and it's an amazing experience.
- if you can hit a 1% low of 30 FPS in Arma, Lossless still works but better run it at 2x only because even at 2x the artifacting gets distracting at 30 FPS.
tl;dr: don't use Lossless if you can't even get a consistent 30+ FPS
spiral thicket
could you pass along your preferred settings screenshot? DM is fine, but would be appreciated. I just bought the software today to limittest
I have a 4080 so anything I can pass off to the GPU is a benefit
was going to follow here: https://steamcommunity.com/sharedfiles/filedetails/?id=3249548178
sorry if this is in the wrong specific chat
I did test the performance branch + mimalloc lock pages (had to bypass and add my own group policy for windows home) and tested in KoTH (im not familiar with how to benchmark within arma) with solid results. I am worried the lock pages policy introduced some stuttering to other games tho, might have to revert.
heavy vortex
Shouldn't do unless those games also attempt to lock pages. I don't think it's common behaviour.
spiral thicket
make installing the policy data to my windows home (not originally there) made some issues
im not quite sure -- did a fresh install of graphics which seemed to clear up most of the stuttering
but thanks for clarification on the other games, Im just following guides and reading insteading of fully understanding lol
heavy vortex
It's allowing a feature rather than forcing a behaviour change.
woven loom
I'm curious why any of this is required, you put the malloc in an Arma subfolder and the launcher launches it from there. I didn't have to do anything with group policy. Only Arma 3 should be using that malloc
real creek
Frame gen can be cool but I'm really sensitive to latency so I rarely turn it on unless the game is both slow-paced and gets in the 70-90 fps range
If you have an AMD card you should look into the newer frame gen cause I think it's not supported on lossless scaling
ashen helm
or just don't use framegen because it's ass  what's the point of having 3 frames per milisecond when 33% of them is fake, triple buffering should at least not introduce the delay to this extent
woven loom
Using frame gen when CPU limited seems pretty useless to me anyway
 trail elm
hey any way to verify in-game that you are indeed running the perf exe? I'm suddenly struggling with FPS again and am no longer getting the flickering bug, so I'm beginning to doubt it's actually running right
analog acorn
The build number is listed in one of the corners of the main menu, and also when the ESC menu is open. You can compare it to the build numbers in the changelog to see where you're at.
Also, if you have the perf/prof branch selected on Steam, then you must be running one of those, because the stable branch exe gets replaced.
 minor geode
spiral thicket
I've also seen this reddit post talking about lossless scaling -- I've never onc...
minor geode
spiral thicket
I've also seen this reddit post talking about lossless scaling -- I've never onc...
For what it's worth, I've been trying the LS app and it hasn't seemed to help, my personal anectdotal evidence with various FPS counters and general game performance.
- I have a OC'd i9-9900k, 3080 Ti and 64 GB of RAM (I do video etc)
- I've run vanilla and oppressively modded and see little difference in FPS.
- I've run YAAB and seen very little difference
- Tested with both full screen windowed with no scaling and 1920x1080p (native is 2560x1440) with scaling and FPS limited to 72 fps at X2.
- I run prof/perf build exclusively
real creek
ashen helm
or just don't use framegen because it's ass <:shrug:769591514615513110> what's t...
Smooth
minor geode
I was told the "unit flickering" bug was a thing right now with the 2.18 prof build, if I roll back to 2.16 until it's patched again, will I have any issues or should I just run the stable build until another patch comes out for prof? I want the 2.20 multithreading to work so bad... lol
analog acorn
You should not go back to 2.16 anything, because the current stable branch release is 2.18(hotfix). Your 2.16 game would not be multiplayer compatible.
(and any mods or scripts that use 2.18 features would break)
minor geode
So deal with the flickering or run stable, got it 
trail elm
analog acorn
The build number is listed in one of the corners of the main menu, and also when...
forgive me if I'm being stupid but the build number listed in my main menu is 2.18.152374, and the build number dedmen last posted was 2.18.152368. I am using the profiling branch on steam, but wouldn't this difference mean that indeed i'm not running the perf exe?
restive pilot
You're running a newer version of A3 than Dedmen's?! 😅
Congratulations you just invented a time machine! 
Anyway joking aside you probably are running performance branch and Dedmen posted the wrong version number (whatever you're running, it's definitely not the stable branch because its build number is 152302)
trail elm
weird sass aside thank you, deleted my exe's and am redownloading to see what happens, might just be my pc being old which is leading to lack of gains
 patent dome
trail elm
forgive me if I'm being stupid but the build number listed in my main menu is 2....
patent dome
trail elm
forgive me if I'm being stupid but the build number listed in my main menu is 2....
Steam has the correct version for v8, it is the same as on the google drive: https://drive.google.com/drive/folders/1SUIKdEHFkp2TGzgfCvEmNaLnTyPzgqD0
As Leopard said, the post has the wrong version number. Probably caused by a newer build going out at the last minute and the changelog not being updated to reflect that or some minor fix that didn't get a changelog going out afterwards.
gusty viper
Just want to express again that the MT optimizations really help the game’s performance. It possible now to play AI Warlords at a smooth 60 fps. Amazing!
midnight oyster
spiral thicket
could you pass along your preferred settings screenshot? DM is fine, but would b...
I'll gladly hop in a Discord call and show you all I know? Don't mind the LS haters because they are CPU-limited 😂
spiral thicket
Awesome man I'll shoot you a DM later, I'll take a first pass with this guide to see if I notice anything so I have some testing done
midnight oyster
minor geode
For what it's worth, I've been trying the LS app and it hasn't seemed to help, m...
LS is a framerate multiplier for frames drawn on the screen, not rendered on the GPU. If you've been measuring LS impact by typical frame rate counters, you're not doing it right
naive osprey
patent dome
Steam has the correct version for v8, it is the same as on the google drive: htt...
Iirc dedmen launched v8 at 152368, then fixed the core count/hyperthreading crash and overwrote v8 to 152374 without updating the changelog
dire wave
midnight oyster
LS is a framerate multiplier for frames drawn on the screen, not rendered on the...
LS has a built in frame counter
midnight oyster
dire wave
LS has a built in frame counter
Yes, but I dont think that was the one they were referring to
minor geode
midnight oyster
LS is a framerate multiplier for frames drawn on the screen, not rendered on the...
I realize what it does, my point ultimately is that it doesn't improve Arma's performance.
"counted frames" and actual performance aren't necessarily the same, sure it will boost the number of frames and artificially increase the FPS, but at least for Arma the game does not perform any better, at least in my tests.
Is the "Profiling Branch Companion Mod" on Dedmen's Steam workshop still valid? Does it actually do anything?
midnight oyster
minor geode
I realize what it does, my point ultimately is that it doesn't improve Arma's pe...
I think you are missing the point - it was never a tool to boost Arma's true performance, but instead a tool to improved perceived performance. With that said, I am sorry if you misunderstood it as such
minor geode
midnight oyster
I think you are missing the point - it was never a tool to boost Arma's true per...
Of course it doesn't improve any game's true performance, it's injecting artificially generated frames, but it didn't improve the perceived performance either, I misspoke, it's late lol.
whole cloud
minor geode
Is the "Profiling Branch Companion Mod" on Dedmen's Steam workshop still valid? ...
nothing in there
restive meteor
Since the last stable update I'm experiencing a lot more Desync while flying AFM. Or rather, other players on the server are seeing me upside-down when landed. Doesnt happen when SFM is enabled. Has somebody else seen similiar things and were maybe some issues already addressed on the performance branch? Thanks
 oak aspen
Anyone getting issues with monitords?
Server is running the profiling branch, monitords doesn't work but normal monitor works on client and posts a single line to the server console with a new JIP section. FPS and Network stats seem to be broken
14:51:16 Server load: FPS 0, memory used: 2242 MB, out: 0 Kbps, in: 0 Kbps, NG:0, G:0, BE-NG:0, BE-G:0, RQ:0, Players: 1 (L:0, R:0, B:0, G:1, D:0), JIP (T:0 Q:4056)
It was working on the 3rd last I saw
whole cloud
last I used it, it worked.
But.. your server fps says 0? If server is not fps'ing then it wouldn't print monitor
spiral pond
works fine for me. only noticed #monitor doesnt show the JIP info part
oak aspen
whole cloud
last I used it, it worked.
But.. your server fps says 0? If server is not fps'in...
That's only what gets printed in the server console, client side works.
#monitords doesn't work at all
empty goblet
oak aspen
Anyone getting issues with monitords?
Server is running the profiling branch, mo...
0 fps happens before mission init or when there is weird rare random bug (that was happening in past and i seen that to happen every second or faster and it quite spammed the server logs ... not seen it in recent build yet)
on 2.18.152374 the #monitords seems working fine via BattlEye RCON
oak aspen
I'm not using Battleye, just viewing the regular server console.
empty goblet
thats where the output goes, i speak about the execution of the command into server to change the value
there are 3 ways how execute it on server, via chat thru UI from client if you logged as admin, via BE RCON, or via servercommand in the scripting on server...
oak aspen
Yeah I'm using chat as a logged in admin
It's previously worked, last time was the 3rd Nov
oak aspen
Found the solution if anyone else has the above, client must also be on profiling for monitords to work
 hallow lantern
I've started encounter a lot of crash on linux latest perf, only with some missions, with stable no issue.I'm the only one?
whole cloud
There will be some crash fixes tomorrow
 tranquil wing
@whole cloud You mentioned possible rendering issues with profiling branch. Could this be one of them? https://www.twitch.tv/drakenberger/clip/NimbleDifferentWatermelonPicoMause-MwaKnNJOi2caRspu
 real creek
holy z fighting
ashen helm
this one is a pretty old bug, I've been seeing this since idk, 2019 when I picked up the game lol
tranquil wing
yeah I remember this happening
ashen helm
the newest rendering issue with perf branch is units blinking in and out of existence
tranquil wing
usually not as bad as here though
tranquil wing
ashen helm
the newest rendering issue with perf branch is units blinking in and out of exis...
alright gotcha
ashen helm
you could try turning all the antialiasing options to the max, upping the objects details to ultra and setting sampling to something above 100%, might help a little but definitely won't get rid of this
woven loom
ashen helm
the newest rendering issue with perf branch is units blinking in and out of exis...
I didn't see it happening in YAAB fwiw
ashen helm
does yaab have a scene or part where you look through the gunner/optics view? It's not as visible in normal camera mode
somehow high-powered binos and scopes make it stand out very much
ashen helm
zoom with idk, splendid camera doesn't have these artifacts at all
woven loom
I haven't actually played the game normally in a while 😆
 honest fulcrum
tranquil wing
<@90532520101183488> You mentioned possible rendering issues with profiling bran...
honest fulcrum
tranquil wing
<@90532520101183488> You mentioned possible rendering issues with profiling bran...
This makes me think of floating point inaccuracy as a possible cause, complete shot in the dark though as I just don't know how Arma handles that kind of thing with respect to world sizes.
light cargo
ashen helm
does yaab have a scene or part where you look through the gunner/optics view? It...
imo it should but it doesn't
spiral pond
2.18.152374 - this update appears to have broken the behaviour of "inArea" and "inAreaArray" when testing against hexagonal areas.
Bohemia Interactive Forums
2.16.152058 new PROFILING branch with PERFORMANCE binaries, v17, server and client, windows 64-bit, linux server 64-bit - Fixed: Crash when providing some command-line parameters with an argument, but leaving the argument empty (-unit=) (thanks @PineCone227) - Fixed: Bogus script type errors on L...
whole cloud
tranquil wing
<@90532520101183488> You mentioned possible rendering issues with profiling bran...
Could be.. but thats not what i expected 🤔
The other flickering bug is fixed today, maybe that one will too.
whole cloud
spiral pond
https://forums.bohemia.net/forums/topic/160288-arma-3-stable-server-218-profilin...
@feral harness  (Repro in forum post)
whole cloud
People in earlier prof builds reported sound lags/delays, is that still a thing?
Going by the amount of reports, it seems its not an actual issue?
chilly geyser
whole cloud
People in earlier prof builds reported sound lags/delays, is that still a thing?...
Not actual I think, but I'm never get it before
 autumn siren
Idk if someone already reported this, however in profiling I had a bug where all player characters would blink on/off basically disappearing a few frames per second
whole cloud
autumn siren
Idk if someone already reported this, however in profiling I had a bug where all...
autumn siren
oh I thought that was in reference to something else
whole cloud
But due to technectrical issues, it seems like it will be tomorrow instead.
autumn siren
I do not mind as long as I get few frames more tbh
tho I might start doing some benchmarks to see if difference is noticeable or im just seeing things
dire wave
is normal that i get this error when trying to join a KOTH match?
"Script init_debug.sqf not found"
is it a common issue with profile branch?
 silk summit
All the performance improvements are not yet in 2.18 Dev right? Wandering when would be a good time to compare performance vs 2.16
woven loom
Current version is 2.18 i thought?
naive osprey
silk summit
All the performance improvements are not yet in 2.18 Dev right? Wandering when w...
Current stable branch is 2.18 without many major performance fixes iirc. Current 2.18 profiling branch has most of the performance improvements if not all of them.
 sinful nova
how do i get the latest perfomance profiling branch from steam?
sinful nova
honest fulcrum
https://community.bistudio.com/wiki/Arma_3:_Steam_Branches
Thanks mate
gritty wasp
silk summit
All the performance improvements are not yet in 2.18 Dev right? Wandering when w...
Dev not even support multiplayer. Why would you compare dev builds
whole cloud
silk summit
All the performance improvements are not yet in 2.18 Dev right? Wandering when w...
they are, dev got pushed last week
whole cloud
gritty wasp
Dev not even support multiplayer. Why would you compare dev builds
dev supports multiplayer.
Nothing to see here, move along please.
whole cloud
whole cloud
Nothing to see here, move along please.
heavy galleon
gritty wasp
Dev not even support multiplayer. Why would you compare dev builds
happened to me too 😄 Dev vs Diag
whole cloud
oops, thank you
 edgy chasm
whole cloud
Nothing to see here, move along please.
edgy chasm
whole cloud
Nothing to see here, move along please.
Got our first server crash in the last couple days after switching to profiling branch and running lambs danger, can I DM you the minidumps?
 latent sinew
server
hallow lantern
Same crashes as before with latest prof for me on linux dedicated, nothing with stable
Maybe it's lambs danger related? I'll have to do some test
whole cloud
edgy chasm
Got our first server crash in the last couple days after switching to profiling ...
yes
edgy chasm
hallow lantern
Same crashes as before with latest prof for me on linux dedicated, nothing with ...
for me i always got an error coming from /z/lambs/addons/main/functions mentioning CSIEW:GNED stack size violation, plus Error: Mismatched Begin/EndContexts, maybe that'll show up in your stdout/log too?
whole cloud
My DM's are open, I don't accept friend requests if your DM's are closed
whole cloud
edgy chasm
for me i always got an error coming from `/z/lambs/addons/main/functions` mentio...
If you get the mismatched Begin/EndContexts, you will have a special mdmp in your RPT folder
edgy chasm
yup i got that one
whole cloud
I need that
edgy chasm
whole cloud
My DM's are open, I don't accept friend requests if your DM's are closed
ah, maybe that's why i couldnt send it earlier
whole cloud
The issue was reported on v8 but rarely happening, with lambs only.
It shouldn't be more common now than it was on v8
hallow lantern
edgy chasm
for me i always got an error coming from `/z/lambs/addons/main/functions` mentio...
you got something in rpt? I got nothing
molten berry
edgy chasm
Got our first server crash in the last couple days after switching to profiling ...
@whole cloud The "seemingly random" crash that I sent you yesterday seems to also be related to Lambs.
removed it on the server and it hasnt crashed since
whole cloud
Crash when deleting soldier units (Or cars) that have flashlights/irlaser enabled. I have a probable fix for it, though I cannot reproduce that myself :/
The other is something about lambs running AI scripts. Something with the AI multithreading is messing up.
We're reverting to v8, probably can fix it tomorrow
ashen helm
are those crashes for multiplayer only or all modes are affected?
whole cloud
All