#hello about 90 of the dashboard ONTAP
1 messages · Page 1 of 1 (latest)
 eternal jasper
Hi @glacial mauve, I do have the data in SVM dashboard. There are many panels below which are protocol level. Do you have data for them in your Prometheus? You can check by running these few queries in Prometheus : svm_nfs_latency , iscsi_lif_read_data , svm_cifs_read_ops , etc.

 glacial mauve
eternal jasper
Hi <@1014160535731843073>, I do have the data in SVM dashboard. There are many p...
glacial mauve
eternal jasper
Hi <@1014160535731843073>, I do have the data in SVM dashboard. There are many p...
hello hardikl! yes, i have the data in prometheus, but not in the dashboard
 eternal jasper
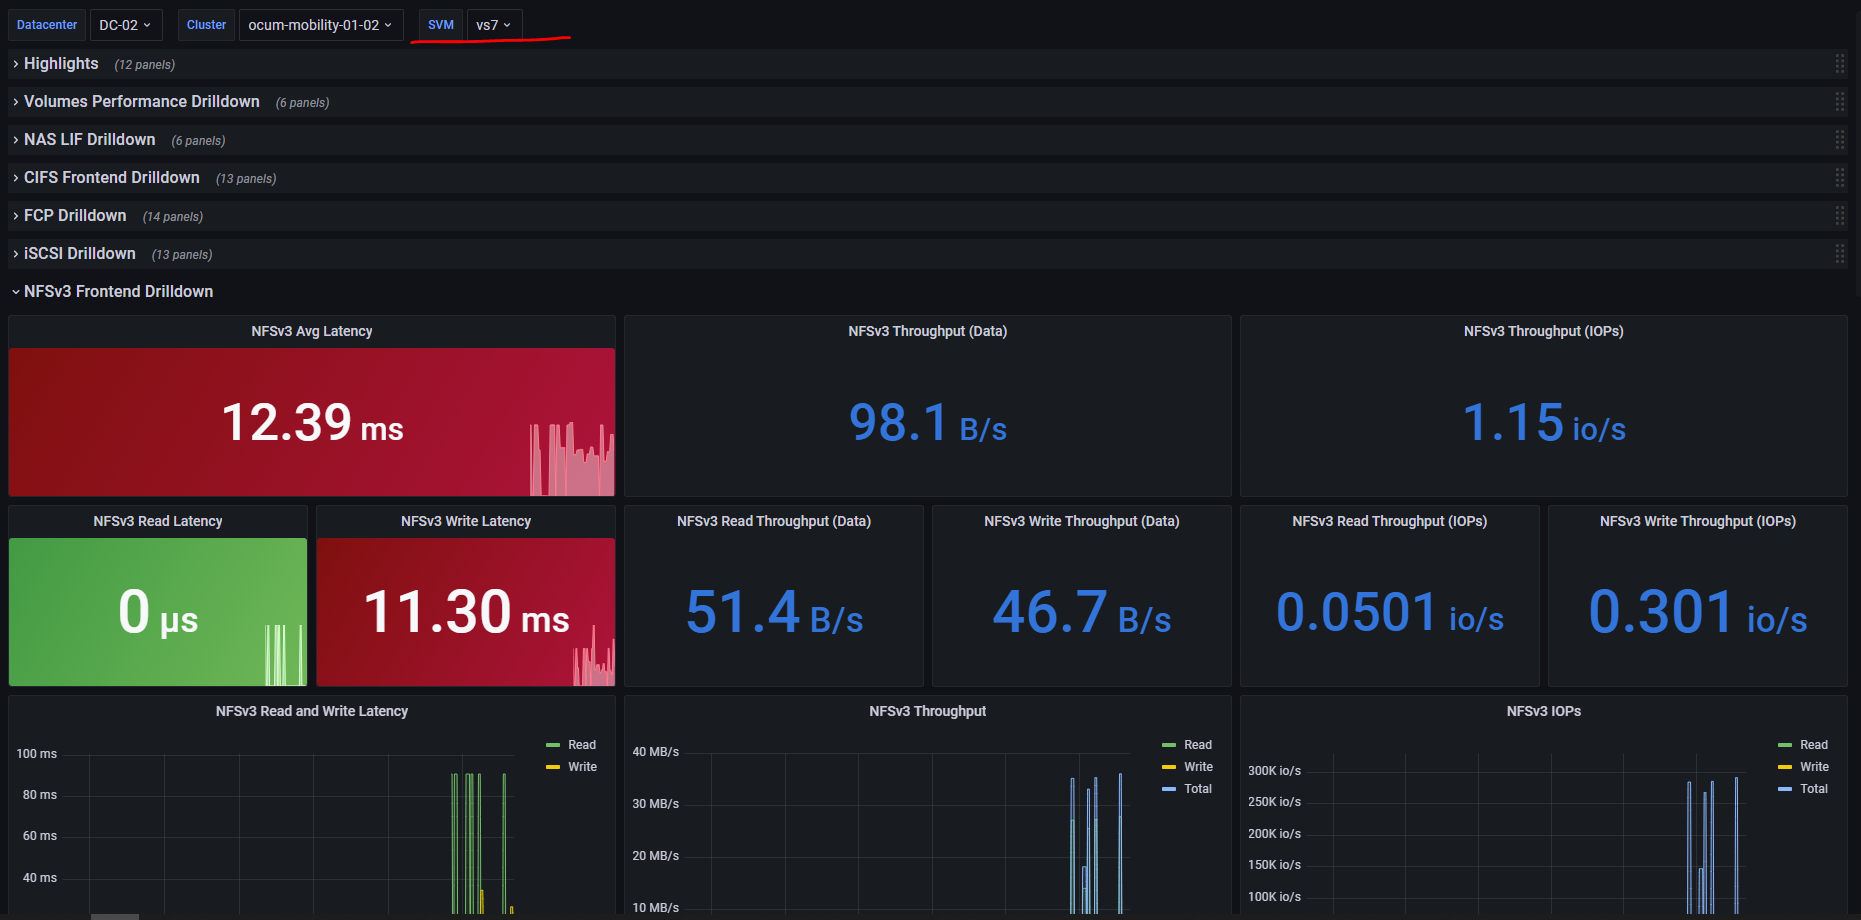
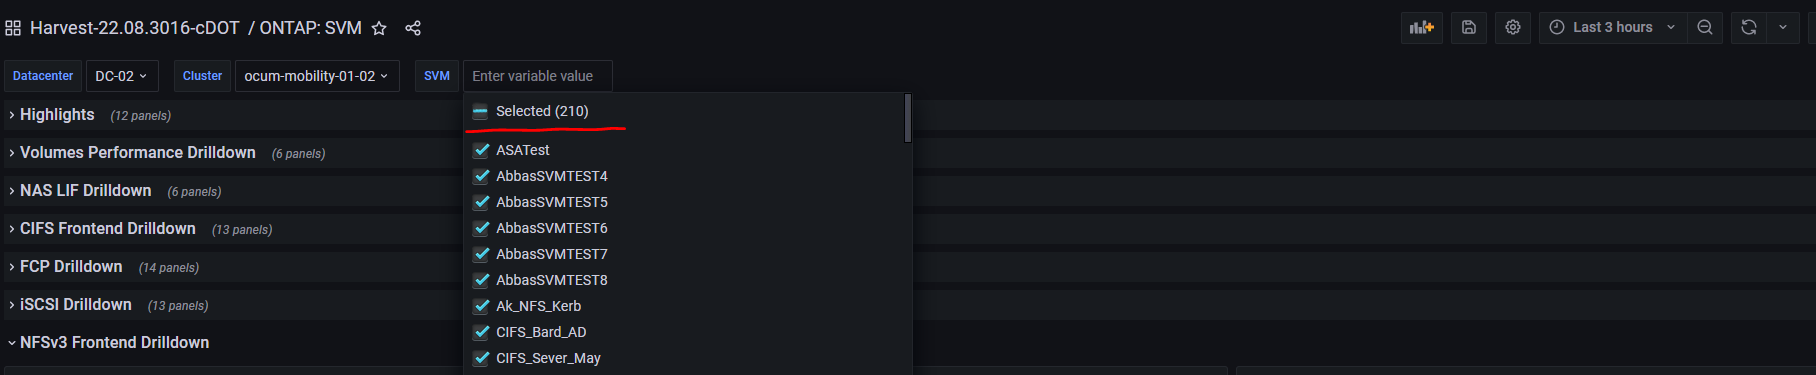
Could you give more detail here? 1. What version of Harvest and ONTAP being used? 2. Could you check and choose any svm where Prometheus shows data and if you choose that svm from dropdown in SVM dasahboard, Still the charts were empty/no-data or populated ? Like I did for vs7 for reference. A- https://user-images.githubusercontent.com/83282894/188465025-476ab39e-598b-433d-b4fb-500250fa3bcd.png B- https://user-images.githubusercontent.com/83282894/188465093-15d96465-086b-4e6d-879c-4375831430b3.png 3. If you select all, then also this nfsv3 all panels show no-data ? Like this c- https://user-images.githubusercontent.com/83282894/188465345-37ca7b2d-0f76-48df-99a4-311cac70280f.png