#xlabel and ylabel trouble
1 messages · Page 1 of 1 (latest)
you need to use triple ` followed by the code followed by triple ` in order for the code to show up as a block on discord
✅
My hunch is that when you used the plot function with xlabel and ylabel, it override the p1 labels, and then expected a list of 2 labels for each of the plots, but because it was just a single value, it applied it to the 2nd plot for some reason. I'd try either passing in a list of labels or put the xlabel ylabel in the p2 assignment, with plot having none of those
It's only a hunch because I'm confused why it would only apply to the 2nd plot rather than the first

dzon is suggesting
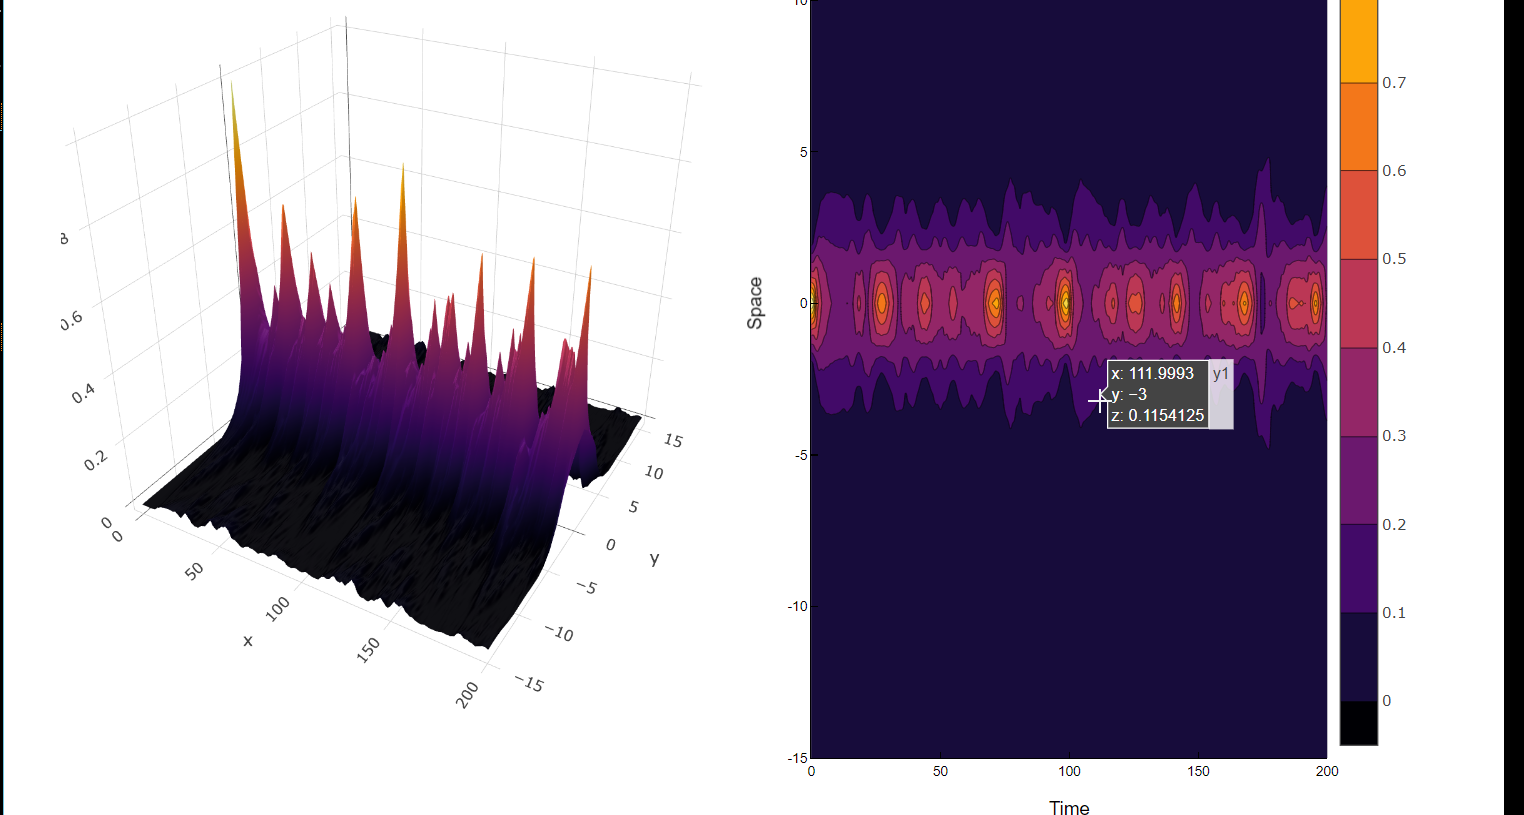
p1 = surface(sol.t, x, z, xlabel="Time", ylabel="Space", zlabel="|u|²", colorbar = false)
p2 = contourf(sol.t,x,z, xlabel="Time", ylabel="Space")
plt = plot(p1,p2,layout=(1,2), size=(1200,800))
Yeah sorry I was gonna test it until the cat asked for attention, anyway Clemonthyme got the right idea and running it I get this

(I just did a random y and z value)
Hmm, I get the same result if I did this julia p1 = surface(1:10, y, z; colorbar=false) p2 = contourf(1:10, y, z) plt = plot(p1, p2; layout=(1,2), size=(1200,800), xlabel="Time", ylabel="Space", zlabel="|u|²")
Maybe it's because I defined zlabel or something
Removing zlabel, I would just get time and space labelled on both graphs with nothing as the zlabel
Wait I just remembered you used plotly so lemme check that
I think specifying zlabel explicitely for p1 necessitates also explicitly specifying xlabel and ylabel for p1
your last code isn't equivalent since p2 shouldn't have a zlabel at all
so just put the labels into p1 and p2 definitions and not put any labels in the final plot plt
The result is equivalent though
I think that the plot function figures it out or plotly has plot.jl integrations problems
Plotly JS just doesn't work on my system
Nevermind I think my internet dropped out and did weird stuff
Or something to do with concurrency errors related to WebIO
Running it on 1 thread makes the 2 charts overlap each other
This is very confusing stuff related to this issue https://github.com/JuliaGizmos/WebIO.jl/issues/511

GitHub
When I use Blink and/or PlotlyJS packages with multiple threads in julia 1.9, a ConcurrencyViolationError appears: C:\Users\beorostica>julia -t auto julia> using PlotlyJS julia> plot([1,2,...
https://github.com/JuliaGizmos/WebIO.jl/pull/512 they are fixing it tho

GitHub
I implement changes similar to Blink.jl#307 to fix concurrency errors when multithreaded in Julia 1.9 and interacting with a page's DOM using Blink.
Fixes Blink.jl#308, WebIO.jl#511, and KoraMR...
someone from overflow answered: https://stackoverflow.com/a/76384575/11060252
Honestly quite disappointed at how such a trivial thing required so much effort to do