
11 messages · Page 1 of 1 (latest)
I saw https://docs.sentry.io/platforms/react-native/profiling/#ui-profiling-experimental that ui profiling is available for React Native. However, it looks like the code that actually parses the profiling options in SentrySDKWrapper (https://github.com/getsentry/sentry-react-native/blob/9278c8ece7053ceeed5f04ba3601c0ce11a716a2/packages/core/ios/SentrySDKWrapper.m#L111) isn’t being called anymore. Is there still (experimental) support for UI profiling in the React native SDK?
Learn how to enable profiling in your app if it is not already set up.
Official Sentry SDK for React Native. Contribute to getsentry/sentry-react-native development by creating an account on GitHub.
Thank you for reporting 🙇♂️ We are working to fix this.
Do you have a rough estimate about when the fix might be ready?
The fix should land in our next release. I'll follow-up on this thread when shipped. Thanks again for catching this 🙇♂️
Thank you for fixing that! I can see the options are now being passed in SDK version 8.9.1. I'm not sure if I was trying to use the wrong profiling types, but I was ultimately trying to see the slow "UI frames" section as shown this screenshot: https://docs.sentry.io/product/explore/profiling/mobile-app-profiling/metrics/#gpu-information . I used the options for tracesSampleRate and _experiments from here: https://docs.sentry.io/platforms/react-native/profiling/#ui-profiling-experimental, but I don't see the UI frames section in any of my profiles
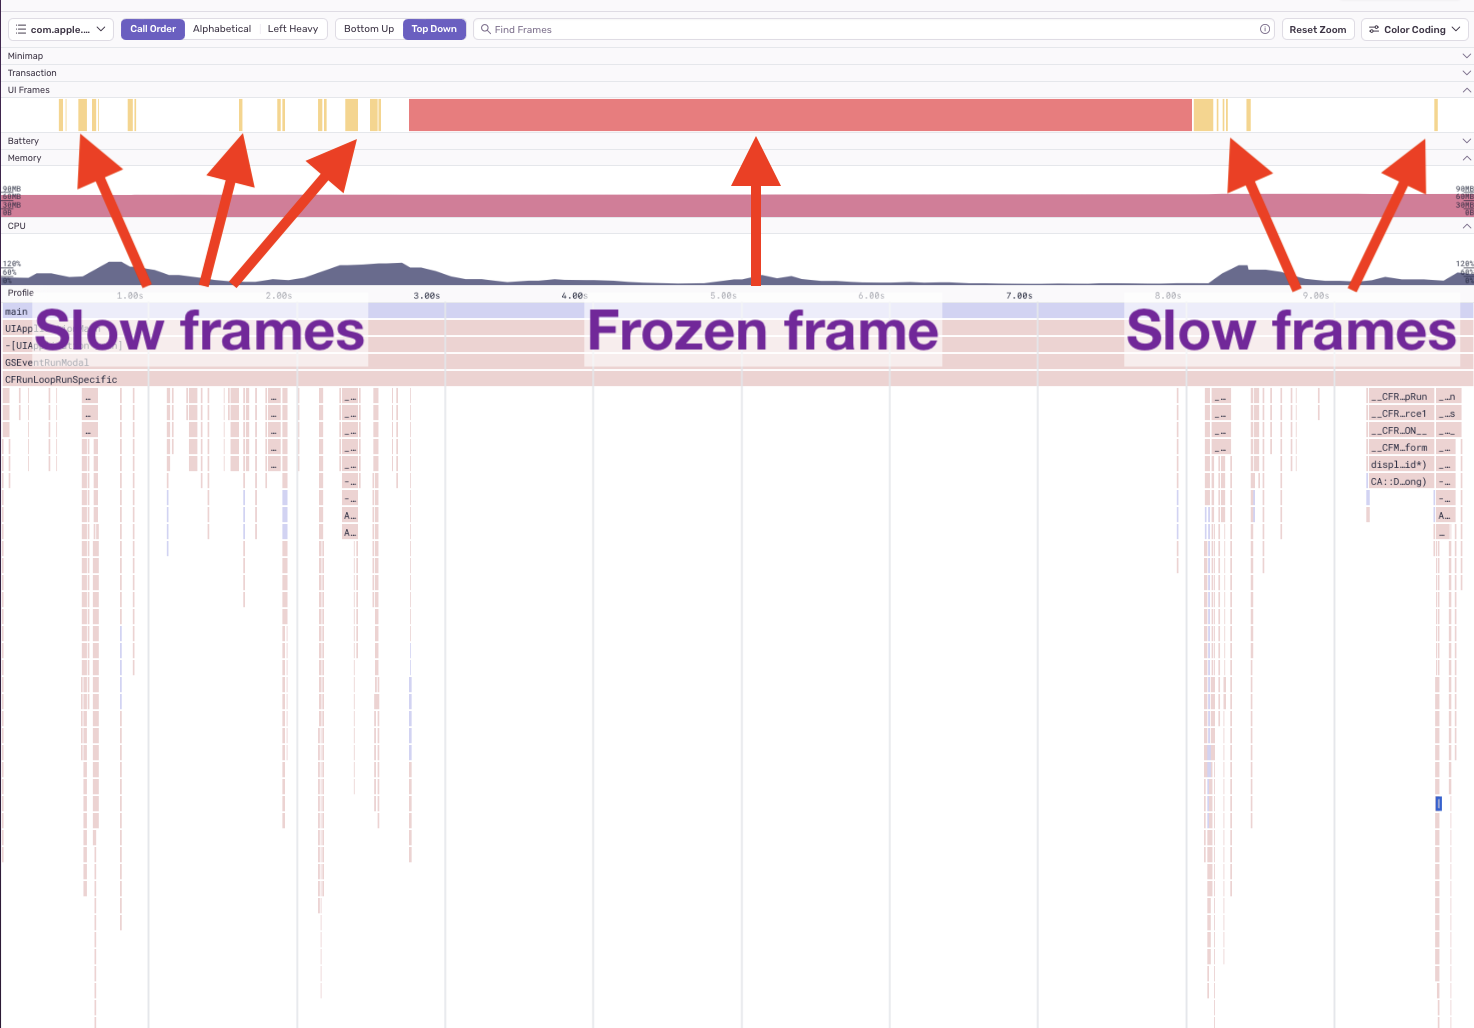
Learn about the measurements taken by the Sentry profiler that help us contextualize the work your mobile app does and detect possible issues impacting performance.

Learn how to enable profiling in your app if it is not already set up.
Thank you for reporting. We will check this and iterate back.
Thank you!
Could you try the following configuration:
Sentry.init({
  dsn: "YOUR_DSN",
  tracesSampleRate: 1.0,
  _experiments: {
    profilingOptions: {
      profileSessionSampleRate: 1.0,
      lifecycle: "manual",
      startOnAppStart: true,
    },
  },
});
If it doesn't work can you share more on your setup and project to help us reproduce the issue?
I tried testing on debug/release builds on iOS simulator and device and couldn't see any profiles show up using this config: https://gist.github.com/sleeper-ericc/01a6eccc81df8463b1f976b7d37e548a (I removed as much app-specific code as possible). I was only able to see profiles by setting profilesSampleRate = 1 and removing the profilingOptions section.

Thank you for iterating on this
couldn't see any profiles show up using this config
Did you also try thelifecycle: "manual"?
Yes, I also tried it with lifecycle: "manual"