#please tell me any library for graph, or maybe clang inbuilt one
54 messages · Page 1 of 1 (latest)
When your question is answered use !solved to mark the question as resolved.
Remember to ask specific questions, provide necessary details, and reduce your question to its simplest form. For tips on how to ask a good question use !howto ask.
Depends on what the needs you have are
Boost::graph maybe
Often people use graph databases for graph data
one benefit of which is it can be used by any language
Yeah, just really depends on requirements here
but they do install libraries for it right?
thanks, i will search about it
I mean the libraries usually come seperate
uff so there's no inbuilt
in clang
clang is a compiler, not a series of libraries
there is no graph container/datatype in the C++ standard, no
sry 😭 . i mean the c++, or whatever i installed
i see
I mean whether you want a library or a database will depend on your requirements, which you haven't really shared
but yea boost's graph library would probably be the "baseline" example of a library, though it has a high learning curve
yaa mb i'm searching for a sample
and do you know much about gnuplot-iostream ?
if it
it it's easier then boost's graph and matplot
btw atm i need to make a visual picture
showing heat. with colours

the numerical solutions of a partial differential equation, namely, the heat equation in 1+1 dimensions.
okay i should really first find a sample so i can show you. and not this graph btw. i mean x vs y types
I would strongly recommend something like python matplotlib
yes and I am telling you that most programmers will not read "graph" to mean a chart

like this type
not exactly
just the vertical rectangle color showing. of heat vs (smth)
got ya
okay, why are you using C++ for this?
this is very much a "use a better language for this kind of thing" like python's matplotlib
i don't know any other langs. other people in class are using python for this
there's a good reason for that
yaa probably
gnuplot-cpp / gnuplot-iostream seems fine if you already know how to use gnuplot
@frosty basalt Has your question been resolved? If so, type !solved :)
feels like it's not a bot. anyway i will type solved in some more mins. it's only been 30 mins
cant you do this in matplotlib?
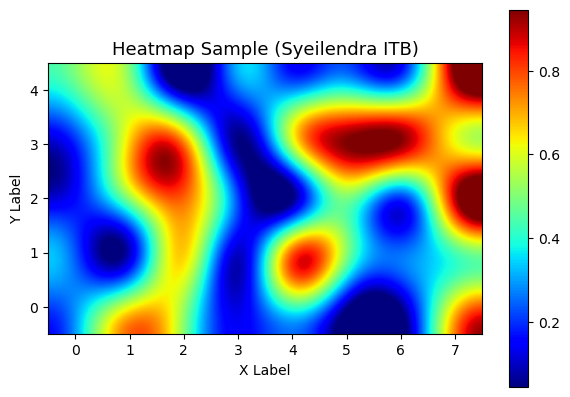
The following Python code generates an XYZ dataset, in which Z=f(X,Y), and a heatmap plot.
FYI matplotlib is available for C++ as well if that's your jam
thank you everyone for answering
Thank you and let us know if you have any more questions!
This thread is now set to auto-hide after an hour of inactivity
I will save the things