
#statistics help !
46 messages · Page 1 of 1 (latest)
 slim bone
 dire caveBOT
 halcyon yarrow
well for first one it's not z-score, you'd need to look at a table of values.
or calculator alternatively
what resources are you given?
slim bone
Nothing 😦
My teacher just said I had to do that
Like just like that
And I have no idea what’s even going on
I wanna cry hehe 😭
halcyon yarrow
well are you given any like program like R to do statistical analysis within?
hmm
slim bone
@halcyon yarrow no she just said I need a calculator
halcyon yarrow
AH
halcyon yarrow
are you supposed to have a particular calculator?
slim bone
TI 86
Something like that
But I’m using google calculator version of it online
Since I can’t afford it
halcyon yarrow
ah...is it an online class?
slim bone
Yah 😦
I’ve always sucked so bad at math
And my dad is gonna be so pissed if I don’t understand these hehe
halcyon yarrow
A simple guide to the functions dnorm, pnorm, rnorm, and qnorm in R.
The user friendly R online compiler that allows you to Write R code and run it online. The R text editor also supports taking input from the user and standard libraries. It uses the R compiler to compile code.
ahwait

Wolfram|Alpha brings expert-level knowledge and capabilities to the broadest possible range of people—spanning all professions and education levels.
Wolfram|Alpha brings expert-level knowledge and capabilities to the broadest possible range of people—spanning all professions and education levels.
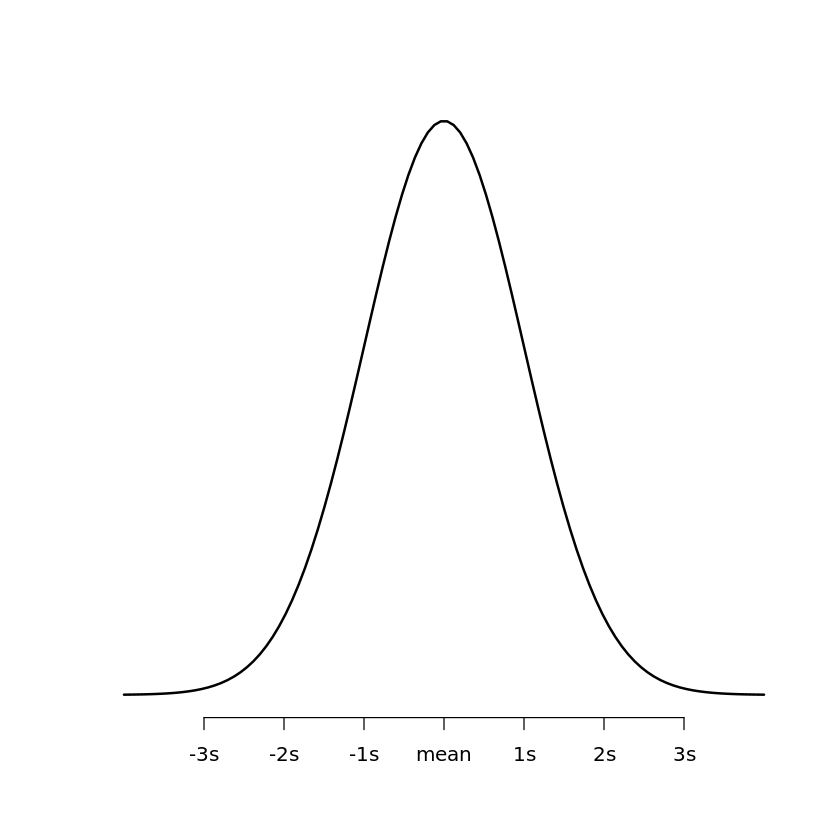
but the idea for both of these is to use z-score formula once you obtain the value from each, for the first you obtain the Z-score corresponding to .70 (70% of area behind it in the standard normal distribution)
then once you have that $Z_{1}$, you can do the following $Z_{1}=\f{X-\mu}{\f{\sigma}{\sqrt{n}}}$
 tawny dirgeBOT
Moosey
 halcyon yarrow
where $X$ is the value you want, $\mu$ is your population mean, $\sigma$ your standard deviation, and $n$ your sample size
tawny dirgeBOT
Moosey
 halcyon yarrow
as for the second one
you must find the z-score, i.e. you're given x, mu, sigma, and n, then use that to find the probability
sometimes calculators ask about left tail and right tail, and this is just asking respectively if you want the area to the left (values smaller) or right (values larger)
hope that helps :)
@slim bone
slim bone
OMG THXXX