#data-science-and-ml
1 messages · Page 413 of 1
 wooden sail
that's why we start from the bottom
and that's why it is called back substitution
the matrix you found is "upper triangular"
 steady basalt
z = 5
wooden sail
this means the value of z is immediate
wooden sail
then you use z to find y with the 2nd row
steady basalt
ur explanation there is amazing yes
makes sense now
it didnt make sensebefore
5 * 2 = 10, so we know its 7 for b
y*
7 + 5 = 12, so 3 left for x
lol
steady basalt
cant beleive i cudnt work out that in the first place
steady basalt
< fake data scientist
wooden sail
you should get the vector [23, 28, 15] or whatever it was
steady basalt
im looking now at the next question
its based on the previous question
ok its asking me to find the inverse of the matrix
isnt that the exactone i just made tho
wait no
steady basalt
it needs to give is I
so do i nede to keep diong this until i can make 100 010 001
and use the same operation
wooden sail
the common method is to make a new augmented matrix
steady basalt
A^-1 *A = I right?
wooden sail
if M is the original and I is a 3x3 identity, build the augmented matrix [M I]
then do elementary row operations until M turns into I
the block where I was becomes M^-1
[I M^-1]
steady basalt
augmented?
wooden sail
steady basalt
A^-1 *A = I right?
this is mostly correctly. let's just say "yes" for now
wooden sail
steady basalt
augmented?
augmented in that you glue two 3x3 matrices into a 3x6 matrix
steady basalt
and also, A*A^-1 = I too
so you mean merge the matrix we have with i ?

how is that possible tobuy the same amount of everything and get new price totals
wooden sail
if you're taking a course, i'm pretty sure they taught you how to invert matrices
the idea is, you have a system of equations related to the matrix equation Ax = b
you want the vector x based on the matrix A and the values in b
you can find x as x = A^-1 b
so for a given value of the vector b, A^-1 tells you the vector x
i think you should go back and review your course material
wooden sail
it seems weird you don't know this by the time you reached this task
they don't, not directly
steady basalt
I did this many months ago and just came back
wooden sail
you should go review, then
steady basalt
I have good notes on how to do it
i will just follow those
anyway its only about 2 weeks from the end of this section then its calculus again
i find it a bit boring sometimes
wooden sail
probably so if you don't find meaning in it 😛
steady basalt
its alright i guess but i think its less important than calculus for pytorch
but its everywhere..
u think this stuffs more importnat?
wooden sail
you can't escape either
but matrices, vectors, and n-d arrays are what you will directly deal with
so in that sense, yes
you'll run into issues if you accidentally use the wrong type of multiplication like just now, or shape your arrays incorrectly
and those are some of the most common errors people run into
steady basalt
but arrays are basically given to me in datasets and reshaping in code is easy
wooden sail
you almost never get your data as an array
wooden sail
you get ragged files that you need to turn into arrays yourself after cleanup
that's like 80% of your work
making arrays out of data
steady basalt
yeah i spent about 6 hours turning one xml file into arrays...
but its not hard
easy python
never needed this stuff
wooden sail
no, but it's most of your work anyway
steady basalt
for that
wooden sail
and well, in that sense, you can use pytorch and tensorflow without ever knowing how they work
why are you bothering with it now
wooden sail
well, if you don't understand the tool, you certainly are
steady basalt
Less chance to be automated out of a career if I better understand and can help when internals go wrong
wooden sail
at any rate, supervised learning is all about the composition of linear and nonlinear transformations
and all linear transformations in finite dimensional spaces can be written as matrices after picking a basis
so all of supervised learning is about estimating matrices
steady basalt
I can’t work as a data scientist without being confident at this even if I can code and do stats lol
Else I’d feel dumb
wooden sail
you need this for multivariate stats as well
steady basalt
Actually most of my stats is causal inference and extremely applied
wooden sail
you'll immediately run into metric tensors and covariance matrices
steady basalt
And for that I use stats packages
wooden sail
well, same question as for pytorch and tensorflow
you can use all of this stuff without understanding it
if you wanna be good at it and feel competent and confident, you gotta learn it
steady basalt
For this I’m not so sure, to fully understand the underpinnings of all of the stats would take many years of learning
wooden sail
sure, people doing cutting-edge AI are phds
steady basalt
Do u know how many frequency distributions u can get
steady basalt
wooden sail
sure, people doing cutting-edge AI are phds
I’m prob not gona do for PhD
Masters and work…
I cudnt stand 3-4 more years of this god damn
And at an even more intense level
 mild dirge
Nah that would be crazy 👀
wooden sail
you haven't seen intense yet 😛
good on you though
linear algebra does the soul good
steady basalt
wooden sail
you haven't seen intense yet 😛
These next two months are trust me man… full thesis to do and more
https://en.m.wikipedia.org/wiki/Proportional_hazards_model let’s say I have an essay to write based on my stats findings I’m not gona go thru all the maths of this sort of stuff I’m just going to report it and any inferences from it
Proportional hazards models are a class of survival models in statistics. Survival models relate the time that passes, before some event occurs, to one or more covariates that may be associated with that quantity of time. In a proportional hazards model, the unique effect of a unit increase in a covariate is multiplicative with respect to the ...
That’s why I do not memorise all functions and learn everything
wooden sail
looks fun
steady basalt
Oh u like proportional hazards?
steady basalt
If one covariate breaks the assumption of proportionality I gotta stratify right
Ain’t nothing else to do
It’s the only method I know
wooden sail
no idea, idk anything about survival models
wooden sail
if i never need it to reach some result, i'll look into it
steady basalt
In lectures had to write this crap down just totally forgot the details how it works in 6 months tho
wooden sail
ah actually i did take a course on it in undergrad
steady basalt
I have a linear regression task
wooden sail
reliability theory, but that's like 10 years ago
steady basalt
I’m supposed to not care about confounders the usual way but give them weighting
Something about a uh
Synthetic dataset
God I rly cba this weekend
Ever feel like binge watching Tom cruise instead
@wooden sail how does 1/determinent work when its not a 2x2 matrix
wooden sail
work for what?
wooden sail
yeah, work for what?
steady basalt
what if u dont have a b c d but u have abcdefghi
wooden sail
steady basalt
1 / ad - bc
this expression only works for 2x2 matrices
the determinant of A^-1 is always 1/(det A)
steady basalt
so for 3x3
wooden sail
for 3x3 matrices you can use sarrus' rule to compute the determinant
steady basalt
Yo new term
wooden sail
and then based on det (A), you can find det (A^-1) as (det A)^-1
wooden sail
idk what exactly you're askng
steady basalt
 wooden sail
to "work" is not a math term 😛
steady basalt
they only taught me 2x2 determinant
wooden sail
there is no simple expression for the determinant of a matrix
steady basalt
this is the key to the inverse
wooden sail
2x2 matrices are just small enough that the expression looks simple
steady basalt
my notes say so
steady basalt
1/determinent
wooden sail
since, as i said, det(A^-1) = 1/det(A)
steady basalt
so how they seriously only teach me 2x2 determinant and th en expect me to inverse a 3x3 dfude
wooden sail
if det(A) = 0. the inverse has an undefined determinant, and then the inverse does not exist
they don't
steady basalt
they did
wooden sail
no one expects you to invert a matrix by hand
steady basalt
i am xd
wooden sail
only easy ones, then
steady basalt
3x3 with ez numbers yes
wooden sail
yeah
steady basalt
infact, the numbers i showed u earlier
wooden sail
yeah thats easy
steady basalt
i need to use sarrus?
 primal shuttle
Are you trying to do this by hand @steady basalt ?
wooden sail
still absurd tho
steady basalt
@primal shuttle yes its part of a course
linear algebra section lol
remember what we had earlier
1 1 1 . 3 2 1 . 2 1 2
primal shuttle
@steady basalt just add the first 2 rows underneath the matrix or first 2 cols to the right of the matrix, multiply diagnoally (Right to left) subtract (left to right) diagonally if you're adding rows
wooden sail
what's M?
primal shuttle
What's M
steady basalt
matrix
wooden sail
what's A and what's M
you're asking something about one matrix, why do you mention another matrix?
primal shuttle
steady basalt
Calculate det(M) -> 1/det(M) will give you the det(M^-1)
steady basalt
I have two difference sources in front of me
wooden sail
what wassp says is the connection
steady basalt
how do you 1/ a matrix?
wooden sail
you can't
but det(M) is a scalar, not a matrix
and that's perfectly fine, 1/scalar
wooden sail
btw the real reason to have you do elementary row operations by hand comes later, when you see that these operations are represented by elementary matrices with special properties
wooden sail
this is the introduction to matrix decompositions and algorithms like QR decomposition
wooden sail
there is no division by matrices
primal shuttle
There is no such thing as a division by matrices
steady basalt
I have the folling in my notes
steady basalt
1/det = fraction, times this fraction by matrix
primal shuttle
Yup
steady basalt
then times by original matrix to get identity
correct?
ok so what if i dont have original but i have identity
can u do it backwards
to find A from A^-1
wooden sail
you invert A^-1 again
steady basalt
ah
wooden sail
inversion is an "involution"
if you apply it twice, you end up where you started
also, what you're speaking of is an inversion involving 3 quantities
primal shuttle
(A^-1)^-1 = A^1 = A
primal shuttle
Have fun 🙂
wooden sail
A*B = C involves 3 matrices. you need 2 of the 3 to compute the missing one
primal shuttle
@wooden sail Hope you didn't mind me butting in 😉
wooden sail
so if we speak of A * A^-1 = I, you need 2 of these to compute the last
not at all wassp
thanks for filling in the gaps
steady basalt
Ok so its annoying how it goes a12a23a31
thats not eve diagnoal
thats like it skips across
primal shuttle
That's why I told you to add the rows and then you can go diagonally 😉
wooden sail
i think there are some nice illustrations "extending the matrix" so that you can see the pattern
you're following diagonals that "wrap around"
primal shuttle
1 2 3
4 5 6
7 8 9
1 2 3
4 5 6
wooden sail
this is one way
 steady basalt
the 31 is in the right spot
 primal shuttle
Bingo 😉
steady basalt
dontneed it anyway ill just eyeball it f rom the forumula
second
multiply values right?
and add those each
wooden sail
sarrus' rule and the inversion of 2x2 matrices are particularly well-behaved examples of "laplace's expansion of the determinant", in case you wanna look that up
steady basalt
a11a22a33 means you multiply them yea
primal shuttle
Yup
wooden sail
yes
wooden sail
yes
primal shuttle
Yes
steady basalt
new rule per shape? how many invented
 fallow remnant
question: if I have multinomial NB model, how would I test the accuracy of said model against the test set
wooden sail
the one i mentioned always works: laplace expansion
steady basalt
literally who invented this? like adding it then subtracting it
wooden sail
alternatively, the determinant is equal to the product of the eigenvalues
primal shuttle
@fallow remnant text?
fallow remnant
pardon? @primal shuttle
primal shuttle
Are you evaluating text classification algorithm
i.e. by NB do you mean naive bayes
fallow remnant
yes
wooden sail
steady basalt
literally who invented this? like adding it then subtracting it
so, the ones you're looking at for 2x2 and 3x3 are due to leibniz. the laplace one is due to laplace. the eigenvalue one, idk
steady basalt
high iq
can you do the adding half as a su m
then subract the sum of the minus half
primal shuttle
@fallow remnant confusion matrix?
wooden sail
addition is associative, yes
steady basalt
mmkh
steady basalt
@wooden sail i am proud to present 12
primal shuttle
That's your eval method 🙂
fallow remnant
oh. im dumb LMFAO
steady basalt
is tehre a det function in this discord matrix calculator
wooden sail
In [1]: import numpy as np

In [2]: M = np.array([[1,1,1],[3,2,1],[2,1,2]])

In [3]: np.linalg.det(M)
Out[3]: -2.0000000000000004

In [4]:
seems to be -2
steady basalt
i meant that
wooden sail
associate the negatives and factor out -1
wooden sail
i think you need to review your highschool arithmetic 😛
steady basalt
fk
wooden sail
-x - y = -1(x + y)
steady basalt
-4-1-6 = -11
9-11 = -2
same thign i did just forgot the - infront of 4
and then add that
so i must do 1/-2
*A
so multiply every value in the matrix by 1/-2
wooden sail
what for?
wooden sail
no
steady basalt
I thought its 1/det
wooden sail
the DETERMINANT of A^-1 is 1/det(A)
but that tells you nothing about A^-1 other than its determinant
wooden sail
oof
steady basalt
then it says
primal shuttle
No way a matrix equals a number 😉
wooden sail
that's certainly wrong
steady basalt
adjA
steady basalt
not quiet sure what that means
wooden sail
adj(A) is the transpose of the cofactor matrix of A
steady basalt
= inverse
wooden sail
it's good that you practice that at least once, but
steady basalt
gotta claculate that
wooden sail
i'll also tell you that it's easier to invert matrices using gaussian elimination, and that in practice one rarely ever inverts a matrix anyway
steady basalt
so they wnated me to do so with the previous methods?
i can just workout what is the co factor
primal shuttle
@steady basalt - they're not out to get you with the material, I can promise you that 😉 (although it may well feel that way when first tackling this)
wooden sail
det of a minor matrix
steady basalt
split the matrix up?
wooden sail
yes
steady basalt
how
wooden sail
solve a big problem by instead solving several small problems
steady basalt
oh but the exxamples im looking at skips out some too
skip the middle one fore xample
wooden sail
wdym skip
primal shuttle
yup
steady basalt
skip 2
wooden sail
right
steady basalt
tf?
primal shuttle
Cross out one row and col
wooden sail
so split up the matrix
primal shuttle
and you'll have a 2x2
wooden sail
you eliminate the row and column corresponding to one entry in the matrix
and you have to do this for every single entry in the matrix
wooden sail
that means your 3x3 matrix is split up into 9 2x2 matrices
gonna hit the sack, good luck with your arithmetic 😛
steady basalt
ty
primal shuttle
Ditto on that, @wooden sail - have fun @steady basalt
primal shuttle
Don't rush it
steady basalt
so far for matrix 111 321 212 i have
11,32
11,21
32,21
21,12
11,31
31,22
11,22
theres another 11,21
1 left
11,12
43
no thats not how u ad them
u minus them?>¿˘
@primal shuttle left to right is +ve and right to left is -ve?
cofactor is -1,-1,-1. 3,-1,4. 0,-1,1
dam no it isnt
omg it matters what position
primal shuttle
Yes
primal shuttle
for example for the first entry, you cross out the first row and first column
and so on
Anyway, I'm gonna hit the hay, so have fun!
steady basalt
thanks good night
 supple rapids
May I ask why data science and ai being combine in one channel?
 serene scaffold
supple rapids
May I ask why data science and ai being combine in one channel?
serene scaffold
supple rapids
May I ask why data science and ai being combine in one channel?
they have a lot of overlap, and it would result in a lot of wasted time deciding if a question belongs in the data science or AI channel
supple rapids
ohhhhh
ty
btw, which is better learning data science through havard or through gooogle
serene scaffold
supple rapids
btw, which is better learning data science through havard or through gooogle
I'm not sure what specific distinction you're drawing. are these youtube channels? certificate programs?
supple rapids
uhmm google course is in coursera and Havard course is in edx
 lapis sequoia
hi, could someone tell me what the symbol in the red box is

Pi
its just pi? then what does it mean in the equation?
3.14159265359
You should ask your teacher or google 😉
yeah, but im asking here since im studying as a hobby
and google search spits a random alphabet
no pi from google
 iron basalt
lapis sequoia
its just pi? then what does it mean in the equation?
iron basalt
lapis sequoia
its just pi? then what does it mean in the equation?
In mathematics, a product is the result of multiplication, or an expression that identifies factors to be multiplied. For example, 30 is the product of 6 and 5 (the result of multiplication), and
    x
    ⋅
    (
    2
    +
    x
    )


{\displaystyle x\cdot (2+x)}
is the product of...
wooden sail
lapis sequoia
hi, could someone tell me what the symbol in the red box is
it means product
multiplication following the indices specified beneath
.latex same as $\sum_{n=1}^N \cdots$ means summation
 strange elbowBOT
 lapis sequoia
ahhh I see, thank you @wooden sail, was scratching my head
thank you @lapis sequoia too
wooden sail
looks like your model follows some sort of distribution where the samples are independently normally distributed
so the joint pdf is a product of the normal distributions of each of the samples
something of the sort
lapis sequoia
oh I see, got it, thanks Edd
 lofty elk
Do I need to study statitics for data visuslization? If so, then from where ?
wooden sail
if you want to visualize stuff like descriptive statistics, it would be a good idea to be familiar with them
 clever harbor
lofty elk
Do I need to study statitics for data visuslization? If so, then from where ?
clever harbor
lofty elk
Do I need to study statitics for data visuslization? If so, then from where ?
if data visualization is your final goal you don't need that much of statistics
some basics
and where to begin depends on your needs
steady basalt
lapis sequoia
hi, could someone tell me what the symbol in the red box is
It means instead of add sums u multiply
Yes I agree these symbols need demystifying to people not in the loop it looks scary when it isn’t
lapis sequoia
hiiii anyone know how to convert octave file (similar to matlab) into python
):
I used following code for speech recognize. but... Learn more about i am searching a matlab code to train audio files for speech recognize using matlab
howww can i convert this sh*t to python...
 heavy crow
I am working on a project to find pictures with similar colors. i do this by first extracting a color palette (4 colors) and then i transform this color palette into a latent 16D space where i can use clustering to find similar images.
this all works but i feel like there should be a better approach.
The embedding into the latent space works by training a Siamese network to place similar palettes close (L2 distance) to each other in that 16D space.
the question i have: is there a better way to teach neural networks to ignore the order of inputs? i.e the order of colors in a palette doesnt matter
steady basalt
why is this -4 and not +4

and this is +3?

looking at their steps they say +4 too on the next page
you have to multiply by -1 power of whatever is the row+column?
ah makes sense actually -1^3 * M = -4
+++++++++++++-
something i had to discover is that you have to subtract when its diagonal right to left and use that as part of the sum
wooden sail
heavy crow
the question i have: is there a better way to teach neural networks to ignore th...
sadly, the order of entries in a vector matters inherently. what you could do is apply random permutations to the rows or columns or whatever axis you have the colors on, but these permutations need to match the order in which the colors of the palette are specified anyway
there has to be a correspondence between the palette and the color layers
steady basalt
heavy crow
the colors dont have a order in the palette, thats my problem :/
yeah i have tried "rotating" the palette, the results dont really differ
steady basalt
Ok so I have the cofactor matrix
is that the same thing as adjA?
@wooden sail 1/-2 * cofactor matrix = inverse matrix?
omg i have to transpose first
longest fkin steps ever
cofactor of 111 321 212 is
  -1 0 1
-1 2 -1```transposed
    -4 0 2
-1 1 -1```now its 1/-2 * that
    2,0,-1
0.5,-0.5,0.5```omfg its correct
wooden sail
cool
primal shuttle
These things take n log n in time to practise 😉
steady basalt
so thats 3x3 matrix inversion by adjugate method done
but i wudnrtbe able to do it with elimination method
which apparently works too
someone called jordan
wooden sail
it's probably easier to do it with gauss jordan than it is with the adjugate
steady basalt
Really
iwudnt know how
the adjugate method seems easy to follow
hate the elimination stuff
requires thinking ahead interms of operations
wooden sail
scalar multiplication too stronk
have you already seen elementary matrices? i think looking at elimination from that perspective makes it a lot clearer
both with regards to how it works and also as to how it helps you find the inverse of a matrix
steady basalt
they teach only for 3x3
wooden sail
elementary matrices of size 3x3?
steady basalt
can i just run smtn by u real quick
wooden sail
sure
 wooden sail
i have no idea what's going on because you cut off the text
numbers alone mean nothing to me 😛
wooden sail
make what echelon?
steady basalt
the matrix at the top
steady basalt
why does it?
wooden sail
it has a 2 in the first entry
steady basalt
mh yes thats what i meant
wooden sail
hmmm?
steady basalt
i made it
0 5 12
by doing 2x row1
so 0,5,12. -5/2
then -5 times row 2
so 0 0 0 7
007
0
then divide by 7?
wooden sail
seems ok at a glance
 steady basalt
oh
instead of 3 i got 2.25
onoe second
9/4 - 3/2*-1/2
2.25 - - 0.75 right
3
great correct
took me a day but i passed the test
ty
next quiz coming soon
haha, next quiz is determinants and inverses.. already done that for the last one
i think i was supposed to use the other method
wooden sail
a graded test?
wooden sail
wdym by that?
steady basalt
well thje dude just drew out two axis
e1 and e2 hat
and for matrix a,0. 0,d
made e1 at a,0
and e2 and 0,d
then then drew a big square
and labelled thjat ad
and called that the determinent
 wooden sail
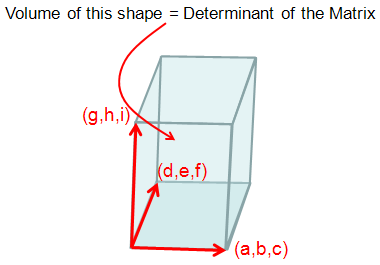
the determinant is the overall scaling factor for the "area" (area used very loosely)
it's not a space, it's a scalar
it tells you how much bigger or smaller space is after applying a transformation
steady basalt
so a*d is det?
why do we swap diagonals and apply opposite sign
abcd becomes d-b-ca
wooden sail
there's no special meaning to it, it just happens to work out that way for 2x2 matrices
steady basalt
so someone just found out that it works
and theres no reason why it works it just does?
ohhh
its the area of the 4 sided shape made
wooden sail
there are many reasons why it works and you can prove it works
it just also happens to "look nice"
wooden sail
determinants and inverses have no special shapes or forms in general

 steady basalt
a and d are x and y length right?
b and c are elevation?
into the space
i mean
wooden sail
sure, you can interpret them as width and height
steady basalt
i see that C causes the angle into space
not sure about B
is this like a 2 step thing
wooden sail
idk what you mean by "angle into space"
wooden sail
in general, linear transformations map vectors to other vectors. if you study what happens to the canonical basis under the transformation, you see that the vectors change direction and now form a different grid that is no longer square, but some other quadrilateral. the area of this new quadrilateral is the determinant
a scales up the x component, and b adds in some amount of the y component to the x component. c adds some amount of the x component to the y component, and d scales the y component
so b and c make it so that vectors change directions
steady basalt
thats what i meant
this stuff sometimes gets hard to conceptualise
it was probably invented to make it easy to coneptualise
wooden sail
the visualization can be handy in 2D i guess, but not in higher dimensions
steady basalt
big respect for the discoverers
wooden sail
linalg is made to be abstract on purpose, so it applies to scenarios where there is no useful visualization as well
steady basalt
system is unsolvable only when a row is totally 0?
wooden sail
that would mean infinitely many solutions
steady basalt
are u good at numpy
wooden sail
i'd say yes
steady basalt
for a 4x4 matrix tocode it into echelon form first step is
    if A[0,0] == 0 :
        A[0] = A[0] + A[1]
    if A[0,0] == 0 :
        A[0] = A[0] + A[2]
    if A[0,0] == 0 :
        A[0] = A[0] + A[3]
    if A[0,0] == 0 :
        raise MatrixIsSingular()
    A[0] = A[0] / A[0,0]
return A```how does that turn 0,0 to 1
wooden sail
it's adding rows together, same as when you fo elimination
steady basalt
ok but what if 0,0 == 10
wooden sail
a matrix has 2 indices if you give only 1 index, you get a full row
steady basalt
theres no else
wooden sail
then it wont do anything from the if statements
steady basalt
this only works if 0,0 is 0
wel thats a useless excersize + code
it has to be re-made for whatever value 0,0 is?
when fixing row 3
do we just say a3 = a3
hmm didnt work
following that framework for A[1]
    # Insert code below to set the sub-diagonal elements of row two to zero (there are two of them).
    A[2] = A[2] - A[2,0] * A[1]

    # Next we'll test that the diagonal element is not zero.
    if A[2,2] == 0 :
        A[2] = A[2] + A[3]
        # Insert code below that adds a lower row to row 2.
        A[2] = A[2] - A[2,0] * A[1]
        # Now repeat your code which sets the sub-diagonal elements to zero.


    if A[2,2] == 0 :
        raise MatrixIsSingular()
    # Finally set the diagonal element to one by dividing the whole row by that element.
    A[2] = A[2]/A[2,2]
return A```doenst seem to fully work
    A[1] = A[1] - A[1,0] * A[0]
    if A[1,1] == 8 :
        A[1] = A[1] + A[2]
        A[1] = A[1] - A[1,0] * A[0]
    if A[1,1] == 8 :
        A[1] = A[1] + A[3]
        A[1] = A[1] - A[1,0] * A[0]
    if A[1,1] == 8 :
        raise MatrixIsSingular()
    A[1] = A[1] / A[1,1]
return A``` this worksi just followed it
using the value of 2,2 and increasing each by 1
didnt work
would it have to try row0 if row 3 doesnt work for row 2
 left field
Hey guys, I have a dataset for which I am making sales forecasts in Linear Regression. The problem is that I want to make predictions for future dates for which the data is not available. Just to give context I am feeding my model Day, Week, Month, and Weekday as a parameter but because I don’t have data available for future dates I am not able to predict what would the predictions be for the next week. I am fairly new to data science is there any help I can receive for this matter?
serene scaffold
left field
Hey guys, I have a dataset for which I am making sales forecasts in Linear Regre...
have you heard of "time series forecasting"?
left field
Thanks, I’ll check that out
steady basalt
left field
Hey guys, I have a dataset for which I am making sales forecasts in Linear Regre...
U gona have to predict data u don’t have based on what u do have
U could do that with just linear regression if ur datas linear
 wheat snow
heyo
im workin with pandas rn
and
i wanted to visualize a bit with matplotlib
A_Modern['Weekday']= pd.Categorical(A_Modern['Weekday'], categories= [0,1,2,3,4,5,6], ordered= True)

Modern_by_day = A_Modern['Weekday'].value_counts()

Modern_by_day = Modern_by_day.sort_index()

plt.rcParams.update({'font.size': 23})

Modern_by_day.plot(kind='bar', figsize=(15,10), title="temp")
it gives me that error message back
A value is trying to be set on a copy of a slice from a DataFrame.
Try using .loc[row_indexer,col_indexer] = value instead
 alpine nexus
wheat snow
and
alpine nexus
wheat snow
and
Can you describe what you want to do, prior to plotting?
wheat snow
alpine nexus
Can you describe what you want to do, prior to plotting?
the first line is probably the problem here.... i wanted to set the categorial for the plot and define the order so the days are plotted
it is a netflix watch data csv
alpine nexus
wheat snow
the first line is probably the problem here.... i wanted to set the categorial f...
you can't set values on a copy of a slice
which is what that subscript is returning
do you want to sort the whole table based on column 'Weekday'?
alpine nexus
wheat snow
yes
you can do something like
A_Modern.sort_values(by=['Weekday'])
ok
i try it rq
alpine nexus
that returns a copy by default though
if you want to sort in place,
A_Modern.sort_values(by=['Weekday'], inplace=True)
inplace wont work somehow
without it, it runs throught without an error message
alpine nexus
what values are in Weekday again?
 wheat snow
alpine nexus
what did you want to plot again?
wheat snow
alpine nexus
what did you want to plot again?
all the episodes of that series watched on what day (theese are that 0-6)
and y axis is the ammount of episodes aka. every row of A_Modern
alpine nexus
wheat snow
all the episodes of that series watched on what day (theese are that 0-6)
um try
A_Modern.sort_values(by=['Weekday'], inplace=True)

fig, ax = plt.subplots()

A_Modern['Weekday'].value_counts(['Weekday', 'Title']).plot(ax=ax, kind='bar', figsize=(15,10), title="temp")
@wooden sail hey egga, i cant get the numpy to work
iron basalt
steady basalt
it was probably invented to make it easy to coneptualise
Other way around, math tends to start in lower dimensions with geometric proofs (before algebraic notation was even a thing). Then generalized to higher dimensions. It's still useful to be able to visualize these things in lower dimensions because proofs tend to start by first playing around with a more simple version of the same problem (although sometimes the trick is to do the opposite and ask the harder version of the same problem) and that often involves reducing the number of dimensions.
steady basalt
WTF
iron basalt
You can pretty always go up to 3 dimensions nicely, beyond that you have to be really creative to visualize things.
lapis sequoia
is creating a machine learning chat bot (for example) more about training data or code?
like if I want a super responsive chat bot is it more about having lots of good training data or is it still quite dependent on my code
because I have access to really good training data that I'd like use to create a chat bot as a test project
but I have no experience with machine learning or anything like that so I'm not sure if I would be hindering the project due to my lack of knowledge
iron basalt
iron basalt
You can pretty always go up to 3 dimensions nicely, beyond that you have to be r...
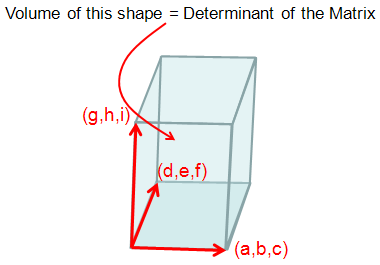
(Also Geometric Algebra makes more complicated things easier to visualize)
steady basalt
lapis sequoia
is creating a machine learning chat bot (for example) more about training data o...
you would not be able to pull that off
if you have no ML experience
unless youre a natural born coding god and can learn on the fly fast
iron basalt
lapis sequoia
is creating a machine learning chat bot (for example) more about training data o...
Both. But you def. need some minimum amount of good data (that captures the cases you care about).
lapis sequoia
for sure, so machine learning is actually quite complicated just to code by itself?
(training data aside)
lapis sequoia
nah, student haha
iron basalt
lapis sequoia
for sure, so machine learning is actually quite complicated just to code by itse...
It depends what, some of it is pre-made for you, and some have nice abstractions / frameworks because of the way it works (e.g. deep learning).
steady basalt
Well what can u code
iron basalt
And some you have to make from scratch.
lapis sequoia
uhh websites, processing lots of data
lapis sequoia
don't really code websites
last thing I worked on was something that simulated the stock market in miliseconds
steady basalt
Well if u can’t code u cant do ml in python really
steady basalt
lapis sequoia
last thing I worked on was something that simulated the stock market in miliseco...
How
lapis sequoia
and then used massive amounts of data to simulate a day
lapis sequoia
steady basalt
Well if u can’t code u cant do ml in python really
ahh
steady basalt
Python ?
lapis sequoia
so machine learning isn't really worth pursuing in python?
I was going to attempt it in python, yes
steady basalt
It is if u know python
lapis sequoia
that's the language I'm most comfortable with now tbh
steady basalt
You didn’t say yet what u code in
lapis sequoia
python
steady basalt
How did u make the simulation
lapis sequoia
mplfinance module for displaying a candlestick chart & then I used a variety of methods to generate price movement
lapis sequoia
what ?
lapis sequoia
yeah, a lot of randomness as well
just generally a lot of factors coming together to try and running the simulation several times until I got an average annual gain that was similar to real life markets
steady basalt
So you basically did a plot that looks like stock market based on real values?
U made arrays with daily values
 steady basalt
Generated with what algorithm?
Random roll tending towards small increases?
With room for small decreases?
lapis sequoia
every second I would generate the data, then for each second in a day add it all up to calculate the final daily gain
lapis sequoia
steady basalt
Random roll tending towards small increases?
pretty much on the surface, yeah! a lot of tweaking with random numbers to replicate real world market results
but I also used some web scraping & such to get real world data to input
steady basalt
And u need to make ur chat bot fast?
I’d recommend first u learn how to code ML methods
You’re gona need to be comfy with csvs to say the least
lapis sequoia
 steady basalt
Looks like Bitcoin
lapis sequoia
haha yeah, this is my volatile model
steady basalt
I’d recommend against nlp as a first project
Simply because it brings in some additional theory that is just more to handle
Do something super simple, use sci kit learn to classify something
lapis sequoia
I mean honestly I don't really intend on working in machine learning fields in the future
this was just a personal project I wanted to work on since I have access to a lot of good data that I think could be put to use in machine learning
steady basalt
U have extracted a lot of text? Online conversations etc?
lapis sequoia
so I don't need anything insanely sophisticated but I'm certainly willing to sit down and learn some essential theory to create a machine learning model
steady basalt
It would be pretty difficult for u to go straight into nlp
lapis sequoia
steady basalt
U have extracted a lot of text? Online conversations etc?
yeah, around 100k worth of messages, thousands and thousands of different conversations
steady basalt
Like this stuff takes a long time to learn
lapis sequoia
steady basalt
It would be pretty difficult for u to go straight into nlp
ahh maybe not worth pursuing then
steady basalt
Try first a simpler project
lapis sequoia
I'll look into it, thanks! 👍
lapis sequoia
steady basalt
You’re gona need to be comfy with csvs to say the least
oh also I do have a lot of experience with CSVs
my entire stock market sim is actually powered by csvs so it could be worth looking into for machine learning
steady basalt
You could try to predict future stock price but don’t expect that to work
lapis sequoia
ahh no, I don't get into that stuff
steady basalt
Again, deep learning is not for a beginner
lapis sequoia
I just wanted to create a simulation for fun
steady basalt
Nlp is deep learning really
lapis sequoia
are there things I can read to grasp the essential concepts though?
maybe I won't be able to code anything for a while
steady basalt
For NLP?
steady basalt
You may have to start at the very beginning of machine learning
Depends how much u wana understand
That would be quite time consuming
lapis sequoia
where does one start? any good documentation?
steady basalt
I guess you cud skip the traditional supervised learning stuff and go right into neural networks
That wud save u a few months
can someone please help me do gaussian elimination in numpy (not pen and paper anymore)
 gilded bobcat
Hi all I have a question on linear regression in sklearn
I am so confused
I have 5000 predictors and 100 observations
I fit a linear regression with sklearn and it actually gives me back coefficients
Why isn't sklearn giving me an error as I am more predictors than observations?
wheat snow
lapis sequoia
oh hello dude
lapis sequoia
wheat snow
oh hello dude
hihi
wheat snow
lapis sequoia
hihi
anyways
SOOO people, im currently working on a netflix watchdata project (big csv file with dosens of rows) and i want to find out, how many hours a day a specific user has watched... my problem is, that i am missing the idea behind it (main problem is that one row doesnt capture one day of usuage. it covers one setting (e.g. 15 min of watching the Witcher) so i cant just add a column "hours per day" and make a calculation for it
as an example

as you can see, we have 2 diffrent days of watchdata here
now i wanna find out how much that user watched at the 22th
this is just an specific example... my main goal is that i can enter 2 diffrent times of days e.g. 22.03 2021 and the 29.03.2021 and i can see how much the user watched oer day, preferable in a graph

this si btw what it looks like
 young granite
u can create a list or a dict as a starting point out of ur data
young granite
not necessarily u can use loc or even key arguments
but if ud like if sure fit aswell
wheat snow
could you specify that
wheat snow
young granite
not necessarily u can use loc or even key arguments
i mean ofc, i can loc a specific day
young granite
i would need to see the input data
wheat snow
the csv?
young granite
wheat snow
i mean ofc, i can loc a specific day
u can loc a range aswell
wheat snow
young granite
u can loc a range aswell
this is doable?
young granite
wheat snow
the csv?
whatever format that is
young granite
wheat snow
this is doable?
sure
precondition is that u input the data in such a way that it will work
wheat snow
thats the excel thingie
 arctic wedgeBOT
Hey @wheat snow!
It looks like you tried to attach file type(s) that we do not allow (.xlsx). We currently allow the following file types: .gif, .jpg, .jpeg, .mov, .mp4, .mpg, .png, .mp3, .wav, .ogg, .webm, .webp, .flac, .m4a, .csv, .json.
Feel free to ask in #community-meta if you think this is a mistake.
young granite
u are not allowed to share just show me the structure
wheat snow
you mind if i sent you teh raw .csv?
young granite
wheat snow
if u present data like this and wont take time to give an good overview not many people will try to help u know
wheat snow
young granite
if u present data like this and wont take time to give an good overview not many...
i have a good overview
young granite
csv is not what people want to see 😄
 young granite
neither screenshots but let me take a look
this is a code discord the people wanna see code
serene scaffold
if you want to represent a dataframe as code, you can do print(df.head().to_dict())
wheat snow
this is the problem so far, i dont have the code for that yet, im missing the idea to show how much hours a user watched a day in a specific period of time
young granite
so u can set a day from 00:00-24:00 all values in that range will then be summarized for a given day
wheat snow
serene scaffold
if you want to represent a dataframe as code, you can do `print(df.head().to_dic...
A value is trying to be set on a copy of a slice from a DataFrame.
Try using .loc[row_indexer,col_indexer] = value instead
wheat snow
young granite
so u can set a day from 00:00-24:00 all values in that range will then be summar...
and how would that look like as a range in the .loc?
young granite
first u would need to choose whether u wanna create a dict or a list
wheat snow
young granite
first u would need to choose whether u wanna create a dict or a list
i know more about lists than dictonarys
young granite
is this a continues project?
wheat snow
young granite
is this a continues project?
wdym
young granite
will u add new data over time to it?
wheat snow
young granite
will u add new data over time to it?
no, the csv is done
no more additions to the raw data
young granite
how many rows does ur csv have?
wheat snow
young granite
how many rows does ur csv have?
depends, i sorted the csv already a few times
wheat snow
young granite
how many rows does ur csv have?
yk there are multible users(6) and i already made 6 diff df for each of them
so, how would the range look like?
im so clueless rn
OK i might have a plan of an idea
young granite
im not able to provide u with a direct solution but i would start as follows:
if XXX-XX-XX (day) in column:
1.sum all day (durations)
wheat snow
- Localize every row which has the same day
- add the durations of theese somewhere together
young granite
ye
wheat snow
like how can i go through my csv and localize every row which has one day ( problem: the date time is converted to datetime, not an object/String anymore)
young granite
wheat snow
like how can i go through my csv and localize every row which has one day ( prob...
no problem u wont need the date for the sum ull simply use it to filter
wheat snow
Start Time datetime64[ns, Europe/Berlin]
that is what type the duration as well as teh start time is
Duration timedelta64[ns]
young granite
u should be able to convert it with numpy i guess
wheat snow
young granite
u should be able to convert it with numpy i guess
a command perhaps?
wait
i gfot it
Start Time object
Duration timedelta64[ns]
young granite
ts = pd.to_datetime(str(date))
d = ts.strftime('%Y.%m.%d')```hpd_E['Start Time']= hpd_E['Start Time'].to_string
if hpd_E['Start Time'].str.contains('2022-06-22'):
so, what do we do after the if statement now?
add it to a list?
wheat snow
young granite
```import pandas as pd
ts = pd.to_datetime(str(date))
d = ts.strftime('%Y.%m.%...
i already converted it back to a object
young granite
add up all true statements and then something like
for key (XXXX-XX-XX) in df:
pint(key:, sum(df["column"])
ill go to bed now u can @ me and i can look over what u got finished tomorrow on the PC and help u maybe by the code but only when u got some code
wheat snow
young granite
add up all true statements and then something like
for key (XXXX-XX-XX) in df:
p...
wdym with true statements?
primal shuttle
True == 1, False == 0 in python
wheat snow
i ment topic related
 untold bloom
@wheat snow so you want to calculate "total duration per day", right?
whenever "per" pops up, we go for .groupby
- here, need to groupby the day of the "Start time"
- then look at the "Duration" column
- and sum what we see
in code, this translates to:
df.groupby(df["Start Time"].dt.date)["Duration"].sum()
I guess you'd like to do this per user as well
no problem, says pandas
you can prepend the username distinguisher to the groupby(...) and it will do it per username and day
so
df.groupby([df["Profile Name"], df["Start Time"].dt.date])["Duration"].sum()
@wooden sail its getting scarier! new concepts
Einstein and gram schmit
i skipepd the last one assessment cause it was elimination in numpy and i literally have better things to do that code that
serene scaffold
I'm watching an ML video, and there's an ad for an online learning platform that says it will teach you "the three kinds of machine learning: clustering, classification, and regression". do we agree that all of ML can fall into these three subclasses?
wheat snow
untold bloom
<@763828494060355654> so you want to calculate "total duration per day", right?
yesyes
wheat snow
untold bloom
```py
df.groupby(df["Start Time"].dt.date)["Duration"].sum()
```
THANK YOU SO MUUUUUCHHH, but.... is there a way to range that? so i can only see the duration per day for like only 14 days
untold bloom
wheat snow
THANK YOU SO MUUUUUCHHH, but.... is there a way to range that? so i can only see...
yes there is but... do you want to see some specific 14 days, or first 14 days, or last 14 days, or random 14 days?
.iloc does integer-based indexing; you can use that for first/last 14 days by passing a slice to it
like we do in normal Python lists etc. e.g., first 14 days: result.iloc[:14]
wheat snow
untold bloom
yes there is but... do you want to see some specific 14 days, or first 14 days, ...
specific 14 days eg. somewhere in 24-3-2019 until 8-4-2019
untold bloom
oh
after making its index a DatetimeIndex, we can directly index into it with those dates
untold bloom
so first result.index = pd.to_datetime(result.index)
then e.g., result.loc["2019-03-24": "2019-04-08"] should do
yes you can take user input or whatever you wish to write those 2 dates.
wheat snow
TypeError: cannot do slice indexing on Int64Index with these indexers [2019-03-24] of type str
 untold bloom
then e.g., `result.loc["2019-03-24": "2019-04-08"]` should do
untold bloom
untold bloom
then e.g., `result.loc["2019-03-24": "2019-04-08"]` should do
please see this^ and what you've written
wheat snow
the df_vd_R is simply the watchdata of the user R
untold bloom
yes yes
 misty flint
has anyone used gensim before https://radimrehurek.com/gensim/
Efficient topic modelling in Python
how was your experience
untold bloom
by "abandoned", i didn't mean we completely forget about it :p
wheat snow
you are always smarter
untold bloom
it's now result that we're trying to index into

 untold bloom
cool
wheat snow
is there a way to convert the Duration column into a straight integer which represents the hours? since i wanna go for a plot
or can i directly plot this ´with the timedate?
misty flint
also has anyone worked with clickstream data before? do you have any references/resources? thanks
wheat snow
misty flint
also has anyone worked with clickstream data before? do you have any references/...
i got a whole csv file from my netflix zip file but havent looke dinto it yet
misty flint

untold bloom
wheat snow
is there a way to convert the Duration column into a straight integer which repr...
you can do that in 2 steps: there's no direct way of getting hours data but you can get total_seconds; then i leave it to you to calculate hours :p
wheat snow
its like web things right?
untold bloom
result.loc[...].dt.total_seconds()
wheat snow
untold bloom
you can do that in 2 steps: there's no direct way of getting hours data but you ...
oh yes pls
misty flint
wheat snow
its like web things right?
tbh i just want to see if i can build a RecSys model off of some sample clickstream data
untold bloom
dt is the "datetime accessor"; we also used in df["Start Time"].dt.day if you noticed.
misty flint
and if it makes sense or not
untold bloom
df["Start Time"].daydirectly won't work; the date-time type series have a special namespace over .dt and we access methods this way
wheat snow
untold bloom
`dt` is the "datetime accessor"; we also used in `df["Start Time"].dt.day` if yo...
ah okay
wheat snow
misty flint
tbh i just want to see if i can build a RecSys model off of some sample clickstr...
hmm
untold bloom
(similar thing happens with .str if you came across. These help separate namespaces.)
untold bloom
untold bloom
`result.loc[...].dt.total_seconds()`
so this will give you the total seconds of each Duration; you can then go for hours.
wheat snow
untold bloom
so this will give you the total seconds of each Duration; you can then go for ho...

hmmmm
wheat snow
untold bloom
(similar thing happens with `.str` if you came across. These help separate names...
yesyes i got to know that yesterday
untold bloom
- you fogot the parantheses at the end 2) you're not assigning or printing it, so...
f is a function, f() is calling it
untold bloom
pandas Series is kind of like a list, why'd you want to do that
but there is .tolist() for that
wheat snow
untold bloom
pandas Series is kind of like a list, why'd you want to do that
so i can start using theese values for a graph chart as my y axis
untold bloom
yeah you can even do .plot() afterwards and it will plot
wheat snow
untold bloom
yeah you can even do `.plot()` afterwards and it will plot
wait what
cant be that simple?!!!
untold bloom
(◕‿◕)
wheat snow
oh yeahhh... there is that other problem... i prepared a plot before


wait, for you to completly understand
arctic wedgeBOT
Hey @wheat snow!
You either uploaded a .txt file or entered a message that was too long. Please use our paste bin instead.
wheat snow
untold bloom
yeah you need to put .copy() at the end of A_Murder = ... and A_Modern = ... lines
when you subset a dataframe and assign new columns to that subset, it's not entirely clear if you modified a view of the original frame or a copy of it
hence the warning
i need to leave now, sorry, hope it goes well
misty flint

eugeneyan.com
Stop procrastinating, go off the happy path, learn just-in-time, and get your hands dirty.

 misty flint
misty flint
misty flint
ok one more then im done spamming, sorry


ok but on a more serious note, eugene yan makes really good points
and provides a better way to learning DS/ML
imo
steady basalt
anyone wana help me re arange equation and make a matrix
misty flint
but am i
steady basalt
i cant cheat thru this with a matrix calculator sadly
so its gona require actual work
 glad mulch
def generate_pnl(df: pd.DataFrame, gain, gain_std, loss, loss_std):
    for col in df.columns.values:
        start_time = time.time()
        print("Generating PNL values for portfolio {}".format(col))
        df[col] = df[col].where(
            (df[col] == 1) &
            truncnorm.rvs(
                1, gain+gain_std, loc=gain, scale=gain_std, size=len(df)))

        df[col] = df[col].where(
            (df[col] == 0),
            -truncnorm.rvs(
                1, loss+loss_std, loc=loss, scale=loss_std, size=len(df)))
        end_time = time.time()
        duration = end_time - start_time
        print(
            f"Completed generating PNL values for portfolio {col} in {duration} seconds")
    return df
anyone know why only the second df[col].where is working?
serene scaffold
glad mulch
```py
def generate_pnl(df: pd.DataFrame, gain, gain_std, loss, loss_std):
fo...
you'll need to give an example of what df is, or it's like asking why an SQL query isn't working when no one knows what kind of data is in the database.
and in what way is it not working?
 burnt citrus
anyone know a better alt to pandas
if not i will just write one
i want one that handles each column as it's own array and I can mutate the state just with std array funcs
serene scaffold
burnt citrus
anyone know a better alt to pandas
"better" in what way?
serene scaffold
burnt citrus
if not i will just write one
this would be a huge investment of your time
there's polars, but I haven't used it.
serene scaffold
burnt citrus
wld be pretty simple i think
implementing the whole pandas spec? the pandas repository on github has almost 30k commits.
let me know how it goes.
burnt citrus
just gona do for csv for now
can u think of a good name for it
making the repo now
serene scaffold
koalas
serene scaffold
it's in my discord profile. but do be sure to note my skepticism that you can implement the whole pandas spec with similar performance in three hours.
burnt citrus
probs not the whole thing just for what I need
GitHub
Contribute to TheArctesian/koalas development by creating an account on GitHub.
glad mulch
serene scaffold
you'll need to give an example of what `df` is, or it's like asking why an SQL q...
so the dataframe that im importing is filled with 0's and 1's
those are the only numbers that are in there
burnt citrus
serene scaffold
it's in my discord profile. but do be sure to note my skepticism that you can im...
o fuck i frogot python isnt rust and i can't do low level shit
it's c time