#data-science-and-ml
1 messages · Page 400 of 1
 misty flint
not necessarily tools
the only one i know is part-time larry
but hes been doing web3 stuff lately and that doesnt interest me atm
 gilded kestrel
maybe noob question, if you have a time series is training a bidirectional LSTM considered data leakage?
 barren wedge
In my opinion
Forecasting is useless
Time series analysis is just another way to drawing a chart
gilded kestrel
I guess this reply is for my question?
barren wedge
gilded kestrel
I guess this reply is for my question?
No but maybe
Lol
gilded kestrel
haha
 versed gulch
Hi does anyone know how to upscale a 3D image i.e. producing much finer slices. For example, my image is of size (30, 400, 400) (number of images x height x width) and I want to convert this to (40, 400, 400)
 tidal bough
Huh, interesting. So do you want to interpolate between the slices somehow?
versed gulch
tidal bough
Huh, interesting. So do you want to interpolate between the slices somehow?
yh
tidal bough
You can use scipy.interpolate.interp1d
if that's for something like model training though, I'm not sure the new slices will be useful (they are just made from original ones after all)
versed gulch
tidal bough
if that's for something like model training though, I'm not sure the new slices ...
no I'm using this to filter the vessels by making my image istotropic
versed gulch
tidal bough
You can use `scipy.interpolate.interp1d`
however my image is 3D not 1D?
 mild dirge
versed gulch
however my image is 3D not 1D?
mild dirge
versed gulch
however my image is 3D not 1D?
yeah but you would interpolate for each pixel basically
So in the end you could still use 1d interpolation
versed gulch
mild dirge
So in the end you could still use 1d interpolation
how so?
mild dirge
For each pixel you can interpolate over all images
Each pixel is just a value, so you'd have 30 values per pixel location
and can use 1d interpolation for that
versed gulch
ok so a (30,) --> (40,)?
 pliant marten
whats the easiest way to make machine learning for a game?
mild dirge
pliant marten
whats the easiest way to make machine learning for a game?
That's way too general of a question
mild dirge
mario kart, platformer 2d, platformer 3d, mario party?
versed gulch
mild dirge
basically
so how would you assess each pixel of those 30 slices?
tidal bough
versed gulch
however my image is 3D not 1D?
Your x-coordinate, as far as interp1d is concerned, is the height (frame number, whatever). The values at each x-coordinate is a 400x400 image (notice that interp1d supports multidimensional y-values). Since you're only interpolating along one input variable, it's 1d interpolation.
mild dirge
pliant marten
the first level
There's plenty of videos on it*
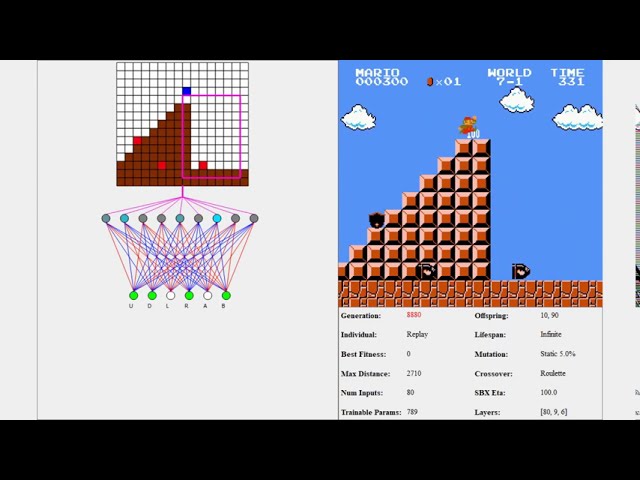
Using a Genetic Algorithm and Neural Network, a population of AI were able to learn to play different levels of Super Mario Bros for the NES.
Code: https://github.com/Chrispresso/SuperMarioBros-AI
Blog: https://chrispresso.github.io/AI_Learns_To_Play_SMB_Using_GA_And_NN
Music: https://soundcloud.com/ashamaluevmusic
first song: Memory
second so...
Like this one f.e. (haven't watched, but highest result on yt)
versed gulch
tidal bough
Your `x`-coordinate, as far as `interp1d` is concerned, is the height (frame num...
so it would be
scipy.interpolate.interp1d(threeD_image, (40, 400, 400), kind='linear')?
that's not how the arguments to it go, I'm pretty sure
!docs scipy.interpolate.interp1d
 arctic wedgeBOT
class scipy.interpolate.interp1d(x, y, kind='linear', axis=- 1, copy=True, bounds_error=None, fill_value=nan, assume_sorted=False)#```
Interpolate a 1-D function.

*x* and *y* are arrays of values used to approximate some function f:
`y = f(x)`. This class returns a function whose call method uses
interpolation to find the value of new points.first argument is the interpolation variable. For you it's, say, linspace(0,1,len(threeD_image)). The y would be your threeD_image indeed.
Then to interpolate using the interpolator it returns, you'd do interpolator(linspace(0,1,100)), for example, which will give you 100 evenly-spaced slices.
versed gulch
tidal bough
Then to interpolate using the interpolator it returns, you'd do `interpolator(li...
sorry just a bit confused with this part of the interpolator
tidal bough
interpolator being what interp1d returns
versed gulch
tidal bough
`interpolator` being what `interp1d` returns
so this?

from scipy.interpolate import interp1d

interpolator = interp1d(x = np.linspace(0,1,len(threeD_image)), y = threeD_image)
yup
 lapis sequoia
c i think?

 tidal bough
ah, yeah, you do - it defaults to -1
mild dirge
lapis sequoia
c i think?
We can't just give the answer to hw/exam questions
lapis sequoia
mild dirge
We can't just give the answer to hw/exam questions
it's study for an exam tomorrow from a past paper just wanted to check if im right.... i think c because you should try the other options before doing this
 brazen sapphire
Hey guys, this may be belonging more into "general" but its super packed there and it kind of belongs here too so:
csv_writer = csv.writer(f)
  for i in range (1,len(data_list)-1):
     for j in range(0,len(data_list[i])):
        csv_writer.writerow(data_list[i][j])
"iterable expected no float" - how can i achieve to split my list of tuples into a proper table like i am aiming to with this?
tidal bough
csv_writer.writerow wants a row at a time. You seem to be passing it an element at a time.
brazen sapphire
Makes sense. Unfortunately a row of a list is an element
Seems like i might have to make an array out of my list first, thanks for your advice
 mighty spoke
Hi i'm trying to code this recursive relation but its giving me an error saying
IndexError: index 256 is out of bounds for axis 0 with size 256 I think its because i'm using th list/array u is not big enough since I refer to u[i+1], and u[i+2] which is outside the range I am looking at. But i'm not sure how to fix this. ```import matplotlib.pyplot as plt
import numpy as np
import pandas as pd
from scipy.fft import fft, fftfreq
from scipy import fftpack
data = np.loadtxt('data.txt')
x=np.arange(0,1.024, 4e-3)
T=4e-3
N=256
#amp=data**2
#yf = fft(amp)
#xf = fftfreq(N,T)
#plt.plot(xf, yf)
def alg(u,t):
for i in range(0,N-1):
for j in range(1,N-1):
u[i]=x[i]+2np.cos((2np.pi*j)/N)*u[i+1]-u[i+2]
ak=(1/N)u[0]-u[1]np.cos((2np.pij)/N)
bk=(1/N)u[1]np.sin((2np.pij)/N)
p=(ak)**2+(bk)**2#power
return ak, bk, p
y=alg(data,x)
print(y[0])``` This is a pic of the equations i'm using
 mild dirge
well if there is no [n+1] or [n+2] then you either,
- stop early
- pad the array
mighty spoke
mild dirge
well if there is no [n+1] or [n+2] then you either,
1. stop early
2. pad the arr...
Hi but there is a [n+1] and [n+2]
mild dirge
then there will be no index error
mighty spoke
mild dirge
then there will be no index error
yeah but in the pic i sent there's an n+1 and n+2
in the relation
mild dirge
but in your array there is not
you can't take [n+1] if your n is at the end of the array
mighty spoke
yhh i guess i can work out u1 and u0 instead as thats all i need
mild dirge
What they say is to set Un+1 and Un to 0
and then you only have to compute for N-1, N-2...0
So if you do that, there will be no issue
So their solution is padding with 0's
misty flint
interesting concept here:

simple but easy way to get more mileage out of ML models i believe
mighty spoke
mild dirge
What they say is to set Un+1 and Un to 0
ah yeah i'll try that thanks
 eager wedge
cm_df = pd.DataFrame(cm, index = ['Glioma', 'Meningioma', 'Pituitary'], columns = ['Glioma', 'Meningioma', 'Pituitary'])
plt.figure(figsize=(5,4))
sns.heatmap(cm_df, annot=True)
plt.title('Confusion Matrix')
plt.ylabel('Actal Values')
plt.xlabel('Predicted Values')
plt.show()
Why no work? Error message -> Classification metrics can't handle a mix of multilabel-indicator and continuous-multioutput targets
 fervent flicker
@eager wedge there's a problem with how you've made y_test and y_pred
post that code and i'll let you know what's wrong
 balmy burrow
Dunno if i am butchering the right place but "ValueError: all the input array dimensions for the concatenation axis must match exactly, but along dimension 0, the array at index 0 has size 16512 and the array at index 3 has size 8" error is caused by some sort of missing data?
nvm brainfarted and forgot numpy concantrate needs 2d arrays.
 serene scaffold
balmy burrow
nvm brainfarted and forgot numpy concantrate needs 2d arrays.
serene scaffold
balmy burrow
nvm brainfarted and forgot numpy concantrate needs 2d arrays.
In [1]: a = np.array([1, 2, 3])

In [2]: a.shape
Out[2]: (3,)

In [3]: np.concatenate((a, a))
Out[3]: array([1, 2, 3, 1, 2, 3])
yeah i just splited an array with a[:, b] it works too probably.
 daring cape
is someone able to help me with this?
 tall blaze
So if I have a data set consisting of numeric and categorical variables. How can I show a correlation coefficent to y(y is a numeric) where I am comparing apples to apples? Additionally if I am feeding this data into a DNN what is a way I could visualize how each variable effects the accuracy of the model?
mild dirge
if some feature is categorical, you can show a histogram, with the average value (or maybe even a boxplot) of y for each category
For others you could indeed plot the correlation (the x value with y values in a scatter plot)
To find out the effect of a single variable on the resulting performance, you could try feeding some inputs with the specific feature randomized
tall blaze
is there anyway to quantify a correlation for the cat variables that would be comparable to the pearson correlation for the numerical variables
and ok
interesting
mild dirge
tall blaze
is there anyway to quantify a correlation for the cat variables that would be co...
not sure
tall blaze
basically I have stakeholders who want to know what variables "made the difference" for a dnn I built them
mild dirge
Well just a correlation won't tell you everything
maybe only combinations of certain features were important for deciding the output
tall blaze
I am thinking of dimensionality reduction somehow but that is tough to explain
mild dirge
mild dirge
To find out the effect of a single variable on the resulting performance, you co...
This would tell you more I think, but I just heard this was a method, maybe look into seeing how reliable this is for telling the importance of a feature
and how exactly to randomize the value
tall blaze
ok do you know how to randomize certian nodes in a dnn
input nodes*
do I just randomize the x_train
mild dirge
You wouldn't randomize nodes, you would randomize the specific feature of the input
tall blaze
ahhhh ok
mild dirge
So the DNN basically can't get information from it anymore
tall blaze
and I would have to fully train the model for each input wouldnt I?
mild dirge
Don't think so
Again, I just heard someone say this was a method to check what inputs were important
Not too sure on the specifics
tall blaze
ahh ok
mild dirge
Machine learning algorithms usually operate as black boxes and it is unclear how they derived a certain decision. This book is a guide for practitioners to make machine learning decisions interpretable.
tall blaze
snap this helps
mild dirge
So basically just change a single feature for every data point, feed to model, compare to error without randomizing
you can do this for every feature
mild dirge
you could literally just shuffle the feature column
that way you still get values in the correct range
tall blaze
ok and no differentiaton between the num and cat inputs?
I am not seeing reason any but I guess I just need some handholding today
mild dirge
For shuffling I don't think so no
For correlation I am not sure what to use for categories
for visualizing you could make a histogram like I said, not sure about a single measure telling "correlation"
tall blaze
Awesome and ohhhh it clicked I am running it out of model predict by randomizing the x_test columns then comparing the change in MSE
Thank you!
 karmic valley
Pls help
 odd meteor
tall blaze
is there anyway to quantify a correlation for the cat variables that would be co...
odd meteor
tall blaze
is there anyway to quantify a correlation for the cat variables that would be co...
There are 3 methods (that I know of) you could use to understand if a continuous and categorical features in your data are significantly correlated. As you probably might have realised, it's tautology in Statistics to measure the correlation between a numeric feature and a categorical feature in your dataset using the conventional Pearson correlation.
- Point Biserial correlation
The point biserial correlation coefficient is a special case of Pearson’s correlation coefficient. You can make more research to understand this (I'm not too familiar with this approach)
- Logistic regression
The idea behind using logistic regression to understand correlation between variables is actually quite straightforward and follows as such: If there is a relationship between the categorical and continuous variable, you should be able to construct an accurate predictor of the categorical variable from the continuous variable.
If the resulting classifier has a high degree of fit, is accurate, sensitive, and specific we can conclude the two variables share a relationship and are indeed correlated.
- Kruskal Wallis H Test.
A significant Kruskal–Wallis test indicates that at least one sample stochastically dominates another sample. Although the test does not identify where this stochastic dominance occurs. However, for analyzing the specific sample pairs for stochastic dominance, Dunn’s test, pairwise Mann-Whitney tests w/o Bonferroni correction, Conover–Iman test are appropriate or t-tests when you use ANOVA.
NB: Kruskal-Wallis test is a non parametric test.
I wouldn’t wanna go deep into stats explanations. But I do hope you'll be curious enough to proceed with your research and make progress from there.
This table summarizes what I'm tryna say
 serene scaffold
for a moment I thought I had ended up on the rules page for a different discord or something
odd meteor
serene scaffold
for a moment I thought I had ended up on the rules page for a different discord ...
😊 I guess I need to learn brevity
karmic valley
Basically in my data I have 15 patients and for each patient I am analysing parameters at 5 time points (Baseline, Immediate Sonovue injection, 20s after sonovue, 40s after and 1minute after). For each time point for each patient I have calculated a signal intensity value. I have also calculated an AI Quality score for the same point. So in total I have 75 values of intensity (5*15) and 75 values of AI quality.
I want to do a correlation graph of AI quality and intensity. I thought of plotting 75 points on a graph and then doing line of best fit and then doing pearsons coefficient to get correlation. However, I read online that pearsons requires data to be independent and I think my data is not all independent as I have 5 points for the same patient on the graph? If this is not something I can use, is there any other way to simply get a correlation coefficient?
serene scaffold
odd meteor
😊 I guess I need to learn brevity
if you know what you're talking about, it takes more effort to be brief than to be thorough. but that wasn't my point, in either case.
odd meteor
serene scaffold
if you know what you're talking about, it takes more effort to be brief than to ...
That's true. Although, long post can sometimes be tiring to read... 😀
odd meteor
karmic valley
Basically in my data I have 15 patients and for each patient I am analysing para...
Yeah. Your explanatory variables needs to be independent. If they aren't, you'll most likely notice they'll have a very high correlation amongst themselves (signalling presence of multicolinearity)
I'm not into medical practice but it seems your features are time dependent. Try to plot the correlation matrix first and observe the result.
If your fear is confirmed positive, then you might wanna engineer more features + apply feature interactions
karmic valley
I will try to Google how to do correlation matrix. What will that tell me and what do I do with that information
Can I share my data it's not long
arctic wedgeBOT
Hey @karmic valley!
It looks like you tried to attach file type(s) that we do not allow (.xlsx). We currently allow the following file types: .gif, .jpg, .jpeg, .mov, .mp4, .mpg, .png, .mp3, .wav, .ogg, .webm, .webp, .flac, .m4a, .csv, .json.
Feel free to ask in #community-meta if you think this is a mistake.
karmic valley
odd meteor
karmic valley
I will try to Google how to do correlation matrix. What will that tell me and wh...
It will show you the correlation score of every feature in your dataset.
Yes you can. But I can't infer the correlation score by just looking at your data
karmic valley
okay ill briefly just explain what the data is. so 1st and 2nd column is the two variables i want to correlate. the column period tells you at what time point that measurement was taken (5time points). the patent number column tells you what patient so 15 patients and each patient has variables at the time points measured
it shows easier when you download it as csv
karmic valley
odd meteor
It will show you the correlation score of every feature in your dataset.
Yes yo...
so doing a correlation matrix allows for non-independent data?
odd meteor
karmic valley
okay ill briefly just explain what the data is. so 1st and 2nd column is the two...
I'll take a look at it when I'm up. It's 2:45 am here and I'm very sleepy now. I must disappear now 🙏
karmic valley
aha no problem!
yes would appreciate if you could help with this when youre free tomorrow. been stuck on it for ages lool
odd meteor
karmic valley
so doing a correlation matrix allows for non-independent data?
Yes. A correlation matrix tells you the correlation score between the dependent variable and the independent variables, as well as the correlation between an independent variable and other independent variables.
karmic valley
does it allow for paired data too like in my case.?
 bold timber
Why I get an error like this? How to fix out?

 desert quartz
Hello people, I hope you have a nice day. How could I avoid that when I am making a loop of requests to an API, if the internet cuts me, I lose all the queries that the program had already made and have to start over.
In python is my query
Practically, if the communication is cut, the program waits for it to resume and does not break
serene scaffold
desert quartz
Hello people, I hope you have a nice day. How could I avoid that when I am maki...
this is not a data science question. see #❓|how-to-get-help to read how to ask in a general help channel
desert quartz
I get it. sorry
 drifting oasis
trying to add a line after each tweet so i can see my data better, please help
 odd meteor
karmic valley
does it allow for paired data too like in my case.?
odd meteor
karmic valley
does it allow for paired data too like in my case.?
You could use the groupby() method on your patient column to get a more summarized view of the data.
Yes you can perform correlation on your SNR and AI Qual columns.
bold timber
Hi, I have a question, why if we use a different version of sklearn causes get different scores? If the new version provides a score less than an old version, which is better?
odd meteor
bold timber
Hi, I have a question, why if we use a different version of sklearn causes get d...
I'm not sure you're experiencing difference in scores because of the sklearn versions.
What metric were you calculating?
bold timber
odd meteor
I'm not sure you're experiencing difference in scores because of the sklearn ver...
I have several times used different versions of sklearn and I got different results of scores. I just wondering why did it happen
I use r-squares to evaluate the model
I try to reinstall of python version and I only can use the version of sklearn more than 0.24.0 and then I get a score of model is less than when I use the sklearn version 0.22.2
Maybe it causes when I get a new python version? or what?
 upper spindle
Is there a way to replicate this graph like this using the frequency of the values per date

 odd meteor
bold timber
I have several times used different versions of sklearn and I got different resu...
odd meteor
bold timber
I have several times used different versions of sklearn and I got different resu...
Your explained_variance_score (R^2) will only vary if you didn’t set same seed or use same random_state when running your code with different versions of sklearn
 supple leaf
Good day everyone. Does anyone have an idea how I could calculate whether the derivative is positive or negative where the blue line crosses the dotted red line in my graph? Would very much appreciate any tips.
 bold timber
odd meteor
Your explained_variance_score (R^2) will only vary if you didn’t set same `seed`...
bold timber
odd meteor
Your explained_variance_score (R^2) will only vary if you didn’t set same `seed`...
I always use a random state in the model, but it still gets a different score
This is my model to evaluate the score. Before this, I have scored 92.8 % on test_score when I use 0.22.2 version of scikit learn

 rose agate
supple leaf
Good day everyone. Does anyone have an idea how I could calculate whether the de...
rose agate
supple leaf
Good day everyone. Does anyone have an idea how I could calculate whether the de...
Can't you just tell it's positive by looking at it? Anyway, if you know the point of intersection, and have a function for the blue line, I think you might just be able to get two very close points, e.g. 45 and 45.01 and get a decent estimate for the gradient based on those. There might be some actual functions that calculate gradient that I don't know about though
rose agate
bold timber
I always use a random state in the model, but it still gets a different score
T...
I can't say why it's different, maybe they slightly altered some functions, but if the accuracy has gone from 92.8% to 91.6%, I don't think that's much of a problem. It's a small random deviation which I don't think indicates worse performance unless your sample size is pretty large.
supple leaf
rose agate
Can't you just tell it's positive by looking at it? Anyway, if you know the poin...
I forgot to add important information, the x axis will stretch all the way to 1000 hours. Therefore the blue line will cross the red line a lot of times. What im actually looking for is to know when the blue line is above/below the red line. Maybe it would just be too complicated to calculate the derivative. Maybe I can just look when the value of the blue line is greater than the red line => the blue line is above the red line
odd meteor
bold timber
I always use a random state in the model, but it still gets a different score
T...
When you split your data into train and validation set, did you also set a seed?
rose agate
supple leaf
I forgot to add important information, the x axis will stretch all the way to 10...
yep, I'd probably just step through 1 hour at a time, and find the instances where it goes from below to above or above the below the line
supple leaf
rose agate
yep, I'd probably just step through 1 hour at a time, and find the instances whe...
Perfect, thank you 🙂
bold timber
rose agate
I can't say why it's different, maybe they slightly altered some functions, but ...
Of course
 sullen dirge
hi guys , sorry to interrupt
but like i took data analyst as my course
learning python currently
any advice what shall i learn so i can be ahead from class ?
bold timber
rose agate
I can't say why it's different, maybe they slightly altered some functions, but ...
The dataset is not too large, it only has 1460 values and 75 features. And then I only use 30 feature
odd meteor
bold timber
I always use a random state in the model, but it still gets a different score
T...
To be honest, I don't see any problem with the little difference in scores here. So there's no need to be worried about the little difference. Also, you don't need to switch to different versions of sklearn. Both scores are quite close.
rose agate
bold timber
Of course
I encourage you to do it on your own but I wrote this in case you get stuck
import matplotlib.pyplot as plt
import numpy as np

ls = np.random.rand(30)*10

line = 4
for i in range(1, len(ls)):

    if ls[i] > line and ls[i-1] < line:
        print("Gradient positive at:", i, "crossing the line")

    if ls[i] < line and ls[i-1] > line:
        print("Gradient negative at:", i, "crossing the line")


plt.plot(ls)
plt.axhline(y = line, color = 'r', linestyle = '--')
I think like that, but I wonder if I use that model in competition whether can affect my leaderboard? When I use my old score, which is 92.8% I got to be in the top 4% on the leaderboard.
supple leaf
rose agate
I encourage you to do it on your own but I wrote this in case you get stuck
```
...
Was that for me or for "noway"? Since it looks like you answered "noway" 🙂
odd meteor
sullen dirge
any advice what shall i learn so i can be ahead from class ?
Usually in school, we are given our complete curriculum and scheme of work before/on the 1st class of each semester. So you can start from there I guess. You're doing great by learning Python as well. 🦾
rose agate
oops lol
rose agate
rose agate
I encourage you to do it on your own but I wrote this in case you get stuck
```
...
@supple leaf
thanks
wait you replied to that
ignore me
sullen dirge
odd meteor
Usually in school, we are given our complete curriculum and scheme of work befor...
mmm i feel like they arent teaching what they should , in the first semester i get to learn R but it was very rushed . Plus i dont think teachers are that good so i am studying more online but appreciate the help 🙏
supple leaf
rose agate
<@202184134976733184>
Haha im a bit confused. But it kind of looks like the code you write would be a very good direction towards my first idea with using gradients for knowing when the blue line is crossing the red line, right? I truly appreciate it!
rose agate
supple leaf
Haha im a bit confused. But it kind of looks like the code you write would be a ...
let me know if you need any part of it explained
supple leaf
rose agate
let me know if you need any part of it explained
Will do, will look at it and work on it now. Thanks once again
odd meteor
bold timber
I think like that, but I wonder if I use that model in competition whether can a...
Ohh it makes more sense now.. When it comes to hackathons and competition, even a 0.01% increase counts 😄 Since your model's performance is quite good, you can try to squeeze out more juice from your model to rank higher in the LB by using any of these ensemble tricks: Weighted Average, Blending, Stacking, Voting etc.
supple leaf
rose agate
let me know if you need any part of it explained
ls = np.random.rand(30) * 10
This line creates a random function right? I would have to find the function for my blue line?
rose agate
supple leaf
```py
ls = np.random.rand(30) * 10
```
This line creates a random function right...
it creates a list with some random numbers just for the example, you'll need a list with the value of the blue line at every timestep
supple leaf
rose agate
it creates a list with some random numbers just for the example, you'll need a l...
Ahhh okok!
bold timber
odd meteor
Ohh it makes more sense now.. When it comes to hackathons and competition, even ...
But still, I don't know why I got a different score with my model when I use different version of my sklearn and python version 😅
But, thank you for discussion, I've learned something new from you.
odd meteor
bold timber
But still, I don't know why I got a different score with my model when I use dif...
Sometimes these things can be tricky to figure out. I remember one time at my office where a model's performance was quite good but after the model was deployed the model performance reduced.
I could recall the guys who built the model spent days trying to figure out what went wrong. I think it was on the third day they realized it was from the system OS. Apparently, two system OS could handle data splitting differently.
Model was built on Windows OS and deployed on Mac Os. They fixed the problem by using Docker.
On a normal day, there was no way I coulda imagined maybe the problem was from the OS. 😀
bold timber
odd meteor
Sometimes these things can be tricky to figure out. I remember one time at my of...
What is docker? can you explain to me?
Hi, I also wondering how to deploy machine learning model? can you give me a recommendation source to learn of deployment? @odd meteor
odd meteor
bold timber
What is docker? can you explain to me?
Docker is a tool that's used to combine a software application code and its dependencies as a single package, that can run independently in any computer’s environment. A developed software application may depend on a tone of dependencies and the dependencies of a software may fail to install due to differences in coding environments such as operating systems or poor environment setup. If we can isolate the software in such a way that it will be independent of the computer’s environment, the frustrations of failed dependencies to use a software will be greatly reduced.
Example
A machine learning software application is built in python for classifying objects in images and videos. The goal of the engineer is to make this software available for everyone to use. In reality, using the software will require you to install deep learning libraries like tensorflow or pytorch, additional dependencies like opencv, numpy and a tone of other packages. The engineer can easily package this software’s code and dependencies as a single package using docker. Thereby, making it possible for anyone to download the machine learning software application as a dockerized application and use it without worrying about installing its dependencies.
Docker is mostly used in DevOps and MLOps. I'm really not into MLOps yet so my experience in using it isn't too solid at this time.
odd meteor
bold timber
Hi, I also wondering how to deploy machine learning model? can you give me a rec...
Most online ML courses don't teach MLOps or model deployment in general. However, I learnt model deployment by reading documentation and watching YouTube videos on how to deploy a model.
If you are interested in MLOps, consider checking out these websites
Machine Learning Engineering for Production (MLOps) Specialization
Learn how to responsibly deliver value with ML.
lapis sequoia
This is a very generalized question, I know people who are doing certis like assiciate devops/professional devops in AWS mentioned that it helps, its challenging and its worth. But there is also ML Speciality certificate by AWS is worthy?
because it will make you learn some things about AWS which may or may are not needed as a data scientist person. So should one think about preparing about it in free time?
I need opinion on this and will appreciate any positive or negative opinion.
link of course: https://aws.amazon.com/certification/certified-machine-learning-specialty/
Thanks!!

Amazon Web Services, Inc.
Earning AWS Certified Machine Learning – Specialty validates expertise in building, training, tuning, and deploying machine learning (ML) models on AWS. Learn more about this certification and AWS resources that can help you prepare for your exam.
 plucky vine
r = requests.post(
"https://api.deepai.org/api/text2img",
data={
'text': text,
},
headers={'api-key': 'e1d60515-9c7f-4586-92b5-994771e99b9b'}
)
print(r.json())```
when i runs it, it showing 2 values named {id} and {output_img}. but i only need output img. so how can i get it. pls help me mortal wren
Can someone recommend some interesting open source projects on AI and ML? Specifically projects that are still under active development
serene scaffold
plucky vine
```py
r = requests.post(
"https://api.deepai.org/api/text2img",
...
you should regenerate the api key now that you've leaked it
 river citrus
Hello, i have a question.
ive never coded an ai in python, so im asking if its even possible.
i have a large number of images, and i want to quickly identify images that contain text. (simple text, mabe by computers. not photos of signs or smt)
is that possible?
im currently using pytesseract to extract the text from the images, this is rather slow tho.
im thinking that an ai could possibly decide that relatively fast, but as i said i have no experience so im not sure.
im happy for any reply or comment on this matter.
serene scaffold
river citrus
Hello, i have a question.
ive never coded an ai in python, so im asking if its...
state-of-the-art AIs require a lot of computation power and are going to be slower than simpler AIs.
river citrus
ive heard that its only computationally expensive to train the ai, identifying the images in the end should be fast.
is that incorrect?
serene scaffold
river citrus
ive heard that its only computationally expensive to train the ai, identifying ...
are you aware that pytesseract is an AI?
serene scaffold
it's also the one that everyone uses for this task
river citrus
i just doubt that it takes so long to detect if an image contains text
i understand that it can take longer to actually read the text
serene scaffold
so you don't actually care what the text is?
serene scaffold
that wasn't explicitly clear from your question. let me think
river citrus
sorry, ill try to better formulate my questions in the future
serene scaffold
no problem. I'm still looking into it for you.
@river citrus this article talks about a system for finding the bounding box over text in images, without deciding what the text is. but it will detect any text, including signs and shirts and stuff. https://pyimagesearch.com/2018/08/20/opencv-text-detection-east-text-detector/

In this tutorial you will learn how to use OpenCV to detect text in images and video, including using OpenCV's EAST text detector for natural scene text detection.
but just figuring out where the text is is a simpler problem
river citrus
wow thank you very much. ive googled for some time. but i was missing the right keywords aparently
serene scaffold
btw, I should plug our brand new #media-processing channel
river citrus
serene scaffold
btw, I should plug our brand new <#971142229462777926> channel
ill do that. 👋 thx
serene scaffold
river citrus
wow thank you very much. ive googled for some time. but i was missing the right ...
no problem!
serene scaffold
serene scaffold
btw, I should plug our brand new <#971142229462777926> channel
@devout sail where is my cookie
 echo lance
i also need help...but for the basics only @lucid abyss can you help me ??
 lucid abyss
No bro I need help with it
echo lance
do you know any good source for learning DL and NN ?..for beginner
serene scaffold
lucid abyss
Is anyone confident in deep learning and neural network
you should always ask your actual question, not if someone knows about a general topic.
lucid abyss
I need em to tutor me
 devout sail
serene scaffold
<@512354988157173763> where is my cookie
devout sail
serene scaffold
<@512354988157173763> where is my cookie
🍪
misty flint
odd meteor
Most online ML courses don't teach MLOps or model deployment in general. However...
great resources. i forgot i had the first one bookmarked but you reminded me to add this to my to-do list on my notion 
lapis sequoia
Hello, recently got back into codecademy and I have completed the "Breast Cancer Classifier Project" in the machine learning projects. - Yet on my graph - the accuracy appears to be going down over time ? Am I misunderstanding something here?
 lucid abyss
Hello anyone good?
 old stump
so, I dont do a lot of data and numpy stuff as I am mostly a web developer and just general linux man.
I have a question i cant make sense of the parameters to reshape.
    video = (
        np.frombuffer(
            out, np.uint8
        ).reshape(
            [-1, height, width, 3]
        )
    )
so... reshape here is making an ndarray from the dimensions of the video which is a pipe of rawvideo from ffmpeg. What is the -1 specifying here? the 3 means a 3d array?
mild dirge
no, the 3 means 3 channel
so basically rgb
then you have the height and the width of each image
and the -1 is basically whatever is left
So if you have 50 images, then that -1 would make it 50 x height x width x 3
old stump
i see, ty
 tranquil yarrow
lapis sequoia
Hello, recently got back into codecademy and I have completed the "Breast Cancer...
tranquil yarrow
lapis sequoia
Hello, recently got back into codecademy and I have completed the "Breast Cancer...
It would appear you've done something wrong.
lapis sequoia
mild dirge
over time? <@456226577798135808>
Yeah, after a bit of research you were right, thank-you!
mild dirge
I was right about what?
You still don't know why accuracy degrades over epochs do you?
upper spindle
what does the validation set do in plain english
every youtube video and google search pages just complicate it
mild dirge
used for validating how well your model performs while you are still training
we use a validation set instead of the test set for this to prevent overfitting on the test set
Otherwise we "taint" the test set, and the final accuracy we get on the test set wouldn't be "fair" as we have used it in the process of designing our model
upper spindle
mild dirge
Otherwise we "taint" the test set, and the final accuracy we get on the test set...
thank you
lapis sequoia
mild dirge
You still don't know why accuracy degrades over epochs do you?
my understanding of it is the learning rate is too high, the program then converges too quickly, and this leads to failure in the accuracy of the program because of noise ?
mild dirge
It is probably overfitting
old stump
what sorts of things can you do with a video that is represented as a numpy array?
mild dirge
I'm currently working on a classifier for character images, but the dataset is very imbalanced, how would I split this data into train/test
old stump
there are a lot of guides on how to do this but not any of why you would do it.
mild dirge
 mild dirge
mild dirge
mild dirge
Should I just get a set amount of images per class, or a proportion?
 desert oar
mild dirge
Should I just get a set amount of images per class, or a proportion?
desert oar
mild dirge
Should I just get a set amount of images per class, or a proportion?
you can use stratified sampling to take a % from each class. the thing about the smaller classes is that "20%" means something very different for 300 classes vs 10 classes, and 2 classes in the test set might not be enough. so you might need to do something like 50/50 for the classes with fewer than 20 members, and 80/20 for the rest
on the other hand, you also need to be able to evaluate performance before "burning" your test set. so you also need to be careful w/ cross-validation that you have at least 1 instance of the rare class in each fold
you can also use class weighting in your model
and because these are images, you can (probably should) use data augmentation to create more instances, e.g. stretching or blurring or altering colors etc
mild dirge
desert oar
on the other hand, you also need to be able to evaluate performance _before_ "bu...
Yeah was planning to do that, this is a good point too
desert oar
hopefully augmentation gives you enough extra instances that you don't need to care so much
upper spindle
are nodes and neurons the same thing in an lstm model
 woven coral
 upper spindle
also what is the main purpose of an lstm layer
woven coral
any solution??
upper spindle
google and youtube are not doing my any favours
woven coral
how to slove this problem??
serene scaffold
woven coral
I don't help when the question is presented only as a screenshot; it may be that other people reading the channel feel similarly.
serene scaffold
upper spindle
also what is the main purpose of an lstm layer
you can use LSTMs for sequences of data, like text, audio, or video. Whereas traditional neural layers mostly deal with data points that have a fixed number of features (like images and tabular data)
upper spindle
serene scaffold
you can use LSTMs for sequences of data, like text, audio, or video. Whereas tra...
thanks
balmy burrow
Can anyone explain what is "dot" here? I know x_b.T returns transpose of matrix but cant figure out what .dot does.

and yes my linear algebra and math sucks, sorry for dumb question.
tidal bough
.dot for matrices is matrix multiplication.
I prefer using the @ operator, myself, but some people use .dot for some reason.
balmy burrow
tidal bough
`.dot` for matrices is matrix multiplication.
thank you!
desert oar
tidal bough
I prefer using the `@` operator, myself, but some people use `.dot` for some rea...
.dotpredates@, so habit (and backward-compatibility, until recently)- i was morally opposed to adding
@/__matmul__to python, even if it directly benefits my work 😛
tidal bough
elaborate on 2? 🥴
balmy burrow
I dont even know if I should go beyond chapter 3 in hands-on machine learning,seeing all you people and everyone knowing maths on python or math irl really well lol
upper spindle
last question, what does units mean in the lstm layer
and what does the dense layer do
thanks in advance
 iron basalt
tidal bough
I prefer using the `@` operator, myself, but some people use `.dot` for some rea...
iron basalt
tidal bough
I prefer using the `@` operator, myself, but some people use `.dot` for some rea...
IMO, dot is still better, @ adds yet another thing someone needs to learn / memorize. Anybody can see dot and understand what that means (without really knowing Python).
@ is also not used in mathematics for this AFAIK (I know there are some very strange notations out there).
tidal bough
There's two reasons I dislike .dot:
- It has a dual meaning depending on the shapes involved: matrix multiplication and vector dot product - and the name seems to imply the latter. IMO that's at least as confusing as a new operator.
- As it's a function call, it makes for tons of nested parentheses. Compare:
x_b.T.dot(x_b.dot(theta)-y)
x_b.T @ (x_b@theta - y)
Well, dot product can be between vectors, or matrices, etc, so the naming is correct. A new operator unlike "dot" has no meaning at all. So while dot may apply to too many things, @ applies to nothing (it's not a thing) (in terms of the meaning of the word / symbol). The extra parenthesis is not ideal. Ideally it would have been something like AB, but that is just parsed as one token by Python (an identifier), and . is already the access operator (I don't know if this can be overloaded)
For matrices specifically I also use matmul instead of @, making it very obvious.
It's not a super big deal, they just need to quickly look up @, but I like to have as little of those type of language specific lookup moments as possible (or lookups in general (so I don't use crazy complex functions (e.g. einsum) either if I can help it)).
(The less lookups is also why type hints are great, because then if I don't know what exact type the function returns, but I understand the meaning of its name, I don't have to look it up if the code has a type hint)
(Basically, not being rude to the reader / having them do as little digging as possible, and that includes different kinds of readers, such as non Python programmers, or those that know some Python, but are not really programmers (and would probably not know more obscure operators like @))
odd meteor
balmy burrow
I dont even know if I should go beyond chapter 3 in hands-on machine learning,se...
Please remain steadfast. There's no such thing as "not a math person". You'll definitely get better at it with time 😀
tidal bough
looks like there's only two minor differences I suppose:
https://numpy.org/doc/stable/reference/generated/numpy.matmul.html#numpy.matmul
 serene scaffold
balmy burrow
I dont even know if I should go beyond chapter 3 in hands-on machine learning,se...
serene scaffold
balmy burrow
I dont even know if I should go beyond chapter 3 in hands-on machine learning,se...
I agree with Emyrs. All these things sound complicated until you understand them. If you maintain a positive attitude about learning, it will come soon enough 😄
odd meteor
upper spindle
and what does the dense layer do
A dense layer is simply a fully connected layer (i.e a layer where all the neurons are connected to every neuron of its preceding layer) in NN.
desert oar
tidal bough
elaborate on 2? 🥴
matrix multiplication is specific to one very specific problem domain, while literally nothing else in the python standard library is oriented towards that problem domain. and it isn't even supported in the stdlib anyway
serene scaffold
desert oar
matrix multiplication is specific to one very specific problem domain, while lit...
I tend to agree. and then they won't even imbue that operator with function composition 😠
misty flint
"Every Superman has his kryptonite, but as a Data Scientist, coding can't be yours."
i like this quote

serene scaffold
misty flint
> "Every Superman has his kryptonite, but as a Data Scientist, coding can't be y...
shame it's the kryptonite of seemingly every PhD student.
misty flint
serene scaffold
shame it's the kryptonite of seemingly every PhD student.
omg it seems like its a very common kryptonite for them
serene scaffold
except they also don't know it
misty flint
unless they are a phd student that has done frequent internships as a software person
which isnt as common
serene scaffold
though one of the talks at pycon, the speaker made the point that the reward model for academia only involves publishing, and the code is just a means to that singular end. so we can't really blame the authors of shitty research code for what they have unleashed on the world.
misty flint
oof
the incentives of academia
oh this reminds me
i have started to see uhh...how to explain this
postdocs for phd peeps to transition to industry better
created by tech companies themselves
let me see if i can find it to show you
misty flint
serene scaffold
though one of the talks at pycon, the speaker made the point that the reward mod...

Amazon Science
The program offers recent PhD graduates an opportunity to advance research while working alongside experienced scientists with backgrounds in industry and academia.
good option for phd students i guess
serene scaffold
misty flint
https://www.amazon.science/postdoctoral-science-program
I heard that working at amazon is low-key cancer, even as a dev
misty flint
i have also heard the same

i believe they are one of the worst ones at contributing back to open source as well
out of big tech
serene scaffold
I didn't think they do any amount of open source
misty flint
serene scaffold
my company does open source occasionally. some of my coworkers open sourced something, and I would have liked to refactor it...
misty flint
you can always make a pull request
but its good that your company gives back. i think any company that has the space for it should do so
even if its features that your company would use, since chances are others might need it as well
 worldly dawn
misty flint
i believe they are one of the worst ones at contributing back to open source as ...
worldly dawn
misty flint
i believe they are one of the worst ones at contributing back to open source as ...
They do contribute a lot, but you don't hear that much about it.
The worst one is apple
worldly dawn
I have heard it's so bad that it has created some recruitment issues since their secrecy goes against the common practices
misty flint

i have heard part of that on a podcast once
mostly about employees that have left
and how hard it was for them afterwards
Every employee who leaves Apple becomes an ‘associate’
In job databases used by employers to verify resume information, every former Apple employee’s title gets erased and replaced with a generic title
imagine being in charge of a team of data scientists, data engineers, and ML engineers
but then you only become an "associate" if you leave
iron basalt
serene scaffold
shame it's the kryptonite of seemingly every PhD student.

Python programming language
Interview with a Postdoc, Junior Python developer in 2022 with Ph.D. Carl Kron - aired on © 2022 The Python.
Programmer humor
Python humor
Programming jokes
Programming memes
Python 2022
Python memes
python jokes
Keras
Tensorflow
Data science
Data Science humor
Pandas Pandas Pandas
async with
OpenCV
GANs
Scikit-l...
iron basalt
About the same amount of experience programming.
(Except many children have more free time to learn it and end up being better)
(Although they lack the math)
serene scaffold
iron basalt
https://www.youtube.com/watch?v=YnL9vAFphmE
C++ is bad because you get errors before you can even run the code
and
I just learned that on Medium, uhh, an hour ago
these are the only two parts of the video that I found clever. the rest is just him saying random phrases and trying to pass that off as a punchline.
also
it's easy because it's just one page. where's the async with?"
sounds like a joke from a d.py video
iron basalt
serene scaffold
> C++ is bad because you get errors before you can even run the code
and
> I jus...
Yeah it does have the editing of early Youtube with many jump cuts and repeated phrases.
misty flint
i like the repeated phrases since i interpreted it as him making fun of the buzzwords in this space
and the hype that they create
worldly dawn
and the mug
serene scaffold
iron basalt
Yeah it does have the editing of early Youtube with many jump cuts and repeated ...
I don't object to that. if the punchlines were good, that might add to it. "lists are arrays. tuple unpacking." saying a bunch of phrases is not a punchline.
worldly dawn
each video has the mug with the logo taped on it
iron basalt
serene scaffold
I don't object to that. if the punchlines were good, that might add to it. "list...
I agree.
misty flint
worldly dawn
each video has the mug with the logo taped on it
ahhh i just realized this
it starts unfolding midway
lapis sequoia
what does the core analyst engineer do? I got its job in hand and i got no idea.(sorry if this feels like off topic, if it is not related to this channel i can move on to offtopic.)
bold timber
odd meteor
Most online ML courses don't teach MLOps or model deployment in general. However...
it's free?
 celest vine
Hi, can anyone help me with a problem statement?
 fresh moss
Hello, does anyone have experience in scraping consumer reviews? I have difficulty scraping reviews of many products without changing the product links one by one.
celest vine
So, Its a classification problem.
I have the following Twitter data.
profileURL
screenName
name
Bio
Location
Created at
FollowersCount
FollowingCount
TweetsCount
Certified - boolean(yes/no)
Replied - (yes/no)
So, replied column is my output and and I what to predict if a Twitter account will reply to my dm or not.
Any suggestions?
rose agate
celest vine
So, Its a classification problem.
I have the following Twitter data.
profileUR...
There should be a lot of resources online for label classification, following a tutorial should be a good way to learn. sklearn will probably be the easiest package to use, and you can change which model to use pretty simply.
odd meteor
bold timber
it's free?
The first one is free, however the second one from deeplearning.ai requires a financial commitment of about $46 per month.
bold timber
odd meteor
The first one is free, however the second one from deeplearning.ai requires a fi...
Can you give me the source that free?😅
odd meteor
lapis sequoia
what does the core analyst engineer do? I got its job in hand and i got no idea....
The job description will give you a well-rounded overview on what the role entails. In some companies, it could very well mean a BI analyst or Data Analyst.
bold timber
some people say we can use streamlit. Where I can learn of streamlit?
celest vine
rose agate
There should be a lot of resources online for label classification, following a ...
Okay
odd meteor
odd meteor
Most online ML courses don't teach MLOps or model deployment in general. However...
@bold timber the first one on this list
odd meteor
bold timber
some people say we can use streamlit. Where I can learn of streamlit?
Check their documentation and use YouTube as well. That's how I learned it
bold timber
odd meteor
<@786960616664727572> the first one on this list
Whether the first one of that course completed to deployment?
odd meteor
bold timber
Whether the first one of that course completed to deployment?
It goes beyond model deployment. It covers the entirety of MLOps. It appears you're only interested about model deployment 😁
bold timber
odd meteor
It goes beyond model deployment. It covers the entirety of MLOps. It appears you...
yeah, because I'm so beginner in ML. then, some company ask me to deployment my model and I don't understand how to do that 😂 🥲
but, thank you for the information.
odd meteor
fresh moss
Hello, does anyone have experience in scraping consumer reviews? I have difficul...
You can first write a code to grab the product pages you're interested in scrapping first. It might be a good idea to save the grabbed pages as HTML file in your PC to avoid sending multiple requests (which could lead to your IP getting banned) 😀
 ocean swallow
I am trying to extract the most used word groups of n length in a text
Something like a word tree but n length.
So like word group tree maybe lol
fresh moss
odd meteor
You can first write a code to grab the product pages you're interested in scrapp...
If so, do you have any suggestions for references? So far I haven't found a tutorial for a similar case to mine.... The tutorial I found was just scraping from the same page.
odd meteor
fresh moss
If so, do you have any suggestions for references? So far I haven't found a tuto...
Once I get back on my pc, I'll try to check if I can find a specific reference resource that fits your case.
However, for the time being, you can try to restructure my example to fit your scenario (depending on how the website you're scrapping is structured.)
Presuming you're working with a website with this kind of url structure
https://www.basketball-reference.com/awards/awards_2021.html and you'd like to scrap data for year 2018 to 2021.
You could write your code to grab those pages like this:
import requests
from bs4 import BeautifulSoup

years = list(range(2018, 2022))
url_start = 'https://www.basketball-reference.com/awards/awards_{}.html'

for year in years:
    url = url_start.format(year)
    data = requests.get(url)

    with open('data_folder/{}.html'.format(year), 'w+', encoding='utf-8') as f:
        f.write(data.text)
This code will pretty much write the scrapped html page of each year inside the data_folder. You can try to run the code on your pc to perhaps understand how to structure yours.

Basketball-Reference.com
2020-21 NBA Awards Voting Summary
Once you've successfully grabbed all the product pages you're interested in, you can then write a function/ for loop that will enable you to easily scrap information from each product page without changing product url every time. This way, you can also reduce the number of request you send to the website. If you send too much request some website will ban your IP permanently or temporarily.
You could also use the time.sleep() method to circumvent this scenario if you prefer that approach.
 arctic cliff
Why do we shuffle the data before training?
also do we shuffle the samples along with their targets?
fresh moss
odd meteor
Once I get back on my pc, I'll try to check if I can find a specific reference r...
Woahh thank you so much for the insight! when i tried your suggestion i found a source. I wanna make sure this source matches what you said earlier.. This is the link :https://www.geeksforgeeks.org/how-to-scrape-multiple-pages-of-a-website-using-python/

GeeksforGeeks
A Computer Science portal for geeks. It contains well written, well thought and well explained computer science and programming articles, quizzes and practice/competitive programming/company interview Questions.
tidal bough
arctic cliff
also do we shuffle the samples along with their targets?
Yes, otherwise you ruin your data.
tidal bough
arctic cliff
Why do we shuffle the data before training?
I think it's mostly that the easiest way to train on randomly picked samples is to shuffle the entire dataset once, and then you can just pick consequtive slices without randomly drawing many times.
arctic cliff
That's reasonable. Thanks!
Just to make sure I get this straight- By giving mini-batch arguments my data are sliced randomness? without having to do np.shuffle(data)?
@tidal bough Sorry for the ping in case you mind
tidal bough
Check the docs for whatever method of whatever library you're using for minibatching
arctic cliff
Thanks a lot
 gusty anvil
HOWDY >> I have a question 🙂
I have data with this layout in power bi and I want to forecast with machine learning in order to receive the same data in those columns for following days. Any advice for noobs ?

 somber prism
guys i have one doubt, since lstm or any othere sequence model can work well on nlp problems and word 2 vec can save the semantic, does that mean we dont need to do preprocesssing like stemming removing stop words etc ?
odd meteor
fresh moss
Woahh thank you so much for the insight! when i tried your suggestion i found a ...
Yes that's a good resource with more detailed examples on how to get the work done.
 faint isle
Hi guys anyone can help me with sentiment analysis using logistic regression and random forest? 🙂
serene scaffold
faint isle
Hi guys anyone can help me with sentiment analysis using logistic regression and...
try being more specific
faint isle
serene scaffold
try being more specific
 balmy burrow
is there any channel I can ask machine learning questions specifically?
for scikit or smth
never mind found ultimatum of problem solving
 odd meteor
balmy burrow
is there any channel I can ask machine learning questions specifically?
odd meteor
balmy burrow
is there any channel I can ask machine learning questions specifically?
This is the right channel to ask your ML questions
odd meteor
faint isle
If you're familiar with sentiment analysis, after you're done with the whole cleaning and text pre-processing stage, you're expected to use Logistic regression and/or Random Forest algorithm to do the sentiment analysis instead of TextBlob. If you're not too familiar with sentiment analysis, you could check online for some examples ( check kaggle.com) I'm sure you'll find a good reference notebook there.
balmy burrow
can anyone help why .reshape doesnt work here?

 shell pasture
NLP Contract Processing - Hi guys, I have a question on NLP in terms of processing contracts. When building a model would the contracts all have to be somewhat the same for the model to work or would the model be able to work on different kinds of contracts. If I’m asking a vague question apologies
odd meteor
somber prism
guys i have one doubt, since lstm or any othere sequence model can work well on ...
Performing basic pre-processing steps is still very important before we get to the model building part. Those text pre-processing are still very much needed. Word2Vec is just a word embedding. We still need to feed a clean text to it. Although, depending on the task, some pre-processing step might not be entirely compulsory https://aclanthology.org/W19-6203/
ACL Anthology
Andrey Kutuzov, Elizaveta Kuzmenko. Proceedings of the First NLPL Workshop on Deep Learning for Natural Language Processing. 2019.
somber prism
i se
odd meteor
For example, when it comes to ABSA, depending on the approach you're using, removing stop words before doing cross-lingual coreference and applying POS tag isn't a good practice.
somber prism
thank you
so basically, if i am planning on making a model that predicts the next word based on the previous sentence, then i should avoid removing the stop words right ?
 spare briar
bold timber
Hi, I also wondering how to deploy machine learning model? can you give me a rec...
spare briar
bold timber
Hi, I also wondering how to deploy machine learning model? can you give me a rec...
Some great resources here as well https://huyenchip.com/mlops/
Chip Huyen is a writer and computer scientist. She works to bring the best engineering practices to machine learning production.
odd meteor
somber prism
so basically, if i am planning on making a model that predicts the next word bas...
When it comes to predicting next word in a sentence, I'd say don't remove stopwords. However, you can try both to compare which yields a more meaningful result ( with or without stopwords)
spare briar
(plus she has a ml ops focused discord server)
misty flint
spare briar
(plus she has a ml ops focused discord server)
i find great resources are there as well
also
i just saw a video with all my favorite data influencers in one place
but the video got privated
secret secrets are secret

what are they doing?
where are they going?
something is happening but i do not know what
some of the peeps i saw: ken jee, tina huang, shashank kalanithi, mikiko bazely, luke barousse, ben rogojan, and others
misty flint
spare briar
Some great resources here as well https://huyenchip.com/mlops/
oh hey i just saw this too btw

also
i remember seeing chip huyen post her slides for her ML Systems course online
free for anyone to study
that course is more focused towards ML deployment and ML case studies
pretty nifty
spare briar
yes her content + the book designing data intensive applications were helpful for me when asked ops/productionization questions in interviews
misty flint
oh nice ive heard great things about that book as well

iirc, she writes a decent amount on real-time ML inference as well
misty flint
was your issue that sometimes real-time is not the way to go?
that you can get away with mini-batch sometimes?
spare briar
nope more with methods
misty flint
ah i see
spare briar
i am very into continual learning these days
we have a system that does real time classification with user feedback
misty flint
for those into computer vision https://www.xview2.org/
Recognizing an opportunity to solve a key analytical bottleneck, the Defense Innovation Unit, together with other Humanitarian Assistance and Disaster Recovery (HADR) organizations, is releasing a new labeled, high-resolution satellite dataset and a challenge to the computer vision community.
Help us automate damage assessment to accelerate recovery from natural disasters and win prizes ($150,000 of cash awards)!
 glossy zenith
Is someone of you familiar with PyTorch and vgg16?
My Model is having a hard time predicting the Images right from a Datasets (i guess around 3200 for each Label) SFW 0 and NSFW 1
On Epoch 50/100 he's recognizing NSFW pretty often But i havent Seen SFW once...
 radiant frigate
Hello, this may be a weird request but is it possible to find anywhere a benchmark of computing a Fourier series in languages like Python, Julia and Matlab?
tidal bough
Hmm, quick googling doesn't show me anyone doing a comparison like that. You'd need to make sure a benchmark yourself.
Note though that speed of different libraries in one language can vary a lot. There's this benchmark which compares various C/C++ FFT libraries and also compares a few popular Python ones:
https://github.com/project-gemmi/benchmarking-fft
Note how installing mkl-fft accelerates numpy's fft by 16 times. (At least, on the old python version this benchmark was done on)
upper spindle
does anyone know how to plot two graphs together so i can these two on graphs on the same graph but with different colours


the df's are there
I want to plot log returns and sentiment on the same graphs, thanks in advance
serene scaffold
upper spindle
does anyone know how to plot two graphs together so i can these two on graphs on...
you can add Standard Deviation as a column on the "main" dataframe
what code did you use to make those two plots?
!docs pandas.DataFrame.plot.line
arctic wedgeBOT
DataFrame.plot.line(x=None, y=None, **kwargs)```
Plot Series or DataFrame as lines.

This function is useful to plot lines using DataFrame’s values
as coordinates.Thank you for helping me out :)
upper spindle
serene scaffold
what code did you use to make those two plots?
i used df['Log Returns'].plot(figsize=(10,5), ylabel='Log Returns')
and df.plot(figsize=(10,5), xlabel='Date', ylabel='Std Deviation of Sentiment')
serene scaffold
upper spindle
i used `df['Log Returns'].plot(figsize=(10,5), ylabel='Log Returns')`
there are examples in the docs of plotting two lines in different colors from the same DF
upper spindle
serene scaffold
there are examples in the docs of plotting two lines in different colors from th...
ooh okay, thanks, ill have a look
lapis sequoia
idk where to ask this but how can i print something at the same position even if it has less characters
for example
bla bla     TEST
bla         TEST
take a look at #❓|how-to-get-help. also look into f string formatting
lapis sequoia
okay thanks
upper spindle
can anyone create a function for a univariate lstm to test on the validation set
i created a multivariate function for forecasting on validation set
    start_index = range_index[0] - dt.timedelta(n_past - 1)
    end_index = range_index[-1]
    mat_X, _ = windowed_dataset(input_df[start_index:end_index],
                                df['Future Vol'][range_index], n_past)
    preds = pd.Series(model.predict(mat_X)[:, 0],
                      index=range_index)

return preds```testY_preds = forecast_multi(lstm_multi, test_index) which gives me the out
but im struggling to write a code for forecasting on a univariate
ocean swallow
Anyone tried to predict views we get if we just
published a video on youtube, given the title, channel sub and date etc
?
 plush jungle
can someone explain the differences between decision trees, support vector machines, and neural nets?
like, they can all solve complex, non-linearly separable problems by analyzing training data and then classifying new data, but I feel like I have a much stronger grasp of neural nets and why they work than the other two
serene scaffold
@plush jungle a decision tree algorithm takes the training data and tries to construct a series of yes/no decisions that can make a decision about each instance. does that make sense?
plush jungle
serene scaffold
<@433856634192789504> a decision tree algorithm takes the training data and trie...
so while a neural network's neuron takes a matrix and spits out a vector, a decision tree's branch takes a vector and spits out a scalar?
serene scaffold
plush jungle
so while a neural network's neuron takes a matrix and spits out a vector, a deci...
neural networks don't necessarily take only a matrix.
plush jungle
you mean because they can also take a vector?
serene scaffold
there are a lot of neural architectures
plush jungle
ok but I'm familiar with neural nets mainly as applied to optical character recognition, and my friend told me that any data you can train a neural net on you can also construct a decision tree for
so what would it look like
if you made a decision tree where each example in the training data was a vector of pixels
serene scaffold
plush jungle
ok but I'm familiar with neural nets mainly as applied to optical character reco...
you can always train a decision tree; whether or not it will be good is another matter.
images are usually 2d arrays if they're greyscale images or 3d arrays if they have RGB values.
plush jungle
right, so the first x number of branches of the decision tree would get passed one of these 2d arrays
and they would return a boolean value?
ocean swallow
if the problem is optical character recognition it would elementarily be passed a flattened vector of the 2d image and for each pixel on it, you would create a branch. 1st pixel black or white Yes No etc
serene scaffold
plush jungle
and they would return a boolean value?
each decision is yes/no, but the final result of traversing the decision tree is a label for a given instance
plush jungle
ocean swallow
if the problem is optical character recognition it would elementarily be passed ...
so a 723 pixel image would have how many branches? 723? one branch for each pixel?
ocean swallow
2^723
ocean swallow
yes
plush jungle
so the downside is that decision trees scale very poorly?
serene scaffold
they also tend to overfit to the training data
plush jungle
serene scaffold
they also tend to overfit to the training data
yeah that makes sense, given that it sounds like it's not generalizing at all
it's just making up rules that perfectly match the training data
serene scaffold
plush jungle
it's just making up rules that perfectly match the training data
yesssssss
ocean swallow
yeah and as you can see impractical too
serene scaffold
a random forest is an algorithm that attempts to solve that problem. but if you hear about a random forest being used in consumer software, it probably means that they just wanted to use AI for marketing purposes, and should be avoided.
ocean swallow
so you need to do some feature extraction
plush jungle
are SVM's the opposite? they generalize more than neural nets?
ocean swallow
I don't know what they would do in real data honestly but the way I was told in university
since it creates functions of vectors that only barely fits the data, they are good against overfitting
it is a great algorithm even today
low cost fast etc.
not the basic linear svm
plush jungle
I thought we were talking about the non-linear svm
linear ones are just for linearly separable problems right?
ocean swallow
yeah fixed it
plush jungle
oh gotcha
ocean swallow
apart from being optimization problem solvers, they don't have much in common really. probably svm is closer to neural network but that's all
also svm's name don't make sense is what my professor told me as well lol
 plush helm
ocean swallow
published a video on youtube, given the title, channel sub and date etc
plush helm
ocean swallow
published a video on youtube, given the title, channel sub and date etc
that would generally be subjective & we have to account for yt algorithm itself
misty flint
random forests are also relatively robust to outliers so theres that use case
 mental bane
Can anyone please tell me how to get the count of Malignant and Benign tumors from load_breast_cancer of scikit?
mental bane
nvm, found it in the description of the dataset


 versed sleet
I still can't understand tensorflow or pytorch. I think my weakness is the math behind it.
I know basic math
Not sure if I should revisit trigonometry and algebra
Or go for statistics and probability
🤔
serene scaffold
versed sleet
I still can't understand tensorflow or pytorch. I think my weakness is the math ...
neural networks involve linear algebra and calculus. and classifiers in general involve probability and statistics.
but yes, tensorflow and pytorch are both for neural networks. they do most of the work for you. so if you don't already understand neural networks, you won't really understand what those libraries enable you to do.
and you won't really figure it out from using them, because most of the work happens internally
misty flint
yes
you should learn neural networks and how they work at least
if you intend to use either pytorch or tensorflow for your needs
misty flint
also im glad data engineering is becoming more popular

since it will enable data science
and allow for more DS work to be able to provide value
also fang salaries are fang so im not surprised
 inland zephyr
does anyone have better knowledge about regex? i have this text Character_Xingqiu_Thumb.webp and I want to keep Xingqiu and remove the surrounded words. i try ((Character_))($\w^)((_Thumb.webp))but no works.
when work with re, it also not work properly for the last word (_Thumb.webp)
head = "Character_"
tail = "_Thumb.webp"
username = re.sub(tail,"",re.sub(head,"",username))
it returns Xinqiu_Thumb thats what i dont need
 delicate apex
inland zephyr
does anyone have better knowledge about regex? i have this text ```Character_Xin...
delicate apex
inland zephyr
does anyone have better knowledge about regex? i have this text ```Character_Xin...
consider something like (?:Character_)(\w+)(?:_Thumb\.webp)
delicate apex
delicate apex
consider something like `(?:Character_)(\w+)(?:_Thumb\.webp)`
- the
?:means non-capturing group, so the only group is what you want - the
.has to be escaped, as it has meaning in regex \wonly matches a single character, and$and^refer to the start and end of, depending on mode, either the entire string or each line
doubts and problems about regex can frequently be helped with online interpreters, and i use https://regex101.com/ for such tasks
!e
import re
s = 'Character_Xingqiu_Thumb.webp'
rem = re.search(r'(?:Character_)(\w+)(?:_Thumb\.webp)', s)
print(rem.group(1))
@delicate apex :white_check_mark: Your eval job has completed with return code 0.
Xingqiu
lemme try this
 potent fractal
Hi,
is there a package out there that could take my RNA dataset (bulk or single cell) and compare it to published datasets to find those with the highest percentage of similarity to my dataset?
Thanks!
celest vine
I have text as well as numerical feature in my dataset. Can these both be used together for supervised classification problem?
celest vine
celest vine
I have text as well as numerical feature in my dataset. Can these both be used t...
Which algorithm will be best for this?
inland zephyr
delicate apex
doubts and problems about regex can frequently be helped with online interpreter...
this is works, thanks for the help
 wild pagoda
hey everyone, can i create excel image like this in python?

Currently my excel file is like this:

 tacit basin
wild pagoda
Currently my excel file is like this:
tacit basin
wild pagoda
Currently my excel file is like this:
Create pandas dataframe from it and df.plot() should plot something similar. You can customize it with matplotlib
wild pagoda
tacit basin
Create pandas dataframe from it and df.plot() should plot something similar. You...
currently matplot plot is rounded, anyway to make it sharp?
tacit basin
wild pagoda
currently matplot plot is rounded, anyway to make it sharp?
Not sure if i understand.
tacit basin
misty flint
also im glad data engineering is becoming more popular
Interesting 🤔
inland zephyr
I need to investigate deeper about how to deal with transparent image such as webp and the best augmentation method for them.

The resnet embedder for Genshin potrait... i need to deep dive the augmentation method for Image classification tho...
upper spindle
why would an lstm model prediction be bad
like the drawbacks
as in the model predicts this

whereas a univariate lstm predicts this

 iron kettle
hello everybody I have an question.I use pandas to read csv.
then I use df[df['columnName']=='XX'] to search a data, I can't find it .
but the data in the dataframe.
such us


 rose agate
iron kettle
anybody can help me?<:grumpchib:552214257148887060>
rose agate
iron kettle
anybody can help me?<:grumpchib:552214257148887060>
The data type might not be a string perhaps, try removing the quotes around the number
iron kettle
rose agate
The data type might not be a string perhaps, try removing the quotes around the ...
I set the data type is str


I remove the quote.....
 chilly abyss
Hello all, pls could you help with the full meaning of ADADelta
rose agate
iron kettle
I set the data type is str
not sure then tbh. If you're able to upload the file I could try though
odd meteor
chilly abyss
Hello all, pls could you help with the full meaning of ADADelta
It's an optimizer that's used in NN to minimise the loss function. Just like Momentum, AdaDelta is just the name the creator gave it. There's no extra "full meaning" to it since that's the full name.

 rose agate
upper spindle
what is a zip file
rose agate
upper spindle
what is a zip file
It's a type of file that contains data compressed to save space. If you're on windows download WinRAR, put the two .ipynb files in a folder, right click the folder and click "add to archive", click the zip option and then click "ok"
 frigid elk
is it possible to create boxplot without full dataset? .. using just the breakpoints? .. e.g. [lower, q1, med, q3, upper, [outliers]] ?
rose agate
frigid elk
is it possible to create boxplot without full dataset? .. using just the breakpo...
Found a post online that explained how to create boxplot from the quartiles and whiskers. To add outliers I found that using a scatterplot works
import matplotlib.pyplot as plt

stats = [
    {'med': 5, 'q1': 2, 'q3': 6, 'whislo': 1, 'whishi': 8},
]

_, ax = plt.subplots();
ax.bxp(stats, showfliers=False);

plt.scatter([1,1,1,1], [9,10,-1,-2])
 upper spindle
rose agate
It's a type of file that contains data compressed to save space. If you're on wi...
upper spindle
rose agate
It's a type of file that contains data compressed to save space. If you're on wi...
thanks, ill try it now
upper spindle
rose agate
It's a type of file that contains data compressed to save space. If you're on wi...
how do i put my two .ipynb files in a folded
im using juypter notebook
rose agate
upper spindle
how do i put my two .ipynb files in a folded
just create a folder wherever you want, you can either save them to that location from inside jupyter or just copy and paste them into the folder
wild pagoda
hi everyone, why my plot error when i want to put in scientific notation? my pd.dataframe is like this

plot image
 serene scaffold
wild pagoda
plot image
serene scaffold
wild pagoda
plot image
can you show the code you used to make the plot as text?
!code
arctic wedgeBOT
Here's how to format Python code on Discord:
```py
print('Hello world!')
```
These are backticks, not quotes. Check this out if you can't find the backtick key.
wild pagoda
        GraphSheet = pd.read_csv(fileExcel, dtype=str)
        GraphData = pd.DataFrame(GraphSheet)
        # Start make graph
            # Get column
        trvl = GraphData.columns[0]
        FY_raw = GraphData.columns[1]
        FY_fit = GraphData.columns[2]
        note.append(FY_raw)  # Add note of graph data
        note.append(FY_fit)

        # Add data to graph
        plt.plot(GraphData[trvl],
                GraphData[FY_raw], markersize=5)
        plt.plot(GraphData[trvl],
                GraphData[FY_fit], markersize=5)
        plt.legend(note, loc=(1.04, 0))
        GraphSheet = pd.read_csv(fileExcel, dtype=str)
        GraphData = pd.DataFrame(GraphSheet)
you shouldn't need both of these. is GraphSheet not already what you need?
!docs pandas.DataFrame.plot.line
arctic wedgeBOT
DataFrame.plot.line(x=None, y=None, **kwargs)```
Plot Series or DataFrame as lines.

This function is useful to plot lines using DataFrame’s values
as coordinates.I would see how you can make the plot with this. There should be a way to make the scale labels less frequent, if that ends up being an issue.
wild pagoda
serene scaffold
I would see how you can make the plot with this. There should be a way to make t...
if i remove the dtype=str pandas gonna automaticly convert my data to float, i want to prevent that, but when i put in dtype it got that error
serene scaffold
wild pagoda
if i remove the `dtype=str` pandas gonna automaticly convert my data to float, i...
why do you not want numerical data to be numerical?
wild pagoda
serene scaffold
why do you not want numerical data to be numerical?
my data is scientific notation
serene scaffold
wild pagoda
my data is scientific notation
the way the data is notated for human visualization is not the same as the data itself
wild pagoda
serene scaffold
the way the data is notated for human visualization is not the same as the data ...
so there's no way making a graph like this?
 serene scaffold
wild pagoda
so there's no way making a graph like this?
serene scaffold
wild pagoda
so there's no way making a graph like this?
there is, but you have to first store the data as actual numbers (strings of digits are just text that are mathematically meaningless). then you can just change the settings for the plot so that the numbers are displayed in scientific notation
wild pagoda
serene scaffold
there is, but you have to first store the data as actual numbers (strings of dig...
oh i though i need to change the data
so if like that, currently i make it work like this, now idk how to change those to scientific notation
 serene scaffold
wild pagoda
so if like that, currently i make it work like this, now idk how to change those...
wild pagoda
serene scaffold
wild pagoda
so if like that, currently i make it work like this, now idk how to change those...
wild pagoda
        plt.plot(GraphData[trvl],
                GraphData[FY_raw], markersize=5)
        plt.plot(GraphData[trvl],
                GraphData[FY_fit], markersize=5)
        plt.ticklabel_format(style='sci')
it's not working tho
serene scaffold
in what way is it not working? also what is the type of plt?
wild pagoda
import matplotlib.pyplot as plt
serene scaffold
and in what way is it not working? did you get an error message? did your computer explode?
wild pagoda
it just run without any error
serene scaffold
run without any error... so it worked? I'm still in the dark about what happened that is different from what you expected.
wild pagoda
i want these to be scientific notation, but currently it's not
 serene scaffold
it might be that scientific notation only kicks in for sufficiently large or small numbers.
try multiplying the y data by a really large number and plot it again, and see what happens
wild pagoda
i don't think it's work in matplot
wild pagoda
wild pagoda
i want these to be scientific notation, but currently it's not
so how do i have more number in the label? it have 100-200-300-400 not 200-400-600 like right now
barren wedge
what we can do with NLP token(tokenizer)?
do you have any idea to leverage the token?
serene scaffold
barren wedge
what we can do with NLP token(tokenizer)?
do you have any idea to leverage the t...
it depends on what you're trying to do. tokenizers decide what word boundaries are. often this is straightforward, but there are times when you might want "don't" to be treated as two tokens, or treat short phrases as one token.
barren wedge
serene scaffold
it depends on what you're trying to do. tokenizers decide what word boundaries a...
how about BERT Tokenizer?
serene scaffold
barren wedge
how about BERT Tokenizer?
that's just another tokenizer. but for bert models, you have to use the same tokenizer that the model expects.
barren wedge
serene scaffold
that's just another tokenizer. but for bert models, you have to use the same tok...
can we unsupervised token to make some similarities between the 2 columns?
serene scaffold
barren wedge
can we unsupervised token to make some similarities between the 2 columns?
unsupervised token? a token is just a word. it's not something that does something.
barren wedge
i mean in the form of input_ids and attention_mask in transformers
serene scaffold
also what are the two columns?
barren wedge
one column contains the customer address and the other is PIC area of responsibility
so we can match the customer for the right PIC
upper spindle
rose agate
just create a folder wherever you want, you can either save them to that locatio...
thanks
barren wedge
like VLOOKUP or HLOOKUP in excel but not exact values
upper spindle
rose agate
just create a folder wherever you want, you can either save them to that locatio...
where would i locate the python files from jupyterlab, im currently using windows
 cunning condor
Is the following sequence correct using Depth-First Postorder?
D, E, B, F, C, A.
OR
D, E, B, C, F, A.
Thank You.

 echo vigil
Is there a way to group by / aggregate to a boolean value? Currently working in pyspark but a solution with pandas or sql would also be helpful. For instance, if we have a table where each row is a person_id and a pet, I'd want to group by person_id and the aggregate column should be true if the person has a dog and a cat and false otherwise.
ID | pet
1 | dog
1 | cat
2 | dog
2 | snake
->
ID | agg
1 | True
2 | False
frigid elk
rose agate
Found a post online that explained how to create boxplot from the quartiles and ...
nice, thanks for that. i'll give it a shot
tacit basin
Any recs for practical exercises for designing and implementing solutions to an Object-Oriented Programming task.
Practical like MLOps interview (live coding) practical :) Thanks!
 urban lance
I have a dataset sorted by user_id and timestamp (essentially session_id)
I want keep just the first n rows for 2 sessions of each user. What would be the most efficient way to go about it?
echo vigil
@urban lance pandas?
group by session id rank by timestamp and filter where the rank <= 2 would be the cleanest code; there may be a more efficient method if performance is critical.
urban lance
echo vigil
<@424603301103796234> pandas?
Pandas
echo vigil
Something like:
df['rank'] = df.groupby('user_id')['session_id'].rank(method='min', ascending=True)
df = df[df['rank'] <= 2]
will get you most of the way there
rose agate
Never knew about the rank function, looks useful
ocean swallow
plush helm
that would generally be subjective & we have to account for yt algorithm itself
thanks for replying. Like what do I start my research in this area though? I don't know where to start
I think the final result would yield like a idea categories in a word cloud kind of thing. so that the person who would create a video would have a good idea of what video will success when
and yeah like you said there is this black box of youtube algorithm
 frosty flower
Is there any library that can be used to check how common a word (or lots of words) is?
Like if you input a word "hello" it gives you a score, say, 100
And if you give it a word "serendipity" then it maybe gives a score 15 or something
@serene scaffold I recall that you are a computational linguistics so you might know the answer to this? Hope you don't mind the ping
serene scaffold
frosty flower
Is there any library that can be used to check how common a word (or lots of wor...
what is the use case? it's not very difficult to construct a frequency table for a given corpus.
spare briar
you might be interested in https://en.wikipedia.org/wiki/Tf–idf
frosty flower
serene scaffold
what is the use case? it's not very difficult to construct a frequency table for...
Just trying to build a simple tool to help me read English books. I plan to extract difficult words out of the input (pdf or text) and list them out so I can learn them before I start reading the book.
serene scaffold
frosty flower
Just trying to build a simple tool to help me read English books. I plan to extr...
what kinds of books? nonfiction?
frosty flower
serene scaffold
what kinds of books? nonfiction?
Philosophy textbooks
Hume, Kant etc
English isn’t my first language so it’s a bit hard for me to digest these books if I have to pause from time to time to look up the words I don’t know
serene scaffold
frosty flower
Philosophy textbooks
so you'll need to see which words are more frequent in philosophy textbooks than they are in general English use. and those are going to be the ones that you need to look up
someone already linked to the wikipedia about that, which is term frequency inverse document frequency
or tf-idf
 grave frost
frosty flower
Just trying to build a simple tool to help me read English books. I plan to extr...
grave frost
frosty flower
Just trying to build a simple tool to help me read English books. I plan to extr...
you can use BERT to sort by the associated probability the model gives for each word and use the ones with the least likelihood (but were correct) compile them, and look them up
misty flint

GitHub
Repo for external large-scale work. Contribute to facebookresearch/metaseq development by creating an account on GitHub.
OPT-175B
they say its similar to GPT-3

gilded kestrel
hey guys I'm stupid and first time trying keras, how do I change the Bidirectional to just an LSTM layer here?
x_input = layers.Input(shape=x_train.shape[1:])
x = layers.Masking(mask_value=MASK, input_shape=(x_train.shape[1:]))(x_input)
x = layers.Bidirectional(tf.compat.v1.keras.layers.CuDNNLSTM(16, return_sequences=True))(x_input)```
can I just replace the last with `x = tf.compat.v1.keras.layers.CuDNNLSTM(16, return_sequences=True)(x_input)` ? cinder schooner
cunning condor
Is the following sequence correct using Depth-First Postorder?
D, E, B, F, C, A...
cinder schooner
cunning condor
Is the following sequence correct using Depth-First Postorder?
D, E, B, F, C, A...
D,E,B,F,C,A
Explanation: Postorder = (Left, Right, Root).
I also think this should go into algos and data structs
lapis sequoia
Guys, I have a question. In my dataset, I have some Boolean features that are put in as 0,1. Does it make sense to use them in spatial distance algorithms like k nearest neighbour?
Because it's actually a categorical feature. But converted forcefully into a numeric one.
 runic raft
lapis sequoia
Guys, I have a question. In my dataset, I have some Boolean features that are pu...
runic raft
lapis sequoia
Guys, I have a question. In my dataset, I have some Boolean features that are pu...
if you have lots of boolean features, it could potentially make sense to calculate the Jaccard similarity from a sample where all booleans are true
lapis sequoia
I have a decent amount compared to total number of features. But idk what jaccard similarity is
5/12 features are Boolean.
It's a medical dataset. Where booleans are like smoker or not.
runic raft
well, before I keep pushing my answer, can you tell us more the what you're reducing with a clustering algo like KNN?
lapis sequoia
It's just 2 cluster. Death or not.
We wanna predict if the patient dies based on their medical data
runic raft
Well, is there a reason you've ruled out decision trees?
lapis sequoia
No. I am gonna use decision trees
I am just trying to make sense of it. Because it feels right for categorical features. But the thing is, i will need to use k nearest neighbour too along with decision trees. So was wondering if I should include those features in knn or not.
Usually we drop the categorical features in knn
runic raft
I don't really see what the KNN is adding here for predicting death, decision trees ought to be able to deal with continuous features just fine.
That being said, you said you need KNN, so I'll explain the Jaccard distance a bit more with a python snippet
lapis sequoia
knn is gonna classify them into positive and negative. there's other numeric features too.
lapis sequoia
like age
lapis sequoia
runic raft
them?
the death
positive or negative
death
so more age means more likely to die. Like that
runic raft
lapis sequoia
knn is gonna classify them into positive and negative. there's other numeric fea...
I was asking what "them" meant in your previous statement. It sounds like "them" meant the sample in your dataset
lapis sequoia
runic raft
I was asking what "them" meant in your previous statement. It sounds like "them"...
them meant the data points. or each single row of a patient
They need to be classified as dead or not.
runic raft
Anyways, Jaccard distance (aka Jaccard Similarity) is when you look that what percent of values are matching each other:
For example let's say you have four binary/boolean features A, B, C, D.
def jaccard_similarity(sample: list[bool], other: list[bool]) -> float:
  assert len(sample) == len(other)
  num_matching = 0
  for sample_feature, other_feature in zip(sample, other):
    if sample_feature == other_features:
      num_matching += 1
  return num_matching / len(sample)

sample = [true, false, false, true]
other_sample = [true, false, true, false]
print(jaccard_similarity(sample, other_sample)) # prints 0.5
Pog
runic raft
lapis sequoia
them meant the data points. or each single row of a patient
again, what is the KNN adding to your ability to classify samples/rows which isn't being done with a decision tree?
lapis sequoia
runic raft
again, what is the KNN adding to your ability to classify samples/rows which isn...
Nothing. But it's for school
runic raft
oh, lol
runic raft
so you if you have five boolean features, I would compare them all to a hypothetical case where every boolean is true, or every boolean is false
runic raft
the definition you'd see in a textbook is much more general than the sample code I just gave you
lapis sequoia
lapis sequoia
Does jaccard similarity return the percentage of matching booleans?
You could have said this without giving the code. Haha
So how exactly do I use jaccard similarity in knn
runic raft
lapis sequoia
You could have said this without giving the code. Haha
You're not wrong, but I find that writing out code can remove lots of the ambiguity that shows up in English
runic raft
runic raft
so you if you have five boolean features, I would compare them all to a hypothet...
do this for every row and the use the Jaccard Similarity as a a feature instead of the categorical features
lapis sequoia
Every row, compared with what?
runic raft
so you if you have five boolean features, I would compare them all to a hypothetical case where every boolean is true, or every boolean is false
was this not clear
lapis sequoia
runic raft
so you if you have five boolean features, I would compare them all to a hypothet...
Oh
Didn't read that
But that's, in easy terms. Calculating the percentage of true booleans. Lolllll
runic raft
doesnt matter whether you pick all true or all false, but just do the same for every row
lapis sequoia
lapis sequoia
But that's, in easy terms. Calculating the percentage of true booleans. Lolllll
OMG, it is, isn't it?
runic raft
always all true or always all false, and yes that is a simple way of implementing it.
As with most summary statistics, you are losing information
but you aren't losing as much info as you would be in the case of just omitting it
lapis sequoia
lapis sequoia
But that's, in easy terms. Calculating the percentage of true booleans. Lolllll
If you would have told me that initially then there was no need for the rest of the explanations 😁
You made it so formal
Jaccard similarity. Hahaha
Can I change it into a percentage too btw?
0.7 changed too 70%
runic raft
I'm not trying to just give you the correct answer, I'm trying to give you enough info to be able to explore the idea more in your time
The formality is a justification for why this would be a good approach
lapis sequoia
hmm. Thanks
lapis sequoia
lapis sequoia
0.7 changed too 70%
will this be fine?
runic raft
it should be, yes
lapis sequoia
great
runic raft
but yeah, ideally if you're doing this for an assignment then your prof might ask "why did you do this" and if you say "some guy on Discord told me to" that's probably not a very good answer
cunning condor
cinder schooner
D,E,B,F,C,A
Explanation: Postorder = (Left, Right, Root).
I also think this shou...
I see thank you 🙂
lapis sequoia
runic raft
but yeah, ideally if you're doing this for an assignment then your prof might as...
No i will tell them that I did it with my hardwork and reading medical research papers on the internet. HAhaha
runic raft
Question for pandas experts here:
I have a column of strings and I'd like to the base64-encoded SHA256 hash of each column to see if any columns a match a key. The naïve way of doing this is probably something along these lines:
def hash_encode(s: str) -> str:
    hashed = hashlib.new("sha256", s).digest()
    return base64.urlsafe_b64encode(hashed).decode('utf-8')

df["hashes"] = df["textcolumn"].apply(hash_encode)
results = df.loc[df["hashes"] == key]
But, let's say I have a lot of rows, and this hash_encode operations isn't exactly a lightweight operation. What's the most sane fix?
I think if I'm looking for a match, it might make the most sense to actually iterate through the rows and check them manually one at a time
lapis sequoia
How do I select the hyperparameters for my decision tree
runic raft
lapis sequoia
How do I select the hyperparameters for my decision tree
What's wrong with good ol' grid search
lapis sequoia
That I don't know what that is
Is it like I calculate accuracy by looping through a list of values?
runic raft
yes
lapis sequoia
And how is that list determined
Minimum is 1 for each leaf node. What's max?
Size of root node? Haha
runic raft
1 - How fast your computer is
2 - What other people have done on similar problems
Usually for nodes in a decision tree, aren't you usually optimizing that using something like CART or Gini Coefficient?
lapis sequoia
And do we do it as chained loops for all the parameters to get the best combination? As in 3 hyperparameters with 7,6,8 possible values respectively. So do we do 768 iterations to exhaust all possible combinations?
lapis sequoia
runic raft
1 - How fast your computer is
2 - What other people have done on similar problem...
Gini
My computer is stupidly slow. But dataset is small.
299 rows only.
I split it into 70-30
runic raft
Are you familiar with multiprocessing
lapis sequoia
lapis sequoia
And do we do it as chained loops for all the parameters to get the best combinat...
But this sounds good?
runic raft
!docs multiprocessing
arctic wedgeBOT
runic raft
that's the general idea, yeah
lapis sequoia
Haha. Let me run it and see how fast it is.
Then will limit the values a bit maybe
My professor would beat me up for using this shit 😛
I have ryzen 5600h, 6 cores.
Gotta go make sandwiches. And then will code this shit. So exciting 😁
I am gonna do feature selection too. Should it be done before or after this grid search?
Using a hill climbing method which takes in features one by one. And check accuracy
runic raft
if you have a multicore CPU then you should be able to leverage your hardware better if you can find a way to take your model.fit and your evaluation approach (K-fold eval?) into single python def and then use a multiprocessing.map or a multiprocessing.starmap to do a bunch of work faster
grid search is like usually one of the last things you wanna do
lapis sequoia
I haven't figured out k-fold yet
I thought I would write everything and the modify it for k-fold.
lapis sequoia
lapis sequoia
I am gonna do feature selection too. Should it be done before or after this grid...
How about this though? @runic raft
wild pagoda
Hey everyone, can i make a graph like this in python? (matplotlib or smthing like that )

 modern cypress
wild pagoda
Hey everyone, can i make a graph like this in python? (matplotlib or smthing lik...
modern cypress
wild pagoda
Hey everyone, can i make a graph like this in python? (matplotlib or smthing lik...
Yeah matplotlib can do this, also seaborn as well I think
wild pagoda
modern cypress
Yeah matplotlib can do this, also seaborn as well I think
currently i'm stuck that the input of x-asix is string not value
so it make my matplot froze
modern cypress
wild pagoda
currently i'm stuck that the input of x-asix is string not value
post the full error
wild pagoda
modern cypress
post the full error
My code rn:
GraphSheet = pd.read_csv(csv_files)
GraphData = pd.DataFrame(GraphSheet)
file_col = GraphData.columns[0]
note = []
second_col = GraphData.columns[1]
note.append(second_col)  # Add note of graph data
  # Add data to graph
plt.plot(GraphData[file_col],
     GraphData[second_col], markersize=5)
now when i'm running it's just freeze bc the input of file_col is not number

 inner furnace
You could assign the values of the column to a new variable already defined as an integer before
modern cypress
wild pagoda
My code rn:
```py
GraphSheet = pd.read_csv(csv_files)
GraphData = pd.DataFrame(G...
can you try GraphData.describe(include='all')
wild pagoda
modern cypress
can you try GraphData.describe(include='all')
currently it's sticky like this, anyway to make it like in the image?
 wild pagoda
Hey everyone, can i make a graph like this in python? (matplotlib or smthing lik...
wild pagoda
wild pagoda
Hey everyone, can i make a graph like this in python? (matplotlib or smthing lik...
like this
modern cypress
hmm
modern cypress
wild pagoda
currently it's sticky like this, anyway to make it like in the image?
try plt.xticks(rotation=90)
wild pagoda
modern cypress
try `plt.xticks(rotation=90)`
oki that solved, the last problem is, i want to make the x-axis to at the 0.0 of the y-axis
 modern cypress
wild pagoda
oki that solved, the last problem is, i want to make the x-axis to at the 0.0 of...
modern cypress
wild pagoda
oki that solved, the last problem is, i want to make the x-axis to at the 0.0 of...
Honestly, I have no idea hahahah
wild pagoda
modern cypress
Honestly, I have no idea hahahah
lol, thanks for all the help that you gave me!
modern cypress
wild pagoda
lol, thanks for all the help that you gave me!
hmm, can you try adding labelpad=20 (change the number if you see it works to whatever you need) to your x axis
lapis sequoia
@runic raft my pc is doing 900,000 iterations rn 🤪
I skimmed it down to 25000 that is also taking a lot of time.
wild pagoda
modern cypress
hmm, can you try adding `labelpad=20` (change the number if you see it works to ...
i found the way, but currently it making this error lol
 lapis sequoia
I am getting accuracies lower when using k-fold cross validation when compared to simple train test split. Should I not use it then?
serene scaffold
lapis sequoia
I am getting accuracies lower when using k-fold cross validation when compared t...
no. picking the evaluation system that produces the best results has no effect on how well the model would actually perform in a real situation
lapis sequoia
So better to use k fold?
serene scaffold
k fold generally gives you a more realistic sense of how well your model would perform in real life. though it requires training your model k times, which might not be feasible for models that are very expensive to train.
@lapis sequoia make sense?
lapis sequoia
Sure
Also, regarding hyper parameters in decision trees.
According to the paper, An empirical study on hyperparameter tuning of decision trees [5] the ideal min_samples_split values tend to be between 1 to 40 for the CART algorithm which is the algorithm implemented in scikit-learn.
I found this on the internet
serene scaffold
I've never actually used decision trees, but go on.
lapis sequoia
I used all these values and looped through them
A nested loop for 3 hyperparameters
8000 iterations
And took the one with best accuracy score
misty flint
reinforcement learning is interesting but state space needs to be limited for many real world tasks
lapis sequoia
cross_val_score(clf, X, targets, cv=5).mean() is this the right way to do cross validation>
or I am doing something wrongh
because the best accuracy I am getting is at only 1 split of the tree
ocean swallow
hey I want to, get an advice for my personal project.
I have view, publish date, date data info of youtube videos that I got from kaggle. I got the vectors of titles using Doc2Vec, I used year_day(0-365 in case of seasonality) and days passed since published as features and document embedding vector of video titles as X input, and trying to predict views it has.
Is there anything weird to you here in the code?
X = us_yt[['year_day', 'days_past']]
X = (X - X.mean()) / X.std()
nlp_data = us_yt['title_vector']
nlp_data = np.array([data for data in nlp_data])
Y = us_yt[['view_count']]
nlp_input = Input(shape=(len(nlp_data[0]),))
feature_input = Input(shape=(len(X.columns),))
feature_out = Dense(100, activation='relu')(feature_input)
concat = Concatenate()([feature_out, nlp_input])
hidden1 = Dense(100, activation='relu')(concat)
hidden2 = Dense(40, activation='relu')(hidden1)
output = Dense(1, activation='relu')(hidden2)

model = Model(inputs=[nlp_input , feature_input], outputs=[output])
model.compile(optimizer='Adam', loss='MSE')
Not so surprisingly, it is not doing really fine.
I think subscriber number is an essential part to this data.
Which I lack. But anything else to add?
misty flint
ocean swallow
I think subscriber number is an essential part to this data.
yeah these features just might not be helpful, especially if your target is view count
subscriber number would def help
i wonder if video length would be helpful too
lapis sequoia
Is it better to do feature selection before optimising the hyper parameters or later?
ocean swallow
misty flint
<:PikaThink:869207765262950410>
Want this emote. Need it want it need it have to have it
Yeah subs is the biggest predictor of views I think.
length I think meeeeh.
misty flint
ocean swallow
Want this emote. Need it want it need it have to have it
bro...you have access to it
the python server has it
💀
misty flint
ocean swallow
length I think meeeeh.
length is meh but i think its a better feature than the vector of the title
ocean swallow
misty flint
length is meh but i think its a better feature than the vector of the title <:ke...
is this serious lol? Title is like the first thing that 100% pulls the person?
like say videos with Will Smith will have probably 100 folds of say Grasshopper
or will smith slap
 lilac yew
Has anyone tried importing data into DB from Grafana, Loki & Prometheus?
Need some tips or good approaches
arctic wedgeBOT
Hey @cinder matrix!
You either uploaded a .txt file or entered a message that was too long. Please use our paste bin instead.
 cinder matrix
Hi guys, Im trying to do reverse summarisation, if you consider the script, it takes input document and output is summary. Is it good idea to reverse the input and output so the model then take in summary to predict the document? Please @ when replying https://paste.pythondiscord.com/ixisafedul
 modest mulch
cinder matrix
Hi guys, Im trying to do reverse summarisation, if you consider the script, it t...
modest mulch
cinder matrix
Hi guys, Im trying to do reverse summarisation, if you consider the script, it t...
Might be, i think it would be harder to train in general
Try it
cinder matrix
modest mulch
Try it
i did the result is awful XD
i tried same on transformer and its thousand time better
modest mulch
yea expected lmao
cinder matrix
and only needed really few data to converge
is there a technical reason why lstm bad for anti sumarusation
 bitter ivy
Hello can I ask, why do I get all K1 devices (red dots) moved outside of range (time) on x axis? How can I fix it, so that time is from 0:00 to 24:00, and red dots (K1 devices) are within the range. Not separated.
Here is the image: https://i.imgur.com/NA37A3n.png
Here is the code:
import plotly.express as px
import pandas as pd

data = pd.read_excel('log_data.xls')
data = data.sort_values(by=['Time'])
print(data)
fig = px.scatter(data, x="Time", y="Date", color="Device")
fig.show()
Here are the data:
Index Device       Date      Time
53      53     L1 2022-02-06  00:01:00
124    124     L1 2022-02-13  00:02:00
83      83     L1 2022-02-09  00:09:00
54      54     L1 2022-02-06  00:22:00
0        0     L1 2022-02-01  00:38:00
33      33     L1 2022-02-04  01:22:00
60      60     L1 2022-02-07  02:22:00
44      44     L1 2022-02-05  03:03:00
94      94     L1 2022-02-10  03:44:00
61      61     L1 2022-02-07  04:20:00
73      73     L1 2022-02-08  05:03:00
62      62     L1 2022-02-07  05:15:00
84      84     L1 2022-02-09  05:59:00
55      55     L1 2022-02-06  06:00:00
114    114     L1 2022-02-12  06:01:00
105    105     L1 2022-02-11  06:03:00
23      23     L1 2022-02-03  06:06:00
1        1     L1 2022-02-01  06:20:00
13      13     L1 2022-02-02  06:22:00
74      74     L1 2022-02-08  06:28:00
14      14     L1 2022-02-02  06:28:00
34      34     L1 2022-02-04  06:34:00
56      56     K1 2022-02-06  06:39:00
85      85     K1 2022-02-09  06:48:00
115    115     K1 2022-02-12  06:52:00
95      95     L1 2022-02-10  06:59:00
106    106     K1 2022-02-11  07:02:00
2        2     K1 2022-02-01  07:02:00
116    116     L1 2022-02-12  07:03:00
96      96     K1 2022-02-10  07:04:00
..     ...    ...        ...       ...
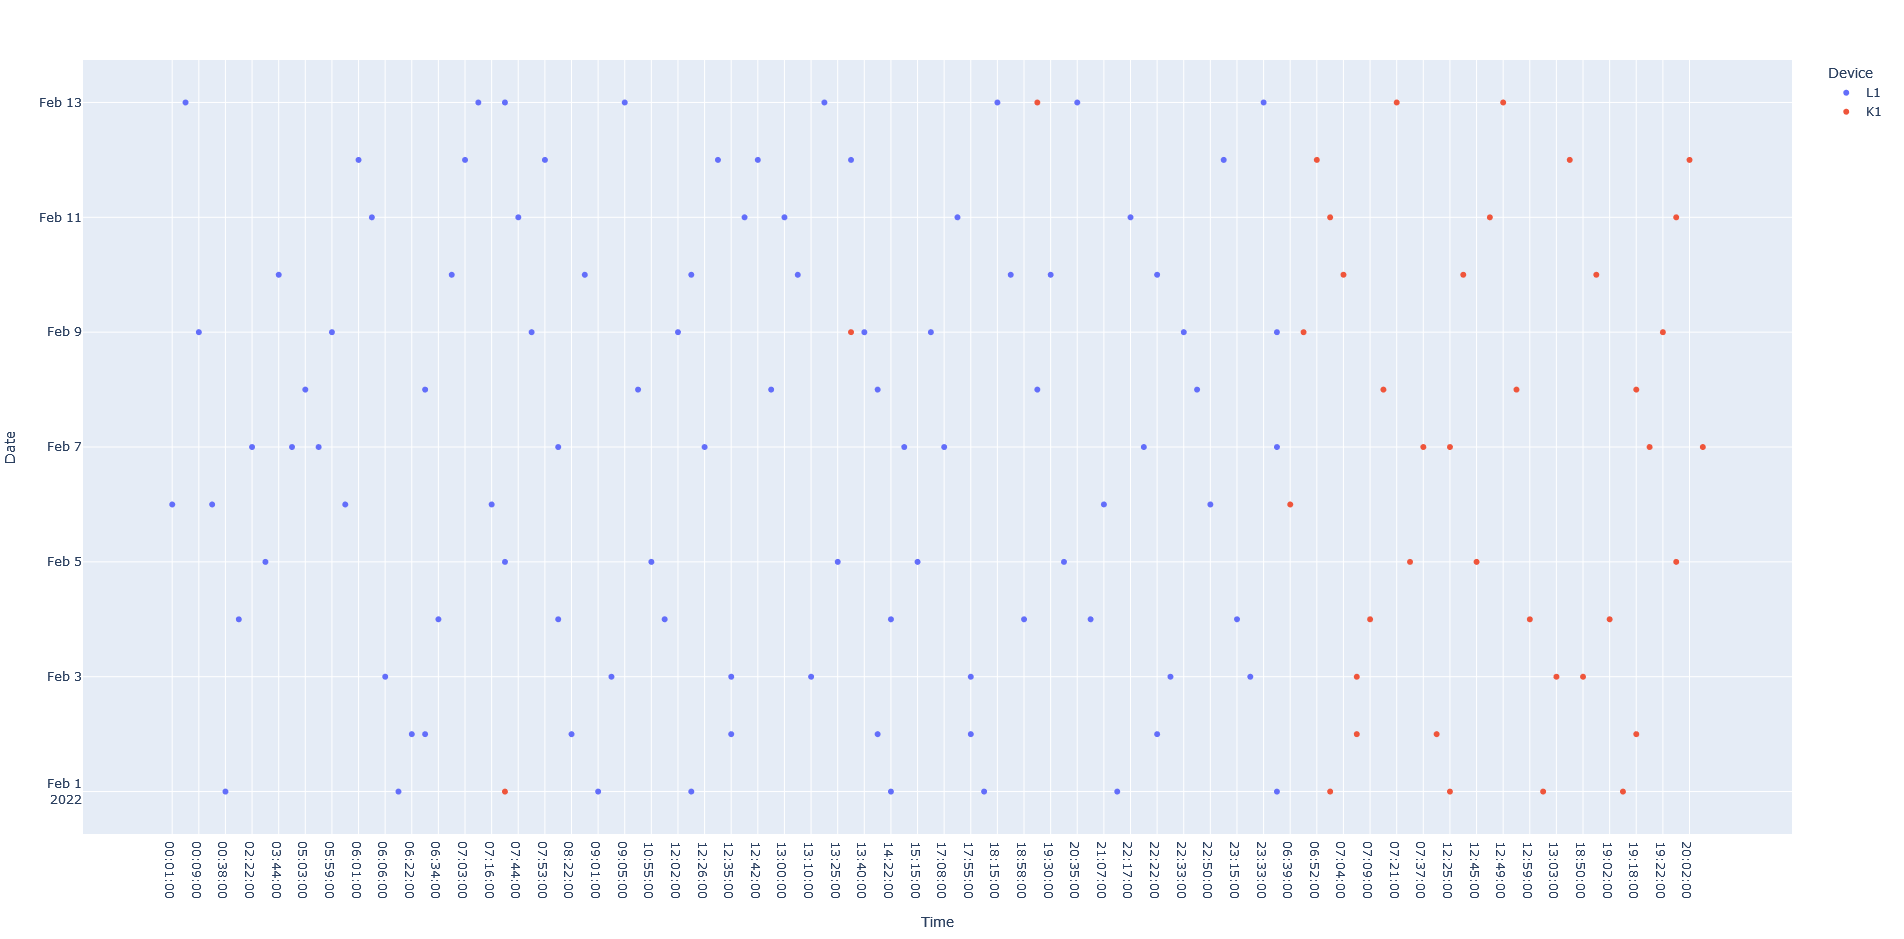
Thanks.
 craggy tiger
Hey Folks, can someone recommend a guide for Business Intelligence implementation into corporation? An up-to date BI-Structure with pros and cons as well as a role definition and workforce planing?
 woven sonnet
excuse me, anyone here know about arc consistency map coloring? i want to ask something ty
serene scaffold
woven sonnet
excuse me, anyone here know about arc consistency map coloring? i want to ask so...
you're more likely to get help if you ask your question, rather than if anyone knows about the topic
woven sonnet
serene scaffold
you're more likely to get help if you ask your question, rather than if anyone k...
Yeah i want to ask something about that
how do i make a user input for map coloring using arc consistency? im newbie and i just know the simple algorithm like
arcs = [('a', 'b'), ('b', 'a'), ('b', 'c'), ('c', 'b'), ('c', 'a'), ('a', 'c')]
domains = {
    'a': [2, 3, 4, 5, 6, 7],
    'b': [4, 5, 6, 7, 8, 9],
    'c': [1, 2, 3, 4, 5]
}
constraints = {
    ('a', 'b'): lambda a, b: a * 2 == b,
    ('b', 'a'): lambda b, a: b == 2 * a,
    ('a', 'c'): lambda a, c: a == c,
    ('c', 'a'): lambda c, a: c == a,
    ('b', 'c'): lambda b, c: b >= c - 2,
    ('b', 'c'): lambda b, c: b <= c + 2,
    ('c', 'b'): lambda c, b: b >= c - 2,
    ('c', 'b'): lambda c, b: b <= c + 2
}
thank you
 cyan sierra
Hey guys, in pandas, why should I use .apply() to apply a function on rows in specific columns instead of using the function directly on the columns?
serene scaffold
cyan sierra
Hey guys, in pandas, why should I use .apply() to apply a function on rows in sp...
what do you mean, the function direction of the columns? usually you want to avoid apply as much as possible.
cyan sierra
serene scaffold
what do you mean, the function direction of the columns? usually you want to avo...
I meant directly sorry
bold timber
Hi, I have a question: Why I get an error like this? and how to fix this error?
 serene scaffold
cyan sierra
I meant directly sorry
serene scaffold
cyan sierra
I meant directly sorry
func(series) doesn't have the same semantics as series.apply(func). the first takes the series as one argument for the function. the second is basically the same as pd.Series(func(elem) for elem in series)
cyan sierra
serene scaffold
`func(series)` doesn't have the same semantics as `series.apply(func)`. the firs...
I see! Thank you. In other words, func(series) is trying to apply the function onto the series as a whole? whereas .apply() is trying to apply a function to each element of the series?
serene scaffold
cyan sierra
I see! Thank you. In other words, ```func(series)``` is trying to apply the func...
func(series) just passes the series to the function. there's no special behavior here.
series.apply(func) does func(elem) for each element in the Series and returns a new Series with the results.
the problem is that apply is not optimized. it is just for convenience if there's no native pandas or numpy functionality for what you are trying to do.
cyan sierra
serene scaffold
`func(series)` just passes the series to the function. there's no special behavi...
What do you mean not optimized?
serene scaffold
cyan sierra
What do you mean not optimized?
native pandas and numpy functions/methods are orders of magnitude faster than equivalent Python code
cyan sierra
serene scaffold
native pandas and numpy functions/methods are orders of magnitude faster than eq...
I see, thanks. So the only reason why apply should be avoided is because of computational efficiency?
serene scaffold
cyan sierra
I see, thanks. So the only reason why apply should be avoided is because of comp...
yes. take a look at this.
In [3]: %timeit mean(list(range(10_000_000)))
2.37 s ± 6.3 ms per loop (mean ± std. dev. of 7 runs, 1 loop each)

In [4]: %timeit np.arange(10_000_000).mean()
14.7 ms ± 70.8 µs per loop (mean ± std. dev. of 7 runs, 100 loops each)
14 miliseconds vs two whole seconds.
cyan sierra
serene scaffold
yes. take a look at this.
```py
In [3]: %timeit mean(list(range(10_000_000)))
2....
I see! Thank you so much
bitter ivy
Sorry but did I asked my question in the right room? No one here understands plotly and pandas? It is fairly basic, but I do not get it.
 agile cobalt
bitter ivy
Hello can I ask, why do I get all K1 devices (red dots) moved outside of range (...
agile cobalt
bitter ivy
Hello can I ask, why do I get all K1 devices (red dots) moved outside of range (...
What is the type of time? if it's a string (object), make sure that no rows have any leading whitespace
also, whenever or not it's basic, staff members here are just volunteers. there's no guarantee / obligation that your question will be answered even if you ask it correctly
bitter ivy
agile cobalt
What is the type of `time`? if it's a string (`object`), make sure that no rows ...
Time is: hh:mm:ss
That is all
it is a string
but with no whitespaces
agile cobalt
just to make sure, would you mind checking ```py
data['Time'].str.len().value_counts()
 pseudo wren
i'm not sure how i should approach working with this data
i am working on the titanic dataset
right now i'm just doing the basic data cleaning and data observation
i checked for correlation and so far, nothing really has a strong relationship to each other
not sure what story i should tell about the data
mighty spoke
Hi if I have a a FFT graph power vs frequency does anyone know how I can find the time period? and fundamental frequency?
 serene scaffold
@pseudo wren if you know the history of the titanic, do you know which groups of people were more likely to be saved?
pseudo wren
serene scaffold
<@160842639938158593> if you know the history of the titanic, do you know which ...
See that’s the thing
Based on history
I could probably answer that question
But I don’t think I can answer it with the data provided
The correlation matrix suggests that nothing really contributed to their survival in a meaningful way
serene scaffold
as the story goes, women, children, and people in higher-classed cabins were more likely to be saved. so you should see if the data bares that out.
pseudo wren
I checked for that
But the heatmap has it as cold
And I can’t use a different titanic dataset
So I’m not sure what to say other than
“The data suggests nothing meaningfully contributed to their survival”
serene scaffold
did you try grouping by saved/not saved and doing value counts on gender?
also is this just the kaggle dataset?
pseudo wren
Oh this is true I could do value counts on gender
Yes it is from Kaggle
It’s from their titanic competition thing
So I could throw saved and not saved together
And then count how many more women were saved than men
That could be interesting?
Or the likelihood of being saved based on gender
serene scaffold
pseudo wren
Or the likelihood of being saved based on gender
In [6]: df.groupby('Survived')['Sex'].value_counts()
Out[6]:
Survived  Sex
0         male      468
          female     81
1         female    233
          male      109
this shows pretty clearly that women were strongly favored for not dying
pseudo wren
Yeah I could work with that
Maybe try one hot encoding some values as well
See if that helps anything
serene scaffold
In [8]: df.groupby('Survived')['Pclass'].value_counts().unstack()
Out[8]:
Pclass      1   2    3
Survived
0          80  97  372
1         136  87  119
most people in third class died. most people in first class lived.
serene scaffold
In [9]: df.groupby(['Sex', 'Survived'])['Pclass'].value_counts().unstack()
Out[9]:
Pclass            1   2    3
Sex    Survived
female 0          3   6   72
       1         91  70   72
male   0         77  91  300
       1         45  17   47
Third class men who died are the largest group. wow
pseudo wren
I think I maybe have a little more direction now then
if I can group those who survived
and demonstrate the relationship between those
I can train my model to predict who would most likely be saved
serene scaffold
yessss
pseudo wren
out of men and women or 1st and 3rd class
serene scaffold
though a problem with the titanic dataset is that there really aren't that many instances
pseudo wren
yeah i think they made it that way so it could be simple for beginners
serene scaffold
it's not that they wanted there to be fewer instances. it's just that there were only so many people on the boat
and the fates of all of them might not be known
pseudo wren
ah that makes sense
being a data scientist is very interesting in that it teaches you about the world more than just the average profession
so for classification
i can make a new dataframe
that contain those who have survived/died
with their genders and classes
serene scaffold
I wonder how age played into it. were old men more likely to survive? idk
pseudo wren
see that's what i was hoping to see
but i tried correlating the gender and age values
nothin
i may need to one hot encode
serene scaffold
because another problem with this dataset is that you have gender and class, and maybe also age. and beyond that, you can't really know what real world circumstances might have enabled or prevented a given person from getting to a lifeboat
if one random first class woman tripped and got trampled by other passengers, or something, that's not going to show up in this data.
pseudo wren
yeah that's what sort of made me feel discouraged about working with this dataset at first
serene scaffold
well, this is all part of the learning
it's a very interesting dataset. look at all the discussion we've had
pseudo wren
i do think it's very interesting!
I just have a lot of learning to do on how to exactly manipulate the data
I know what my goal is
pseudo wren
I want to be able to demonstrate the relationship between the values, and classify them so that i can better train my model
serene scaffold
things like gender and passenger class are categories; they don't have numeric relationships to eachother
but someone who is 40 has "twice as much age" as someone who's 20

 misty flint
misty flint
pseudo wren
being a data scientist is very interesting in that it teaches you about the worl...
yeah i think you mightve gotten there if you did a bit more EDA or data visualization and asked more questions about the data
like
what if you had asked initially
did more women survive than men?
and then gone about checking your hypothesis with the data
my point is its not necessarily about getting it right the first time, but if you get into the habit of asking initial questions when you receive a dataset, you will get better at getting those questions answered
and then move towards the modeling that you would like to get to
afterwards
since it would help you set up for that
just dont get stuck in exploration land forever. thats another trap people fall into
pseudo wren
misty flint
what if you had asked initially
I think the issue was that I was stumped on what to ask or explore. Or how to manipulate it. I had an initial question that was somewhat vague but it was asking what determining factors led to someone’s survival. I expected to see values like age to be highly correlated to survival rates but they weren’t.
So after a minute I just sort of lost confidence in it
bitter ivy
agile cobalt
just to make sure, would you mind checking ```py
data['Time'].str.len().value_co...
Hm, it says: dtype: int64. There is the problem. How would I convert to string?
agile cobalt
sorry but go read the user guides & documentation at least enough to understand what that piece of code does before anything else...
you must build a basic understanding of how pandas works first, otherwise you'll never be able to debug anything yourself
||in this case, the dtype is of the series output by the value_counts method||
misty flint
pseudo wren
So after a minute I just sort of lost confidence in it
thats okay. its difficult to see easy patterns irl
sometimes you get lucky tho
pseudo wren
misty flint
thats okay. its difficult to see easy patterns irl
Yeah I think for me, because I’m a little new at this, if I don’t see an easy pattern at first glance I feel like I have to read the entire sklearn bible in order to figure out how to manipulate the data the way I need
I’m not super confident in sklearn yet. I just started using it.
misty flint
sklearn is more for modeling
i think for the data manipulation youre looking for, i would turn to pandas
there is a lot you can do with pandas
just to explore the data more
i heard some good things about the wes mckinney's book python for data analysis
it also helps that hes the creator of pandas
bitter ivy
agile cobalt
||in this case, the dtype is of the series output by the `value_counts` method||
If I print your line of code I get: Series([], Name: Time, dtype: int64). So I think I am checking the length of every object (str). What should I get if it is not?
agile cobalt
it should show how many times each length appears.
if it's something like 8: (number of rows), then all of them have 8 characters
if it's something like 8: (number of L), 9: (number of K), then some of have may have whitespace
misty flint
this is very good for understanding the bias variance tradeoff http://www.r2d3.us/visual-intro-to-machine-learning-part-2/

Learn about bias and variance in our second animated data visualization.
serene scaffold
Is it possible that they could be talking about more than one animal at a time?
you will want to see what words come up in the context of only one animal.
my guess is that in your case, there aren't going to be enough words for that to end up making a difference
lapis sequoia
How could I do feature scaling combined with cross validation. Because I have no X_train when doing cross validation. So what do I feature scale. The whole X?
serene scaffold
lapis sequoia
How could I do feature scaling combined with cross validation. Because I have no...
when you're doing k fold cross validation, the data gets partitioned into k groups, and each one takes a turn being the test data. each turn that a group isn't part of the test data, it is part of the train data.
lapis sequoia
Can someone help me understand why my performance is not getting better with feature selection.
 lapis sequoia
serene scaffold
when you're doing k fold cross validation, the data gets partitioned into k grou...
lapis sequoia
serene scaffold
when you're doing k fold cross validation, the data gets partitioned into k grou...
I know the theory behind it.
serene scaffold
Sorry, but I will not look at this. I will only look at actual text.