#data-science-and-ml
1 messages · Page 278 of 1
 velvet thorn
 wintry nacelle
That's not my problem either
I'll try stating it one more time
I can put each individual image into a numpy array
I want to put ALL of the images into a single multidimensional numpy array
And I have no idea how to do that
velvet thorn
np.stack
wintry nacelle
wat
velvet thorn
!e ```py
import numpy as np
a = np.array([1, 2, 3])
b = np.array([4, 5, 6])
print(np.stack([a, b]))
 arctic wedgeBOT
@velvet thorn :white_check_mark: Your eval job has completed with return code 0.
001 | [[1 2 3]
002 |  [4 5 6]]
Oh huh
That would work
Wanna make sure I'm communicating something else clearly
I'm wanting the format of the array to be something like
(IMG, X, Y, RGBA)
velvet thorn
img = sample number and RGBA = channel?
wintry nacelle
Like how the NMIST handwritten digit dataset is organized (I think)
velvet thorn
e.g. 20 images with 4 channels would have shape (20, 100, 100, 4)?
wintry nacelle
Yep
wintry nacelle
Yes
(though they are inconsistently sized but I can fix that with padding easily, I already know how)
velvet thorn
np.stack with axis=0
wintry nacelle
Wait
velvet thorn
the axis parameter specifies which axis you want to...well...stack the arrays on
so
wintry nacelle
I think I misread what you meant
velvet thorn
if you have a collection of n arrays of shape (x, y, c), you'll end up with a single array of shape (n, x, y, c)
velvet thorn
wintry nacelle
I think I misread what you meant
resize them first
velvet thorn
velvet thorn
are already of shape (100, 100, 4)?
then you'll have this
wintry nacelle
Would running numpy.asarray(image) get me the (100, 100, 4) numpy array?
velvet thorn
what is image?
wintry nacelle
The image being pulled from my computer
wintry nacelle
Yes, though I could use other ways of getting the image
velvet thorn
it will be whatever size the original image was
wintry nacelle
Well I can deal with the size
velvet thorn
yes
so
the process should be:
- load image
- pad image
- put image in collection
- go back to 1 until all images are done
- stack collection from 3
wintry nacelle
Would the collection from 3. be a regular Python array or a numpy array?
wintry nacelle
Alright, so then I run np.stack on the list and then I get the (IMG, X, Y, RGBA) dataset I'm looking for?
velvet thorn
yes, assuming everything you've said above reflects your data
example:
!e
import numpy as np

image_a = np.random.rand(100, 100, 4)
image_b = np.random.rand(100, 100, 4)

print(image_a.shape)
print(image_b.shape)

images = [image_a, image_b]

print(np.stack(images, axis=0).shape)
@velvet thorn :white_check_mark: Your eval job has completed with return code 0.
001 | (100, 100, 4)
002 | (100, 100, 4)
003 | (2, 100, 100, 4)
@wintry nacelle see what I mean?
wintry nacelle
Definitely
velvet thorn
okay
wintry nacelle
Thanks for the help
velvet thorn
yw
 west junco
anyone know where to learn algorithms and data structures
velvet thorn
!resources
arctic wedgeBOT
Resources
The Resources page on our website contains a list of hand-selected learning resources that we regularly recommend to both beginners and experts.
https://pythondiscord.com/pages/resources
velvet thorn
west junco
anyone know where to learn algorithms and data structures
you can check that out
although I would suggest you also ask in #algos-and-data-structs 😉
wintry nacelle
BTW gm when I said color correction I meant dealing with stuff like this
That's supposed to be the British flag
west junco
@velvet thorn thanks for the advice i didn't even see that text chat lol
wintry nacelle
So not like brightening it up or anything like that
Alright, another question @velvet thorn . My current idea is that the B and A channels have been somehow swapped. Now I need to modify every dict in the RBGA dimension. Any way of doing this quickly and without loops?
velvet thorn
wintry nacelle
Alright, another question <@!171929073063297024> . My current idea is that the B...
dict???
wintry nacelle
Idk it's how I characterize it in my head
Sorry if I scared you with that
Most likely it's not a dict
wintry nacelle
Well then I meant array, sorry
velvet thorn
let me think about this for a bit
wintry nacelle
Wait does this mean I don't have to do the reshape thing?
wintry nacelle
velvet thorn
why do you say that
!e
import numpy as np

a = np.arange(8).reshape(4, 2)
print(a)

a[..., 0], a[..., 1] = a[..., 1], a[..., 0]

print(a)
hm.
well
wintry nacelle
velvet thorn
why do you say that
?
arctic wedgeBOT
@velvet thorn :white_check_mark: Your eval job has completed with return code 0.
001 | [[0 1]
002 |  [2 3]
003 |  [4 5]
004 |  [6 7]]
005 | [[1 1]
006 |  [3 3]
007 |  [5 5]
008 |  [7 7]]
It's not a problem but yaknow probably wanna cut down on memory usage
velvet thorn
hey, this actually does not work
velvet thorn
wintry nacelle
It's not a problem but yaknow probably wanna cut down on memory usage
are you facing memory errors?
wintry nacelle
Nah, more of a best practices learning thing.
I only face memory errors if I make my model far too big
velvet thorn
wintry nacelle
Nah, more of a best practices learning thing.
probz not the kind of thing you should be worrying about IMO
wintry nacelle
When I first started putting together a DCGAN I hadn't read the relevant literature and I thought adding dense layers would make my digits look less ugly. Turns out it made the model extremely slow and extremely unstable
velvet thorn
wintry nacelle
When I first started putting together a DCGAN I hadn't read the relevant literat...
yeah
but that's quite a different thing
anyway
you can just slice your final array
so you get the sub-arrays that correspond to the channels you want to swap
then swap them
wintry nacelle
So slice the G channel, slice the A channel, and swap them
I assume numpy has a specific function for this
wintry nacelle
Figured it out (I think)
data_copy = np.copy(data)
data_copy[:, :, 2], data_copy[:, :, 3] = data[:, :, 3], data[:, :, 2]
Gets me this result:
I think I've figured it out finally but I have some bugfixing to do
Apparently one of my images is 612 pixels in height
Oh nevermind my pad function just isn't prepared to handle any images bigger than the target size
Yay it now works, thanks for the help again
!paste
Here's my code: https://paste.pythondiscord.com/iqazinojaj.py
I copied from my jupyter file so a lot of those imports are for other things
wintry nacelle
Perhaps I should increase the Conv2D stride
 ebon pier
is it possile to sentiment analyzing output from LDA?
 lunar grotto
In Pandas, how can I keep the 'date' value when doing a groupby like df.groupby(df['date'].dt.strftime('%b-%d'))? I only want to use the 'date' field to group the data based on the month and day, but I need the original data in later processing.
 astral pollen
lunar grotto
In Pandas, how can I keep the `'date'` value when doing a groupby like `df.group...
astral pollen
lunar grotto
In Pandas, how can I keep the `'date'` value when doing a groupby like `df.group...
Create a copy of the date column to use for the groupby operation
df[”dateG”] = df.date
Then groupby dateG
lunar grotto
It actually looks like the 'date' was still there, just that it wasn't visible when inspecting the results with df.describe(). Thanks!
 past bramble
[#data-science-and-ml](/guild/267624335836053506/channel/366673247892275221/)
 hard hound
Hey does anyone use IBM's quantum computer(they give free access to their processing power)
 manic granite
so arrogant xd
hard hound
then dont
 compact mauve
is there a short-cut to find the best transformer model at huggingface?
eg how to know quickly the best q a model without trying them all by myself and without crawling thru all release tags from huggingface...
lunar grotto
For each group below I would like to calculate the mean of the 'diff' column and then re-index the values based on the 'date_month_day'.
Whatever I try, I seem to lose the 'date_month_day' column. Any suggestions, please?
df['date_month_day'] = df['date'].dt.strftime('%m-%d')
hist = df.groupby(df['date'].dt.strftime('%b-%d'))
for n,g in hist:
    print(g)
                          date   value  prev_value  diff date_month_day
314  2012-04-01 22:00:00+00:00  167.11      165.69  1.42          04-01
562  2013-04-01 22:00:00+00:00  186.85      185.97  0.88          04-01
813  2014-04-01 22:00:00+00:00  236.63      236.13  0.50          04-01
1062 2015-04-01 22:00:00+00:00  335.50      332.26  3.24          04-01
2068 2019-04-01 22:00:00+00:00  861.56      854.93  6.63          04-01
2318 2020-04-01 22:00:00+00:00  918.13      917.97  0.16          04-01
                          date   value  prev_value   diff date_month_day
315  2012-04-02 22:00:00+00:00  169.71      167.11   2.60          04-02
563  2013-04-02 22:00:00+00:00  186.94      186.85   0.09          04-02
814  2014-04-02 22:00:00+00:00  236.84      236.63   0.21          04-02
1567 2017-04-02 22:00:00+00:00  592.20      590.36   1.84          04-02
1817 2018-04-02 22:00:00+00:00  720.54      723.80  -3.26          04-02
2069 2019-04-02 22:00:00+00:00  869.79      861.56   8.23          04-02
2319 2020-04-02 22:00:00+00:00  929.75      918.13  11.62          04-02
This is kind of what I want:
df['date_month_day'] = df['date'].dt.strftime('%m-%d')
hist = df.groupby(df['date'].dt.strftime('%b-%d'))#.apply(lambda g: g['diff'].mean())

def get_stats(group):
    return {'mean': group['diff'].mean(), 'date': group['date_month_day'].iloc[0]}

df.groupby(df['date'].dt.strftime('%b-%d')).apply(get_stats)
``` which results in
date
Apr-01 {'mean': 2.1383333333333305, 'date': '04-01'}
Apr-02 {'mean': 3.047142857142867, 'date': '04-02'}
Apr-03 {'mean': -1.005000000000006, 'date': '04-03'}
Apr-04 {'mean': 1.9642857142857184, 'date': '04-04'}
Apr-05 {'mean': 8.04200000000002, 'date': '04-05'}
How can I turn this back into a table? hushed wasp
Could someone tell me how to get a dataframe as output of this function?
Thanks
def exploreFrequencies(data):
print("{0:30} {1:25} {2:25}".format("name", "unique values", "missing values"))
for i in data:
print("{0:30} {1:20} {2:20}".format(i, data[i].nunique(),data[i].isna().sum()))
print("------------------------------------")
 ebon fable
Can anyone recommand any good ( both on price and learning ) course on Data science and machine learning? Please fast..... i need it
 shadow quiver
This is the prediction of a binary classification model. The model is doing predicitons continuously, and these values are the sum of positive labels during a 10 hours period. As you can see, some of the x values are tend to generate positive labels, but really most of them are not true. The x-axis is locations and the y-axis is time.
How can I smooth this? Like, maybe another model can learn the trends of locations (x-values) and with some kind of a reinforcement learning method, the model can learn most of the positive predictions of these locations are false? An unsupervised model? Or maybe even a smoothing algorithm can help
Even if you can give me a name of a method, or a paper about this, that would be appreciated, I really need this
wintry nacelle
I have finally built my first ML model without instruction (though I did get some help from users of this discord and some research papers). I am proud to say the results are currently giving me at least a crumb of hope that I'm not a complete idiot
shadow quiver
@wintry nacelle Congrats!
wintry nacelle
It's a DCGAN. Here is my discriminator:
And here is my sequential
My GPU does not have enough memory to allocate all of this so I suppose Tensorflow is doing the best it can
Every training epoch takes about 20s
 sand snow
hey guys, why does this code print out a huge amount of numbers left and right of the graph?
`
import matplotlib.pyplot as plt
import numpy as np
x = np.linspace(0,10,1000)
#fig = plt.figure()
#ax = plt.axes()
plt.plot(x, np.sin(x), color='b', linestyle='-', label='sin()')
plt.plot(x, np.cos(x), color='r', linestyle=':', label='cos()')
#ax.plot(x,y)
plt.xlabel(x)
plt.ylabel(y)
plt.title('Basic Plot')
plt.legend()
plt.show()
`
im peicing together all code that I learned so far, this is bugging me
 lapis sequoia
How can I remove the bad encodings present in this string # shark # newjersey # swim # sandy # hurricane \ue410\ue107\ue43e
wintry nacelle
Are you talking about \ue410\ue107\ue43e?
lapis sequoia
yes
wintry nacelle
Use Python's RegEx
I think there's basically a "find and replace every instance" function but I forgot what it's called
I can craft a RegEx for you
lapis sequoia
let me know if you find sth, thanks
wintry nacelle
Here's your RegEx
(\\u[0-9a-f]{4})
lapis sequoia
thanks
wintry nacelle
import re

regex = re.compile("(\\u[0-9a-f]{4})")
new_string = re.sub(regex, "", input_string)
error: incomplete escape \u at position 1
lapis sequoia
k
wintry nacelle
r"(\\u[0-9a-f]{4})"
sand snow
sand snow
`
import matplotlib.pyplot as plt
import numpy as np
x = np.linspace(0,10,1000)...
solved nvrmd
lapis sequoia
that line ended up being the same
re.sub(r"(\\u[0-9a-f]{4})", "", line) where line = bytes('# shark # newjersey # swim # sandy # hurricane ', 'utf-8').decode('utf-8', 'ignore')
sand snow
make it a raw string?
wintry nacelle
re.sub is purely functional, it returns a new string
It doesn't modify an old string
lapis sequoia
I was running it in a jupyter notebook, even with this line o = re.sub(r"(\\u[0-9a-f]{4})", "", line)
it doesn't work
wintry nacelle
It still keeps the box characters?
lapis sequoia
the box characters turn into bad encodings and those persist after the re.sub
 hushed swan
So I am starting to learn to use jupyter lab and notebook with pandas. Using the df.plot(), is there a way I can save that plot as a .png or .jpg file on my computer?
lapis sequoia
I have a Python project where I'm trying to solve a system of ODEs. I need some help getting it to converge on a solution. There is too much code to submit it as a question on Stack Overflow. Is there a code review service or something like Stack Overflow where people can look at an entire code project and offer help?
 odd lion
lapis sequoia
I have a Python project where I'm trying to solve a system of ODEs. I need some ...
odd lion
lapis sequoia
I have a Python project where I'm trying to solve a system of ODEs. I need some ...
You might post a link to a github repo and ask for help? I think your best bet is posting to somewhere like this and hoping someone helps. I'd try multiple discords/slacks
odd lion
hushed swan
So I am starting to learn to use jupyter lab and notebook with pandas. Using the...
It's just using matplotlib in the backend, this works: df.plot().get_figure().savefig('output.png')
odd lion
sand snow
`
import matplotlib.pyplot as plt
import numpy as np
x = np.linspace(0,10,1000)...
You set your xlabel to the list x and the ylabel to the list of "y", so all 1000 values. Set it to just the string 'x' and 'y' or something
odd lion
ebon fable
Can anyone recommand any good ( both on price and learning ) course on Data scie...
Beginner course? MIT's ML course or Coursera's Andrew Ng ML course are good
odd lion
hushed wasp
Could someone tell me how to get a dataframe as output of this function?
Thanks...
Create an empty dataframe df and df.append for each i
hushed wasp
odd lion
Create an empty dataframe df and df.append for each i
Thanks man
lapis sequoia
@odd lion I'll push everything to GitHub and then ask for help. You suggested I try multiple Discords and Slacks. Which Discords and Slacks are you referring to?
odd lion
lapis sequoia
<@200445410152677387> I'll push everything to GitHub and then ask for help. You ...
Oh I'm a member of 19 different slacks/discords for python and Data Science as I find each one has a different community with questions and help I can get
Plus I really like reading other people's questions as it exposes me to new things
lapis sequoia
@odd lion I do mostly scientific computational stuff with Python. Are there any groups I could join that focus on that area of Python?
 left folio
Hi, I need some advice, so I'm doing a project where I need to calculate gross revenues, etc from different table (or files, such as sales, products), but I gotta do ONLY using Python built-in package. So I cannot use Pandas or Numpy. I'm opening the files using 'with open', but I'm not sure if I can manipulate data in side of 'with open'. Or is it better if I save the data into variables, and work on them?
odd lion
left folio
Hi, I need some advice, so I'm doing a project where I need to calculate gross r...
It's probably easier to just save things to variables and work on them
left folio
What if the file is really big?
Wouldn't it be inefficient? Or is it pretty much the same?
 woeful wolf
hello could anyone familiar with curve fitting in python please help me or dm me
odd lion
left folio
Wouldn't it be inefficient? Or is it pretty much the same?
Big like gigabytes of data big? Or like a few dozen megs? The latter isn't that bad and can easily be held in arrays.
 muted sapphire
Can anyone give me some advice regarding an NLP problem?
left folio
@odd lion Thank you
 serene scaffold
muted sapphire
Can anyone give me some advice regarding an NLP problem?
serene scaffold
muted sapphire
Can anyone give me some advice regarding an NLP problem?
what's the problem? (ping to reply)
 vapid pelican
Just wondering, should I use Tensorflow or Pytorch for A.i applications?
odd lion
vapid pelican
Just wondering, should I use Tensorflow or Pytorch for A.i applications?
Whichever you prefer. Both are heavily used in industry
 rugged comet
The TensorFlow documentation says that I should use CUDA 11.0 when using TensorFlow 2.4.0 which I am. Should I get the base version of 11.0 or update 1?
(if this is the wrong channel for this, let me know)
 small holly
._.
odd lion
rugged comet
The TensorFlow documentation says that I should use CUDA 11.0 when using TensorF...
I think you should be fine, but I'm sure you can get an exact answer on the Tensorflow Discord
velvet thorn
rugged comet
The TensorFlow documentation says that I should use CUDA 11.0 when using TensorF...
generally minor versions shouldn't make a difference, but I'd say get the base one
velvet thorn
left folio
Hi, I need some advice, so I'm doing a project where I need to calculate gross r...
you need to read the data into Python before you can manipulate it
then after that
write it back
rugged comet
oop
velvet thorn
there's this thing called memory mapping where you work directly with the file on disk but you probz don't need it
odd lion
rugged comet
alright ty
Can't send it over here, I'll PM it
serene scaffold
@odd lion I'll join the server and see if it can be whitelisted
@odd lion should be good to go
odd lion
Cool, Here's the link for anyone: https://discord.gg/KNm5Epj
serene scaffold
If anyone trolls a member of Python Discord on that server, you will be permanently banned from here!
Just kidding.
rugged comet
ty
rugged comet
What are some ways to improve the loss of a NN besides increases the number of epochs?
lapis sequoia
rugged comet
What are some ways to improve the loss of a NN besides increases the number of e...
Hyper parameter tuning
rugged comet
@lapis sequoia Can you go into more detail, please? I don't know what you mean.
lapis sequoia
There are things like EarlyStopping
In which u can set some things
Like restore_best weights
Verbose
Patience
Min_delta
Check the docs
Of keras
U’ll find them there
lapis sequoia
Welcome
 untold hare
Just found a fantastic lecturer on youtube for ML and data science
https://www.youtube.com/c/Eigensteve/playlists
He explains the math behind ML algorithms and practices and then also show how to implement it in MATLAB and Python

YouTube
muted sapphire
@serene scaffold Hi and thanks. I have a dataset with toxic texts, and for each entry (each text) I have the toxic span of the text. That is, I have the range of characters which are toxic. A head() of the dafatframe is (sorry in advance for curses)
The problem is, given a test text like these, to predict its toxic span..
But, i dont know if maching learning algorithms like svm can do this, because i give as input something and i expect to get pack a sequence of 0 and 1s..I guess neural networks can, but what about SVM for example?
 blissful basalt
Hello, I'm Steve Kwon!
I am a UTS student who studied Python last April and joined the military service in the same year.
I didn't have much time to study because of the army, so I just started to study machine learning and Kaggle.
Kaggle is the biggest platform and community for data scientists all over the world.
In order to understand and get started, I've written a document called Hello Kaggle! while reading the Kaggle Guide book and the official Kaggle documents.
I'd appreciate it if you could look around and press star if it is helpful to you!

GitHub
For someone who is new at Kaggle. Contribute to stevekwon211/Hello-Kaggle development by creating an account on GitHub.
 hollow scarab
anyone has any idea how to remove that first index row? I tried iloc, loc, I set index=False and it just not being removed at all
and I wouldnt mind it being there, but I need to order the data in ascending order, and it doesnt recognize the headers from the 2. row because of this index row...
 supple meadow
Hi all, just wandering if some of you had dealt with classification using skitlearn over a numpy MaskedArray. I just posted the question on stackoverflow
https://stackoverflow.com/questions/65630258/sklearn-classifier-to-predict-on-a-maskedarray

Stack Overflow
I am trying to figure out how to deal with a classifier prediction on a numpy Masked array (instead of a regular numpy array). Here is my code:
My masked array on which to perform the prediction
...
odd lion
hollow scarab
and I wouldnt mind it being there, but I need to order the data in ascending ord...
How are you initially importing the data?
hollow scarab
you mean how the data looks like or the code? @odd lion
and the original data
its downloaded using python, so thats why it has indexes already
odd lion
https://pandas.pydata.org/pandas-docs/stable/reference/api/pandas.read_excel.html you can set header=1
Ideally you'd download it with the appropriate headers, but you can choose the row
hollow scarab
I tried that but it didnt work either:/
well yeah, the code which downloads it is not written by me and I cant touch it
oh nvm I tried sth else, lemme try this
getting this error now with header =1 added to pd.read_excel
odd lion
Hm, that should work, I made a random test file
Maybe use the openpyxl engine?
Ah, but it cuts off that first row instead which is not what you'd want
hollow scarab
yeah :/
odd lion
Import it with no header, then assign the header and drop the row
lapis sequoia
supple meadow
Hi all, just wandering if some of you had dealt with classification using skitle...
Hey I’m also there at kaggle
My id is Naman Kohli ML
We can connect there for competitions and other things if u like
 livid plume
having UnicodeDecodeError issues. can anyone help????
netCDF files are being encoding into Windows-1254, isntead of default UTF-8
supple meadow
lapis sequoia
We can connect there for competitions and other things if u like
Cool, I'll contact you there
shadow quiver
Hi. Consider this dataframe: how can I replace prices to the maximum price at the latest date for each item? So far I did it with:
data.groupby(['item_id'])[['date', 'price']].apply(lambda group: group.loc[group.date == group.date.max()]['price'].max())```
But I'm not sure if I extra laborAs I mentioned yesterday, I'm having some issues using SciPy's solve_ivp function. I posted the question on Stack Overflow to hopefully get some help. https://stackoverflow.com/questions/65632575/scipy-solve-ivp-fails-to-converge-for-large-system-of-ordinary-differential-equa
Stack Overflow
I'm trying to use SciPy's solve_ivp function to solve a large system of coupled ODEs. The system of equations represent temperature, mass concentrations, and flows along a one-dimensional grid. The
 cyan nacelle
I made a list of pizza_toppings = ("cheese", "pepperoni") and then i tried this
pizza_toppings.append("mushroom") but it's coming an error 'tuple' object has no attribute 'append' ???? but why I don't know I am just a beginner...what do I do??
odd lion
cyan nacelle
I made a list of pizza_toppings = ("cheese", "pepperoni") and then i tried this ...
Use an array ['cheese', 'pepperono'] not a tuple ('cheese', 'pepperoni')
You can't treat tuples as lists to modify, you can arrays
cyan nacelle
odd lion
You can't treat tuples as lists to modify, you can arrays
thank you!!
lapis sequoia
In Python ['cheese', 'pepperono'] is considered a list not an array. An array in Python is usually built with the NumPy package which would be np.array(['cheese', 'pepperono']) . Although NumPy is used mostly for numerical data, not strings.
odd lion
You're right @lapis sequoia, thank you for clarifying, I tend to just think of lists as arrays
lapis sequoia
Check out the Python docs at https://docs.python.org/3/tutorial/introduction.html#lists to learn all kinds of stuff about lists.
serene scaffold
I have a list of dataframes that are all storing the same type of data (same shape, same row names, same column names), and I want to make a new dataframe that picks the rows with the lowest value in a certain column from each dataframe.
I don't know what to call that operation
velvet thorn
I have a list of dataframes that are all storing the same type of data (same shape, same row names, same column names), and I want to make a new dataframe that picks the rows with the lowest value in a certain column from each dataframe.
@serene scaffold by row names you mean indexes?
serene scaffold
velvet thorn
> I have a list of dataframes that are all storing the same type of data (same s...
I think so, yes.
In either case my advisor said we only needed information from one column, and I knew how to do the operations I needed to do in that light.
namely the f1 column. So I don't need to select the precision, recall, and f1 associated with the best or worst f1 score. Just the f1 score.
velvet thorn
namely the f1 column. So I don't need to select the precision, recall, and f1 associated with the best or worst f1 score. Just the f1 score.
@serene scaffold so 1 row per DF?
do you need to know which DF the rows come from?
serene scaffold
velvet thorn
> namely the f1 column. So I don't need to select the precision, recall, and f1 ...
the original goal was to take n dataframes, and create two new dataframes that had the "best" or "worst" value for each row across the dataframes in terms of the f1 column.
each DF represented a given run of a train-test algorithm, and we wanted to find the run that performed the worst for a given class, and which performed the best.
serene scaffold
velvet thorn
do you need to know which DF the rows come from?
no
velvet thorn
sounds like a sort -> index -> concat operation to me
serene scaffold
I think I see where you're going with that
I have to head out all of the sudden
Thanks!
velvet thorn
yw
manic granite
https://colab.research.google.com/drive/1bGkgDBAmn7FUX_lws3OYF8Klw80ddMN7?usp=sharing#scrollTo=o1yWGPEz_07e how should i modify this code to save the model (layers and weights) so i can load it with keras on my local machine?

 twilit ice
@lapis sequoia this seems like a decent enough channel to continue discussing this issue, but I just realized that I updated to 3.9 earlier today 
looks like a downgrade to 3.8 is in order
I should have 
 sturdy dune
Chatbots have always been so fascinating to me. I was always curious to study about chatbots. Today, I am happy to share that my first try at "building a Retrieval based Chatbot" is successful. Oh yes! I created my first chatbot🤩. Feel free to share your feedback. You can find the code and complete documentation for this chatbot project from the link below. https://datamahadev.com/building-a-chatbot-in-python/

Have you ever thought of building your chatbot? If you have, then this project is going to be your first step in the innovative field of chatbots.
 frank acorn
I just want to ask everyone a ques:
Suppose i want a data-set of images for my DL model and for that instead of clicking so many images i decide to make a video of concerned object and extract images from that. What will be the pros and cons of this process??
velvet thorn
lets say i have some ID value with some filled values and some empty values in a dataframe. How can i lookup that specific ID value and add a value to that previously empty column
@glad mulch empty meaning null?
I just want to ask everyone a ques:
Suppose i want a data-set of images for my DL model and for that instead of clicking so many images i decide to make a video of concerned object and extract images from that. What will be the pros and cons of this process??
@frank acorn what do you want your model to do?
null or NaN
@glad mulch fillna, probably
depending on the structure of your data
frank acorn
let's say, I want to make a classifier
velvet thorn
give a specific example
let's say, I want to make a classifier
@frank acorn probably not a good idea
you’ll run into overfitting hell
UNLESS you’re doing like pose estimation for a specific object
then maybe?
what kind of classification specifically
frank acorn
the model will be used at a production outlet
to find weather any model defected or not
velvet thorn
so i have this list which holds specific data like so
@glad mulch so not a dataframe?
i add it to a dataframe
@glad mulch kind of hard to read
image + very dense data
to find weather any model defected or not
@frank acorn not a good idea IMO
but you can try it if you want
is this better?
@glad mulch can you paste as text
frank acorn
velvet thorn
> to find weather any model defected or not
<@457859117214728204> not a good id...
yeah I just want to know why is this not a good idea
velvet thorn
yeah I just want to know why is this not a good idea
@frank acorn because the variance in your data will be low
frank acorn
someone asked me this ques in an interview
velvet thorn
which will tend to lead to overfitting
frank acorn
velvet thorn
which will tend to lead to overfitting
okk..got it thanks
velvet thorn
here is the top 3 results
@glad mulch okay, and what do you want to do?
okk..got it thanks
@frank acorn yw
if there are duplicates
which one should be added
okay so like for this what should the result look like
AH
okay
I get it now
so basically
each of the 2-element sublists at the end
will become
a column
which means that you don't know at the start how many columns you will have
correct?
okay
this is a bit more complex than I had thought
let me consider the problem a while
btw
in general
you should always give sample input and expected output
a lot easier to understand
so one thing I don't really get
is this from a file?
it's not a valid Python list
ah, okay
it comes from print
yeah, show the original data please
okay
this is what I suggest
waitt
all the elements
look like that?
length 6 lists?
question = everything after the 4th element?
wait hold up
Q3 appears twice here
which should be taken
okay can I assume
that
there will be no duplicates
?
try this
personal_keys = ['first_name', 'last_name', 'student_no', 'course']
processed = defaultdict(dict)

for first_name, last_name, student_no, course, *grades in data:
    personal = (first_name, last_name, student_no, course)
    for grade in grades:
        question, mark = grade.split('-')
        processed[personal][question] = mark

result = [{**dict(zip(personal_keys, personal)), **grades} for personal, grades in processed.items()]
that would be something you can Google 😉
velvet thorn
from collections import defaultdict
a defaultdict is a dict that basically adds keys automatically if they don't already exist
 silver jetty
Hello!
I have a problem with my GAN where every seed generates the same face, or it alternates between two or three faces.
The GAN worked as intended with frog pictures and cat pictures but now that I'm trying anime faces I get this problem
I hope there's an easy solution for this but if there isn't I'd love a pointer to some reading I could do on the subject
lapis sequoia
print("hello world")
Hello!
I have a problem with my GAN where every seed generates the same face, or it alternates between two or three faces.
The GAN worked as intended with frog pictures and cat pictures but now that I'm trying anime faces I get this problem
I hope there's an easy solution for this but if there isn't I'd love a pointer to some reading I could do on the subject
@silver jetty how much training data did you have?
 brisk portal
hey, guys can i make my hbar + xlabels so, that they dont overlap in this particular scenario?
lapis sequoia
 solar umbra
why is there a red line
solar umbra
why is there a red line
is it causing an error?
i dont think it should be... it's for the english usage not the code I believe
 austere swift
solar umbra
why is there a red line
austere swift
solar umbra
why is there a red line
if you hover over it it will tell you why
but i'm pretty sure its because the class method should be called like Developer.new_dev(d_str1)
 keen fossil
brisk portal
hey, guys can i make my hbar + xlabels so, that they dont overlap in this partic...
keen fossil
brisk portal
hey, guys can i make my hbar + xlabels so, that they dont overlap in this partic...
change the distance
 unborn temple
is this loss good or bad?
 limber vector
when i am trying to convert object column into float in a dataframe i am getting "could not convert string to float: '28-35'" error
can anyone help with this
odd lion
limber vector
when i am trying to convert object column into float in a dataframe i am getting...
You have stored in that column somewhere the string "28-35", which cannot be converted to a float
solar umbra
austere swift
if you hover over it it will tell you why
Thank you so much sir i really appretiate it 👍
 wooden mulch
 heady tide
is there a way to change cell IDs in jupyter notebook without restarting the kernel or running the code ?
I really don't want to wait another 12 hours
 trim oar
heady tide
is there a way to change cell IDs in jupyter notebook without restarting the ker...
trim oar
heady tide
is there a way to change cell IDs in jupyter notebook without restarting the ker...
What do you mean?
heady tide
I want to change the cell numbers without executing the code inside (the In[number] Out[number])
trim oar
Oh that's not possible without running the code
heady tide
I will have to rerun a cell that takes +-12 hours
trim oar
If it's to present, people don't mind it that much
Alternatively you can write into a .py script and have a .md to explain your thought process
That number is not an ID but simply the nth input you've put in, so you can trace back to where you ran the code last
heady tide
Thanks for clearing it out though
limber vector
odd lion
You have stored in that column somewhere the string "28-35", which cannot be con...
thank you
 west rain
Could someone help me ordering these education qualifications? I'm not aware of american education system
College, Doctorate, Graduate, High School, Post-Graduate
 digital niche
@west rain US education high school, college, graduate, post-graduate, doctorate ( give or take )
west rain
digital niche
<@!471301505761280000> US education high school, college, graduate, post-gradua...
Thanks!
digital niche
There are a lot more variations too
west rain
Yeah, but I need to sort some levels on R and these are the only ones I have
 charred blaze
brisk portal
hey, guys can i make my hbar + xlabels so, that they dont overlap in this partic...
charred blaze
brisk portal
hey, guys can i make my hbar + xlabels so, that they dont overlap in this partic...
Looks like you're using pandas. Try to adjust the font_size parameter
 twilit pilot
Whats the difference between the following 3? Tensorflow, Keras, and Scikit-Learn. Thanks in advance!!!
manic granite
https://colab.research.google.com/drive/1bGkgDBAmn7FUX_lws3OYF8Klw80ddMN7?usp=sharing#scrollTo=o1yWGPEz_07e How can i save the model here as .h5? i guess the model is not serializable cuz it is not a subclass of functional or sequential
silver jetty
velvet thorn
> Hello!
> I have a problem with my GAN where every seed generates the same face...
I have 60k images, I’ve tried varying the amount I use for training but same result, all seeds make the same face
 pale mural
A is a function of x, w and b. Why is the cost function not also a function of x?
 long horizon
Hey! I'm writing an optimizer and getting weird issues with pythons Math.log(x) function using very small numbers. Are Numpy's log and the python math library log different? Should I pursue replacing my code with numpy if I believe I might be having precision errors in my optomized function?
For clarity, the function is currently being optimized with SciPy BFGS and has a ton of Log terms in it. The math in the function is done with pythons math.log (etc) methods
The solutions are typically small numbers, and I think BFGS is having a hard time finding them as going from 0.0001 to 0.00001 will change the error drastically, and it may completely miss the solution. Furthermore, the log terms make 0 return a domain error
Please @ me if you reply so I'll see your response!
odd lion
twilit pilot
Whats the difference between the following 3? Tensorflow, Keras, and Scikit-Lea...
From my understanding:
scikit - does almost all major supervised/unsupervised ML algos but can only use the CPU. Best for educational or small project use
Tensorflow - Primarily for Neural Networks, but also linear regression, SVC, and boosted trees, allows for super fine control over how you build your algos and can be run on the GPU
Keras - API on top of Tensorflow to make it easier to program, but you sacrifice some performance then. In TF 2.0 it integrated keras so really TF lets you take the "easy" API way or the detailed work if you want.
I have limited TF/Keras experience so someone please correct me if I'm wrong
odd lion
long horizon
The solutions are typically small numbers, and I think BFGS is having a hard tim...
numpy.log first converts any single input into a numpya array. If you check the types numply.log returns a numpy.float64 while math.log returns a float. Which should be the same, but you are doing conversions of float and you might lose some of the precision if you need it that small. math.log is also far, far faster on scalar inputs than numpy.log. numpy.log should be used if you are working with numpy arrays. If you just need the log of a random number, use math.log
long horizon
@odd lion thanks for the info! I had no idea there were situations where math.log is faster.
The equation I'm working with is in the format of f(w_i) = ln(w) + c * ln(w) ... + some more, where i have to guess w_i that will get the function to a certain value
While not represented aa vectors, i do have to evaluate ~2 or 3 of these w values i.e. w1, w2, etc, and they are all dependent on each other. I'm considering just trying to raise the expression to exp(f(w)) to try and get the returned values to be more easily optimized
twilit pilot
odd lion
From my understanding:
scikit - does almost all major supervised/unsupervised M...
thanks a lot for the info man!!! 🙂
manic granite
https://colab.research.google.com/drive/1bGkgDBAmn7FUX_lws3OYF8Klw80ddMN7?usp=sharing#scrollTo=o1yWGPEz_07e How can i save the model here as .h5? i guess the model is not serializable cuz it is not a subclass of functional or sequential
velvet thorn
Hey! I'm writing an optimizer and getting weird issues with pythons Math.log(x) function using very small numbers. Are Numpy's log and the python math library log different? Should I pursue replacing my code with numpy if I believe I might be having precision errors in my optomized function?
For clarity, the function is currently being optimized with SciPy BFGS and has a ton of Log terms in it. The math in the function is done with pythons math.log (etc) methods
@long horizon they should be the same unless you’re explicitly specifying a different precision for numpy
austere swift
manic granite
https://colab.research.google.com/drive/1bGkgDBAmn7FUX_lws3OYF8Klw80ddMN7?usp=sh...
for keras models its just a simple model.save('file.h5')
velvet thorn
From my understanding:
scikit - does almost all major supervised/unsupervised ML algos but can only use the CPU. Best for educational or small project use
Tensorflow - Primarily for Neural Networks, but also linear regression, SVC, and boosted trees, allows for super fine control over how you build your algos and can be run on the GPU
Keras - API on top of Tensorflow to make it easier to program, but you sacrifice some performance then. In TF 2.0 it integrated keras so really TF lets you take the "easy" API way or the detailed work if you want.I have limited TF/Keras experience so someone please correct me if I'm wrong
@odd lion sklearn can be used in production too, depending on what you want to do
classical ML still has its place
also, Keras trades abstraction for flexibility/customisability more than performance, IMO
because all the computation is still done at C/C++ level
austere swift
imo dev time is more important than run time
if it takes you 5 hours to write a program that can run like 10% faster than a program that took you 2 hours to write, i'd rather take the 2 hour approach
velvet thorn
A is a function of x, w and b. Why is the cost function not also a function of x?
@pale mural I presume this is given constant x (i.e. assuming you have a fixed dataset)
if it takes you 5 hours to write a program that can run like 10% faster than a program that took you 2 hours to write, i'd rather take the 2 hour approach
@austere swift yeah, that’s why Keras
long horizon
@gm thats unfortunate, I'll notice that when the "correct" input value is quite small, BFGS will miss it more and more often.
velvet thorn
and it’s not even slower
austere swift
and anyways after its done training you can always optimize it for inference, which in production environments is more important
velvet thorn
@velvet thorn thats unfortunate, I'll notice that when the "correct" input value is quite small, BFGS will miss it more and more often.
@long horizon which numpy float are you using?
austere swift
since most of the time is gonna be spent using the model rather than training it
long horizon
@gm (sorry to @ you every time, I'm on mobile)
I haven't tried using numpy just yet, i was hoping to ask first as converting this to using numpy will take weeks- the function concerns statistical thermodynamics and is pages and pages of math :(
long horizon
I should test!
long horizon
My god
austere swift
velvet thorn
numpy supports float128
isnt that just simulated?
long horizon
@gm I'll test it and see if theres a difference, otherwise I'll need to look into manipulating the functions domain :) thanks!
austere swift
like using 2 64 bit or something
velvet thorn
it may or may not be more precise than np.float64
isnt that just simulated?
@austere swift nope
austere swift
because i don't think there are any 128 bit cpus
manic granite
austere swift
for keras models its just a simple `model.save('file.h5')`
are u reading me? XD
austere swift
ah
velvet thorn
so yeah YMMV
@velvet thorn I'll test it and see if theres a difference, otherwise I'll need to look into manipulating the functions domain 🙂 thanks!
@long horizon it’s sounds like you’re reaching the limit of doubles though
so instead of trying to increase the precision of your data type
long horizon
It's very frightening
velvet thorn
I would look into modifying your algorithm to avoid numerical issues
long horizon
That's... Yeag
velvet thorn
which is probz what you were thinking anyway
long horizon
I really am not looking forward to it, but i was desperate haha
Ln(0) is bad, so I' considered exponentiating it all
Covering the domain to all real numbers instead, and also making smaller numbers less sensitive
velvet thorn
yeah
I’m not particularly experienced in that kind of thing so I won’t make any specific recommendations
long horizon
But that's probably 2 weeks of just math and another month of my terribly implementing it
velvet thorn
but I think the principle is sound
long horizon
Hey, I appreciate your help regardless!
I'll check back in to let you know what happens!
velvet thorn
sure, atb!
austere swift
@velvet thorn just a random question, how long have you been in the data science field?
manic granite
it is just a reshape issue
velvet thorn
@velvet thorn just a random question, how long have you been in the data science field?
@austere swift hm
haven’t done DS for a year+?
but a year before that or so
austere swift
Ah okay
I'm more into the deep learning side of things than general data science, and i've been doing that for about 2 years now, but i still do general data science sometimes
although not as much as DL
velvet thorn
yeah I’d like to go back to DL someday
maybe take a Master’s
but right now I’m working more as a SWE (day job + startup)
DL has come really far recently though
it’s great to see
austere swift
Yeah it's really interesting
velvet thorn
particularly in CV and NLP (two of my interests)
austere swift
I'm starting to experiment a bit with PQCs as well those are pretty new and interesting
velvet thorn
some of the things we can do or start to do now are mindblowing
austere swift
although i haven't really found anything that it actually makes that much of a difference with
velvet thorn
I had to Google that
sounds p cool
do they have production applications yet?
or are they still an experimental thing
austere swift
Just in free time, i'm still a high schooler I'm not old enough to get any big jobs like that yet
I'm in 10th grade
velvet thorn
oh wow it’s great to start young :’)
how old is 10th grade?
we don’t have that here
austere swift
I'm 15
austere swift
10th grade is usually 15-16, but I have a summer bday so i'm always on the younger side
velvet thorn
...but when I was 15 Tensorflow wasn’t even out yet
ah, yeah, your school year doesn’t start in January?
truly different systems
austere swift
Mine starts late august and ends beginning of june
velvet thorn
you could probably statt freelancing if you had a mind to though TBH
ML/DL talent is always in short supply
austere swift
I tried but i don't really get gigs
velvet thorn
and it’s nice to get experience working on actual projects
I tried but i don't really get gigs
@austere swift online or IRL?
austere swift
online
austere swift
and then fiverr removed my gigs cus they needed to verify my identity which i can't since i don't have an ID
austere swift
I'm still experimenting with the PQCs, which are pretty interesting, and i'm also currently working on a model for classifying respiratory diseases from chest x rays
velvet thorn
oh so CV?
austere swift
yeah
velvet thorn
that’s a common problem with a lot of value I think
austere swift
I've done a little bit of NLP but mostly CV
velvet thorn
not just Xrays, but CV in the medical field in general
I like medtech actually
not where my path is taking me but I wouldn’t mind doing some of that
austere swift
velvet thorn
that’s a common problem with a lot of value I think
yeah the difficult part is i'm trying to get this to be a multilabel multiclass classifier, but 15 classes is very very difficult
i'm training it on the NIH chestxray14 dataset
velvet thorn
yeah the difficult part is i'm trying to get this to be a multilabel multiclass classifier, but 15 classes is very very difficult
@austere swift what do you understand by “multilabel” vs “multilabel multiclass”
austere swift
idek why i said multiclass lol, yeah its just multilabel
multiclass just means it has multiple classes but can only have one class as the output, but multilabel has multiple classes but can have multiple classes as outputs
unless my understanding of it is wrong
velvet thorn
austere swift
multiclass just means it has multiple classes but can only have one class as the...
in the more common case, yes
though there is also a meaning of "2 classes but the output can be 0, 1, or 2"...though that is less frequently seen
shrugs doesn't really matter though I guess
long horizon
manic granite
_it is just a reshape issue_
Its always a reshaping issue
austere swift
well for this case theres 15 classes, 14 being diseases and 1 being "no finding"
long horizon
no exceptions
austere swift
so if there were 0 diseases, it would just fall under the "no finding" class
austere swift
anyways if you guys have any ideas on how a 15 year old can freelance in ML/DL/DS let me know lol
 velvet thorn
anyways if you guys have any ideas on how a 15 year old can freelance in ML/DL/DS let me know lol
@austere swift would be difficult tbh because of no ID
you could try IRL but not sure how people would judge you because of age
do you have a portfolio
well for this case theres 15 classes, 14 being diseases and 1 being "no finding"
@austere swift you could try a stacked model
for disease vs no disease first
austere swift
I mean i have a resume but thats about it
velvet thorn
I mean i have a resume but thats about it
@austere swift like a GitHub to show past work
might help
austere swift
velvet thorn
> I mean i have a resume but thats about it
<@494466018245345282> like a GitHub...
oh yeah i have a github
velvet thorn
with projects?
austere swift
i keep most of my work in private repos
velvet thorn
that are easily consumed by a layperson
austere swift
but i could unprivate them anyways
austere swift
yeah most are just code lol
i could start making other projects that are more 'consumable'
velvet thorn
if you wanna do freelancing
you need to impress with things that randos can appreciate
because a lot of the time you won’t be dealing only with devs
and even then
consuming code takes time
austere swift
Okay, thanks
 graceful perch
hi
I want to learn more about data science and data structure, do you know of any place or book where you have all the topics, or the knowledge base on these subjects?
austere swift
Theres some resources in pinned messages
odd lion
To ask for myself, what are some good ways to get started with freelancing?
graceful perch
@austere swift Where?
austere swift
graceful perch
<@!494466018245345282> Where?
pinned messages in this channel
austere swift
odd lion
To ask for myself, what are some good ways to get started with freelancing?
that would be better asked in #career-advice, unless its specifically relating to data science
odd lion
I am specifically referring to data science/ML freelancing but I can ask there
 signal trench
Guys, as someone starting to learn data science, coming from systems administration, is there any good resource that I can learn from.
I have been learning the classification and clustering algorithms few days back, wondering where to go next.
 velvet sentinel
How can I plot a 3d graph in python
My function is
sinxsiny
on a given range of x and y
velvet thorn
velvet sentinel
How can I plot a 3d graph in python
My function is
sinxsiny
on a given range of...
look into mplot3d
 hollow lion
Hi guys, I am studying on 3 freecodecamp.org certificate problems. I search someone to study on these problems on skype together: https://www.freecodecamp.org/learn/machine-learning-with-python/machine-learning-with-python-projects/book-recommendation-engine-using-knn https://www.freecodecamp.org/learn/machine-learning-with-python/machine-learning-with-python-projects/linear-regression-health-costs-calculator https://www.freecodecamp.org/learn/machine-learning-with-python/machine-learning-with-python-projects/neural-network-sms-text-classifier
 sacred tree
Kotlin users?
austere swift
Ok so i'm confused. I'm doing this CV multi label deep learning project, and I originally was using MultiLabelMarginLoss as the loss function for the model. I then tested out using MSE as a loss function and it did better, but I kept the multilabelmarginloss there just to see how it behaved. Anyways, the part I'm confused with is originally i had these images in the original scale (0-255) but I wanted to see if there was a big difference if i rescaled them to 0-1. When it was 0-255, the MSE went down normally and the multilabelmarginloss still also went down normally, but when i rescaled it to 0-1 the MSE still kept about the same pattern, but the multilabelmarginloss went up
I mean the MSE is mainly what i'm focusing on as a metric anyways, but i'm confused as to why it went up
velvet thorn
austere swift
Ok so i'm confused. I'm doing this CV multi label deep learning project, and I o...
huh.
no nondeterminism?
austere swift
nope
its just a standard densenet201 model
but i changed the output and input to match my classes and inputs
velvet thorn
yeah...
velvet thorn
austere swift
oh lol, yeah theres a shuffle
fix the seed
then see if it still happens
austere swift
Okay
lapis sequoia
hi, i want to train a model to recognize bird species. i want to use it for my academic project to build a web app. currently i am using teachable machine with a dataset i found on kaggle(https://www.kaggle.com/gpiosenka/100-bird-species) to give me predictions but the probability for non bird images are also very high (90%+). there is no way for me to measure the accuracy % on the test set or valid set either. so i need help with 2 things i need to improve the accuracy and then properly identify if the image doesn't belong to any of the classes (i.e, not a bird). what is the best way to do it?

Train a computer to recognize your own images, sounds, & poses.
A fast, easy way to create machine learning models for your sites, apps, and more – no expertise or coding required.
austere swift
velvet thorn
fix the seed
so fix the seed and retrain with the scaled values?
velvet thorn
ye
 light warren
hey could someone help, i have dataframe and i want to make a new df with only 2 of the columns, i tried using the following code https://gyazo.com/d1975b24db0d2e46eb21d98bf524362a

 red briar
do you only need to get the 2 columns? no computation or changes needed?
if yes try this
heart_rate= df [['heartrate','ActivityID']]
light warren
thanks, and if i want to filter am activity, eg activityid 1, do i change the code to activtyid =1?
 forest moth
Hi
hard hound
Hello
forest moth
I know that I am being silly, But can anyone tell me what is Data science?
hard hound
Its just using large data for a useful purpose.
forest moth
So what is the use ?
hard hound
to find patterns ,make predictions ,visualize
forest moth
oh nice
hard hound
its just statistics with computer science
forest moth
Ah thanks buddy!
hard hound
NO problem mate
signal trench
light warren
thanks, and if i want to filter am activity, eg activityid 1, do i change the co...
This should work for filter.
Df_new = Df.filter([col1, col2])
 raw shell
Hello guys, I wanted to ask what could be a good direction to take to learn at least the basics of Machine Learning (courses or books) after I get a really good grasp of Python? any content that goes hand in hand with Python and ML for beginners?
austere swift
@velvet thorn yeah that fixed it, but i still don't know why that would cause it to go up
odd lion
signal trench
I have been learning the classification and clustering algorithms few days back,...
How deep are you trying to learn? Classification and Clustering to learn are going to take more than a few days. Have you tried implementing them, or using a package like scikit, on a reasonably complex dataset?
odd lion
raw shell
Hello guys, I wanted to ask what could be a good direction to take to learn at l...
There's a good number of suggestions in the /r/LearnMachineLearning wiki: https://www.reddit.com/r/learnmachinelearning/wiki/resource
raw shell
odd lion
There's a good number of suggestions in the /r/LearnMachineLearning wiki: https:...
Thank you 🙏
manic granite
Why would someone define custome layers on tensorflow? Like, doing that, model wont be serializable anymore
red briar
light warren
thanks, and if i want to filter am activity, eg activityid 1, do i change the co...
df2 = df.loc[(df['ActivityID'] == 1)]
if columns is string i use this one
df2=df[df[col].str.contains('filter')]
 topaz topaz
Should I take high school stats before I even show my face in this channel :^)
raw shell
I mean you should try the basics first I guess haha, I don't know anything and still didn't get to linear algebra in school and it's hard but worth it to atleast learn or try ya know
topaz topaz
I started at pre alegebra again which is tbh very easy for me, but a good refresher. Thought about taking high school stats next.
 proud iron
Guys, how do I know if a dataset is big enough so that the conclusions you extract from it are common case and not a bunch of exceptions? (provided that it has been collected every time there was a signal)
 tiny flax
can I use machine learning to pinpoint my location (using ip address)?
proud iron
@tiny flax what do you want to pinpoint a location for?
tiny flax
finding nearby hospitals in my app
proud iron
There might be easier solutions than machine learning if you are looking for results.
tiny flax
There is one using using google's api but that's paid
If you know something, i'd love to know
proud iron
Well, provides you don't have hundreds of hospitals around you can collect the coordinates from Google map's URL, use those coordinates from a ".JSON" file.
@tiny flax you can also take it a step further and automate the collection of locations.
Google even has documentation oh how the Maps URLs are built: https://developers.google.com/maps/documentation/urls/get-started

Google Developers
Maps URLs provide a universal URL scheme to launch Google Maps from any platform.
tiny flax
Thanks a ton, man.
proud iron
@tiny flax I am glad to help. Now that this is answered I will put up my question again:
How do I know if a dataset is big enough so that the conclusions you extract from it are common case and not a bunch of exceptions? (provided that it has been collected every time there was a signal)
 barren ginkgo
Hey folks! Apologies if I'm asking questions that are answered elsewhere, but I'm a professional web developer who's decided to pick up Python on the weekends. Seems like a great language! I'm just initially poking around the discord to say hi and get my bearings — is this channel at all for finding learning resources, or should I direct those questions elsewhere?
tiny flax
proud iron
<@667698491237072906> I am glad to help. Now that this is answered I will put up...
I am kinda new to this but I think if your dataset has 10 exceptions in 10000 rows, you have 0.1% chance of landing that exception and 99.9% chance that its not a exception. Its just your luck I guess, coz I don't think it can ever be zero
tiny flax
barren ginkgo
Hey folks! Apologies if I'm asking questions that are answered elsewhere, but I'...
depends what resources
eitherways check out !resources
!resources
arctic wedgeBOT
Resources
The Resources page on our website contains a list of hand-selected learning resources that we regularly recommend to both beginners and experts.
https://pythondiscord.com/pages/resources
barren ginkgo
tiny flax
depends what resources
Thank you!
manic granite
Why would someone define custome layers on tensorflow? Like, doing that, model wont be serializable anymore
proud iron
@barren ginkgo FreeCodeCamp is a very good resource, recently they rolled out a Python course with all the hot topics (machine learning, working with big data and so on) as follow ups. https://www.freecodecamp.org/learn/
Learn to code. Build projects. Earn certifications.Since 2015, 40,000 graduates have gotten jobs at tech companies including Google, Apple, Amazon, and Microsoft.
barren ginkgo
proud iron
<@341006340958846977> FreeCodeCamp is a very good resource, recently they rolled...
Thanks! I just ordered a bunch of the recommended books and love free code camp. I'll definitely check this out.
 upper lily
I'm trying to create a program that checks to see how related two songs or artists are. The metrics I have to use are: Euclidean, Cosine, Manhattan, Jaccard and the Pearson correlation coefficient. I'm struggling to figure out what characteristics to use from the dataset I was provided with (screenshot below).
 late shell
hello everyone, I just started to learn ML, a pure noob, and was having some issues with OneHotEncoder class in scikit.preprocessing. I'm still learning about this stuff and wanted to try on a small dataset. my dataset called features has a categorical variable Country and I wanted to use onehotencoding for that. my dataset has 3 columns, 1 categorical (which has 3 distinct values) & 2 numerical, so after onehotencoding, I must end up with 5 columns, instead I get a 10x23 sparse matrix. Can someone explain in this to me please
Shouldn't I get a 5x10 sparse matrix?
maybe the encoder is encoding the Age & Salary columns as well, hence 10+10+3 = 23
something like that, idk I'm a noob & sorry if i said something silly
proud iron
@upper lily it is worth defining what your data means especially the more obscure labels like "danceability", "popularity". What do each of those mean? How was the data collected? How does it relate to your goal?
manic granite
Why would someone define custome layers on tensorflow? Like, doing that, model wont be serializable anymore
shadow quiver
late shell
hello everyone, I just started to learn ML, a pure noob, and was having some iss...
You are fit_transforming your encoder with the whole dataset. So the encoder interprets every unique value in age, salary as an encodable variable too. You should do it only with the country column: transformed = onehot.fit_transform(features['country']). Then you can use features.concat(transformed) to add them to the dataframe. Don't forget to delete the original column Country though.
late shell
I just read an article, where the guy passes the whole dataset and the encoder figures it out itself, which one to hotencode
but I'll try once again, as u said
shadow quiver
late shell
I just read an article, where the guy passes the whole dataset and the encoder f...
I think it's pd.get_dummies or something, I don't remember exactly. Not OneHotEncoder from scikit-learn
late shell
this is the snippet from the article
although he has converted the categorical variables to integers first, and then did the onehotencoding, I tried it too, didnt work for me, same 10x23 sparse matrix
shadow quiver
late shell
this is the snippet from the article
As you see it's passing categorical_features=[0] to the encoder, so it tells the encoder which columns are categorical. It does not detect it automatically
upper lily
@proud iron The data in question was collected using Spotify's web api and has about 160k songs in it. Each one of those labels is a property that is related to each specified song. Each of these properties are scored between 0 and 1 with the exceptions of things like duration and release date. I wasn't given any definitions for this data but the closer to 1 these metrics are the more that property is present for that song. The end goal of this project is to recommend the top 5 similar songs and artists to a selected song.
shadow quiver
So if you do it as onehot = OneHotEncoder(categorical_features=[0]), it would work
late shell
I tried that too, the version of scikit I'm using now takes categories as an argument, instead of categorical_features, I tried passing that too and I get this error :
Shape mismatch: if categories is an array, it has to be of shape (n_features,).
shadow quiver
I see, then I need to dive a little deeper on this one. I understood the error, but I need to get my hands dirty to resolve it
late shell
no problem if you dont have time, thanks for your help 🙌
 eager grotto
why does google's dev page behave like this? i've seen this hapenning with android dev too.. is it my system that is causing this?
 weak kelp
has anyone run into an issue using PyTorch and the Dataset object where it seems like it's not passing the index properly into the dataloader? I'm throwing a KeyError at enumerate(dataloader) with a different key each time (because of shuffle), so it seems like the entire index isn't getting passed through.
my Dataset object:
    def __init__(self, samples):
        self.data = samples
        self.pixel_col = self.data.image
        self.image_pixels = []
        for i in tqdm(range(len(self.data))):
            img = self.pixel_col.loc[i]
            self.image_pixels.append(img)
        self.images = np.array(self.image_pixels, dtype='float32')
    def __len__(self):
        return len(self.images)

    def __getitem__(self, index):
        # reshape the images into their original 96x96 dimensions
        image = self.images[index]
        # transpose for getting the channel size to index 0
        image = np.transpose(image, (2, 0, 1))
        # get the keypoints
        keypoints = []
        for col in self.data.columns:
            if 'keypoint' in col:
                keypoints.append(self.data[index][col])
        keypoints = np.array(keypoints, dtype='float32')
        # reshape the keypoints
        keypoints = keypoints.reshape(-1, 2)
        return {
            'image': torch.tensor(image, dtype=torch.float),
            'keypoints': torch.tensor(keypoints, dtype=torch.float)
}```trying to follow https://debuggercafe.com/getting-started-with-facial-keypoint-detection-using-pytorch/ with a custom dataset
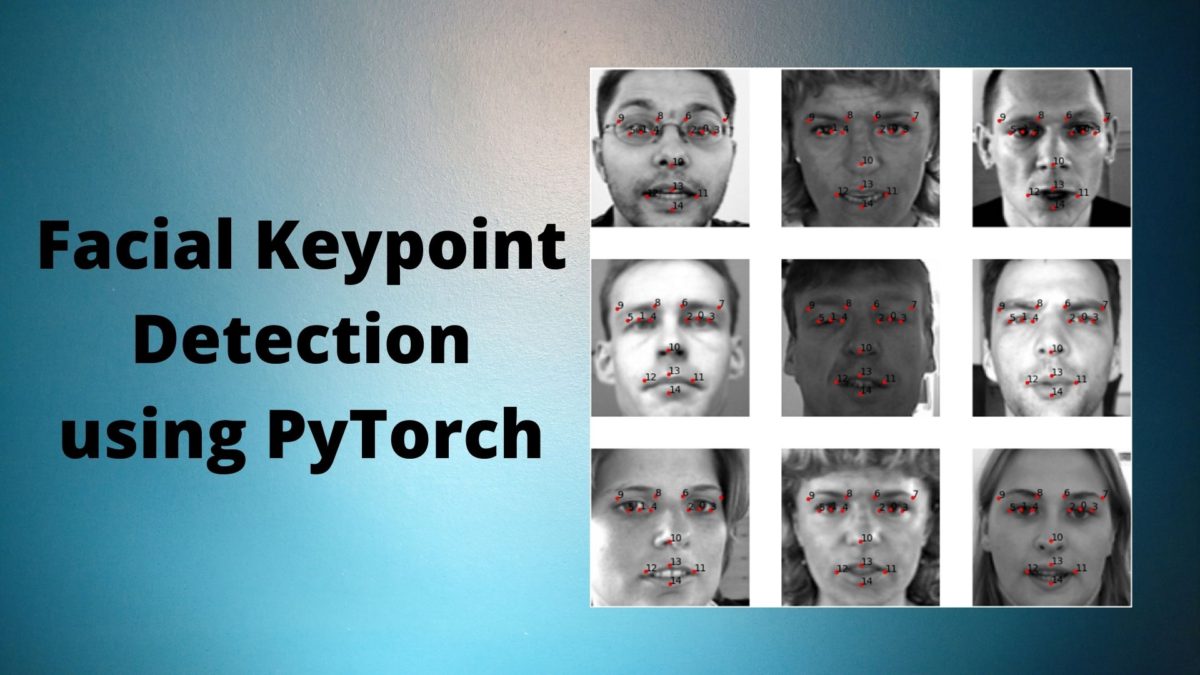
Get to learn about facial keypoint detection using deep learning and PyTorch. Use deep neural nets to detect facial landmarks.
manic granite
Why would someone define custome layers on tensorflow? Like, doing that, model wont be serializable anymore
velvet thorn
@velvet thorn yeah that fixed it, but i still don't know why that would cause it to go up
@austere swift could have been a weird split that caused divergence
@late shell
you can’t do it that way anymore
you're probably thinking you can pass an argument to OneHotEncoder that will let you control which columns are affected
but you can't
sometime a while back all sklearn Transformers were basically changed to affect all columns in the dataset by default
to do what you want, you need to wrap the OneHotEncoder in a ColumnTransformer, which will specifically select a subset of the dataset's columns
you can check out the documentation; there are examples.
I will also say that if you don't need to build a pipeline, pd.get_dummies will be a much simpler solution
velvet thorn
proud iron
<@667698491237072906> I am glad to help. Now that this is answered I will put up...
it really depends.
on what kind of ML/DL you're doing
on your data gathering methodology
and even on domain knowledge.
instead of "big enough", you should focus on "sufficient variance"
e.g. if you want to distinguish between dogs and cats, if you only have 10 cat pictures, it won't matter whether you have 10k or 100k dog pictures
and if, of those 100k, 99k are of the same dog in different poses...well...
manic granite
how can i serialize a model with custom layer to be able to save it as h5?
i read i need to implement get_config but idk how to implement that
here is an example of a custom layer
basically it is a block
def REBNCONV(x, out_ch=3, dirate=1):
# x = ZeroPadding2D((1*dirate,1*dirate))(x)
x = Conv2D(out_ch, 3, padding='same', dilation_rate=1 * dirate)(x)
x = BatchNormalization(axis=3)(x)
x = Activation('relu')(x)
return x``` mortal trout
has anybody tried spam analysis using unsupervised learning ?
velvet thorn
mortal trout
has anybody tried spam analysis using unsupervised learning ?
do you have a specific question in mind?
signal trench
odd lion
There's a good number of suggestions in the /r/LearnMachineLearning wiki: https:...
Thanks dude. I would my experience with ml is very basic. I'm about to start implementing the concepts today..
 past flare
Hlo plz help guys
Interoperability is seen in -
a. vendors
b. producers
c. consumers
d. services
MCQ question
Cloud computing questions
mortal trout
@past flare maybe services
@velvet thorn no i just want to know how wld i do spam analysis using unsupervised learning
velvet thorn
mortal trout
<@!171929073063297024> no i just want to know how wld i do spam analysis using u...
ah, okay
what are your goals?
what kind of unsupervised learning?
I'm assuming you mean of text (probably emails)?
velvet sentinel
velvet thorn
look into `mplot3d`
I did search, but I am unable to get something useful out of that
velvet thorn
velvet sentinel
I did search, but I am unable to get something useful out of that
what problems are you facing specifically
velvet sentinel
velvet thorn
what problems are you facing specifically
I am getting this error:
ModuleNotFoundError: No module named 'ranges'
Should I paste my code here?
velvet thorn
ye
velvet sentinel
from mpl_toolkits import mplot3d
import math
import ranges
from ranges import Range
pi = math.pi
import numpy as np
import matplotlib.pyplot as plt
fig = plt.figure()
ax = plt.axes(projection='3d')
def f(x, y):
return (sin(x)*sin(y))
x = Range("[0, pi]")
y = Range("[0, pi]")
X, Y = np.meshgrid(x, y)
Z = f(X, Y)
fig = plt.figure()
ax = plt.axes(projection='3d')
ax.contour3D(X, Y, Z, 50, cmap='binary')
ax.set_xlabel('x')
ax.set_ylabel('y')
ax.set_zlabel('z');
past flare
mortal trout
<@!719114621814046750> maybe services
All 4 correct buddy
velvet thorn
@velvet sentinel ...what is ranges and why do you need it?
you can just use np.arange (or, in this case, np.linspace)
velvet sentinel
velvet thorn
<@!751137248530923671> ...what is `ranges` and why do you need it?
I want the function to take all continuos values from 0 to pi, I don't think np.linspace will do that
velvet thorn
velvet sentinel
I want the function to take all continuos values from 0 to pi, I don't think np....
why do you think so?
ultimately matplotlib will take an array of fixed size
a conceptual range of continuous values will be reduced to such an array
velvet sentinel
ohkk
velvet sentinel
velvet thorn
a conceptual range of continuous values will be reduced to such an array
num in linspace is default set at 50
As I want a continuos sequence, does it make sense to set num to some high value for a closer approximation or what else can I do
velvet thorn
velvet sentinel
num in linspace is default set at 50
As I want a continuos sequence, does it mak...
ye
you can increase
the number of values
 sage sun
Hi, I am new to this community
just started learning python a week ago
any tips for a newbie?
sage sun
yep
velvet thorn
sage sun
yep
what's your background like?
in particular...in programming, mathematics, and communication?
sage sun
i have masters in mathematics
velvet thorn
are you looking @ becoming a data scientist?
velvet thorn
sage sun
i have masters in mathematics
stats?
sage sun
velvet thorn
stats?
yes
velvet thorn
your linear algebra, discrete mathematics, etc. are fine?
sage sun
yep
arctic wedgeBOT
Resources
The Resources page on our website contains a list of hand-selected learning resources that we regularly recommend to both beginners and experts.
https://pythondiscord.com/pages/resources
sage sun
Thanks a lot
sage sun
sure, will do! 🙂
lapis sequoia
Anyone knows any books on Stock market prediction using Time Series with Python
sage sun
is spyder a good IDE option for data science?
and do I need to learn core programming as well?
velvet thorn
sage sun
and do I need to learn core programming as well?
what do you mean by core programming
sage sun
like web development and all?
I am actually clueless rn, as to how to start my journey!
so might ask dumb questions
austere swift
This doesnt really seem data science related so idk why you're asking here, and if you want help you'd need to give more information
like what do you expect it to do, what's actually happening, if there are any errors, etc
manic granite
solar umbra
can anyone help me fix this please 😭
u cant have things like
def __init__(a, b=0, c, d)
lapis sequoia
########################################
I'm trying to layer one string on an other, aligned to the right.
Here is an example:
LayerTop = 1234
Result = xxxx1234```
Another one:
```Base = 00000000
LayerTop = 0489374
Result = 00489374```
Is there a way to do this in Python (preferably in the least code / fastest?) main quest
i've been struggling a lot plotting my pandas dataframe filtered into charts with matplotlib, can someone point me to adequate resources about plotting?
i got an intermediate understanding of the python language and i'm developing an application which involves dataframes for the first time
google isn't being so helpful with my needs
velvet thorn
lapis sequoia
########################################
I'm trying to layer one string on an o...
...so the base string is always the same character?
lapis sequoia
yes
velvet thorn
!e print('1234'.rjust(8, 'x'))
arctic wedgeBOT
@velvet thorn :white_check_mark: Your eval job has completed with return code 0.
xxxx1234
adapt as necessary
lapis sequoia
😮
arctic wedgeBOT
You are not allowed to use that command here. Please use the #bot-commands channel instead.
lapis sequoia
@velvet thorn Thanks bro! Code works (pls check #bot-commands)
velvet thorn
you're welcome
main quest
main quest
i've been struggling a lot plotting my pandas dataframe filtered into charts wit...
can someone answer this?
 regal ember
main quest
can someone answer this?
regal ember
main quest
can someone answer this?
i can't my brain is dumb
odd lion
main quest
can someone answer this?
I've generally found the matplotlib tutorials to be pretty decent - https://matplotlib.org/tutorials/introductory/sample_plots.html For using pandas dataframe to plot it's usually as simple as plt.plot(df['col1']) and then adding whatever other extra commands you need. What kind of plots are you trying to make?
main quest
let's say i have a dataframe from this csv
i want:
- amount of values by date
- histograms that relate to value-amount of values
i have more but getting this will help me solve most of the issue
odd lion
When you say amount of values, you mean a count of each value by date? So for 1/1/ it'd be 2 for 5, 1.31 would be 1x 1, 1x 4, 2x5? Or a sum?
And for the histogram? Just an overall histogram or by date?
For the historgram, the overall one is just
df = pd.read_csv('sample-ratings.csv')
plt.hist(df['Value'])
plt.show()
You might want ot center the histogram labels, this stackoverflow does a good job of showing how: https://stackoverflow.com/questions/23246125/how-to-center-labels-in-histogram-plot
Stack Overflow
I have a numpy array results that looks like
[ 0. 2. 0. 0. 0. 0. 3. 0. 0. 0. 0. 0. 0. 0. 0. 2. 0. 0.
0. 0. 0. 1. 0. 0. 0. 0. 0. 0. 0. 1. 0. 0. 0. 0. 0. 0.
0....
I'll be honest most of my plotting knowledge comes from googling the plot I want "How to center histogram labels" and checking the first few answers
main quest
odd lion
When you say amount of values, you mean a count of each value by date? So for 1/...
A sum, like, the y axis showing the amount of rows grouped by date
For the rest, it seems a good, i was just searching the wrong terms. Thank you!
odd lion
main quest
A sum, like, the y axis showing the amount of rows grouped by date
Ah, that's less a plotting issue and more preprocessing you need to do. You'll want to group the values by the date and sum them. You will also need to convert the date column into a pandas datetime as otherwise it's text
You should get something like this. Give it a shot and feel free to follow up with more questions. I did rotate the x axis as if you don't it's rather ugly
main quest
Thank you very much
light warren
hi
could someone help me, can someone show me how to calculate the mean of a column in a df, https://gyazo.com/7dc1a94f05f8d3bb78d125c300ea1d61
 odd lion
df['col'].mean()
light warren
so like heart_rate_Activity1['heartrate'].mean()?
odd lion
Should work, try running the code
light warren
yeah it works, thanks
hollow scarab
I have a dataframe, and I want to create a new one-row dataframe that weights the 2. and 3. row of this dataframe
so basically 2.row x 0.4 + 3. row x 0.6
is this possible?
lapis sequoia
Any recommendations for Python ODE solvers other than the ones available in SciPy?
odd lion
hollow scarab
is this possible?
It's probably going to be easiest to transpose the dataframe, do the work on the now columns, and then you can retranspose it if you want it as a row. This kind of math works better on columns instead of rows.
hollow scarab
oh, so transpose, do the opeartion and then transpose back? @odd lion
odd lion
hollow scarab
oh, so transpose, do the opeartion and then transpose back? <@!20044541015267738...
Yup, I tried that on a simple dataframe and it worked fine. I wasn't sure how to multiply an entire row by a scalar but that's just df['col'] * 0.4 if you want to multiply a column
hollow scarab
that can work, thanks a lot!
I dont even need to create a new df, wanted to concatenate back to this df in the end
but if I do it this way that wont be needed
odd lion
Oh yeah, definitely not. Just make a new column to store the sum in
hollow scarab
yeah
ok nvm I have to creaste a new afetr all
because this weighted column needs to be a row
odd lion
hollow scarab
because this weighted column needs to be a row
Does this not work?
df = df.T
df[0] = df[0] * 0.4
df[1] = df[1] * 0.6
df['Total'] = df.sum(axis=1)
df = df.T
print(df)
topaz topaz
lol
proud iron
Trained a model on a data with 12 variables per row. How can I check if it is overfitting or does something else wrong?
topaz topaz
oops i thought i was in python general my bad
serene scaffold
I'm working on a string manipulation task where I need to do calculations with the indices of the first and last characters in a string. But sometimes the substring is non-contiguous and there are a few spans. So I'm not sure how to store that in a dataframe.
def validate_bratfile(ann: BratFile) -> pd.DataFrame:
    text = ann.ann_path.read_text()
    table = pd.DataFrame(
        [(e.tag, e.mention, e.spans[0][0], e.spans[0][1]) for e in ann.entities if len(e.spans) == 1],
        columns=['tag', 'mention', 'start', 'end']
    )
    match: pd.Series = table.apply(lambda x: x.mention == text[x.start:x.end])
    match.name = 'match'
    return pd.concat([table, match], axis=1)
It's easy when the string is contiguous though.
 slim fox
serene scaffold
```py
def validate_bratfile(ann: BratFile) -> pd.DataFrame:
text = ann.ann_p...
slim fox
serene scaffold
```py
def validate_bratfile(ann: BratFile) -> pd.DataFrame:
text = ann.ann_p...
you have an example? not sure I understand the story of non-contiguos and spans :
serene scaffold
slim fox
you have an example? not sure I understand the story of non-contiguos and spans ...
e.mention might be "the patient took 5mg of aspirin", but the actual instance of that in the text might be "the patient, after the doctor spent three hours running tests, took 5mg of aspirin". So in that case, e.spans would be [(a, b), (c, d)] for ints a, b, c, d.
"spans" in this case are the indices between which a given substring exists.
slim fox
serene scaffold
`e.mention` might be "the patient took 5mg of aspirin", but the actual instance ...
so your problem is this:
[(e.tag, e.mention, e.spans[0][0], e.spans[0][1]) for e in ann.entities if len(e.spans) == 1],
namely the case when length of e.spans is 2 and more?
serene scaffold
This is assuming of course that there's some benefit to using .apply
there's no way to avoid looping over ann.entities at least once. I could also do this step during that loop.
slim fox
serene scaffold
This is assuming of course that there's some benefit to using `.apply`
you mean if apply is efficient overall? if that's your doubt here is rather compherenisve article about apply
https://towardsdatascience.com/apply-function-to-pandas-dataframe-rows-76df74165ee4

Medium
How to profile performance and balance it with ease of use
serene scaffold
slim fox
so your problem is this:
```py
[(e.tag, e.mention, e.spans[0][0], e.spans[0][1]...
anyway, yes, I'm not sure how to handle cases where e.spans has a length of 2 or more.
slim fox
you need to store all of them in dataframe?
serene scaffold
slim fox
you need to store all of them in dataframe?
I'd like to
is there a way you can just store the Python list in the dataframe?
slim fox
unless you want to have a potenially very sparse df i see 2 options only: have column as list
or store string as 1 colmun and list of indices in other
if needed eventually you can also explode that into long df
@serene scaffold
or you can store in in exploded format setting up multiindex
depend on what you do after
 mellow vapor
i have an issue with tensorboard in google collab
normally it runs perfectly with all the graphs being displayed properly
but i want them to be shown with model names,so i added subfolders for each model
but now it doesn't show anything
#Log files location
def tensorBoardCallback(model_name):
  folder_name='{0} at {1}'.format(model_name,strftime('%H %M'))
  logdir=os.path.join('logs',folder_name)
  try:
    os.makedirs(logdir)
  except OSError as err:
    print(err)
  #TensorBoard Callback
  tensorBoard_callback=tf.keras.callbacks.TensorBoard(log_dir=logdir)
here is the callback function
#dividing training data into batches and feeding them again and again via epochs
epoch_count=150
batch_size=1000
model_1.fit(x_sample,
            y_sample,
            callbacks=tensorBoardCallback('Model_1'),
            batch_size=batch_size,
            epochs=epoch_count,
            verbose=0,
            validation_data=(xval,yval))
model_2.fit(x_sample,
            y_sample,
            callbacks=tensorBoardCallback('Model_2'),
            batch_size=batch_size,
            epochs=epoch_count,
            verbose=0,
            validation_data=(xval,yval))
%tensorboard --logdir logs
this creates empty folders with no event files and therefore no graphs
 safe tapir
slim fox
you mean if apply is efficient overall? if that's your doubt here is rather comp...
safe tapir
slim fox
you mean if apply is efficient overall? if that's your doubt here is rather comp...
Is there a benchmark of this vs. using the built-in pandas methods which are already written in highly optimized c?
slim fox
safe tapir
Is there a benchmark of this vs. using the built-in pandas methods which are alr...
which "this" and which "built-in"?
safe tapir
Your link has min numba, so numba.jit
vs. built-in methods in pandas min(), max(), std(), etc.
velvet thorn
@serene scaffold IMO that’s not a super good pandas task any more
how much data do you have?
you can still do it but it’d be a bit weird
the relational way to do this, I think, would be:
serene scaffold
velvet thorn
how much data do you have?
tens of thousands of instances
velvet thorn
wait
serene scaffold
(which I realize is far away from, say, millions)
velvet thorn
tag is the full text
?
or is mention the full text
and you want to generate the substring
from the spans
serene scaffold
velvet thorn
tag is the full text
e.tag is the class that e.mention belongs to. and e.mention exists between certain character indices (spans) in a larger string. The goal is to see if e.mention is in fact what exists in the document between those spans.
velvet thorn
so combining mention and spans gives you the string that you want?
or am I misunderstanding
serene scaffold
so the goal is at the very end, I can have df[~df.match] or something to get all the invalid instances.
serene scaffold
though it appears that you can have any Python object as an element in a dataframe
velvet thorn
so all the spans relate to the same document?
though it appears that you can have any Python object as an element in a dataframe
@serene scaffold you can
but it is discouraged
and ultimately
the goal is to see if each mention is in the document or not, having regard to the spans it’s associated with?
serene scaffold
velvet thorn
but it is discouraged
I assume there are certain performance penalties if your dataframe has data that can't be divorced from Python (something that can only be a PyObject)
velvet thorn
I assume there are certain performance penalties if your dataframe has data that can't be divorced from Python (something that can only be a
PyObject)
@serene scaffold yes, but also conceptual concerns (relational model)
although tbf pandas is not totally relational
serene scaffold
velvet thorn
the goal is to see if each mention is in the document or not, having regard to t...
the goal isn't to see if the mention is in the document per se, but to see if the character spans are correct for a given mention for which the character spans are already assigned.
velvet thorn
ah
serene scaffold
one of the datasets I work with has a few inaccuracies (like the spans are one character off in a few places)
velvet thorn
okay, so more like
use the spans to index the document
and see if the string produced
is equal to the mention?
lapis sequoia
Is anyone here able to be hired to do some programming for me on an hourly rate basis
velvet thorn
I would do it this way
Is anyone here able to be hired to do some programming for me on an hourly rate basis
@lapis sequoia paid recruitment is against rules
serene scaffold
lapis sequoia
Is anyone here able to be hired to do some programming for me on an hourly rate ...
You can't solicit paid opportunities in this community; refer to our #rules
lapis sequoia
Gotcha apologies
velvet thorn
- it’s probably gonna be more expensive than you’re willing to pay
sorry
@serene scaffold so I would have an ID associated with each mention
and a DF of mention_id, span
groupby mention_id, index document with spans to produce a DF of mention_id, document_substring
compare that to DF of mention_id, mention
serene scaffold
related question
velvet thorn
groupby mention_id, index document with spans to produce a DF of mention_id, document_substring
@velvet thorn groupby into string join
serene scaffold
can the index be a python object, and if so, does it have to be hashable?
velvet thorn
my guess is yes and yes
but honestly I’ve never worked with that
salt rock lamp might have some ideas
I believe they have
serene scaffold
salt rock lamp is pretty great
I'm making a library for parsing certain file types, and in those files, each data point has a unique ID. But part of the point of my library is that it's agnostic to what the IDs are in those files.
so if one data point refers to another, it doesn't give you some key whereby you can find the object you were looking for. It just has a reference to it as one of its attributes.
serene scaffold
velvet thorn
so that would be the index?
probably the name of the file it came from and the object itself (which is hashable)
I'll try it and let you know how it goes.
mortal trout
@velvet thorn yes its emails or any short one liner of text or any review
 candid salmon
if i have a function that takes the first k elements of a list x, in reverse order, appended to the rest of x, is the recurrence T(n+1) = T(n) + O(1)=
?
for the worst-case
 ripe forge
What's recurrence? From your symbols it seems like you're trying to ask about time complexity.
But I'm not familiar with the T symbol or that term
candid salmon
T is just the function, yes i mean the time complexity
But I figured it out now
half l =
let h [] r l = l == r
h [] (:r) l = l == r
h (::s) (x:xs) l = h s xs (x:l)
in
h l l []
Can anyone decipher what this function does?
It's haskell code
 warm seal
Hey all, I submitted a question on stack but didn't get a reply there, hoping someone here knows. I'm an RA and by Prof tasked me with getting an answer for this
Stack Overflow
The script has two losses, the squared loss L_a = (y-F(x))^2 and the same loss but with a 0.5 factor: L_b = 0.5*(y-F(x))^2. Using L_a gets me trees with one splits (even if max_split is set to >...
solar umbra
any freelancer here?
 winged jasper
Hey guys, I am working on developing a chatbot and currently trying to choose the tech stack. My customer proposed DialogFlow but it won't suppport our language. I have found some python libraries (huggingface transformers) and I am not sure what the best way to integrate this with Dialogflow would be. I was thinking of creating a REST API (Either Flask or Django) for this. Anybody have any useful thoughts? Thanks a lot!
lapis sequoia
winged jasper
Hey guys, I am working on developing a chatbot and currently trying to choose th...
Hey I have not worked that much with bots, but I integrated a simple chatbot in one of my websites. I found AWS Lex to be more easier than DialogFlow, the concept behind is the same, you can send your data to a AWS lambda for further processing. They have simplified the process so much. Here's a link https://aws.amazon.com/lex/

Amazon Web Services, Inc.
Design, build, and deploy chatbots with Amazon Lex. Lex is an AI service for building conversational interfaces into any application using voice and text. Powered by the same ML technologies as Amazon Alexa.
winged jasper
Hey @lapis sequoia thanks a lot for the answer, you are the first one to give an answer so far haha, will check Amazon Lex, mind if I also PM you for some more details if possible?
lapis sequoia
Haha, I don't mind. @winged jasper I would try my best!
 silver vortex
hey guys, im wondering if anyone can hint me in the right direction. Im trying to grab daily Wordpress posts from a wordpress I do not own to post into a discord channel. Without the ownership I cant do webhooks etc. Any ideas? Thanks!
winged jasper
@silver vortex I guess a webcrawler could do that
either python or UiPath (really easy and fast but i dont know how useful it is in this case)
 silver vortex
ty, ill check it out
 severe girder
can anyone help me, i have two samples which their len is equal, i want to compare these value's mean using t -test in python , how can i do
mortal trout
@severe girder what samples ?
mortal trout
use scipy.stats.ttest_ind()
severe girder
import numpy as np
from scipy.stats import ttest_ind
from math import sqrt
from scipy import stats
from scipy.stats import t
def independent_ttest(data1, data2, alpha):
# calculate means
mean1, mean2 = df_3['lung'].mean(), df_3['kidney'].mean()
# calculate standard errors
se1, se2 = stats.sem(data1), stats.sem(data2)
# standard error on the difference between the samples
sed = sqrt(se12.0 + se22.0)
# calculate the t statistic
t_stat = (mean1 - mean2) / sed
# degrees of freedom
df = len(data1) + len(data2) - 2
# calculate the critical value
cv = t.ppf(1.0 - alpha, df)
# calculate the p-value
p = (1.0 - t.cdf(abs(t_stat), df)) * 2.0
# return everything
return t_stat, df, cv, p
independent_ttest(df_3['lung'], df_3['kidney'], 0.5)
i do this it is wrong or not i dont know
i need to just compare means actually
mortal trout

Statistics How To
Independent samples t test; how to run an independent samples t test with technology or by hand. Help videos, online forum, calculators.
severe girder

Perhaps one of the most widely used statistical hypothesis tests is the Student’s t test. Because you may use this test yourself someday, it is important to have a deep understanding of how the test works. As a developer, this understanding is best achieved by implementing the hypothesis test yourself from scratch. In this tutorial, […]
i looked in there
wite code which i sent but dont know true or not
(4.113101033766275, 336, 1.649401259870356, 4.9139184068680564e-05)
i am taking this output
lapis sequoia
Is this correctly referring to a 9-day exponential moving average on the closed stock price? data['EMA_9'] = data['Close'].ewm(9).mean().shift().
lapis sequoia
I need some help with using SciPy ODE solvers. If anyone has experience, please see the #help-bread channel.
 uneven wren
could someone help me with random.choice() not working?
mellow vapor
Unable to use tensorflow.placeholder()
Tried by using tf.compat.v1.placeholder()
Also tried tf.compat.v1.disable_eager_execution()
Also tried downgrading to v1.15
Still getting the same attribute error
 frozen moth
fellow discordians , who can help me figure out how to connect two points on a scatter plot with a horizontal line?
# Libraries
import numpy as np
import matplotlib.pyplot as plt

# DATA
male = [0.2, 0.3, 0.5]
female = [0.1, 0.7, 0.4]
dept = ['Sales', 'Marketing', 'HR']

# Plot
ax.scatter(x = male, y = dept, color = 'b')
ax.scatter(x = female, y = dept, color = 'r')

plt.show()
In this case what i want is for each department a line connecting the female and male points on the graph.
Ideally I want the line's color to match the gender which has the highest value for that particular department.
(e.g. marketing in the example below would have a blue line and sales a red one)
light warren
hi, could someone show me how to work out the lower and upper quartile in python pandas, https://gyazo.com/cfc935dc94336e0efc519427c15cae9d

 woeful hamlet
If os.listdir(path) returns a list of subfolders, how can i make an histogram with all the files for each subfolder on Y axe and the subfolders on X axe?
did i explain?
 silver venture
frozen moth
fellow discordians , who can help me figure out how to connect two points on a s...
silver venture
frozen moth
fellow discordians , who can help me figure out how to connect two points on a s...
Hey, not an expert, so, sorry if I'm giving a wrong answer but, have you considered using a third axis and using plot instead of scatter? (With dept on x axis)
frozen moth
silver venture
Hey, not an expert, so, sorry if I'm giving a wrong answer but, have you conside...
hmm gonna try this, thanks bud
silver venture
frozen moth
hmm gonna try this, thanks bud
np! let me know the result! 😉
 high lion
woeful hamlet
If os.listdir(path) returns a list of subfolders, how can i make an histogram wi...
high lion
woeful hamlet
If os.listdir(path) returns a list of subfolders, how can i make an histogram wi...
you can try
os.walk()
https://docs.python.org/3/library/os.html?highlight=os#module-os
woeful hamlet
no but
the problem is seaborn
it displays something ugly
what matplot displays is how many numbers are repeated
i wanna draw each number as a separated value
@high lion
high lion
I never worked with seaborn before, but if you give the Folders an index and name them with a key=value it should work.
high lion
Ok. My attempt would be. Plotting two ranges for x, y with the length of the list (from os.listdir). Then labeling the points by their index in that list.
I hope I get the point. It's pretty hard with this few information from your site.
high lion
Lol glad that I could help -.-
woeful hamlet
Have anyone ever used CAM for displaying activation maps of a neural network?
If so, could u assist me?
 shell wing
has anyone used Folium and TimestampedGeoJson ?
 dry zodiac
 atomic fox
something that can work with excels or csv's?
atomic fox
something that can work with excels or csv's?
Have you tried using pandas?
 cerulean spindle
In TensorFlow, do GPUs only decrease training time? Or does it have a greater effect?
velvet thorn
In TensorFlow, do GPUs only decrease training time? Or does it have a greater effect?
@cerulean spindle yes
to the first one
WELL
precision might make a difference
but not a big one
assuming you’re using half or mixed precision with GPUs
cerulean spindle
Yeah I don't have a good GPU and I was just wondering what that could mean
for training
 sharp raft
does anyone know anything about artificial intelligence?
 neon oracle
Geez, I'm struggling with matplotlib widgets in a notebook. Do widgets just silently fail instead of throwing exceptions when there is a bad command?
It is painful not know how to debug this and running code outside the notebook will probably run differently than in notebook
velvet thorn
cerulean spindle
Yeah I don't have a good GPU and I was just wondering what that could mean
well...
only newer GPUs support half/mixed precision
so you probz don't need to worry about that
lapis sequoia

 undone trout
hey there everyone good evening from india
woeful hamlet
Have anyone ever used CAM for displaying activation maps of a neural network?
If so, could u assist me?