#data-science-and-ml
1 messages · Page 260 of 1
 cedar sky
I get a good accuracy in the training data
But the text generated is random
I use character wise text generation
ROMEO: hNk.HWg$zjq?CxlG$GWbjeOu!Byou$-svgZkf;xY bjgcT$i3ypDUwOgnWdmCVpkLHBpE3f:GCQWW
zE
P
W:Y.C vYzGzESOz,'
This is what it generates when I feed in "ROMEO: "
Epoch 1/100
139/139 [==============================] - 130s 938ms/step - loss: 1.1619 - accuracy: 0.6327
I am using tensorflow
 mild topaz
Traceback (most recent call last):
File "image_classification.py", line 185, in <module>
axs[0][1].imshow(x_batch[i].reshape(imageDimensions[0], imageDimensions[1]))
IndexError: index 14 is out of bounds for axis 0 with size 14``` glossy vale
ix is not working.
mild topaz
my training process @hasty grail plz check @sage idol @lapis sequoia
 hasty grail
I'm busy rn, maybe someone else can help
mild topaz
ok np . plz ping me when u back @hasty grail @sage idol @lapis sequoia 🙂
 arctic wedgeBOT
Hey @cedar sky!
Uh-oh! It looks like your message got zapped by our spam filter. We currently don't allow .txt attachments, so here are some tips to help you travel safely:
• If you attempted to send a message longer than 2000 characters, try shortening your message to fit within the character limit or use a pasting service (see below)
• If you tried to show someone your code, you can use codeblocks
(run !code-blocks in #bot-commands for more information) or use a pasting service like:
 whole sage
Hey
Does anyone knows why I get an Infeasible in optimization status
Please help me
 wide oxide
Do we have a link for projects?
 serene scaffold
@void anvil if you're sure that any instance of a punctuation character can be removed, you can use a pretty simple regular expression to substitute all of them with an empty string
return the string without the punctuation characters?
strings are immutable so a function like re.sub will return a new string rather than modify the one you passed
you don't care whether what is mutable?
it's relevant to your question though
oh I see
so it's removing punctuation when it spell checks it, and you don't want that?
are you required to use this particular library?
It looks like this is a known issue with this library
someone on github posted their own workaround: https://github.com/mammothb/symspellpy/issues/7

GitHub
Hello. Great work! For inputs with punctuations, There are many novel, innovaive, and empirical anayysis availaible. we get outputs like there are many novel innovative and empirical analysis avail...
right, someone posted a workaround
it's on that page
alright
If you know where after which tokens the punctuation is supposed to go, you could save that information and then add them back in, but it appears that it's not guaranteed that the number of tokens in matches the number of tokens out.
I'm looking to see if there's another library
https://spacy.io/universe/project/contextualSpellCheck
this will very likely be slower but it looks like what you want

Contextual Spell Check
Contextual spell correction using BERT (bidirectional representations)
serene scaffold
@void anvil sorry I couldn't be more helpful. A lot of NLP projects are moving towards computationally heavy solutions.
 vocal sequoia
Hello
I have a issue in neural networks can someone help me?
I obtained the dataset for Video Clips from ChaLearn Competition 2017.
we divided the video into Images (frames) and Audio (wav) files.
I have annotations in a pickle file
How do I read the dataset into keras ?
 dapper fern
Hey guys anyone learning ml, doing kaggle wanna coop? I'm beginner with some knowledge of theory, somewhat ok at python and stuff.
 green basin
Hi all, I have a question regarding the application of DS but I'm not sure it belongs here. The gist is that I have an existing model that predicts labels for data (derived from a video), and now I want to write those labels onto the source video but I am not sure about the best way to do this. Is this the correct channel to ask something like this? (My apologies if this is not the right way to do this, I don't normally come to the help section) (PMs welcome).
 tight hawk
I got an excel sheet with dates in a column in format dd/mm/yyyy
for example
07/07/2020
when i read this excel sheet using read_excel
pandas by default will read this column as int64 tyoe and the df will show value of 44019 instead of 07/07/2020
This happens for all the date values
How can i fix this ?
 grave frost
@green basin Can you elaborate?
green basin
@tight hawk https://pandas.pydata.org/pandas-docs/stable/reference/api/pandas.read_excel.html
Look under "dtype" or event "parse_dates". I would try using the optional argument "dtype" with a value that is a dict. The key for the dict should be the col name and the value should be the data type. If you can't find a suitable date data type, try parsing as a string then use dataframe['myNewDateCol'] = dataframe['myOriginalDateCol'].map(lambda x: ... to parse the date to how you want to do it. At least that's how someone told me to do it once. Don't take my word as gospel.
grave frost
@vocal sequoia What is the format of the text? Does it have some <end> or <start> sequences? Is it natively in JSON?
green basin
@grave frost Sure. Let's assume that I have a Pandas DataFrame with 1 row for every 1 frame in my source video. Let's say that I have 1 column that has my string label value where I want to add that string as text ON TOP of the source video. I have tried using cv2 module; however, all implementations of adding text on top of video (that I have seen using cv2) requires writing each frame (as an image) to disk, adding the text onto the frame, then zipping all of those frames-with-text together to make a new video. I am hoping to find an alternative solution that does not require writing those frames to disk because it is so memory and CPU intensive.
grave frost
@green basin I get a lot of hits on Google for reading images directly in memory using cv2. https://jdhao.github.io/2019/07/06/python_opencv_pil_image_to_bytes/ Have you tried these methods?
Introduction
Sometimes, we may want an in-memory jpg or png image that is represented as
binary data. But often, what we have got is image in OpenCV (Numpy ndarray) or
PIL Image format. In this post, I will share how to convert Numpy image or PIL
Image object to binary data wi...
green basin
You know what, I've seen that web page before and it didn't answer my question before, but it has inspired me to try something different that I had not thought of. I will let you know how I fare 🙂
vocal sequoia
@vocal sequoia What is the format of the text? Does it have some
<end>or<start>sequences? Is it natively in JSON?
@grave frost
Dataset has videos
And annotations I extracted in a df
What I got was 5 columns with big5 personality traits (which is what I want to predict )
And 1 col with the name of the video
green basin
@grave frost so I dont think cv2.imencode helped from what I see. It looks like it just serializes it but that's not where I'm having trouble. The trouble im having is after that, after i have read in a video frame (as a numpy array of (width, height, colour-depth)-shape), I'm trying to add text to that video frame and every other frame and then save a new video with those labeled frames but without having to write those frames to disk
grave frost
So you do not want disk to be involved in any case?
@cedar sky How many epochs did you train it for?
@green basin Well I am no expert in this matter but I highly doubt any lib is there which accomplishes this. It seems to require very low level programming for this task.
However I don't understand where the disk is involved in the processing part. You would read img as an array, edit it according to your needs and save it. Only step 3 requires disk. Why would you write it to HDD in 1 or 2?
green basin
It's just the way i've seen it done on every tutorial for cv2. I know, it sounds ridiculous. I kept getting errors about a week ago, took a break to fix something else, and now I've returned to the problem and I'm attacking it all over again. I'm going to try 1 more approach and hopefully it works. I'll let you know if i have any more questions and I'll try to be more specific. Thank you for your time.
grave frost
@mild topaz Your training looks definitely wrong. For epoch 12 I don't expect val_acc to be 100% along with accuracy. Are you using dropout layers and are you sure you are not overfitting (by a very large margin it seems)
 lyric canopy
Did you mean to ping me? Maybe you mean something else
grave frost
It does
Though it is a general topic so you can find help in a ton of other channels too
grave frost
I mean data visualization
 hollow sentinel
oh true
yeah i'm only on step one tho loading in a data set and creating a database
green basin
@grave frost Final question since you seem knowledgeable: can you suggest a module for building an app to modify hyper parameters when building classifiers?
I have some lab-mates who understand the hyper parameters, but aren't coders, and they want to mess with the model parameters iteratively on some sort of GUI. Django is overkill but Streamlit isn't developed enough to satisfy our needs. Any suggestions for a middle ground?
 rigid vector
Hi ! I have a computational science question. I am working to solve an ODE of the form dy/dt=f(y,t), with f a function which depend of combination of sin(y) and polynomial function of t as t*(t-2) but I cannot find any exemple on the web which seems like my question. Is someone can help ?
 storm sandal
@rigid vector this seems more like a DiffEQ problem than a Data Science problem.
 heady hatch
Hey all,
Currently I'm working on a dataset with couple million rows in csv format, and I think I'm running out of memory while trying to train the model.
My input pipeline is:
- read data into pandas
- filter rows, extract text and target
- stratify split data into train and test
- tokenize text, convert text to seq, then pad sequences
- then throw it into model
I'm unsure if I'm batching, I did set the batch_size variable during fitting.
Couple options I'm looking into right now is data subsampling and using generators.
Any advice?
 wise garden
What's that popular website that has free modules on ML
someone told me but I forgot
jk found it
heady hatch
Oh that's super cool. I'll look into it.
Thank you @void anvil .
Does anyone know a TF/Keras solution?
I think I can lazy load it without the library though.
I'm not looking for visualization or anything, just needed to load it into model.
I'm still trying it out. But what I've done thus far is just saving the preprocessed data as h5 format onto drive and load the preprocessed data instead.
I'll be spreading words about vaex though, I think my colleague will appreciate it.
 shadow harbor
Heyy everyone, I am new to coding and I am planning to take up data science or data analysis as a career option. Any tips and tricks plsss?
 desert oar
@shadow harbor long road, a lot to learn. be patient and keep working. you are likely making progress even if you don't feel like you are.
shadow harbor
thanks @desert oar , any tips in particular regarding what to learn as a beginner and what to follow? It'll be great help!
 velvet thorn
@glad mulch what od yo uexpect the result to look like?
serene scaffold
@void anvil that's pretty annoying. sorry there aren't any better alternatives
hollow sentinel
i just want to do some data visualization with plot.ly
but would that require setting up a frontend and backend
i'm a noob w this stuff if it wasn't obvious

A CSV file for all Chipotle Locations in the US
I want to use that CSV show how many chipotle restaurants are in each location
or each state
but idk how to get started
can you put a CSV in a database?
I tried looking at some github projects but i couldn't figure it out
did i just kill the vibe
 quiet vessel
nah its wednesday
hollow sentinel
oh ok good i thought you guys would be like nah we don't help with projects
i just want to make a pie chart of all the data with each State being a part of the pie chart
very simple ik but i just wanted a project on my resume
 bright turret
i never got an answer to my 3d histogram question, i wonder if they prefer pies
hollow sentinel
3d histogram?👀
yeah well everyone here has lives and can't always consistently respond haha
bright turret
ya like a time series of histograms plotted along the z axis
hollow sentinel
yeah it's SQL
bright turret
you can make a pie chart using matplotlib
and the csv
without getting a database involved
what is ur question
bright turret

Anaconda
Anaconda is the birthplace of Python data science. We are a movement of data scientists, data-driven enterprises, and open source communities.
hollow sentinel
do you need a frontend to create the graph from the csv
bright turret
lets drop the jargon for a moment
hollow sentinel
do you need any javascript at all
hollow sentinel
i know a tiny bit of numpy
bright turret
pandas can read your csv and import it into a dataframe
from there u can use matplotlib to make a pie chart
hollow sentinel
ok i'll watch some tutorials
yeah the kaggle csv has it too
so i'll just do what @bright turret is saying
it
it'll be a good exercise
thanks guys
hollow sentinel
yeah there's some videos for data visualization
can you do it on repl.it
yes right it's just import statements
bright turret
never heard of that
 bright turret
i just use anacondas
hollow sentinel
anaconda is weird on my mac
bright turret
oh RIP
hollow sentinel
F
bright turret
F
hollow sentinel
literally any IDE is wack on my mac
it's like the universe wants me to use repl.it
bright turret
Windows 4 lyfe or something better comes along
But at least i'm not the biggest noob here, so thanks
hollow sentinel
thank you for helping me @bright turret
bright turret
you're welcome
hollow sentinel
i'll come back w more questions
bright turret
i'm sure you will
hollow sentinel
sike i switched to anaconda
heady hatch
Hey people, anyone familiar with tensorflow dataset api?
https://www.tensorflow.org/api_docs/python/tf/data/Dataset
I came across this error while trying to train my model.
The shape of labels (received (1,)) should equal the shape of logits except for the last dimension (received (140, 8))
I wasn't too sure what was wrong.
My model is
Model: "functional_11"
_________________________________________________________________
Layer (type)                 Output Shape              Param #
=================================================================
input_6 (InputLayer)         [(None, 140)]             0
_________________________________________________________________
embedding_5 (Embedding)      (None, 140, 50)           1000000
_________________________________________________________________
bidirectional_5 (Bidirection (None, 140, 100)          40400
_________________________________________________________________
global_max_pooling1d_5 (Glob (None, 100)               0
_________________________________________________________________
dense_10 (Dense)             (None, 50)                5050
_________________________________________________________________
dropout_5 (Dropout)          (None, 50)                0
_________________________________________________________________
dense_11 (Dense)             (None, 8)                 408
=================================================================
Total params: 1,045,858
Trainable params: 1,045,858
Non-trainable params: 0
_________________________________________________________________
Shape of the training features is (14292, 140) and shape of label is (14292,).
Please let me know if you need more information.
To clarify,
net = lstm(...)

train = tf.data.Dataset.from_tensor_slices((xtrain, ytrain))
test = tf.data.Dataset.from_tensor_slices((xtest, ytest))

callbacks = []
callbacks.append(EarlyStopping(monitor="val_loss", min_delta=0.01, patience=3, verbose=1, mode="auto"))

net.compile(loss='sparse_categorical_crossentropy',
            optimizer='adam',
            metrics=['accuracy'])

history = net.fit(train,
                  epochs=5,
                  batch_size=16,
                  callbacks=callbacks,
                  validation_data=test)
This was how I trained the model using Dataset API.
I think I might have figured it out! But I'm currently fitting on the whole dataset to see if there's overfitting or not.
I'll have to report back after!
 rain crescent
can anyone suggest materials for learn numpy in detail
 lapis sequoia
literally any IDE is wack on my mac
@hollow sentinel dont use an IDE then
hollow sentinel
y'all i got a question
A CSV file for all Chipotle Locations in the US
i'm trying to graph this with each state as it's own slice in a pie chart
yes i've looked at the documentation
i'm stuck
you can't put a dataframe into a piechart?
 wheat pilot
how do you compute leave one out cross validation error for 1 nearest neighbors if the data is multifeatured and each feature is categorical?
 magic quail
Hi.
I have a dataframe, I am trying to convert it to parquet. By default the column datatype is varchar, that is string, but it contains numeric values to that is interpreted as float. Before converting the data frame to parquet how can I make sure, that all values of the column are made as strings?
heady hatch
One way I can think of is cast the types to string first before the conversion.
Something along the lines of
df['col'].astype(str)
 blazing rain
Hey all. I'm currently training in Python for DS/ML/AI and would like to specialize in Spatial Data Analysis. I have a formal university degree with majors in Geography, Economics, and International Studies. Does anyone have suggestions for projects / additional training in this specific area? I've done more generalized bootcamps in Py, NN, etc. but would like to get some experience with spatial data in ML/AI, including display via GIS. Any suggestions are much appreciated!
 austere swift
You could try something out with predicting weather patterns with ML
noaa has some good datasets on that
blazing rain
Definitely open to that. Hoping to find something that might offer guided projects like that to help learn workflow, process, etc.
hollow sentinel
A CSV file for all Chipotle Locations in the US
that's what i'm usiing
i want to make a pie chart where each state has a slice
my problem is getting the data into the pie chart
plt.title("My Awesome Pie Chart")
state_data =sample_data["state"]
state_data
plt.pie(state_data, labels = state_data)
plt.show()
ValueError Traceback (most recent call last)
<ipython-input-28-d963c0f29800> in <module>
2 state_data =sample_data["state"]
3 state_data
----> 4 plt.pie(state_data, labels = state_data)
5 plt.show()
~/opt/anaconda3/lib/python3.7/site-packages/matplotlib/pyplot.py in pie(x, explode, labels, colors, autopct, pctdistance, shadow, labeldistance, startangle, radius, counterclock, wedgeprops, textprops, center, frame, rotatelabels, data)
2786 wedgeprops=wedgeprops, textprops=textprops, center=center,
2787 frame=frame, rotatelabels=rotatelabels, **({"data": data} if
-> 2788 data is not None else {}))
2789
2790
~/opt/anaconda3/lib/python3.7/site-packages/matplotlib/init.py in inner(ax, data, *args, **kwargs)
1597 def inner(ax, *args, data=None, **kwargs):
1598 if data is None:
-> 1599 return func(ax, *map(sanitize_sequence, args), **kwargs)
1600
1601 bound = new_sig.bind(ax, *args, **kwargs)
~/opt/anaconda3/lib/python3.7/site-packages/matplotlib/axes/_axes.py in pie(self, x, explode, labels, colors, autopct, pctdistance, shadow, labeldistance, startangle, radius, counterclock, wedgeprops, textprops, center, frame, rotatelabels)
2963 # The use of float32 is "historical", but can't be changed without
2964 # regenerating the test baselines.
-> 2965 x = np.asarray(x, np.float32)
2966 if x.ndim != 1 and x.squeeze().ndim <= 1:
2967 cbook.warn_deprecated(
~/opt/anaconda3/lib/python3.7/site-packages/numpy/core/_asarray.py in asarray(a, dtype, order)
83
84 """
---> 85 return array(a, dtype, copy=False, order=order)
86
87
~/opt/anaconda3/lib/python3.7/site-packages/pandas/core/series.py in array(self, dtype)
752 dtype='datetime64[ns]')
753 """
--> 754 return np.asarray(self.array, dtype)
755
756 # ----------------------------------------------------------------------
~/opt/anaconda3/lib/python3.7/site-packages/numpy/core/_asarray.py in asarray(a, dtype, order)
83
84 """
---> 85 return array(a, dtype, copy=False, order=order)
86
87
~/opt/anaconda3/lib/python3.7/site-packages/pandas/core/arrays/numpy_.py in array(self, dtype)
182
183 def array(self, dtype=None) -> np.ndarray:
--> 184 return np.asarray(self._ndarray, dtype=dtype)
185
186 _HANDLED_TYPES = (np.ndarray, numbers.Number)
~/opt/anaconda3/lib/python3.7/site-packages/numpy/core/_asarray.py in asarray(a, dtype, order)
83
84 """
---> 85 return array(a, dtype, copy=False, order=order)
86
87
ValueError: could not convert string to float: 'Alabama'
there's my error
i've read documentation and looked all over the place i can't figure it out
magic quail
@heady hatch
result = pa.array(col, type=type_, from_pandas=True, safe=safe)
File "pyarrow\array.pxi", line 265, in pyarrow.lib.array
File "pyarrow\array.pxi", line 80, in pyarrow.lib._ndarray_to_array
File "pyarrow\error.pxi", line 107, in pyarrow.lib.check_status
pyarrow.lib.ArrowTypeError: ('Expected a string or bytes dtype, got float64', 'Conversion failed for column NOTES with type float64')
heady hatch
Can you show me how you're casting the dataframe?
blazing rain
Looks like you need to use ['state'] as your labels but plot the values associated with the ['state'] index column
hollow sentinel
what
austere swift
@hollow sentinel the first part of the plt.pie should be the size of the pie slices
so thats why you get that error, you cant put strings into it
and I don't understand what you're trying to do anyways, you're putting state_data in for both arguments
magic quail
@heady hatch not possible now, I'll dm you later?
heady hatch
Ping me here.
hollow sentinel
i want to show how many chipotles there are in each state
so what would you put for the size then
@austere swift
heady hatch
You can groupby the state and count it.
heady hatch

Stack Overflow
I have a data frame df and I use several columns from it to groupby:
df['col1','col2','col3','col4'].groupby(['col1','col2']).mean()
In the above way I almost get the table (data frame) that I ne...
austere swift
hollow sentinel
idk how to use that
sample_data = pd.read_csv("chipotle_stores.csv")
sorry if i'm being annoying i genuinely don't know
i'm new to data science
this is just for a small project i wanted to do
heady hatch
Nope, will be asleep in 2 hours.
@hollow sentinel So after you read the data via read_csv, try sample_data.head(). That'll give you an idea of what the columns look like.
How new are you to data science, @hollow sentinel?
hollow sentinel
uh just started yesterday @heady hatch
magic quail
Ok my df is also read from csv
heady hatch
Are you familiar with statistics at all?
hollow sentinel
yeah i'm taking a class in it
heady hatch
So I'm going to walk you through your goal, which is to make a pie chart.
Okay so you say you want to make a pie chart. What do you want the pie chart to show?
hollow sentinel
how much chipotle restaurants there are in each state
heady hatch
Okay so you want to show how many restaurants are there in each state.
Now what kind of statistics will you need for this visualization?
hollow sentinel
there's a state column in the csv
i was thinking like california is there ____ times and I wanted to show california's slice in the pie chart
hollow sentinel
how many times each state is there
magic quail
matplotlib
heady hatch
You have a column with a bunch of states in them, right? What can you gather from it?
like you said, how many times each state is in there.
hollow sentinel
that's how many chipotle resturants each state has
heady hatch
So this is called a count, might have some other names. However for the purpose of this conversation, we'll call it count.
So we want to get a count of how many states there are in some data, right?
hollow sentinel
yes
heady hatch
Okay so
You have couple ways of doing this.
We'll start simple.
let's say your dataframe is called data.
data = pd.read_csv(...)
and you have a column in there called states.
You can access it via data['states'].
hollow sentinel
yeah that's what i did w state_data =sample_data["state"]
heady hatch
Try that in the terminal and tell me what it shows you?
Take a look at the actual column, not just assigning it.
hollow sentinel
it shows each state
heady hatch
Okay.
heady hatch
Cool cool cool.
So I think dataframe has a function called value_counts.
So you can try something like
states_data.value_counts().
Let me know what that shows you.
hollow sentinel
it shows california 421, texas 226
so that's how many times california and texas shows up
and all the other states
hollow sentinel
more than just two states
heady hatch
with states as the index, and the count of each state as the values.
hollow sentinel
all the way to wyoming as 1
heady hatch
Now you can access these values as such
states_idx = states_data.value_counts().index
states_val = states_data.value_counts().values
Now take a look at states_idx and states_val.
Tell me what you see.
hollow sentinel
for states_idx i see nothing
just a blank graph
for states_val i have AttributeError: 'str' object has no attribute 'value_counts'
heady hatch
uh
What does states_data.value_counts() evaluate to again?
btw you're going to need to adapt this to your code
Because I'm just using generic variable names.
hollow sentinel
am i allowed to send screenshots here
heady hatch
paste the code instead in triple backticks.
hollow sentinel
California        421
Texas             226
Ohio              193
Florida           177
New York          160
Illinois          144
Virginia          107
Pennsylvania       96
Maryland           94
Arizona            85
Colorado           79
Minnesota          71
New Jersey         69
North Carolina     65
Massachusetts      62
Georgia            61
Washington         43
Indiana            40
Missouri           39
Michigan           39
Oregon             32
Kansas             30
Nevada             29
Tennessee          26
Connecticut        24
Kentucky           21
Washington DC      21
South Carolina     21
Wisconsin          20
Alabama            15
it goes on
hollow sentinel
Index(['California', 'Texas', 'Ohio', 'Florida', 'New York', 'Illinois',
       'Virginia', 'Pennsylvania', 'Maryland', 'Arizona', 'Colorado',
       'Minnesota', 'New Jersey', 'North Carolina', 'Massachusetts', 'Georgia',
       'Washington', 'Indiana', 'Missouri', 'Michigan', 'Oregon', 'Kansas',
       'Nevada', 'Tennessee', 'Connecticut', 'Kentucky', 'Washington DC',
       'South Carolina', 'Wisconsin', 'Alabama', 'Oklahoma', 'Utah',
       'Louisiana', 'Nebraska', 'Iowa', 'Delaware', 'Rhode Island',
       'New Mexico', 'New Hampshire', 'Arkansas', 'West Virginia', 'Maine',
       'Idaho', 'Montana', 'Vermont', 'Mississippi', 'North Dakota',
       'Wyoming'],
      dtype='object')
Hm I'm not too sure what you mean by just a blank graph.
Because you're showing me the index right now.
hollow sentinel
oh yeah forget about that i fixed it
heady hatch
Okay so what about value_counts().values?
hollow sentinel
'str' object has no attribute 'value_counts
hollow sentinel
---------------------------------------------------------------------------
AttributeError                            Traceback (most recent call last)
<ipython-input-39-20d3e9a2843a> in <module>
      3 states_idx = state_data.value_counts().index
      4 states_idx
----> 5 states_val = state.value_counts().values
      6 states_val
      7

AttributeError: 'str' object has no attribute 'value_counts'
Is it supposed to be state.value_counts()?
hollow sentinel
state_data =sample_data["state"]
state_data.value_counts()
states_idx = state_data.value_counts().index
states_idx
states_val = state.value_counts().values
states_val

#plt.pie(state_data, labels = state_data)
#plt.show()
isn't that what i copy pasted
does it say states somewhere it's not supposed to
i have been staring at the word state for too long
hollow sentinel
so it should be state_val
heady hatch
It should be states_data.value_counts().
instead of states.value_counts().
so
on your assignment.
hollow sentinel
i'm so confused
hollow sentinel
i have no line numbers on anaconda
heady hatch
Look to the right of the = sign.
Okay
Look to the right of your = sign.
Look at what you're assigning.
Go through it, character by character.
hollow sentinel
OHHHHHHH
heady hatch
now you have a list of your states and the values of the count of the states.
hollow sentinel
state_data =sample_data["state"]
states_data.value_counts()
states_idx = states_data.value_counts().index
states_idx
states_val = state.value_counts().values
states_val

#plt.pie(state_data, labels = state_data)
#plt.show()
Now you can plot it via plt.pie.
hollow sentinel
did i fix it this time
heady hatch
You still haven't fixed it.
hollow sentinel
no
heady hatch
Why not?
heady hatch
Okay so you have these two lines.
states_idx = states_data.value_counts().index
states_val = state.value_counts().values
Right?
hollow sentinel
yes
heady hatch
Now for the first one
it's
= states_data.value_counts() right?
And for the second one, it's = state.value_counts().
= states_data.value_counts()
= state.value_counts()
Look at where they're different.
hollow sentinel
one has _data
heady hatch
right.
So what's state.value_counts()?
Why are you using state for one and state_data for the other?
heady hatch
I don't know, I don't even know why you wrote state instead of state_data.
I think if you can answer that, you might be able to answer your confusion.
hollow sentinel
noooooo
hollow sentinel
ok
velvet thorn
states_idx = states_data.value_counts().index
states_idx
states_val = state.value_counts().values
^ there
hollow sentinel
no that doesn't work either
---------------------------------------------------------------------------
NameError                                 Traceback (most recent call last)
<ipython-input-42-625cfd47ba59> in <module>
      1 state_data =sample_data["state"]
----> 2 states_data.value_counts()
      3 states_idx = states_data.value_counts().index
      4 states_idx
      5 states_val = state.value_counts().values

NameError: name 'states_data' is not defined
You might need to be more familiar with Python. Maybe look over basics of Python, you're making mistakes on the syntax.
austere swift
its state_data not states_data
austere swift
you still spelled it wrong again
hollow sentinel
what line
austere swift
the line its pointing to
hollow sentinel
state_data =sample_data["state"]
state_data.value_counts()
states_idx = state_data.value_counts().index
states_idx
state_val = state.value_counts().values

#plt.pie(state_data, labels = state_data)
#plt.show()
---------------------------------------------------------------------------
AttributeError                            Traceback (most recent call last)
<ipython-input-45-4b34edeae852> in <module>
      3 states_idx = state_data.value_counts().index
      4 states_idx
----> 5 state_val = state.value_counts().values
      6
      7 #plt.pie(state_data, labels = state_data)

AttributeError: 'str' object has no attribute 'value_counts'
like two people have said...why do you have a state and a state_data?
austere swift
^
velvet thorn
no that doesn't work either
@hollow sentinel and I'm not saying that'll work; I'm pointing out the inconsistency in your code
hollow sentinel
so it should be ```python
state = sammple_data["state]
sample
idk i think i should go to bed i'm not thinking straight
velvet thorn
like at the very least, you should be able to tell that your variable names are all over the place
which leads to confusion.
velvet thorn
how about you go take a break
and look at it again in the morning or evening or whatever is a few hours away in your timezone
think that might be more productive
 tawdry bobcat
How can I find out the dataset format for DialoGPT? (https://github.com/microsoft/DialoGPT)
mild topaz
Your training looks definitely wrong. For epoch 12 I don't expect val_acc to be 100% along with accuracy. Are you using dropout layers and are you sure you are not overfitting (by a very large margin it seems)
@grave frost my code here https://paste.pythondiscord.com/hajamafano.coffeescript
also i have very less amount of data to train a model for e.g say i have 3 classes, each class have approx only 7-10 images@grave frost plz ping me when u back.
mild topaz
my training process here https://paste.pythondiscord.com/pisamuvuci.diff plz have look @grave frost
hasty grail
unless you're doing few-shot learning I don't think your model would perform very well
that's way too little data
mild topaz
yess i am using python dataGen = ImageDataGenerator(width_shift_range = 0.1, height_shift_range = 0.1, zoom_range = 0.2, shear_range = 0.1, rotation_range = 10) see this @hasty grail
hasty grail
how many samples do you have per epoch? (not batches)
mild topaz
steps_per_epoch_val = 10 @hasty grail is this u are talking?
mild topaz
see in training -12 samples, val -3samples, test -4samples @hasty grail
hasty grail
and how many classes are there?
mild topaz
3 classes only @hasty grail
hasty grail
you should increase the amount of data you have via data augmentation
mild topaz
i am using data augmentation this in my code @hasty grail
hasty grail
but you aren't increasing the amount of samples you have
mild topaz
means incresing the images (image data) u are saying here ? @hasty grail
mild topaz
u mean to collect more image data @hasty grail
hasty grail
yes
mild topaz
thanks 🙂 @hasty grail
 obtuse skiff
how hard would it be to implement a convolutional nueral network from scratch?
Only using numpy
 eager heath
hasty grail
eager heath
hasty grail
numpy by itself doesn't use GPU though so it'll be rather slow
mild topaz
@hasty grail hii, val_loss should be less that val_accuracy is this the method in training a NN model ? is this correct?
hasty grail
you're not describing a method, seems that you're describing a goal
mild topaz
i am using a CNN @hasty grail
hasty grail
it's possible that val_loss > val_accuracy depending on how they are computed, it is not absolutely necessary that the loss is smaller than accuracy
mild topaz
also, how to decide how much epoch should be keep to train a CNN model ?
mild topaz
i have trained a model now, what u can say on this? @hasty grail python Epoch 47/50 10/10 [==============================] - 12s 1s/step - loss: 0.1458 - accuracy: 0.8947 - val_loss: 0.0019 - val_accuracy: 1.0000 Epoch 48/50 10/10 [==============================] - 12s 1s/step - loss: 0.1911 - accuracy: 0.9286 - val_loss: 0.0241 - val_accuracy: 1.0000 Epoch 49/50 10/10 [==============================] - 12s 1s/step - loss: 0.1833 - accuracy: 0.9286 - val_loss: 0.0051 - val_accuracy: 1.0000 Epoch 50/50 10/10 [==============================] - 18s 2s/step - loss: 0.1468 - accuracy: 0.9737 - val_loss: 0.0093 - val_accuracy: 1.0000 test score: 0.3029577136039734 test accuracy: 0.800000011920929
grave frost
@obtuse skiff I agree with DarkLight, if you have an Nvidia GPU (even those cheap laptop ones) better use Cupy for your implementation.
@mild topaz Model seems to be overfitting. But from the test accuracy, I don't think more can be expected from it, seeing the amount of data
obtuse skiff
Thanks for the recommendation
Will do
How would you parallel the layers?
Nodes in the layers
hasty grail
that really really depends on the model architecture, I am not aware of model parallelism being implemented even for the popular ML frameworks
 odd yoke
assuming you talk about parallelizing the computations within the same layer, numpy will do it for you if you use it correctly (basically, without using loops)
mild topaz
to prevent overfitting i need more image data, Correct ? @grave frost
odd yoke
that's one way, yes, there are many techniques you can use to limit overfitting without needing to add more data
simplest one is regularization
hasty grail
given that they only have 10 batches I think they do need to add more data xD
odd yoke
yeah probably then
grave frost
@green basin Hyperparameter optimization isn't exactly something to be done on a GUI (at least in my experience I have not seen such a lib). You need to understand that optimization takes a lot of time, 7-ish days is kinda expected if you want maximum performance. Since most hyperparameters will be numerical (save a few others like loss and optimizers) most efficient way is to research the optimizers/loss, test them out manually (since I assume you do not have enough resources to train model for a few days continously).
Seeing as to the research part and the fact that parameters are numerical, GUI will not help you or your lab-mates very much. There are plenty of methods online for h-optimization (I personally like talos since it is extremely simple and bare-bones).
"Messing" hyperparameters can be done manually but it is too inefficient and draining task so better to be automated by some library for that. You could make an app that consists of a start button to start the training but apart from that ML is a bit technical stuff - even if your labmates don't like coding, they can learn a bit o' maths and research for you the best loss and optimizer for the job.
So my recommendation is to just use a lib (don't worry it's pretty easy) and automate the boring stuff. You may tune some basic parameters like Learning rate, optimizer hyperparametrs etc. (like 4-5 parameters for a start) so you training would be done in about a day with a decent GPU. 🙂
simplest one is regularization
@odd yoke I don't think they are allowed to modify the program in any way, only the data....
odd yoke
oh, that'll teach me not to read
mild topaz
given that they only have 10 batches I think they do need to add more data xD
@hasty grail correct
grave frost
So why didn't you do Image augmentation? Not using Keras built-ins but with some other dedicated lib like imguag???
hasty grail
they are already doing it apparently
but I guess they didn't actually increase the size of the dataset
regardless, having more real data is better than having more artificial ones
especially for a dataset this small
Finally - I spent hours just to get this to display nicely as a (roughly) 1:1 image regardless of the spatial dimensions and value range of the data 😫 (Don't worry the data here is just a placeholder xD)
grave frost
@hasty grail augmentation can give upto 10x the data but I don't see that much substantial data with the OP, even assuming he started with only a couple of photos. Since there are many filters, he could easily boost his accuracy to be atleast a little bit better that the current 80%...
mild topaz
Epoch 48/50
10/10 [==============================] - 17s 2s/step - loss: 0.0196 - accuracy: 1.0000 - val_loss: 3.3961e-04 - val_accuracy: 1.0000
Epoch 49/50
10/10 [==============================] - 17s 2s/step - loss: 0.0123 - accuracy: 1.0000 - val_loss: 2.0785e-04 - val_accuracy: 1.0000
Epoch 50/50
10/10 [==============================] - 19s 2s/step - loss: 0.0082 - accuracy: 1.0000 - val_loss: 1.0205e-04 - val_accuracy: 1.0000
test score:  4.928431034088135
test accuracy: 0.0``` when again i train a model @grave frosti get the above results
grave frost
uh-oh that looks pretty bad
mild topaz
becoz of less image data ? @grave frost
grave frost
I am not very sure but apparently the model has overfitted to such an extent that it has lost all its ability to generalize. Though, you can confirm this with Darklight or lgneous just to be on the safe side...
Yes, lack of data is one factor in the overfitting
hasty grail
Test accuracy 0 oof
mild topaz
yes @hasty grail
cedar sky
Epoch 48/50
10/10 [==============================] - 17s 2s/step - loss: 0.0196 - accuracy: 1.0000 - val_loss: 3.3961e-04 - val_accuracy: 1.0000
Epoch 49/50
10/10 [==============================] - 17s 2s/step - loss: 0.0123 - accuracy: 1.0000 - val_loss: 2.0785e-04 - val_accuracy: 1.0000
Epoch 50/50
10/10 [==============================] - 19s 2s/step - loss: 0.0082 - accuracy: 1.0000 - val_loss: 1.0205e-04 - val_accuracy: 1.0000
test score:  4.928431034088135
test accuracy:  0.0```   when again i train a model @grave frost
@mild topaz What is the size of your vaalidation set
Evenif it hadoverfit badly it would be able to have an test acc of more than 0
It is an issue with the fundamentals of the code
grave frost
Evenif it hadoverfit badly it would be able to have an test acc of more than 0
@cedar sky Not necessarliy - the OP had like 5 testing samples. It could be possible that due to an unlucky conjunction he got test accuracy of 0.
cedar sky
@cedar sky Not necessarliy - the OP had like 5 testing samples. It could be possible that due to an unlucky conjunction he got test accuracy of 0.
@grave frost The chance of that happening is really low
for a normal task the initialized weights would have abt a 30% accuracy
grave frost
That is a very wrong assumption there. Initialized weights are often set at 0 or 1 which anyone can change; It does not gurantee that you would get 30% accuracy without training. If you do not train a model then the expected accuracy would be the empirical probablity calculated by the data, not on the weights themselves as the model would then be simply guessing at random.
Though in practice untrained models sometimes perform even worse than the theoretical outcome due to it's stochastic nature
hasty grail
They mentioned that there are 3 classes, so naively, the chance of it getting all 5 wrong would be (2 / 3) ** 5 = 13.17%, which honestly isn't all that low
hasty grail
Try searching "pandas get average of column" on Google
Being able to find out the solution yourself will save you the pain of having to wait for someone to respond xD
hasty grail
If you want the weekly average I think you can use groupby
 azure marsh
Thanks a lot
hasty grail
np
grave frost
They mentioned that there are 3 classes, so naively, the chance of it getting all 5 wrong would be
(2 / 3) ** 5 = 13.17%, which honestly isn't all that low
yeah, but he was getting good test accuracy before so I assume his code must be working. Also, he was getting 100% val accuracy which isn't very common. Why would a model get 100% val acc but 0 test acc? Probably because it was way overfitted or either some part of code is wrong. But it was working before I don't see why the code would suddenly stop working, unless he forgot to shuffle the data...
mild topaz
https://paste.pythondiscord.com/vopasohisi.coffeescript my code here plz check @grave frost
hollow sentinel
import pandas as pd
from matplotlib import pyplot as plt
sample_data = pd.read_csv("chipotle_stores.csv")
sample_data = pd.read_csv("chipotle_stores.csv")
sample_data = pd.read_csv("chipotle_stores.csv")
NameError Traceback (most recent call last)
<ipython-input-7-e3615d995c74> in <module>
----> 1 sample_data = pd.read_csv("chipotle_stores.csv")
NameError: name 'pd' is not defined
uhhhhhhh
this was working fine last night
i checked and there's nothing wrong with the folder
i don't understand
i'm confusion
mild topaz
try pip install pandas @hollow sentinel
hollow sentinel
in the terminal right
that doesn't do anythnig
it says pandas is already in anaconda
ughhhhh this is such bullshit i just wanted a pie chart mann
i swear to god it was working last night
HEY IT WORKS AGAIN
it's like my mac just forgot i have pandas
@heady hatch I did it chief
um i think i have to make a legend
heady hatch
Congratulations.
hollow sentinel
it looks ugly
i think a bar graph would be better
x_pos = [i for i, _ in enumerate(x)]
what does that mean
x_pos = [i for i, _ in enumerate(states_idx)]
plt.bar = (x_pos, stateValues, color = "blue")
plt.xlabel("States")
plt.ylabel("Restaurants")
plt.title("States with the Largest Amount of Chipotle Restaurants")
plt.xticks(x_pos, states_idx )
plt.show()
what's wrong with the syntax with color = "blue"
 pale thunder
you cannot have assignment in tuples
pale thunder
bar = (x_pos
bar(x_pos
hollow sentinel
one has an equal sign and one doesn't
got it thank you
created the bar chart
it looks mad ugly too
who knew data viz was so sus
austere swift
honestly i think a really good way to visualize this would be a choropleth
you can do those in plotly pretty easily
its like a map that has a color bar from like 2 different colors and the more towards one color the higher the value
so you could make a map of all the states and have it so that the one that has the most chipotles would be one color and then a gradient down to the one with the least chipotles
austere swift
you dont need a frontend and a backend lol
austere swift
i've done choropleths with plotly many times
its really simple
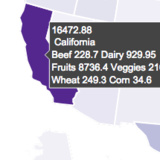
How to make choropleth maps in Python with Plotly.
hollow sentinel
that is smart
austere swift
basically something like this
import plotly.express as px
import pandas as pd
import json
from urllib.request import urlopen

print("Loading Data")
with urlopen('https://raw.githubusercontent.com/plotly/datasets/master/geojson-counties-fips.json') as response:
    geojson = json.load(response)

sample_data = pd.read_csv("chipotle_stores.csv")

fig = px.choropleth(sample_data, geojson=geojson, locations="state")
that probably wont work but something like that
hollow sentinel
austere swift
yeah actually what i sent wont work cus the geojson is for counties lol
austere swift
yeah you could
hollow sentinel
ok good i can say i visualized data w two charts and i'm working to add another
ty @austere swift
can i ping you if i have questions about the chloropath
austere swift
sure
hollow sentinel
alright great it's on github
heady hatch
Hey guys.
Right now I'm playing around with the dataset and sequence API on both CPU and GPU to see the speed difference.
I noticed CPU is running much quicker than GPU, which I'm thinking I'm using GPU wrong.
Any advice here?
CPU is running at an hour per epoch while GPU is running at 2 hours per epoch.
austere swift
code?
heady hatch
Which part would you like?
So this is the model fitting.
callbacks = []
callbacks.append(EarlyStopping(monitor="val_loss", min_delta=0.01, patience=2, verbose=1, mode="auto"))
callbacks.append(ModelCheckpoint(
    filepath='weights.{epoch:02d}-{val_loss:.2f}.hdf5',
    save_weights_only=True,
    monitor='val_loss',
    mode='auto',
    save_best_only=True))

# with tf.device('/GPU:0'):

net.compile(loss='sparse_categorical_crossentropy',
            optimizer='adam',
            metrics=['accuracy'])

history = net.fit(train,
                  epochs=5,
                  verbose=1,
                  callbacks=callbacks,
                  validation_data=test)
This is the model.
Model: "functional_1"
_________________________________________________________________
Layer (type)                 Output Shape              Param #
=================================================================
input_1 (InputLayer)         [(None, 140)]             0
_________________________________________________________________
embedding (Embedding)        (None, 140, 50)           1000000
_________________________________________________________________
bidirectional (Bidirectional (None, 140, 100)          40400
_________________________________________________________________
global_max_pooling1d (Global (None, 100)               0
_________________________________________________________________
dense (Dense)                (None, 50)                5050
_________________________________________________________________
dropout (Dropout)            (None, 50)                0
_________________________________________________________________
dense_1 (Dense)              (None, 8)                 408
=================================================================
Total params: 1,045,858
Trainable params: 1,045,858
Non-trainable params: 0
_________________________________________________________________
This is the prepared data.
processed_data_path = Path('/kaggle/input/russian-troll-problem-compilation/processed_dataset.h5')
with h5py.File(processed_data_path, 'r') as f:
    input_shape = f['x_train'][:].shape
    num_classes = len(np.unique(f['y_train'][:]))

    train = TextSequence(f['x_train'][:], f['y_train'][:], batch_size=256)
    test = TextSequence(f['x_test'][:], f['y_test'][:], batch_size=256)
#     train = Dataset.from_tensor_slices((f['x_train'][:], f['y_train'][:])).batch(256)
#     test = Dataset.from_tensor_slices((f['x_test'][:], f['y_test'][:])).batch(256)
    embed_matrix = f['embedding'][:]
x_train is shape (some large number, 140) and y_train is (some large number,).
Let me know if you need some other code.
This is being run on Kaggle.
austere swift
have you verified that its actually running on gpu?
like checked gpu mem utilization and stuff
cus it could be saying that but then had some cuda error and run on cpu instead
but that still wouldnt explain the time difference...
heady hatch
I thought it was running it on GPU since the monitor had GPU usage.
But let me actual double check.
Any other way of checking if GPU is being used?
austere swift
tf.config.list_physical_devices('GPU')
heady hatch
gpus = tf.config.experimental.list_physical_devices('GPU')
for gpu in gpus:
    print("Name:", gpu.name, "  Type:", gpu.device_type)

print("Num GPUs Available: ", len(tf.config.experimental.list_physical_devices('GPU')))

#Name: /physical_device:GPU:0   Type: GPU
#Num GPUs Available:  1
ok so it sees the gpu then
heady hatch
It's okay to run it on GPU with this syntax, right?
with tf.device('/GPU:0'):

    net.compile(loss='sparse_categorical_crossentropy',
                optimizer='adam',
                metrics=['accuracy'])

    history = net.fit(train,
                      epochs=5,
                      verbose=1,
                      callbacks=callbacks,
                      validation_data=test)
yes
 boreal summit
Guys, I have a little issue here. I'm trying to use make_column_transformer from sklesen.compose to transform a column. I also imported simpleImputer to handle nan values. The code gives me an error saying, input contains Nan
Don't know what's wrong.
heady hatch
What does your pipeline look like?
My guess is it's hitting nans before the simpleimputer.
boreal summit
austere swift
can you copy paste your code?
boreal summit
Ooh, okay. Let me try something else. @heady hatch
@austere swift I'm typing from my phone.
hollow sentinel
fig = go.Figure(data=go.Chloropeth(
locations = states_idx
z = stateValues.astype(float)
locationmode = 'USA-states
colorscale = 'Reds',
colorbar_title = "Restaurants per State",
))

fig.update_layout(
title_text = "States with the Largest Amount of Chipotle Restaurants",
geoscope = "usa")

fig.show()
File "<ipython-input-2-5694b0fa71b6>", line 29
stateValues.astype(float)
^
SyntaxError: invalid syntax
boreal summit
Forgive me, I'm a student and still learning.
hollow sentinel
i'm going off that
idk what's wrong
any help is much appreciated
idk what's off i'm trying to follow the doc to a T
 misty lake
Can anyone enlighten me about architecting a machine learning application as micro services or show me an example?
hollow sentinel
does anyone know what's going on i'm very confused
grave frost
@misty lake You mean deploying a trained ML model to cloud and serve it via REST API's or something?
hollow sentinel
guys i genuinely don't know how to fix my code
i think i'm close but like invalid syntax what and how
in the doc the variable z is never used
i don't even know why they assign it to z
grave frost
@hollow sentinel You might get responses quicker if you explain your problem/error, what you have tried, and your goal clearly in one message. Multiple messages look pretty weird
hollow sentinel
ok so I'm trying to make a chloropeth which is like a map. I pasted my code before and it's saying I have an invalid syntax error. I tried taking it out but then it moves onto the next line and says invalid syntax too.
grave frost
ok, can you copy paste your whole traceback and the offending code here?
hollow sentinel
traceback??
grave frost
The error
hollow sentinel
File "<ipython-input-7-e51a0b6a67dc>", line 30
    locationmode = 'USA-states",
               ^
SyntaxError: invalid syntax
fig = go.Figure(data=go.Chloropeth(
locations = states_idx
#z = stateValues.astype(float)
locationmode = 'USA-states",
colorscale = 'Reds',
colorbar_title = "Restaurants per State",
))

fig.update_layout(
title_text = "States with the Largest Amount of Chipotle Restaurants",
geoscope = "usa")

fig.show
See do you use an IDE?
grave frost
ohk, if you are a beginner just don't use them yet please. Usually you can find such errors yourself.
grave frost
Now tell me, does the syntax look a little off to you, like a missing bracket or a possible comma missing?
hollow sentinel
but ok
it looks like mismatched quotes to me
locationmode = 'USA-states",
but i changed it and that doesn't work either
grave frost
is there a comma before that line? i.e after states_idx? python doesn't point to the exact absolute error, usually it is around somewhere there
and is there a line where the comma is not needed, say the line where you will specify no argument next?
hollow sentinel
hang on i'm running into issues w my terminal
module 'plotly.graph_objects' has no attribute 'Chloropeth'
If you are a beginner, I highly discourage Jupyter Notebooks. I myself use JN's every day but you need to have a little experience in programming to use it and avoid basic mistakes. You will also find that IDE's also provided code completion (or you can use kite with your notebook). So it would provide you with docs and complete your own code, find basic mistakes etc. all of which are very productive.
hollow sentinel
i had my freshman year in coding i
i'm pretty new but not like i started coding last night
i'm just rusty
grave frost
Right. Now did you google the error first to find out what fixes are suggested?
Well, if you are rusty then you shldn't be on JN in the first place
And it is no matter of embarrassment that you are having basic problems. Everyone has them at first 🙂 IDE is just to help you.
hollow sentinel
it's annoying how JN doesn't have line numbers
ok so i found this
Stack Overflow
I don't understand why this snippet of code does not work. The data is fictional, I just want to be able to make time-series visualization with plotly.
This module once worked for me in a Kaggle k...
and they said to import plot.ploty
grave frost
so try it out 🙂
hollow sentinel
ImportError:
The plotly.plotly module is deprecated,
please install the chart-studio package and use the
chart_studio.plotly module instead.
Uh-oh. Now if you another problem, just google it
hollow sentinel
yeah i found this

GitHub
Should have caught this before RC1, sorry... This message: I think should provide a little more context and say something like: The plotly.plotly module is deprecated. To create figures using the C...
grave frost
In programming it's like an infinite amount of errors, and all you can do is just keep correcting them. Over time you will make less mistakes.
hollow sentinel
yeah i know that
grave frost
Though I hate it myself 🙂
hollow sentinel
how do you exit out of a terminal that's currently running jupyter notebook
grave frost
yeah then you have to press "y" and enter then also
hollow sentinel
it's saying to download plotly 3.10.0
grave frost
better to do it twice and shut down everything
grave frost
Hmm I am on linux and I do it twice 🙂 maybe its old
hollow sentinel
The plotly.plotly module is deprecated,
please install the chart-studio package and use the
chart_studio.plotly module instead.
i tried the fix
it didn't work
this is sus

Plotly Community Forum
Okay, I eventually found this guide: (don’t know what took me so long) And the key part which did break my application is that I needed to use conda install -c plotly chart-studio instead of pip install. Then a simple import chart_studio.plotly in my graph_definitio...
grave frost
then just kick it out You have to try many fixes. Hopefully one will work
 main rain
hey so im getting an error message when trying to install the pytorch module
 glass jetty
@main rain Take a look at https://stackoverflow.com/questions/56859803/modulenotfounderror-no-module-named-tools-nnwrap and https://github.com/pytorch/pytorch/issues/4827
Stack Overflow
I am trying to import a package "torch".
For same, I tried to install it using pip command as below, installation even started but after few seconds it got error
below is the command that I execu...

GitHub
OS: macOS High Sierra version 10.13.2 PyTorch version: How you installed PyTorch (conda, pip, source): pip3 Python version: Python 3.6.0 :: Anaconda 4.3.0 (x86_64) CUDA/cuDNN version: No GPU I succ...
main rain
ohh thanks a lot imma read that
hollow sentinel
no problem
the same error
module 'plotly.graph_objs' has no attribute 'Chloropeth'
nope nothing i try does anything
i'm on the third page of google
main rain
@glass jetty thanks it worked by running
pip install torch==1.6.0+cpu torchvision==0.7.0+cpu -f https://download.pytorch.org/whl/torch_stable.html
misty lake
@misty lake You mean deploying a trained ML model to cloud and serve it via REST API's or something?
@grave frost Not really but without using cloud services. Also architecting example .
 dull musk
anyone can recommend me a dataset to get companies information like name and domain ?
 coral walrus
heya. using pandas, is there a way to generate an empty dataframe if the code below doesn't return any values?
data = pd.read_excel(r'{path}\some_data.xlsx', sheet_name='any')
You can always do pd.DataFrame() then append to it.
coral walrus
so something like if data is empty: new = pd.DataFrame() and add a single empty row to it or something like that
heady hatch
Depending on your situation, you don't even need to add a single empty row.
Just straight up df = pd.DataFrame().
coral walrus
I'll give it a try
heady hatch
Btw it might help to talk about what you're trying to do because as of now the problem you're asking about is "how do I create an empty DataFrame", which the answer is pd.DataFrame().
But that might not be the actual problem you're facing.
Asking about your attempted solution rather than your actual problem
coral walrus
I think you misunderstand
heady hatch
heya. using pandas, is there a way to generate an empty dataframe if the code below doesn't return any values?
data = pd.read_excel(r'{path}\some_data.xlsx', sheet_name='any')
@coral walrus Could you clarify what you mean exactly here?
coral walrus
if I write
data = pd.read_excel(r'{path}\some_data.xlsx', sheet_name='any')
df = pd.DataFrame(data)
I'll create a new df and load it with the data I import from some_data.xlsx
but if there's no data in some_data.xlsx, df = pd.DataFrame(data) will fail
so I need to check first if any data is imported from the workbook, and if no data is imported, then I need to create an empty dataframe
heady hatch
If the excelsheet doesn't have any data in it, the read_excel should have no data in it.
In [2]: pd.read_excel('Workbook1.xlsx')
Out[2]:
Empty DataFrame
Columns: []
Index: []
I created an excelsheet without data, and as you can see.
coral walrus
I might know what I'm doing wrong. thanks for trying anyway @heady hatch 
hollow sentinel
fig = go.Figure(data=go.Chloropeth(
locations = states_idx,
#z = stateValues.astype(float)
locationmode = "USA-states",
colorscale = "Reds",
colorbar_title = "Restaurants per State",
))

fig.update_layout(
title_text = "States with the Largest Amount of Chipotle Restaurants",
geoscope = "usa")

fig.show
this gives me an error saying
AttributeError Traceback (most recent call last)
<ipython-input-6-33c0f5439965> in <module>
25 plt.show()
26
---> 27 fig = go.Figure(data=go.Chloropeth(
28 locations = states_idx,
29 #z = stateValues.astype(float)
AttributeError: module 'plotly.graph_objs' has no attribute 'Chloropeth'
i've looked for why and they suggested doing a bunch of import statements and pip install plot.ly
import pandas as pd
from matplotlib import pyplot as plt
import chart_studio.plotly as py
from plotly import graph_objs as go
import plotly.plotly as py
I genuinely have no clue on how to fix it I've gone to like the fifth page of Google too
@austere swift any ideas?
austere swift
its plotly express
hollow sentinel
what
austere swift
the graph objs one isnt really good for this purpose you should use the plotly express one
its in the using built in country and state geometries
hollow sentinel
import plotly.express as px
austere swift
yes, then px.choropleth
hollow sentinel
hollow sentinel
second example wehre
hollow sentinel
polar coordinates?
austere swift
no
hollow sentinel
oh
hollow sentinel
are you on this https://plotly.com/python/plotly-express/

Plotly Express is a terse, consistent, high-level API for creating figures.
austere swift
no
How to make choropleth maps in Python with Plotly.
the link i sent you earlier remember
you could create a second DF that just has [state abbreviation, state name, number of chipotles] as columns
then do something like this
import plotly.express as px

fig = px.choropleth(df, locations="state_abv", locationmode="USA-states", color="num_chipotles", scope="usa")
fig.show()
state_abv and num_chipotles being the names of the columns in your df
could be whatever you want
but the nice thing about px is that you dont need to do like df["state_abv"] for locations and color and stuff
you could just put the string and since the first argument is the df itll take the string index of that automatically
thats the basic idea, so you just need to preprocess the df and make a second df that just has the state abbreviations and the number of chipotles
which would be pretty easy
also you could include hover data, so that when you hover over it itll show the state name and the number of chipotles
that was probably a lot that i just said lmk if you need clarification on anything
hollow sentinel
I don't know how to create the new df
austere swift
so you created a variable with a list of the names of states and another one with the number of chipotles in each one right
austere swift
which one is the state names and which one is chipotles per state?
hollow sentinel
stateValues is chipotles per state
states_idx is state names
@storm sandal quit facepalming i'm new to this
austere swift
so you could create a dict then make a df from the dict
or you could make a df directly from the vars
but youd have to transpose the lists first if you wanna make a df directly from those
which isnt that hard tbh
hollow sentinel
how about I just not make a chloropath it sounds hard
lmao
I got no clue what to do
austere swift
its honestly a lot easier than it sounds
making a dict would probably be easer so you could do this
data = {"states": states_idx, "num_chipotles": stateValues}
df = pd.DataFrame(data)
yeah but doesn't it require states abbreviated
austere swift
oh yeah forgot abt that
you could find some dict online for states to state abbreviations

Gist
A Python Dictionary to translate US States to Two letter codes - us_state_abbrev.py
storm sandal
@hollow sentinel right there with ya. doesn't mean I can't cringe at your (or my own) expense.
austere swift
state_abbreviations = [us_state_abbrev[state] for state in states_idx]
then incorporate that in the above code
state_abbreviations = [us_state_abbrev[state] for state in states_idx]
data = {"states": states_idx, "num_chipotles": stateValues, "state_abv": state_abbreviations}
df = pd.DataFrame(data)
and you could save that df as a csv so you dont have to put that whole dict in your code
so you could preprocess it in the python shell or something then have the csv ready to import in your code
hollow sentinel
yep this is way over my head
lmao
it's not that complicated I must be burnt out
austere swift
so essentially the first line is a list comp to convert states_idx to state abbreviations, then the second line creates a dict for all the data, then the third line just makes a df from that dict
hollow sentinel
yeah it's saying that us_state_abbrev is not defined
austere swift
thats the dict from the link i sent you
you have to put that dict in your code somewhere too
austere swift
yeah thats why i'm saying you should just paste it in a python shell prompt and do all that code to make the df in ipython, then save it as a csv once then you can import it in your normal code
i gtg now but that should be enough to get you started
hollow sentinel
thank you @austere swift
arctic wedgeBOT
Hey @hollow sentinel!
Uh-oh! It looks like your message got zapped by our spam filter. We currently don't allow .txt attachments, so here are some tips to help you travel safely:
• If you attempted to send a message longer than 2000 characters, try shortening your message to fit within the character limit or use a pasting service (see below)
• If you tried to show someone your code, you can use codeblocks
(run !code-blocks in #bot-commands for more information) or use a pasting service like:
hollow sentinel
ValueError:
    Invalid value of type 'plotly.graph_objs.Choropleth' received for the 'data' property of
        Received value: Choropleth({
    'colorbar': {'title': {'text': 'Restaurants per State'}},
    'colorscale': 'Reds',
    'locationmode': 'USA-states',
    'locations': array(['California', 'Texas', 'Ohio', 'Florida', 'New York', 'Illinois',
                        'Virginia', 'Pennsylvania', 'Maryland', 'Arizona', 'Colorado',
                        'Minnesota', 'New Jersey', 'North Carolina', 'Massachusetts', 'Georgia',
                        'Washington', 'Indiana', 'Missouri', 'Michigan', 'Oregon', 'Kansas',
                        'Nevada', 'Tennessee', 'Connecticut', 'Washington DC', 'South Carolina',
                        'Kentucky', 'Wisconsin', 'Alabama', 'Oklahoma', 'Utah', 'Nebraska',
                        'Iowa', 'Louisiana', 'Delaware', 'New Mexico', 'Rhode Island',
                        'New Hampshire', 'Arkansas', 'West Virginia', 'Maine', 'Idaho',
                        'Montana', 'Vermont', 'North Dakota', 'Mississippi', 'Wyoming'],
                       dtype=object)
})
i think that's because it should be abbreviated state names
 empty cloud
Anyone have any problem with plotly
I tried it on vscode and jupyter but to no avail
It just shows a blank graph on Jupyter notebook online
Oh vscode it says module is missing even though I installed everything
 stable otter
Im quite new to machine learning/deep learning. I use pytorch and would like to work on some projects to get better. Any suggestions
lapis sequoia
Hey
i have like 40k of valid phone numbers and like 100k of invalid ones there is anyway to train the model and predict or generate like valid phone numbers ? with Reinforcement Learning or some kind of Machine learning ?
Thanks!
austere swift
@lapis sequoia well the thing is phone numbers dont really have a good pattern to figure out whether theyre valid or not
other than the area code theyre mostly random
so you can't really create a machine learning model to predict it or anything
@stable otter what projects are you looking to do?
stable otter
anything that can get me good practice and more experience in this area
i tend to forget what ive learned if i dont implement it
@austere swift
lapis sequoia
@lapis sequoia well the thing is phone numbers dont really have a good pattern to figure out whether theyre valid or not
@austere swift Yeah that's the problem but reinforsement learning i think will be good for this but how i can setup a environement ?
austere swift
reinforcement learning still wont work unless theres some sort of pattern
 sly grove

Computer Science Hub
Almost everyone is talking about how important is Programming or Statistic skills are for Data Science job, rather form my experience it's not that instead it's Writing Skills.
 vital yarrow
hello can anyone help me with the matplotlib library
my plot contains two y axes (implemented it as a subplot), and i cant find a way to make it so my two graphs doesn't overlap
messy graph, but i highlighted in blue where the red plot overlaps with the black plot.
i tried changing the y_lim of my axes but all it does is change the y axis range but the plot shape stays exactly the same (so it python just automatically scales it)
hasty grail
are you trying to plot one graph per subplot?
vital yarrow
er not quite sure what you mean by that im not really good at subplots (or matplot in general)
heres my code
im just making 1 figure that has two datasets plotted and 2 y-axes
and from what i see on google it seems like subplots can implement this with the ax.twinx() function so i went with it lol
hasty grail
Oh I have never tried doing that so idk, maybe someone else can help you
vital yarrow
hmm okay
i think the most odd part is no matter how i set my y limit python automatically scales my entire plot so that it fits with the figure. Id imagine i can make some artificial white space between the two plots if i change one of the y-axes range...maybe its just a subplot thing
 clear mulch
try to increase the figure size by using plt.figure(figsize=(10,10))
I hope this helps
 solid mantle
Any bayesians here?
 fierce shadow
hey, does anybody knows what should I keep as a loss function if I want to create a CNN which takes image as an input and returns image as ouput
and how can I make keras model return image in the first place?
hasty grail
if you're rescaling all of your pixels to the range [0, 1] you can get the model to output pixels in said range by using the sigmoid activatoin
as for the loss function you can use binary_crossentropy
 tawny oak
Hey everybody, I need your help, I have an excel table which has 10000 rows. each one has one sentence used different words and I want to find same meaning sentences on rows. For example 1000rows are about brake system on 10000 rows. or %10 is about brake system. how should i go? do you have any advice?
heady hatch
Hmm I can only offer couple machine learning methods.
You can take some form of vector representations of each sentences, reduce the dimension with SVD, and then use KNN.
Or you can go deep learning methods where you encode the sentences in some kind of embeddings and then calculate similarity based on those embeddings.
heady hatch
Hey guys question before I dive deep into a naive computation.
I'm creating a similarity search engine.
I have a huge dataset of text, I'm planning on encoding each text into Roberta's embeddings, then calculating similarities based on those embeddings.
However it's going to iterate through every single text embedding combination, ie text 1 embedding and text 2...
For all the text data, which I have around 2 million data points.
Is this how you guys would go about it?
hasty grail
You can try storing the embeddings in a cKDTree but as SciPy has mentioned:
For large dimensions (20 is already large) do not expect this to run significantly faster than brute force. High-dimensional nearest-neighbor queries are a substantial open problem in computer science.
I assume you're already vectorizing the calculations
heady hatch
Wait, to clarify. what do you mean by vectorizing the calculations?
As in the code to calculate similarity is vectorized?
On the other hand, I wonder if I can try my suggestion to the guy above.
Take the embeddings, reduce the dimensions, and then go from there.
hasty grail
As in the code to calculate similarity is vectorized?
Yes, aka you don't use for loops
heady hatch
Then yup, mhm!
hasty grail
Maybe you want to take a look at Locality-Sensitive Hashing
heady hatch
Thank you so much, looking into these algorithms now.
lapis sequoia
hey
can someone help me please ?? ❤️
im struggling like 2 hour's
import urllib.request
def isitup():
try:
if(urllib.request.urlopen("http://www.instagram.com").getcode()==200):
print("it's up")
except:
print("Error caught")
def getinstagram():
import json
import requests
inputuser_name = input("Username: ")
user=(inputuser_name + '_name/?__a=1')
solditems = requests.get('https://www.instagram.com/',user) # (your url)
data = solditems.json()
with open(input("Enter Filename: " 'wb') as f:
f.write(data)
getinstagram()
that's my source code
and i want to rename the save file with the inputuser name
but im getting a error.
 brittle agate

 halcyon vale

Day 43 of #66DaysOfData! with Ken Jee
In my journey of Natural Language Processing, Today I have read and Implemented about MLP Classifier, The Training...
vital yarrow
@clear mulch thanks for the tip but unfortunately it didnt solve my issue
if anyone has any other suggestions on how to make it so two matplotlib plots dont overlap plz ping/dm me
 ripe forge
Curious about where you hit these kinds of bottlenecks in python. The issue being, if it's a memory issue, no programming language can help, and if it's purely a performance issue, the python libraries that utilize C or similar low level code should have been sufficient I would presume. Having said that, I personally have no experience with julia
Interesting. A case this specific I'm curious how long Julia will take
The immediate issue I see is that you're having a decent amount of IO and then you're probably using native python datatypes for this computation.
Inherently python datatypes have to do a lot more checks for things like simple addition. It's one reason why numpy and pandas are usually recommended over native python for number crunching
So I can see the issue here. I'm curious how cython would fare
If you can rephrase your work into numpy arrays, it's definitely worth a shot.
(I just personally don't know how to do that here. Not too proficient at it)
Can't hurt to try, though the first issue is figuring out if this problem can even be expressed as arrays first.
My limited understanding of cython is that you could always just create and compile the function you were interested in for doing the dirty work
Leaving the rest of your code cython free and good to go as-is
 molten hamlet
my plot contains two y axes (implemented it as a subplot), and i cant find a way to make it so my two graphs doesn't overlap
@vital yarrow what exactly you mean bytwo graphs doesn't overlap?
vital yarrow
the blue circles are areas where my two plots overlap (the red plot and black plot)
im trying to either shift up the red plot or move down the black plot so theres no overlap (theres white space in between the peaks)
@molten hamlet
grave frost
@vital yarrow Why don't you just adjust the data points at that peak where is overlaps?
molten hamlet
@vital yarrow Why don't you just adjust the data points at that peak where is overlaps?
@grave frost cause it has to do same with axis
vital yarrow
i cant adjust individual datapoints since this data is for a lab report, i can only scale the data
i found out i was looking at the wrong axis so imma fix it and see if it solves my problem
ill ping you guys if i hit a deadend again
molten hamlet
yes but you could shift all data, and move axis to start at 0.05 or something
hollow sentinel
state =sample_data["state"]
stateValues = state.value_counts()
stateValues
#counts of each state is stateValues

states_idx = state.value_counts().index
states_idx
#each state name

plt.pie(stateValues, labels = states_idx,)
#labels are the state name

plt.title("States with the Largest Amount of Chipotle Restaurants")
plt.show()

x_pos = [i for i, _ in enumerate(states_idx)]
#each state name
plt.bar (x_pos, stateValues, color = "blue")
#create the bar chart
plt.style.use('ggplot')
plt.xlabel("States")
plt.ylabel("Restaurants")
plt.title("States with the Largest Amount of Chipotle Restaurants")
plt.xticks(x_pos, states_idx )
plt.show()
state_abbreviations = [us_state_abbrev[state] for state in states_idx]
data = {"states": states_idx, "num_chipotles": stateValues, "state_abv": state_abbreviations}
df = pd.DataFrame(data)

fig = go.Figure(data=go.Choropleth(
locations = states_idx,
#z = stateValues.astype(float)
locationmode = "USA-states",
colorscale = "Reds",
colorbar_title = "Restaurants per State",
))

fig.update_layout(
title_text = "States with the Largest Amount of Chipotle Restaurants",
geoscope = "usa")

fig.show
states = {
        'AK': 'Alaska',
        'AL': 'Alabama',
        'AR': 'Arkansas',
        'AS': 'American Samoa',
        'AZ': 'Arizona',
        'CA': 'California',
        'CO': 'Colorado',
        'CT': 'Connecticut',
        'DC': 'District of Columbia',
        'DE': 'Delaware',
        'FL': 'Florida',
        'GA': 'Georgia',
        'GU': 'Guam',
        'HI': 'Hawaii',
        'IA': 'Iowa',
        'ID': 'Idaho',
        'IL': 'Illinois',
        'IN': 'Indiana',
        'KS': 'Kansas',
        'KY': 'Kentucky',
        'LA': 'Louisiana',
        'MA': 'Massachusetts',
        'MD': 'Maryland',
        'ME': 'Maine',
        'MI': 'Michigan',
        'MN': 'Minnesota',
        'MO': 'Missouri',
        'MP': 'Northern Mariana Islands',
        'MS': 'Mississippi',
        'MT': 'Montana',
        'NA': 'National',
        'NC': 'North Carolina',
        'ND': 'North Dakota',
        'NE': 'Nebraska',
        'NH': 'New Hampshire',
        'NJ': 'New Jersey',
        'NM': 'New Mexico',
        'NV': 'Nevada',
        'NY': 'New York',
        'OH': 'Ohio',
        'OK': 'Oklahoma',
        'OR': 'Oregon',
        'PA': 'Pennsylvania',
        'PR': 'Puerto Rico',
        'RI': 'Rhode Island',
        'SC': 'South Carolina',
        'SD': 'South Dakota',
        'TN': 'Tennessee',
        'TX': 'Texas',
        'UT': 'Utah',
        'VA': 'Virginia',
        'VI': 'Virgin Islands',
        'VT': 'Vermont',
        'WA': 'Washington',
        'WI': 'Wisconsin',
        'WV': 'West Virginia',
        'WY': 'Wyoming'
}
KeyError                                  Traceback (most recent call last)
<ipython-input-8-f84fb4d75306> in <module>
     85 }
     86
---> 87 state_abbreviations = [us_state_abbrev[state] for state in states_idx]
     88 data = {"states": states_idx, "num_chipotles": stateValues, "state_abv": state_abbreviations}
     89 df = pd.DataFrame(data)

<ipython-input-8-f84fb4d75306> in <listcomp>(.0)
     85 }
     86
---> 87 state_abbreviations = [us_state_abbrev[state] for state in states_idx]
     88 data = {"states": states_idx, "num_chipotles": stateValues, "state_abv": state_abbreviations}
     89 df = pd.DataFrame(data)

KeyError: 'California'
does anyone know why i'm getting this key error for california
i tried taking it out and that didn't fix it
i need state abbreviations to create my chloropeth
key error happens when you refer to something that's not in the dictionary but california is clearly in the dictionary
odd yoke
you need to invert your dict
hollow sentinel
uhhhh
odd yoke
eg py {"Wyoming": "WY"}
hollow sentinel
ohhh so switch keys and values
odd yoke
dictionaries in python are a key/value map, they're not what's called "bi-directional", you can't get a key from a value (easily)
(you can but it's annoying and ruins the purpose of dicts)
hollow sentinel
ok so how do you invert it
odd yoke
name_to_abbrev = {v: k for k, v in states.items()}```ok thanks
---------------------------------------------------------------------------
KeyError                                  Traceback (most recent call last)
<ipython-input-10-f8d5727657f6> in <module>
     87 name_to_abbrev = {v: k for k, v in states.items()}
     88
---> 89 state_abbreviations = [name_to_abbrev[state] for state in states_idx]
     90 data = {"states": states_idx, "num_chipotles": stateValues, "state_abv": state_abbreviations}
     91 df = pd.DataFrame(data)

<ipython-input-10-f8d5727657f6> in <listcomp>(.0)
     87 name_to_abbrev = {v: k for k, v in states.items()}
     88
---> 89 state_abbreviations = [name_to_abbrev[state] for state in states_idx]
     90 data = {"states": states_idx, "num_chipotles": stateValues, "state_abv": state_abbreviations}
     91 df = pd.DataFrame(data)

KeyError: 'Washington DC'
yeah this is the other key error i ran into
i put in your snippet of code to reverse the keys and values
idk what's wrong this error has been chasing me for the past day
odd yoke
There is no Washington DC in your dict
hollow sentinel
Oh that’s sus
ok I’ll add it in
KeyError                                  Traceback (most recent call last)
<ipython-input-11-6bdf779ccf89> in <module>
     88 name_to_abbrev = {v: k for k, v in states.items()}
     89
---> 90 state_abbreviations = [name_to_abbrev[state] for state in states_idx]
     91 data = {"states": states_idx, "num_chipotles": stateValues, "state_abv": state_abbreviations}
     92 df = pd.DataFrame(data)

<ipython-input-11-6bdf779ccf89> in <listcomp>(.0)
     88 name_to_abbrev = {v: k for k, v in states.items()}
     89
---> 90 state_abbreviations = [name_to_abbrev[state] for state in states_idx]
     91 data = {"states": states_idx, "num_chipotles": stateValues, "state_abv": state_abbreviations}
     92 df = pd.DataFrame(data)

KeyError: 'Washington DC'
I added in a washington DC
 'SC': 'South Carolina',
        'SD': 'South Dakota',
        'TN': 'Tennessee',
        'TX': 'Texas',
        'UT': 'Utah',
        'VA': 'Virginia',
        'VI': 'Virgin Islands',
        'VT': 'Vermont',
        'WA': 'Washington',
        'DC': 'Washington',
        'WI': 'Wisconsin',
        'WV': 'West Virginia',
        'WY': 'Wyoming'
this is bothering me
hollow sentinel
I keep having a recurring error of KeyError: 'Washington'
when "Washington" : "WA" is already there
please ping me if you figure this out bc i have been staring at this for the past 2 hours and I still can't
grave frost
error is KeyError: 'Washington DC' yet I don't see Washington DC, only washington
velvet thorn
that didn't work either
@hollow sentinel why not just use asetcomprehension to find the elements present in one but not the other
hollow sentinel
@velvet thorn what’s set
velvet thorn
@velvet thorn what’s set
@hollow sentinel like alistbut it can only have unique elements
and unordered
hollow sentinel
@velvet thorn idk man I have no clue how to do that
I think I’m gonna give up on making a chloropeth and start doing beginner data science projects instead
velvet thorn
@velvet thorn idk man I have no clue how to do that
@hollow sentinel okay so like
state_abbreviations = [name_to_abbrev[state] for state in states_idx] isn't working, right
because there are keys in states_idx that are not in name_to_abbrev
so to find all those keys...
{state for state in states_idx if state not in name_to_abbrev}
lapis sequoia
I am currently working on a neural network and got the error: self._open(**self.request.kwargs.copy())
TypeError: _open() got an unexpected keyword argument 'channels'
I don't have an open function so I don't know how this error got associated here
lapis sequoia
Data scientist or developer
lapis sequoia
Ir data minner
 glossy osprey
Sorry?
lapis sequoia
Including English grammer
austere swift
@glossy osprey what kinda data science are you gonna try and go into?
like statistics, machine learning, etc
lapis sequoia
Me
austere swift
no xvandao
glossy osprey
I'm trying get in the date science
lapis sequoia
I dont like to be a developer its not interesting to make and design things
glossy osprey
I'm using the R and Python
Python I started 7 months ago
But I just learned the simple syntax
lapis sequoia
Then learn common packages
lapis sequoia
Poo or pee
austere swift
I think they mean OOP
glossy osprey
object-oriented programming
lapis sequoia
Poo 😂
austere swift
yeah OOP
glossy osprey
Kkkkkkkkk sorry
austere swift
its alr
glossy osprey
In Portuguese be poo
lapis sequoia
Ok
austere swift
well have you learned like statistics and stuff?
glossy osprey
"Programação orientada ao objeto "
"object-oriented programming"
Kkkkk
well have you learned like statistics and stuff?
@austere swift yes
Do you recommend to use Python or R?
austere swift
okay well once you have the math and stuff down you should start learning about the different methods and stuff to do data science
I havent used R that much and even when i did it was like 2 years ago so idk but either one would work
python is better if you wanna delve into like machine learning and stuff though
glossy osprey
There is a big discussion about who is the "better" here kkk
lapis sequoia
Whats r
austere swift
A programming language
austere swift
ml doesnt really need statistics that much, but sometimes the preprocessing for it does
ml is mostly calculus and linear algebra that you need to know
glossy osprey
I havent used R that much and even when i did it was like 2 years ago so idk but either one would work
@austere swift I'm I'm studying Science Economics and, in my college, We use very much the R
lapis sequoia
I know algerbra but i forget statistics
glossy osprey
When I beginned the college, I learned the python first
But now I'm using the twice languages
lapis sequoia
I learned java first
glossy osprey
I learned java first
@lapis sequoia it's great!!
lapis sequoia
Precisely two langs
 jolly plank
hello does anyone know pandas library
glossy osprey
Here is 2:23 A.M
jolly plank
in python
glossy osprey
Bye friends
austere swift
@jolly plank whats your question
jolly plank
I need help with a question that keeps on giving me an error
it requires pandas
here is the question screenshot
and here is my code that im having error on
@austere swift hello...
hello is anyone here
jolly plank
can someone help me
lapis sequoia
@jolly plank can you please send the error clearly? its too small to read
 bitter harbor
you've cut off your code but taxi_zones_pickup isn't a key
 proper fable
Hi, Im new at datascience. would you give me some hint about how can I explore the dataset from here
https://www.kaggle.com/claudiodavi/superhero-set#
I have to submit this exploration for my assignment that say
"Do exploration and make
up the question!"

How's your average superhero?