#data-science-and-ml
1 messages · Page 259 of 1
 velvet thorn
it'll come slowly
I think I am just confused about the general syntax for Dask. I have followed the documentation verbatim, but I am still being thrown errors
@jaunty cove it's not easy
take it one day at a time
 jaunty cove
I feel like Dask is a bit esoteric, do you know any good resources for beginners (other than the documentation)
velvet thorn
not relaly, sorry
I don't have much experience with dask
I mostly used Spark back then
jaunty cove
That's okay, thank you for your time!
velvet thorn
yw! hope it works out for you
 deft harbor
@jaunty cove if its 1tb you might want to start looking at things like spark
Also, what is the error. That's looks like what I would use to get it.
 bold ledge
Looking to hire some ML/stats/math guys to teach me some machine learning/stats concept for couple hours, about $30 an hr, let me know, willing to pay for couple hrs
jaunty cove
Also, what is the error. That's looks like what I would use to get it.
@deft harbor When I run that specific code it is not throwing error now, but it is taking a very long time.
deft harbor
1tb, I'd think so.
jaunty cove
I cut it off after a while, but it shouldn't be taking that ling (this set is only about 50gb)
deft harbor
My money is on the groupby but I'm not sure
Yeah, if you can do it with chunks in memory, it might be faster to use pandas
jaunty cove
Is there a more efficient way to perform the groupby()
deft harbor
I'm trying to think of something, but its not coming to me
 plucky zephyr
@jaunty cove both, lol
deft harbor
What chunk size are you using?
I've noticed playing around with that will really improve my performance
OK, its late. I need to sleep. Sorry I wasn't able to assist more.

jaunty cove
@jaunty cove both, lol
@plucky zephyr This article is pretty good at describing what you can do at a high-level, https://towardsdatascience.com/dont-overfit-how-to-prevent-overfitting-in-your-deep-learning-models-63274e552323
I would be cautious about adding more data to start with

Medium
Learn more about common strategies like unsupervised feature learning which can help you to prevent overfitting
How can I adjust the chunks, @deft harbor
 lapis sequoia

Medium
The 10 steps roadmap to kickstarting your data science future

Want to get into machine learning, but find maths tough?
Here are some resources that can help you.
🧵👇
Retweets
471
Likes
1522

 Twitter

How to Get Help with Linear Algebra for Machine Learning? Linear algebra is a field of mathematics and an important pillar of the field of machine learning. It can be a challenging topic for beginners, or for practitioners who have not looked at the topic in decades. In this p...
 mild topaz
2020 11:49:57.564284: I tensorflow/core/platform/cpu_feature_guard.cc:142] Your CPU supports instructions that this TensorFlow binary was not compiled to use: AVX AVX2``` royal thunder
mild topaz
royal thunder
mild topaz
2020 11:49:57.564284: I tensorflow/core/platform/cpu_feature_guard.cc:142] Your CPU supports instructions that this TensorFlow binary was not compiled to use: AVX AVX2```
why i am getting this error? can anyone help me to understand
mild topaz
have a patience bro... if anyone knows they will respond to us
 odd yoke
@mild topaz it's a warning, if you're using your gpu you can ignore it
mild topaz
i am using a cpu (win 10) @odd yoke
odd yoke
Ok, then you can either find a build that supports AVX, or still ignore it
AVX is a set of instruction that will your code run faster, but it's optional
mild topaz
Ok, then you can either find a build that supports AVX, or still ignore it
@odd yoke what is mean byfind a build that supports AVX?
odd yoke
You need tensorflow to be compiled with certain options to support it
Said option is not included when you pip install it
mild topaz
is it necessory that tensorflow to be compiled with certain options to support it ? @odd yoke
odd yoke
again, the AVX instruction set is entirely optional
it's just faster if you're using the CPU
odd yoke
it's not an error, it's a warning
mild topaz
ok now i get this
but i am not getting anykind of output printed on console?
see this @odd yoke
odd yoke
Dude I told you 23974923 times it's a warning, not an error, you can disable it with this https://stackoverflow.com/questions/48608776/how-to-suppress-tensorflow-warning-displayed-in-result

Stack Overflow
I have a python code connected with Tensorflow. It is supposed to return single result set. But i'm getting below mentioned warning along with result.
WARNING:tensorflow:From
C:\Users\vsureshx...
mild topaz
tf.compat.v1.logging.set_verbosity(tf.compat.v1.logging.ERROR) can i use directly this in my code ? @odd yoke
 sage palm
I want to write a program which calculates partial sums of :
Partial sum is:
I want to do this, until I have convergence. The convergence criteria is:
I have used days on this now.
I get the wrong results.. agian and again
 indigo obsidian
this is driving me crazy... why does list[n:n+4] return only 4 elements and not 5?
 pale thunder
the slice excludes the endpoint, just like range
[4,2,3][:2]
``` gets the first 2 elements, and it does not include `[4,2,3][2]`i have added tf.compat.v1.logging.ERROR this in my code then also i am getting warning message
2020 11:49:57.564284: I tensorflow/core/platform/cpu_feature_guard.cc:142] Your CPU supports instructions that this TensorFlow binary was not compiled to use: AVX AVX2```@pale thunder sorry to ping u can u look into this?
i have added
tf.compat.v1.logging.ERRORthis in my code then also i am getting warning message
pale thunder
I would guess the only way to get rid of this would be to compile it with that support, how that would be done idk
 odd dome
pl zjoin my server and dm for link
 zinc stone
@mild topaz it's just a warning, you can ignore it and your code will still work fine. the warning message only says tensorflow could be faster if you compile it yourself. https://stackoverflow.com/a/43555840
Stack Overflow
This is the message received from running a script to check if Tensorflow is working:
I tensorflow/stream_executor/dso_loader.cc:125] successfully opened CUDA library libcublas.so.8.0 locally
I
 grave frost
@lapis sequoia Did you augment the images?
mild topaz
@zinc stone i used tf.compat.v1.logging.ERROR this then also it is giving me warning message
grave frost
@mild topaz You are training it on CPU?
mild topaz
yes
grave frost
Then just ignore them, as foh suggested. There is no need to suppress them or anything
mild topaz
ok but then my code nothing prints in console? @grave frost
grave frost
Wdym?
mild topaz
@grave frost see this , nothing gets printed
grave frost
Can you post your error here with triple backticks? (`)
mild topaz
see actually i am not getting any error i am only getting warning message as shown in ss
grave frost
Yeah, just post that in here
mild topaz
2020 11:49:57.564284: I tensorflow/core/platform/cpu_feature_guard.cc:142] Your CPU supports instructions that this TensorFlow binary was not compiled to use: AVX AVX2```And the code too
grave frost
Where is TensorFlow used here?
mild topaz
tensorflow is not used then also i am getting warning message
grave frost
So you are trying to load a prettrained model?
mild topaz
yes
grave frost
Seems like a prob with your TF installation. Can you try building it with Bazel and a separate environment to test it out?
....If you don't have a GPU and want to utilize CPU as much as possible, you should build tensorflow from the source optimized for your CPU with AVX, AVX2, and FMA enabled if your CPU supports them. It's been discussed in this question and also this GitHub issue. Tensorflow uses an ad-hoc build system called bazel and building it is not that trivial, but is certainly doable. After this, not only will the warning disappear, tensorflow performance should also improve....
Source: Stack OverFlow answer
Or you could also post the exact steps you used to install TF on your computer
mild topaz
i have used pip install tensorflow @grave frost
grave frost
@lyric canopy Just follow this guide https://www.tensorflow.org/install/pip, if that doesn't work, build with bazel as previously suggested
mild topaz
what is mean by bazel ?
odd yoke
https://bazel.build/ it's a build tool

 pure sedge
how to request argument in pycharm variance= requests.get('variance')
grave frost
@mild topaz I had once tried installing with Bazel and had nearly cried following their guide. Rather follow some other Medium article for installation as they would probably guide you better with easy to read instructions
mild topaz
exactly medium articles are quite easy to understand
but now i get confused how i can remove or ignore this warning message? @grave frost
sage palm
What is the case, if a program just keep runing and never stop?
mild topaz
interept the kernel try using control + c key @sage palm
sage palm
i know how to stop it
but what could the reason be in my case?
def exp2(A,x,epsilon):

    # checked
    eta = np.max(-np.diag(A))

    # checked exp(-eta·x)·I
    last_partial_sum = np.exp(-eta*x) * np.eye(A.shape[0])

    # Defining P.
    P = np.eye(A.shape[0]) + (1/eta) * A

    n = 1

    while True:

         nth_power_of_P = np.linalg.matrix_power(P,n)

         nth_term = np.exp(-eta*x) * ((eta*x) ** n / factorial(n)) * nth_power_of_P

         nth_partial_sum = last_partial_sum + nth_term


         summ = 0

         for j in range(0,n+1):
             summ = summ + np.exp(-eta*x) * ((eta*x)**j /factorial(j) )
             j = j + 1


         if summ > 1 - epsilon:
             return nth_partial_sum

         last_partial_sum = nth_partial_sum

         n = n + 1
@mild topaz hmm, if the kernel cant start there might be some conflict between conda and default python. if you follow the install guide that @grave frost linked there's a section on using a virtual environment, that might help. then you can run spyder from inside that environment: https://stackoverflow.com/questions/30170468/how-to-run-spyder-in-virtual-environment#30170469
@sage palm maybe summ never gets > 1-epsilon and you get infinite loop?
mild topaz
@zinc stone let me check with it, Thanks
 frail arch
has anyone worked with tfrecords?
sage palm
@zinc stone i was thinking the same
sage palm
Does the above (imaginary ) function exists in python?
I do not want to do a for loop
pale thunder
sum(x**n/math.factorial(n) for n in range(1,10))
``` if x is defined before and you imported maththanks. but unfortunately did not work for what I was aiming at
Let us say this we in put x in some function. I want to find the smallest N such that x/2^N is in the interval [0,1].
 chilly geyser
Doesn't that just mean the closest power of 2 above x?
velvet thorn
Let us say this we in put x in some function. I want to find the smallest N such that x/2^N is in the interval [0,1].
@sage palm analytically?
zinc stone
not sure what you're after @sage palm but there's a minimize function in scipy you can construct arbitrary functions for https://docs.scipy.org/doc/scipy/reference/generated/scipy.optimize.minimize.html
sage palm
i think this works:
N = 0
    while True:
        xdown = x/2**N

        if xdown <= 1:
            break
        N = N + 1
asuming x≥0
zinc stone
ahh, now i get your question 😄
 silver rampart
may i ask what is the best "hello world" example for AI?
i want to see at least an example of how to simulate backpropogation with sigmoid functions and what not
pale thunder
mnist dataset handwritten digit recognition
silver rampart
the prerequisites i have watched up to this point is 3blue1brown's vid on it
@pale thunder tysm - would there be anything simpler than that? And which language would you recommend to write it in?
i heard that python is slow at doing AI since I should be using GPU acceleration like CUDA?
grave frost
@silver rampart Since your basics are not very clear, You can do Google's ML crash course. It's a extremely good resource. For you first ML task (after the course probably) , you can implement a simple linear regression problem or make a "perceptron" network. But models are all after learning the theory, else you won't be able to do new tasks. Better cover a course or two before getting started
pale thunder
handwritten digit recognition is about as simple as interesting problems get. You can do basic models in python with numpy fine, then you will want to use higher level frameworks like keras, scikit-learn and pytorch exactly for the CUDA acceleration. You could also just write CUDA directly, but that is pretty complicated to setup and is essentially some syntax strapped atop C++
grave frost
you will want to use higher level frameworks like keras, scikit-learn that is a bad way of introducing to ML, since it always ends up people being script-kiddies and just following implementations etc. without actually knowing anything. But I guess if someone wants to become a Data Scientist, then they may as well start lerning the higher libs first.
silver rampart
tysm
yea i keep seeing people claiming "i built a self-driving car" and its pretty much copied paste code from a team of Nvidia developer/ really abstracted code
@grave frost @pale thunder
thank you so much it looks very promising
pale thunder
I meant more that the knowledge needed to use cuda Is more than just the math behind ML, so once you start needing GPU speeds, it is better to use things already done for you than mess with the pita that is GPU programming
You should do the math in numpy/julia to start with though
 timid pine
grave frost
timid pine
grave frost
@timid pine What's the error?
lapis sequoia
Hey guys, not finding documentation on how to plot all the columns looking for outliers using seaborn. Anyone would like to guide me here?
 zenith slate
hi guys
does anyone know what's a good place to practice numpy / sci-py etc
I'm a software engineer just learning python on the side
 limpid oak
 arctic wedgeBOT
Resources
The Resources page on our website contains a list of hand-selected learning resources that we regularly recommend to both beginners and experts.
https://pythondiscord.com/pages/resources
 soft fiber
 raw mortar
Hey guys, not finding documentation on how to plot all the columns looking for outliers using seaborn. Anyone would like to guide me here?
@shesaidshe19#7761
https://seaborn.pydata.org/generated/seaborn.boxplot.html
plucky zephyr
can i ask code here?
trying tuning hyperparameter but still overfit 😦
 unkempt lintel
i want a script to analyse galaxy images that i download for the web
 wheat needle
i have a lot of files with formatting like
1 2
3 4
5 6
7 8
which are data at different time, how can i use matplotlib to make animated plot?
 tidal bough
Start by figuring out how to plot it in general. For animation, I prefer using https://github.com/jwkvam/celluloid/
wheat needle
@tidal bough ty! I was using gnuplot before, everything so different now
 shy lance
hello,
I need to do this for a Pandas series:
[1,2] + [3,4]
This returns [1,2,3,4]
I need the same but in Pandas series.
When I do + in 2 pandas series, it tries to add all elements.
found it pd.concat([s1, s2])
 vague bear
Hey I got a friend asking, if you need to code to get into data science
I'm still taking courses and I feel, yes, she needs to. But I don't know enough to confidently answer her
 orchid delta
@bold ledge yes lol (my bad) https://en.wikipedia.org/wiki/Matrix_multiplication

In mathematics, particularly in linear algebra, matrix multiplication is a binary operation that produces a matrix from two matrices. For matrix multiplication, the number of columns in the first matrix must be equal to the number of rows in the second matrix. The resulting ma...
It's a little different when you talk about the dot product of matrices, but they're essentially matrix multiplication
orchid delta
Different between transpose and inverse?
orchid delta
Transpose is flipping the (square) matrix along it's main diagonal
Inverse is a (square) matrix with which the product is the identity
They usually aren't equal
If they are, the matrix is called orthogonal
Basically a special kind of matrix with some properties
Say I have matrix
[1 2]
[3 4]
It's transpose would be
[1 3]
[2 4]
Everything on the bottom-left swaps with the one on the top-right
It's inverse, however, is
[-2  1  ]
[1.5 0.5]
You can try multiplying them together and you'll see the product is
[1 0]
[0 1]
In this case, the transpose is not the inverse, which means the matrix is not orthogonal
One trivial example for orthogonal matrix would be the identity matrix, whose transpose and inverse are both itself
bold ledge
so is a unitary matrix is also an orthgonal matrix
orchid delta
Iff the unitary matrix is real
Unitary matrix is where its conjugate transpose is its inverse
So if the unitary matrix is real, its conjugate transpose is the same as its transpose, which is its inverse
If the unitary matrix is not real, the conjugate transpose is different from its transpose, so transpose won't equal to inverse and therefore not orthogonal
bold ledge
orchid delta
Yep
bold ledge
so does real mean, no "i" 's
orchid delta
Yep. All the numbers are real numbers
bold ledge
so unitary matrix is a subset of orthognal matrixes
a special type of one
hmm not quite
some unitary matrixes (the real ones) are orthogonal
orchid delta
Yes
You can kinda say orthogonal matrices in real numbers is kinda like unitary matrices in complex numbers
bold ledge
so only a square matrix can an inverse be equal to its transpose
bold ledge
are you strong with the SVD?
haha
when calculating sigma, i understand the sigmas are the sq root of the eigenvalues, right? is it the eigenvalues of U or X in this case
and why is big SIGMA in sorted order of largest to smallest, or is it manually done
orchid delta
Lol I'm not strong with svd but I can take a look
bold ledge
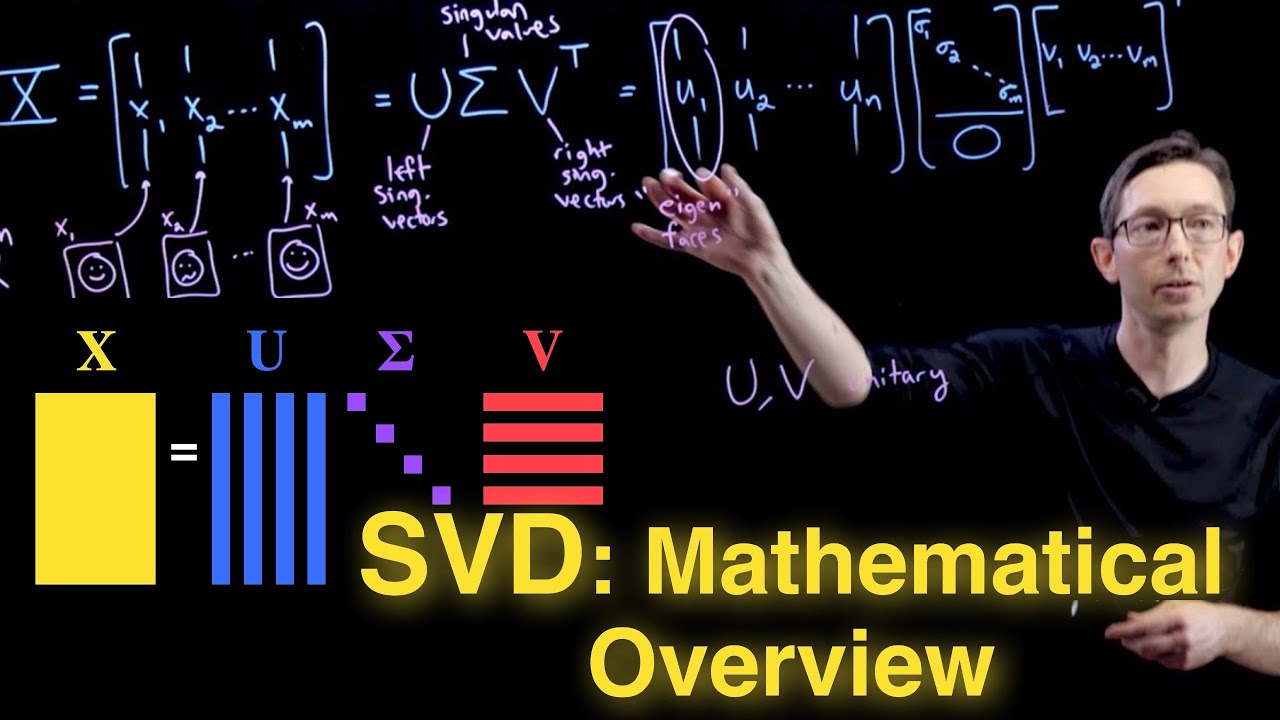
This video presents a mathematical overview of the singular value decomposition (SVD).
These lectures follow Chapter 1 from: "Data-Driven Science and Engineering: Machine Learning, Dynamical Systems, and Control" by Brunton and Kutz
Amazon: https://www.amazon.com/Data-Driv...
@orchid delta thats where the unitary stuff started haha
its time marked to 329 sec
orchid delta
I believe the sorting is by convention
Like, it's not required by calculation, but it's widely agreed that this should be sorted thusly
Which also means that if you use some libraries they likely will give/accept singular values in descending order
bold ledge
gotcha
do you know which singular values this is a matrix of?
X or U
and how U differs from X
( i get the linear algebra part where big SIGMA is altering the data of u)
its like an idenity matrix with all zeros from bot left and top right
and only on its diagonal value it has sigma values
so big SIGMA's top left value will be the highest value and thus "altering" U1 and making it more important
orchid delta
I believe it's the eigenvalue of the whole transformation. Let me double check
bold ledge
eigen values come from the "columns" of X right? does it have to be unique? or can they be duplicative
orchid delta
They're the square roots of the eigenvalues of X*X or XX*
Actually found that one on wikipedia: https://en.wikipedia.org/wiki/Singular_value_decomposition#Relation_to_eigenvalue_decomposition

In linear algebra, the singular value decomposition (SVD) is a factorization of a real or complex matrix that generalizes the eigendecomposition of a square normal matrix to any
    m
    ×
    n


{\displaystyle m\times n}
matrix v...
bold ledge
ahh
V is the right signualr vector eigen vectors
of M*M
and U is left singuarl of MM*
orchid delta
Right
bold ledge
@orchid delta so in eigendecomposition
we multiple u inverse on both sides so we get A by itself
so then for SVD, is the V just an inverse of U
?
if so why not just call it U inverse
orchid delta
V is not the inverse of U
A is different from the M/X we saw before
A is a normal matrix, M/X was not necessarily normal
M/X was also not necessarily square
If you have questions about matrices, maybe the mathematics server can answer your questions better
 jovial parcel
how to enter the field of datascience? Any course?
deft harbor
Stats
lapis sequoia
How to make my xtick-labels horizontal? When i rotate they overlap each other and makes it unreadable. Also how do I get the Revenue and Has_store also show? It it some mask thing?
Shoud look like this
raw mortar
@lapis sequoia the label is rotating because its too long, you can use the set_xticklabels on the heatmap to rotate it
something like this
import numpy as np
import seaborn as sns
from matplotlib import pyplot as plt

np.random.seed(0)
data = np.random.rand(10, 12)
x_label = list(range(0,12))
y_label = list(range(0,10))

ax = sns.heatmap(data)
ax.set_xticklabels(x_label, rotation=90) #<---
plt.show()
fig, ax = plt.subplots(figsize=(12, 10))

# Color map.
cmap = sns.diverging_palette(0, 230, 90, 60, as_cmap=True)

#Plot heatmap.
matrix = np.triu(df_stores.corr())
heat_map = sns.heatmap(df_stores.corr(), annot=True, mask=matrix, fmt=".2f",
           linewidths=5, cmap=cmap, vmin=-1, vmax=1,
           cbar_kws={"shrink": .8}, square=True)


x_label = list(range(0,12))
y_label = list(range(0,10))
heat_map = set_xticklabels(x_label, rotation=90)

# title
title = 'CORRELATION MATRIX'
plt.title(title, loc='center', fontsize=18)
plt.show()```Not getting it to work
raw mortar
it should heat_map.set_xticklabels(x_label, rotation=90) for you
x_label should be the labels from your dataframe
lapis sequoia
Ok thanks
lapis sequoia
I'm doing correlation among the features to predict the best city of building a new IKEA store and my correlation showed that theres a strong correlation among 'Revenue' and 'Population' as you can see in the code.
However how do I go own to check just the correlation with cities that already have an IKEA store denoted with 1 in 'Has_store'?
lapis sequoia
df_stores['Has_store'] == 1 would just return true or false in the new column
raw mortar
@lapis sequoia use it as a condition to filter the main dataframe, like
df_stores[df_stores['Has_store'] == 1]
df_stores['Only_ikea'] = df_stores[df_stores['Has_store'] == 1]
ValueError: Wrong number of items passed 11, placement implies 1
raw mortar
df_stores['Only_ikea'] = df_stores[df_stores['Has_store'] == 1]
@lapis sequoia this is basically trying to store the results which might be many columns into another column called Only_ikea, which will not work out
create a new dataframe(variable) and store the results in it
df_stores_only_ikea = df_stores[df_stores['Has_store'] == 1]
Thanks. I saw the documentation now, finally and it was similar to yours however like this :
stores_only = df_stores[(df_stores["Has_store"] == 1)]
with ( ) appears to be the same output. Any real difference under the hood?
raw mortar
brackets are only required when you have multiple filter conditions for example
df_stores[(df_stores["Has_store"] == 1) & (df_stores["Border"] == 1)]
Like this?
stores = df_stores[(df_stores['Has_store'] == 0) | (df_stores['Has_store'] == 1)]
OR statement that we filter on those conditions, then we used those parenthesis?
velvet thorn
yes.
because & and | have higher precedence than ==, so if you don't use parentheses then you'll get df_stores['Has_store'] == (0 | df_stores['Has_store']) == 1.
 idle root
is there anyone here who did andrew ng machine learning course on coursera ?
i just need to ask couple of questions. dm me if possible
mild topaz
hello i have a code when i run it , it works fine but on output on predicted image
it does not show classname and probability value
my code here https://paste.pythondiscord.com/irukepiwew.py
also i am following this tutorial https://www.youtube.com/watch?v=SWaYRyi0TTs&t=874s

Train and classify Traffic Signs using Convolutional neural networks This will be done using OPENCV in real time using a simple webcam . CNNs have been gaining popularity in the past couple of years due to their ability to generalize and classify the data with high accuracy. ...
my output this way
it is only showing class and probability value but not exactly showing which class it belongs to and probaility value
raw mortar
@mild topaz it might not be satisfying this condition
if probabilityValue > threshold:
just print out classIndex and probabilityValue and see what you get
mild topaz
@raw mortar python 2020 11:34:56.700811: I tensorflow/core/platform/cpu_feature_guard.cc:142] Your CPU supports instructions that this TensorFlow binary was not compiled to use: AVX AVX2
also nothing gets printed on console
see this @raw mortar
raw mortar
@mild topaz your cpu might not be supporting tensorflow
which cpu is it ?
mild topaz
i guess i am using intel i3 @raw mortar
raw mortar
and tensorflow verison ?
mild topaz
can u help me to get the tensorflow version? how i can get it?
raw mortar
@mild topaz
import tensorflow as tf
print(tf.__version__)
1.14.0 @raw mortar
raw mortar
@mild topaz not sure if it a warning or an error, can you run your script from the terminal and send the output message
mild topaz
u mean i should run it through cmd ? @raw mortar
raw mortar
yep start cmd, navigate to the directory and run python filename.py
mild topaz
E:\demo3>testing_image_classification.py
Using TensorFlow backend.
Traceback (most recent call last):
  File "E:\demo3\testing_image_classification.py", line 14, in <module>
    model = pickle.load(pickle_in)
  File "C:\Users\Admin\AppData\Local\Programs\Python\Python38\lib\site-packages\keras\__init__.py", line 3, in <module>
    from . import utils
  File "C:\Users\Admin\AppData\Local\Programs\Python\Python38\lib\site-packages\keras\utils\__init__.py", line 6, in <module>
    from . import conv_utils
  File "C:\Users\Admin\AppData\Local\Programs\Python\Python38\lib\site-packages\keras\utils\conv_utils.py", line 9, in <module>
    from .. import backend as K
  File "C:\Users\Admin\AppData\Local\Programs\Python\Python38\lib\site-packages\keras\backend\__init__.py", line 1, in <module>
    from .load_backend import epsilon
  File "C:\Users\Admin\AppData\Local\Programs\Python\Python38\lib\site-packages\keras\backend\load_backend.py", line 90, in <module>
    from .tensorflow_backend import *
  File "C:\Users\Admin\AppData\Local\Programs\Python\Python38\lib\site-packages\keras\backend\tensorflow_backend.py", line 5, in <module>
    import tensorflow as tf
ModuleNotFoundError: No module named 'tensorflow'``` @raw mortar@mild topaz are you running this script in the same environment where tensorflow is installed ??
@mild topaz try
python testing_image_classification.py
mild topaz
pls see
@raw mortar
can u explain here running this script in the same environment where tensorflow is installed ?? ? what mean by this? @raw mortar
raw mortar
you got the no module name tensorflow, so
pls see
@raw mortar
@mild topaz these seem like warnings from tf, which you can ignore for the most part
what are those numbers you're getting at the bottom
class and probability values ??
mild topaz
see i have not created any virtual environment . i am using same version of tensorflow for different project also and works fine... not gettong any kind of warning
raw mortar
and you dont need a while loop to test 1 image
mild topaz
what are those numbers you're getting at the bottom
class and probability values ??
@raw mortar i guess so ...
raw mortar
try to remove the code block out of the while loop and print the class and probability
mild topaz
@raw mortar ok let me do this ..
try to remove the code block out of the while loop and print the class and probability
raw mortar
@mild topaz comment out everything from and below the while loop and run this
test_img = cv2.imread(r"E://demo3//india//1//rrrr.jpg")

img = np.asarray(test_img)
img = preprocessing(img)
img = img.reshape(1, 99, 200, 1)

predictions = model.predict(img)
classIndex = model.predict_classes(img)
probabilityValue = np.amax(predictions)

print(f'class {str(classIndex)}')
print(f'probability {str(probabilityValue)}')
i want to display the probability value on image also @raw mortar
raw mortar
replace the print statements with
cv2.putText(test_img, f"class: {str(classIndex)}", (20, 35), font, 0.75, (0, 0, 255), 2, cv2.LINE_AA)
cv2.putText(test_img, f"probability: {str(probabilityValue)}", (20, 75), font, 0.75, (0, 0, 255), 2, cv2.LINE_AA)
cv2.imshow("result", test_img)
not sure about the coordinates and fonts size, copied it from your code, you might have to tweak it a little bit
 flat patrol
quick question: What type of regularization methods are there to use for logistic regression?
mild topaz
replace the print statements with
cv2.putText(test_img, f"class: {str(classIndex)}", (20, 35), font, 0.75, (0, 0, 255), 2, cv2.LINE_AA)
cv2.putText(test_img, f"probability: {str(probabilityValue)}", (20, 75), font, 0.75, (0, 0, 255), 2, cv2.LINE_AA)
cv2.imshow("result", test_img)
not sure about the coordinates and fonts size, copied it from your code, you might have to tweak it a little bit
@raw mortar let me do this
raw mortar
quick question: What type of regularization methods are there to use for logistic regression?
@flat patrol i could remember trying out ridge and lasso long time ago, but have totally forgot about the specifics 😅
mild topaz
@raw mortar works fine on CMD
but when i run it through spyder everytime warning showing
raw mortar
@mild topaz you can ignore the warning, just see if you get the requried output correctly
flat patrol
@flat patrol i could remember trying out ridge and lasso long time ago, but have totally forgot about the specifics 😅
@raw mortar thanks, will have a look at it
mild topaz
you can ignore the warning, just see if you get the requried output correctly
@raw mortar okay output i am getting is of prediction of an image based on trained model
raw mortar
good 👍
sage palm
How can I see more digits in the following calculation?:
expm(A)
Out[36]:
array([[0.3659571 , 0.35453832, 0.27950458],
       [0.36527461, 0.35510049, 0.27962489],
       [0.36551524, 0.35489926, 0.27958549]])
expm(A) is the matrix exponential of A.
 ripe forge
Stack Overflow
I'm curious, whether there is any way to print formatted numpy.arrays, e.g., in a way similar to this:
x = 1.23456
print '%.3f' % x
If I want to print the numpy.array of floats, it prints several
mild topaz
@raw mortar thanks for co ordination bro!
sage palm
@ripe forge Thanks, but I can see what to doo.. hmmm
ripe forge
oh, uh, basically, you are getting an array as output
so, first, set the numpy settings to whatever precision you need, and then wrap that output in a print call
for example:
import numpy as np
np.set_printoptions(precision=16)
print(expm(A))
see if that works.
sage palm
Thanks, it work! You a lifesaver
sage palm
**If I have two matrices, how can I see fast how many decimals the have in commen entry-wise ? **
44 terms
exp2(A,x,epsilon) =  [[0.3659571021214034  0.3545383191246071  0.27950457875398904]
 [0.36527461273877404 0.35510049357868667 0.2796248936825393 ]
 [0.36551524259587437 0.3548992639102575  0.27958549349386824]]
expm(A) = [[0.3659571021214031  0.3545383191246067  0.27950457875398876]
 [0.36527461273877354 0.355100493578686   0.27962489368253873]
 [0.36551524259587376 0.35489926391025695 0.27958549349386774]]
 earnest forge
Take any number from matrix and, make it a str and find its length?
sage palm
oh, I mean. If we have x=2454 and y = 2453, then these two numbers have 3 digits in common.
mild topaz
i am not able to create virtual env ```python
PS E:\demo3> virtualenv demo3
PS E:\demo3> .\demo3\Scripts\activate
.\demo3\Scripts\activate : File E:\demo3\demo3\Scripts\activate.ps1 cannot be loaded because running scripts is
disabled on this system. For more information, see about_Execution_Policies at
https:/go.microsoft.com/fwlink/?LinkID=135170.
At line:1 char:1
- .\demo3\Scripts\activate
-
  + CategoryInfo          : SecurityError: (:) [], PSSecurityException
  + FullyQualifiedErrorId : UnauthorizedAccess```
lapis sequoia
hey am trying to get a pc for training deep learning models Ik it needs gpu but please i have restriction on my budgets can someone suggest me some parts(am trying to build one )
 molten hamlet
can someone guide to to nice tutorial of image segmentation and face recocnition? ^^
 surreal nacelle
Hey, I'm reading this kaggle notebook: https://www.kaggle.com/janiobachmann/credit-fraud-dealing-with-imbalanced-datasets/ and there is something I don't understand, I was hoping one of you would help me figure it out.
From [13] to [17], the author first look at the correlation matrix, select the 8 strongly positively/negatively correlated features, plot them using boxplots, and then only select 3 out of the 8 with the strongest correlation (neg or pos) and removes outliers for these features, but there isn't any explanation as to why he didn't remove the outliers for the other 5 ?
Care the enlighten me ?
Thank you

Explore and run machine learning code with Kaggle Notebooks | Using data from Credit Card Fraud Detection
bold ledge
in dimentionality reduction, on the bottom,
how do i know the 6.71 stretches the circle horizontally and the the circle .44 vertically
how do i read sigma properly
 charred crescent
guys, which library is the best one to web scrapping?
I heard a lot about scrapy, its better than beautiful soup and selenium?
 merry field
I want to make a program that sorts pictures into categories. For example it can tell if the picture is a cat, dog, human, or car and if it cannot tell what it is it puts it in another folder where the user can tell what it is. Any clue as to where I could start? I have tried looking online but can't find anything apart from predictions.
surreal nacelle
Look into YOLO
You only look once (YOLO) is a state-of-the-art, real-time object detection system.
merry field
Thanks!
surreal nacelle
Sure thing
merry field
Also is it possible to add custom definitions for objects?
surreal nacelle
I've never used YOLO so I wouldn't know
merry field
oh ok
sage palm
Can someone try to run my script and write jordan_time(A,x) in the console?
arctic wedgeBOT
Hey @sage palm!
It looks like you tried to attach a Python file - please use a code-pasting service such as https://paste.pythondiscord.com
Hey @sage palm!
Uh-oh! It looks like your message got zapped by our spam filter. We currently don't allow .txt attachments, so here are some tips to help you travel safely:
• If you attempted to send a message longer than 2000 characters, try shortening your message to fit within the character limit or use a pasting service (see below)
• If you tried to show someone your code, you can use codeblocks
(run !code-blocks in #bot-commands for more information) or use a pasting service like:
sage palm
Can someone try to run my script and write jordan_time(A,x) in the console?
and hit enter.
 smoky meadow
 fast bluff
Is there a simpler way to do this??
    class Pos(object):
        def __init__(self, qty):
            self.qty = qty

    x = {'qty':'0'}
    vvpr_pos = Pos(**x)

vvpr_pos.qty```and how can I make the 0 and int??? if I dont make it a string I get an error, but if I do, I get errors elsewhere..
 oblique vine
Hello
I am trying to make something like "keyword detection" in Python. However, in my case, its always pretty constant microphone input (I use the same device, its only my voice and noises are pretty much the same)
I have tried https://snowboy.kitt.ai/, but it was extremally inaccurate (and, as far as I know, it doesnt let me teach the model further)
So I am looking for an alternative. Restrictions:
-FREE (completely free, cause I have already used my google, azure etc free credits)
-working :))
Can anyone suggest me something? (I can google it myself, but I would have to test every single one, that would be rather boring)
Thing I should mention is: it has to trigger while I'm talking with on discord with friends, so there is pretty large amount of my voice that should not trigger the keyword detection
(pls, mention me if you answer)
oblique vine
well, Im complete newbie, so it would take a lot of time and effort :D
(however, I will probably do it)
 winter portal
Is it possible to use machine learning for profane filters?
People always find a way over it
winter portal
Like if the filter detects fuck
velvet thorn
if you want to filter on intent
winter portal
If I write fu ck it doesn't do nothinf
however, it's a complex task
@velvet thorn
How to start
velvet thorn
how...to start...?
winter portal
I don't know machine learninf
velvet thorn
well
get a good grounding in the foundational mathematics
statistics, linear algebra, calculus
winter portal
Dude am still in high school
winter portal
Its gonna take me 2 more years to complete
velvet thorn
I mean, machine learning is not a simple thing
winter portal
Why not
velvet thorn
what do you mean why not
winter portal
Why is it hard
velvet thorn
hm.
okay, so there are many libraries available nowadays that make it a lot easier and simpler than it was
to build something if you know what you're going to build and it's a relatively solved problem.
so in that sense, not that hard.
winter portal
Okay
velvet thorn
however, without an understanding of the underlying principles, it'll be difficult for you to solve problems that are more novel, or to debug.
which is why I said...mathematics.
and a fair bit of computer science
velvet thorn
just Google it, there are a ton
winter portal
I want to see how hard it is
velvet thorn
how old is high school anyway?
velvet thorn
age.
winter portal
15
winter portal
Okay I just saw that Maths plays a very important role in machine learning. I will start concentrating on Maths lol
Thanks
velvet thorn
yw
 keen grove
homework demands me to describe some hyperparameters that can be adjusted to render better results from a NN model, but i only managed to expose 3 other than activation functions: hiddenlayers density, sample size and input vector dimension.
Can anyone recommend me some books or articles to read? I've been trying some Springer books but the NN statistical learning ones are extensive, and right now I only need to do some skimming to get the superficial outlook of the process to give a satisfactory answer.
 young veldt
Are there any web-based data analysis tools that let you set up an environment and start crunching data using SQL and Python? Like Cloud9 but for data analysis?
Thanks!
 dense nova
@young veldt check out Jupyter Notebook, might be what you're looking for
 plain thicket
which is best freemium api to make chatbot?
grave frost
@winter portal I am of the same age 🙂 ML is isn't the most difficult task to do if you just follow some tutorial online, but the real effort is in the part where you actually understand how it all works under the hood. Even when I was new, a lot of mathematics I couldn't understand then (and can't even today) so I had to go out of my way to get articles that explained the things a lot simpler. Nowadays it is much easier since in those couple of years YT videos are just everywhere.
My recommendation is to first not to start making you own models but just follow a course, read simple-to-understand Medium articles, and watch YT video (especially two-minute papers) to have a general understanding of the applications of Machine Learning. 3Blue1Brown videos are really outstanding for learning Neural Networks from the ground up (there is a whole series on them). But that main thing is to maintain your passion - don't just do ML like you are studying for an exam or something, just follow your passions and do what interests you. Find a topic difficult? leave it. Have a query? ask it here!
When you have built up some fundamentals, then you can start making some models. For that, I recommend Google's ML crash course. It's just full of interactive animations and teaches in such a way that you really think and ponder about it. and explains everything very simply.
Above all, just keep doing what you love and don't just lose hope if you don't understand anything. We are always here!
@young veldt Lookup Colab it has powerful notebooks for your requirement and is in the cloud (so all your code and graphs remain in your drive). It requires 0 setups or installation and it is customizable - so you can install any package you want on it. It is just like a Jupyter Notebook as Dasketch suggested, but its major advantage is free CPU/GPU resources (if you ever need it) and no code/experiment is ever lost + it already comes with DS packages preinstalled...
mild topaz
hi sorry to ping u @grave frost
my training process this way
can u please help me to understand, weather my training process is going correctly or not?
velvet thorn
@mild topaz doesn't look like it's learning
accuracy isn't going up
loss is barely changing
lapis sequoia
Hello, I am using Rasa open source for my project how do I find the latest solution for hosting multiple apps on one server, I had this link but this is very old so can someone help me with how can we do it in the latest releases https://legacy-docs.rasa.com/docs/nlu/0.12.0/http/#serving-multiple-apps
I do not want to host multiple bots on saperate ports because it will affect the performance of the system, if anyone has experience with Rasa please help. Thanks in advance.
mild topaz
doesn't look like it's learning
@velvet thorn sorry to ping u here, can u help me here that how u came to know that it is learning ?
 red hound
I have a task of comparing data values from softmax function + cross entropy loss with sigmoid + mean squared loss for a multi class classification. However, I have not seen a single example using sigmoid + mean squared loss. Is it actually possible? I have seen examples with sigmoid and cross entropy and that could be one way of comparing the values but I am not sure about mean squared loss. Any help or guidance is appreciated!
 sand escarp
Hello guys,
Can you suggest some resource where I can learn statistics and probability from the ground up. Doesn't necessarily have to include programming (or python). Preferably with high mathematical detail.
Thanks
 desert oar
@red hound mean squared loss makes no sense for classification
I mean, it kind of does
It's actually a proper scoring rule iirc
But it's not commonly used
You would basically be taking the main square difference between the predicted probability and the actual class assignment, as a 1 or 0
@red hound ^
In this context it's better known as "Brier score"
Rather, it's an affine transform thereof
 neat orchid
someone knows where there are beginner chats?
lapis sequoia
red hound
@desert oar Thanks for the reply.
 verbal ice
Hi everyone
If my population distribution is skewed i cant do an anova test? It says one of the assumptions is the popultion distribution has to be normal (central limit theorem holds true)
And if its not normally distributed is it possible to standardise the data before conducting an anova test or would it give me wrong results?
grave frost
@lyric canopy Did you do the image augmentation?
 merry ridge
I'm not really a statistician, but ANOVA is typically considered fairly robust and gives good results even if the normality assumption is violated. You should be more concerned about whether your data set satisfies homogeneity of variances, but in that case you can use Welch's test to get around it
verbal ice
And to test for equal variances is it correct to take samples from the dataset and test those for equal variances using scipy.stats.levene?
merry ridge
I don't know - this is kind of out of my area of expertise. Off the top of my head, I believe that tests like Levene's test are similar in the sense that they require normality but are also robust when they are not but would probably work fine
I would have just used Welch's and not bother with any of this, but if Levene's strongly accepts the equal variance hypothesis, I see no reason not to proceed, but I haven't seen your data
verbal ice
Alright thanks !
molten hamlet
is there library for ocr? 😛
grave frost
@molten hamlet Train a custom ML model to constantly take screenshots, crop the unecessary part and recognize it. For that dataset, you will probably have to hand-label around 60-70 images (if the text changes). If you just have to find your own name in a screenshot then it would probably be much easier. Would you mind explaining what you want to accomplish so that we can help you accordingly?
molten hamlet
read nicknames basically, as you see its croped, but you want me to crop even more I guess
 sand marsh
Have a question: Next year I need to start any type of personal project at high school and, because I always liked the idea of programming stuff I decided this year to learn coding python to start with. What I was thinking is to do a virtual assistant like siri, cortana,... Is that too easy or too difficult? hahahah no idea what level I am need to reach doing this.
 austere swift
well it depends on how you wanna make it
if you want it to have specific commands that you say and itll do some stuff that would be pretty simple
but if you want it to be like an AI and be able to understand whatever you say that would be more difficult
austere swift
honestly idk i've never tried
ive done ones that just take normal commands and do stuff but never any AI in them
sand marsh
I would give it a try and let´s see what I can do hahaha
that´s cool, took a lot of time?
austere swift
no that was pretty simple
theres a speechrecognition library in python you can use
but the one I did didnt actually like listen constantly and wake up with a specific keyword like alexa would, you ran it and then spoke into it
sand marsh
ooh I understand
austere swift
having it wake up likely wouldnt be that hard
austere swift
honestly when i was learning ml i didnt really read any books
it was an assortment of reading documentation, papers on model architectures, and just messing around with the code on my own
so yeah idrk any good book recommendations
i've heard good things from the coursera machine learning course though

Coursera
Learn Machine Learning from Stanford University. Machine learning is the science of getting computers to act without being explicitly programmed. In the past decade, machine learning has given us self-driving cars, practical speech recognition, ...
sand marsh
but u needed to have a very good base of programming and understanding of ai
austere swift
Yeah
austere swift
I was pretty good in programming before getting into ai
sand marsh
the thing is I´m not as good and I think I am entering a very diffiult zone
austere swift
and you have to have a pretty good math background too
calculus and linear algebra are the main things you need to know
sand marsh
uf I am starting to don´t see a good future to this project hahhah
another question, if u needed to do a "personal project" focused on a medium level of programming
what would u recommend?
very diffult question ik hahah
austere swift
that just depends on what you're interested in
personally I did a lot of robotics projects in middle school since I'm really interested in robotics
in fact that voice assistant thing was actually a voice controlled robot
so you could try going into that, its a lot more simple than learning ml/ai
and if you wanna start learning that stuff in the future you can do a lot of stuff with incorporating ml into robotics
sand marsh
think I am going to go for that really
yeah, yeah
just for interest, since when have u been programming?
austere swift
started learning in abt 5th grade lol
sand marsh
u just seem to know much about this
austere swift
it took a lot of studying and work but i don't regret it a single bit
austere swift
yeah
austere swift
Np
 lone tartan
Hi, is there any way to reduce Log Loss when predicting data?
I use log regression and random forest test
earnest forge
How can I write this text using LaTeX without miscellanous symbols? I just want to past text in two lines
jaunty cove
Does anyone know how to change the chunk size when using Dask?
 heady hatch
I'm somewhat okay at hello world, I'd say shoot your questions on pandas and someone might be able to answer it?
heady hatch
When you say put the bottom market cap above, do you mean you want to combine the dataframe below and above?
If so, do they all share the same ticker?
If they do all share the same ticker, I would look into pd.merge.
https://pandas.pydata.org/pandas-docs/stable/reference/api/pandas.DataFrame.merge.html
I think pd.concat would work as well, but you'll need to do a bit of transformations.
Are you referring to the top dataframe?
Based on what I'm seeing with your dataframes, I think it's because Ticker is an index instead of a column.
Hey it's good that you're looking into it yourself.
Not much.
Only use it for exploratory data analysis now.
ML.
But I think the field varies.
Some people I know use it a ton, sometimes even convert Jupyter notebook to product.
And with it, Pandas.
But Pandas often isn't very efficient.
It's good to quickly manipulate and understand what the data looks like though.
However the memory usage is kinda rough since everything needs to fit into memory.
What kind of project are you looking into?
hahaha
Nope.
I'm assuming you're going to be working with time series data?
2500 tickers don't sound too bad.
how many columns?
I'd say try it. Might be possible still.
Unless your RAM is less than 1 or 2 GB.
Oh then yea, definitely give it a try.
Are you familiar with time series analysis like ARIMA?
What kind of project are you trying to do?
Are you predicting stock prices?
Ahh okay okay.
Ahh, yea try to replicate the paper first.
See if you understand what they're doing.
 solid mantle
Hello
Sympy does not automatically evaluate sin(n.pi) = 0
How do I get a numerical solution out of this symbolic expression?
 boreal summit
Anyone here recommend a good, not too complex book that teaches a grip on machine learning or deep learning.
I already have basic idea using scikit learn and stuff. Just need something to push further.
earnest forge
https://github.com/jakevdp/PythonDataScienceHandbook/tree/master/notebooks
take a look at notebooks named 05.xx. these are exempts from Python Data Science Handbook. Even though It contains basic, but informative examples

GitHub
Python Data Science Handbook: full text in Jupyter Notebooks - jakevdp/PythonDataScienceHandbook
tidal bough
Sympy does not automatically evaluate sin(n.pi) = 0
@solid mantle Probably you didn't specify that n is an integer, though I have no idea how to do that in sympy.
pale thunder
n = symbols('n', integer = True) try this
grave frost
@boreal summit I already have basic idea using scikit learn and stuff. Just need something to push further. It is better to learn the basics of ML/DL first than to just master a library. If you find courses and other things boring, pick some task you want to do and just research all the ins and outs about it in-depth. Slowly as you do more and more tasks you will start understanding ML...
 polar cipher
So what setup are people using when running CNN experiments involving thousands of samples?
Ive been using tensorflow in a jupyter notebook
austere swift
I use different packages depending on the kind of data and how big the set is lol
sometimes pytorch, sometimes tensorflow, and sometimes keras
keras for the small stuff, pytorch for the big stuff, and tensorflow gets thrown in every so often
I might try using dask or spark for some of the really big stuff to parallelize it and stuff, but i havent used them yet
boreal summit
@grave frost thanks for the advice.
 keen root
Does anyone know any open source tool (if in python even better) to have this functionality?https://www.originlab.com/doc/Origin-Help/Data-Highlighter
I want to select a region in a plot and retrieve the table data that corresponds to the points inside that selection
lapis sequoia
If anybody could link a list of the 1000 or more most popular or largest cities, it would be greatly appreciated
Please ping me if you do (:
heady hatch
austere swift
@lapis sequoia ^ since they didnt ping you
lapis sequoia
Ah, thanks!
 raven rock
Is xgboost good for regression like predicting video game prices?
Are their other boosted or great algorithms for better price prediction?
Pls suggest some models
Thanks
 dreamy obsidian
I've of xgboost for tuning existing models but not outright predictions? I'm kinda new tho so don't take my word for it.
 red flicker
is it possible to do something exactly like this with Python ?
I tried with little success using Mathplotlib, but it's a bit tricky
raven rock
Is xgboost good for regression like predicting video game prices?
Are their other boosted or great algorithms for better price prediction?
Pls suggest some models
Thanks
@raven rock can anyone else shed some light on this?
 lone pumice
@raven rock i guess you will have to test which model works best for your particular dataset. I have used it a couple of times and it gave pretty good results on standard regression but unless you test it and see the results of different models for yourself, its hard to tell.
assuming you are using sklearn, it shouldn't take you long to test out different algorithms
raven rock
Ok , I'll try some
 cursive sphinx
Would this be the right place to ask about web scraping?
 gilded breach
deft harbor
gilded breach
deft harbor
Reading the docs and tutorial is fine for most basic scraping
cursive sphinx
I'm able to do basic web scraping, the format of this website I'm trying to scrape is difficult.
deft harbor

Medium
We all scrape web data. Well, those of us who work with data do. Data scientists, marketers, data journalists, and the data curious alike…
Combined with that
In what way?
cursive sphinx
I'm reading something at the moment to see if it helps, I'll also read what you linked.
deft harbor
Righteo
cursive sphinx
I'm trying to scrape product names and prices from this site.
I'm finding it difficult to extract the data.
I need the "Everhard EasyDRAIN" part, I think if I can get that I can get the prices too.
from bs4 import BeautifulSoup
import json

header = {
    'User-Agent': 'Mozilla/5.0 (Macintosh; Intel Mac OS X 10_9_3) AppleWebKit/537.36 (KHTML, like Gecko) '
                  'Chrome/35.0.1916.47 Safari/537.36 '
}


#variable=input("What word would you like to search: ")
url = "https://www.bunnings.com.au/our-range/bathroom-plumbing/bathroom?viewall=true"
page = requests.get(url, headers=header)
soup = BeautifulSoup(page.content, "html.parser")
bathroom_items = soup.find_all('div', class_='codified-product-tile__product-details')

print(bathroom_items)```This is what I'm working with.
I'm gonna go through what you linked but my brain is breaking
cursive sphinx
I think from what I read selenium might be the way to go
 bright turret
Is there a reason 3D histograms aren't more common? Specifically, a time series along the z axis of 2 dimensional histograms.
Is there considered to be a superior way to visualize that data?

This is the aggregate of 20 days worth of data, but I'd rather see it in 3 dimensions as a time series of each of the 20 days being plotted along the z axis
seaborn made the above so simple to set up thanks to the "hue" variable
bright turret
@cursive sphinx I used this to get selenium to work https://www.scrapingbee.com/blog/selenium-python/

Lean how to scrape the web with Selenium and Python with this step by step tutorial. We will use Selenium to automate Hacker News login.
merry ridge
@red flicker Depending on what you are using those plots for, I would probably look into https://blog.martisak.se/2019/09/29/publication_ready_figures/ It's very rare that I get a professional publication quality plot that isn't made in TikZ and I've worked on hundreds of peer-reviewed manuscripts

Martin’s blog
Learn how to make your figures stand out with tikzplotlib and matplotlib.
lapis sequoia
How do I open a .ipynb.txt in VSCode?
I am sitting on a mac and I tried to remove the .txt extension from hit but still comes out as a freaking html
raw mortar
@lapis sequoia you should install the ms python extenstion, it has support for jupyter notebooks
https://marketplace.visualstudio.com/items?itemName=ms-python.python
https://code.visualstudio.com/docs/python/jupyter-support

Extension for Visual Studio Code - Linting, Debugging (multi-threaded, remote), Intellisense, Jupyter Notebooks, code formatting, refactoring, unit tests, snippets, and more.

Working with Jupyter Notebooks in Visual Studio Code
lapis sequoia
@lapis sequoia you should install the ms python extenstion, it has support for jupyter notebooks
https://marketplace.visualstudio.com/items?itemName=ms-python.python
https://code.visualstudio.com/docs/python/jupyter-support
@raw mortar Thanks!
Extension for Visual Studio Code - Linting, Debugging (multi-threaded, remote), Intellisense, Jupyter Notebooks, code formatting, refactoring, unit tests, snippets, and more.
Working with Jupyter Notebooks in Visual Studio Code
grave frost
@red flicker just iterate over all the numbers in the range set, plot each point pair in the graph with matplotlib . I don't see how it wouldn't work
@raven rock If you are a beginner, use Keras. It is very easy to set up, implement, and has plenty of online guides for the purpose.
red flicker
@grave frost The closest I could get is this:
grave frost
Looks like a good start. Just increase your Domain size and you would be good to go
Meaning just plot more numbers (like from 0 to 4 with a step of 0.001 or something)
red flicker
from mpl_toolkits.axisartist.axislines import SubplotZero
import matplotlib.pyplot as plt
import numpy as np


fig = plt.figure()
ax = SubplotZero(fig, 111)
fig.add_subplot(ax)

for direction in ["xzero", "yzero"]:
    # adds arrows at the ends of each axis
    ax.axis[direction].set_axisline_style("->")
    # adds X and Y-axis from the origin
    ax.axis[direction].set_visible(True)

ax.axis['yzero'].set_ticklabel_direction("-")

for direction in ["left", "right", "bottom", "top"]:
    # hides borders
    ax.axis[direction].set_visible(False)

x = np.linspace(-1, 1, 100)
ax.plot(x, -x**2+16, color="#ab74a6", linewidth=3)

plt.title(r'$-x^2+16$')
plt.axis([-5, 5, -10, 20])

plt.grid(True)

plt.show()
is there any recommended online compiler to paste full code ?
I'm trying to imitate the graph style used by Echt in Calculus
mild topaz
#data-science-and-ml message
@grave frost sorry to ping u can u look to this training process
grave frost
@mild topaz Doesn't look clear. Can you put it here in text form?
@austere swift BTW where do you live?
val_accuracy looks to be stable enough, but not very good. How much augmentation did you perform? how big was your final dataset?
it can be improved significantly, to around ~70%
red flicker
why do I only get a little arc for my -x**2+16 function ?
merry ridge
well, you are plotting 100 points in the domain [-1, 1]
 celest plaza
hello, can anyone tell me how can you install 64-bit python in an virtual environment? im using virtualenv and venvwrapper
celest plaza
nvm, solved it 🙂
red flicker
@merry ridge ok, got it, thanks! Any way to avoid using x = np.linspace(-5, 5, 100) and let matplotlib decide ?
 storm fiber
Does anyone know why 'lines+markers' isn't working with my graph
import plotly.graph_objects as go
import pandas as pd

data= pd.read_csv("times.csv")

fig = go.Figure(data=go.Scatter(x=data['iteration'],
                                y=data['time'],
                                mode='lines+markers',
                                )) # hover text goes here

fig.update_layout(title='Times')
fig.show()
Im keep on getting this
merry ridge
@red flicker see https://stackoverflow.com/questions/34638040/plot-arbitrary-2-d-function-in-python-pyplot-like-matlabs-ezplot but I don't see why you would want to do this
Stack Overflow
I'm looking for a way to generate a plot similar to how ezplot works in MATLAB in that I can type:
ezplot('x^2 + y^2 = y + 5')
and get a graph ready to go for any arbitrary function. I'm only wor...
 rain nimbus
has anyone used opencv?
lapis sequoia
Hye, what are some good AI research topics i could write about?
odd yoke
image compression using auto encoders
austere swift
@rain nimbus yeah what do you need help with?
rain nimbus
@austere swift hey
Display vertically flipped frame alternatively from live webcam feed.
so i need to alternate frames
in video
how do i do that?
i'm sending the code to read webcam feed, just tell me what to add for this particular task?
austere swift
what do you mean by alternating frames
rain nimbus
import cv2
cap = cv2.VideoCapture(0)
fourcc = cv2.VideoWriter_fourcc(*'XVID')
out = cv2.VideoWriter('output.avi', fourcc, 20.0, (640,480))
print(cap.isOpened())
while(cap.isOpened()):
ret, frame = cap.read()
if ret == True:
print(cap.get(cv2.CAP_PROP_FRAME_WIDTH))
print(cap.get(cv2.CAP_PROP_FRAME_HEIGHT))
   out.write(frame)

   gray = cv2.cvtColor(frame, cv2.COLOR_BGR2GRAY)
   cv2.imshow('frame', gray)

   if cv2.waitKey(1) & 0xFF == ord('q'):
     break
else:
    break
cap.release()
out.release()
cv2.destroyAllWindows()
what do you mean by alternating frames
@austere swift okay so like one frame straight, the next frame flipped
and the next one straight
in one window itself
i think i have to use cv2.CAP_PROP_FRAME
but idk where
modify the code however you want, I just hope you understood the requirement
austere swift
import cv2

cap = cv2.VideoCapture(0)
fourcc = cv2.VideoWriter_fourcc(*'XVID')
out = cv2.VideoWriter('output.avi', fourcc, 20.0, (640,480))

flipped = False
print(cap.isOpened())
while(cap.isOpened()):
    ret, frame = cap.read()
    if ret == True:
       print(cap.get(cv2.CAP_PROP_FRAME_WIDTH))
       print(cap.get(cv2.CAP_PROP_FRAME_HEIGHT))

       out.write(frame)

       gray = cv2.cvtColor(frame, cv2.COLOR_BGR2GRAY)

       if not flipped:
           cv2.imshow('frame', gray)
           flipped = True
       elif flipped:
           gray = cv2.flip(gray, 0)
           cv2.imshow('frame', gray)
           flipped = False

       if cv2.waitKey(1) & 0xFF == ord('q'):
           break
    else:
        break

cap.release()
out.release()
cv2.destroyAllWindows()
something like that
so it would have a variable called flipped, then itll check if its true or not, if its not itll just show the image, if its true itll flip the image then show it
and after it does that it just switches the value
does that make sense?
austere swift
btw thatll only display the frames alternating, the avi video wont have them alternate
if you want the avi video to have them alternating youll need to put the out.write part in the if statements too after the flip part
rain nimbus
if you want the avi video to have them alternating youll need to put the out.write part in the if statements too after the flip part
@austere swift yup i'm aware, thank youuuu
going to try a few orientations now, thanks!
 winged stratus
Hello guys, I wrote a linear regression gradient descent after I learnt the theory. I am a complete noob and came up with this:
    lrate = float(lrate)
    t0, t1 = (0, 0)
    t0 = float(t0)
    t1 = float(t1)
    h = lambda x : t0 + (t1*float(x))
    m = len(ds)
    traincount = 0
    while True:
        errsum0, errsum1 = (0, 0)
        errsum0 = float(errsum0)
        errsum1 = float(errsum1)
        for el in ds:
            elx = el[0]
            ely = el[1]
            errsum0 += float(h(elx) - ely)
            errsum1 += float((h(elx) - ely)*float(elx))
        ct0 = float(lrate*((1/m)*errsum0))
        ct1 = float(lrate*((1/m)*errsum1))
        t0 -= ct0
        t1 -= ct1
        traincount += 1
        if traincount >= trainlimit:
            break
    return (t0, t1)
This is returning (nan, nan). I dont know what is happening. If you have any suggestions to improve this please share them
bright turret
Is there a reason 3D histograms aren't more common? Specifically, a time series along the z axis of 2 dimensional histograms.
rain nimbus
Hello guys, I wrote a linear regression gradient descent after I learnt the theory. I am a complete noob and came up with this:
    lrate = float(lrate)
    t0, t1 = (0, 0)
    t0 = float(t0)
    t1 = float(t1)
    h = lambda x : t0 + (t1*float(x))
    m = len(ds)
    traincount = 0
    while True:
        errsum0, errsum1 = (0, 0)
        errsum0 = float(errsum0)
        errsum1 = float(errsum1)
        for el in ds:
            elx = el[0]
            ely = el[1]
            errsum0 += float(h(elx) - ely)
            errsum1 += float((h(elx) - ely)*float(elx))
        ct0 = float(lrate*((1/m)*errsum0))
        ct1 = float(lrate*((1/m)*errsum1))
        t0 -= ct0
        t1 -= ct1
        traincount += 1
        if traincount >= trainlimit:
            break
    return (t0, t1)
This is returning (nan, nan). I dont know what is happening. If you have any suggestions to improve this please share them
@winged stratus what is ds
did you define it
rain nimbus
yup
winged stratus
import random as rnd
ds = []
for i in range(0, 500):
    sampds = [i, rnd.randint((i-4), (i+4))]
    ds.append(sampds)
this is how i defined it
for a random data set
winged stratus
which one?
rain nimbus
your function
winged stratus
the data set has no issues
your function
@rain nimbus wait really
oh i forgot to meantion 1 detail
i am very sorry
winged stratus
it works for small values of trainlimit like upto 100 but anything over it returns nan
rain nimbus
i am very sorry
@winged stratus shh it is alright
it works for small values of
trainlimitlike upto 100 but anything over it returns nan
@winged stratus 1 secø
nan is not a number
1 sec
got it
i'm not getting into the math here
but
rain nimbus
i think this is the issue of limitation of binaruy
winged stratus
when i searched thats what google said, it is not a number
rain nimbus
whatever your output is
winged stratus
but i didnt find anything on how to fix it
rain nimbus
it is too large a number
winged stratus
may be
rain nimbus
you'll have to use libraries to scale it down and actually portray it
winged stratus
just for 2 iterations my output is in the range 2.(something)e-95
does rounding the number work?
rain nimbus
just for 2 iterations my output is in the range 2.(something)e-95
@winged stratus exactly
winged stratus
let me try
rain nimbus
does rounding the number work?
@winged stratus wont
winged stratus
oh why?
rain nimbus
exactly
winged stratus
how do i fix it?
rain nimbus
you'll have to use libraries to scale it down and actually portray it
@rain nimbus .
winged stratus
i dont really understand 😅
rain nimbus
is this a simple linear regression?
sorry i'm too tired for math at the moment
is this a simple linear regression?
@rain nimbus if yes then
import numpy as np
import matplotlib.pyplot as plt

def estimate_coef(x, y):
    # number of observations/points
    n = np.size(x)

    # mean of x and y vector
    m_x, m_y = np.mean(x), np.mean(y)

    # calculating cross-deviation and deviation about x
    SS_xy = np.sum(y*x) - n*m_y*m_x
    SS_xx = np.sum(x*x) - n*m_x*m_x

    # calculating regression coefficients
    b_1 = SS_xy / SS_xx
    b_0 = m_y - b_1*m_x

    return(b_0, b_1)

def plot_regression_line(x, y, b):
    # plotting the actual points as scatter plot
    plt.scatter(x, y, color = "m",
            marker = "o", s = 30)

    # predicted response vector
    y_pred = b[0] + b[1]*x

    # plotting the regression line
    plt.plot(x, y_pred, color = "g")

    # putting labels
    plt.xlabel('x')
    plt.ylabel('y')

    # function to show plot
    plt.show()

def main():
    # observations
    x = np.array([0, 1, 2, 3, 4, 5, 6, 7, 8, 9])
    y = np.array([1, 3, 2, 5, 7, 8, 8, 9, 10, 12])

    # estimating coefficients
    b = estimate_coef(x, y)
    print("Estimated coefficients:\nb_0 = {} \
        \nb_1 = {}".format(b[0], b[1]))

    # plotting regression line
    plot_regression_line(x, y, b)

if __name__ == "__main__":
    main()
try manipulating and reading about the methods in numpy
personally, I use R for regression, but this should more or less work
rain nimbus
🙂 😦
lapis sequoia
XGBoostClassifier is driving me nuts
It completely ignored 1 of the four probable predictions
 humble flame
@rain nimbus just a question, how do you insert code like the way you did?
nvm
found out
red flicker
Stack Overflow
How to add axis label (x and y) and rotate y axis numbers with Matplotlib like on the image below ?
I tried plt.yticks(rotation=45) to rotate the y axis numbers but it's not taken into account.
Be...
Any idea how to fix these bugs in my matplotlib graph ?
rain nimbus
@rain nimbus just a question, how do you insert code like the way you did?
@humble flame three ''' at the beginning and end
nvm
@humble flame oh sorry lol
import cv2

cap = cv2.VideoCapture(0)
fourcc = cv2.VideoWriter_fourcc(*'XVID')
out = cv2.VideoWriter('output.avi', fourcc, 20.0, (640,480))

flipped = False
print(cap.isOpened())
while(cap.isOpened()):
    ret, frame = cap.read()
    if ret == True:
       print(cap.get(cv2.CAP_PROP_FRAME_WIDTH))
       print(cap.get(cv2.CAP_PROP_FRAME_HEIGHT))

       out.write(frame)

       gray = cv2.cvtColor(frame, cv2.COLOR_BGR2GRAY)

       if not flipped:
           cv2.imshow('frame', gray)
           flipped = True
       elif flipped:
           gray = cv2.flip(gray, 0)
           cv2.imshow('frame', gray)
           flipped = False

       if cv2.waitKey(1) & 0xFF == ord('q'):
           break
    else:
        break

cap.release()
out.release()
cv2.destroyAllWindows()
@austere swift hey so if i wanna genearlize this for n frames, like to display a vertically flipped frame after ’n’ vertically upright frames. Eg: if n=5, then a flipped frame should be displayed after every 5 upright frames., can that be done?
i think we should use it to change when the frame number%n=0?
but like how
@austere swift could we like add a count to iterate for that?
i'm not sure
austere swift
that should work
i havent tested it
import cv2

cap = cv2.VideoCapture(0)
fourcc = cv2.VideoWriter_fourcc(*'XVID')
out = cv2.VideoWriter('output.avi', fourcc, 20.0, (640,480))

count = 0
flipped = False
print(cap.isOpened())
while(cap.isOpened()):
    ret, frame = cap.read()
    if ret == True:
       print(cap.get(cv2.CAP_PROP_FRAME_WIDTH))
       print(cap.get(cv2.CAP_PROP_FRAME_HEIGHT))

       out.write(frame)

       gray = cv2.cvtColor(frame, cv2.COLOR_BGR2GRAY)

       if not flipped:
           cv2.imshow('frame', gray)
           if count % 5 == 0:
               flipped = True
       elif flipped:
           gray = cv2.flip(gray, 0)
           cv2.imshow('frame', gray)
           if count % 5 == 0:
               flipped = False
       count += 1
       if cv2.waitKey(1) & 0xFF == ord('q'):
           break
    else:
        break

cap.release()
out.release()
cv2.destroyAllWindows()
@austere swift your logic is amazing, just wanted to express
import cv2

cap = cv2.VideoCapture(0)
fourcc = cv2.VideoWriter_fourcc(*'XVID')
out = cv2.VideoWriter('output.avi', fourcc, 20.0, (640,480))

count = 0
flipped = False
print(cap.isOpened())
while(cap.isOpened()):
    ret, frame = cap.read()
    if ret == True:
       print(cap.get(cv2.CAP_PROP_FRAME_WIDTH))
       print(cap.get(cv2.CAP_PROP_FRAME_HEIGHT))

       out.write(frame)

       gray = cv2.cvtColor(frame, cv2.COLOR_BGR2GRAY)

       if not flipped:
           cv2.imshow('frame', gray)
           if count % 5 == 0:
               flipped = True
       elif flipped:
           gray = cv2.flip(gray, 0)
           cv2.imshow('frame', gray)
           if count % 5 == 0:
               flipped = False
       count += 1
       if cv2.waitKey(1) & 0xFF == ord('q'):
           break
    else:
        break

cap.release()
out.release()
cv2.destroyAllWindows()
@austere swift and perfect, thanks mahn
austere swift
Np
import cv2
cap = cv2.VideoCapture(0)
fourcc = cv2.VideoWriter_fourcc(*'XVID')
out = cv2.VideoWriter('output.avi', fourcc, 20.0, (640,480))
count = 0
flipped = False
print(cap.isOpened())
while(cap.isOpened()):
ret, frame = cap.read()
if ret == True:
print(cap.get(cv2.CAP_PROP_FRAME_WIDTH))
print(cap.get(cv2.CAP_PROP_FRAME_HEIGHT))
out.write(frame)
gray = cv2.cvtColor(frame, cv2.COLOR_BGR2GRAY)
if not flipped:
cv2.imshow('frame', gray)
elif flipped:
gray = cv2.flip(gray, 0)
cv2.imshow('frame', gray)
if count % 5 == 0:
flipped = not flipped
count += 1
if cv2.waitKey(1) & 0xFF == ord('q'):
break
else:
break
cap.release()
out.release()
cv2.destroyAllWindows()
``` you could also do this to have a single if count % 5 == 0 last peak
Hi for Pandas, is there a way to groupby and get all the values that belong to each group
For example lets say I have a df like so
Id accnt
0 0
1 0
1 1
2 2
2 3
2 6
2 7
3 4
4 5
I want to get something of the form
groupings = {0:[0,0],1:[0,1],2:[2,3,6,7],...}
I want to do this in an effective way, the data sets are kind of large, wondering if there is some built in func for pandas
My current 2 ways is to:
- get distinct ids, and then run filter on it over and over.. for ever uniq id, it feels really inefficient.
- Slightly more efficient is iam using it as a cursor and going over every row, and add to a dictionary.
I was hoping there was a pandas built in func to do the 2nd one equivalent
Or any suggestions, really appreciate it!
df3 = pd.DataFrame({'id': ['A', 'B', 'A', 'B'], 'accnt': [1, 4, 3, 2]})
groups = df3.groupby(['id'])
dict = {iden: groups.get_group(iden) for iden in list(set(df3['id'].values))}
 tight sparrow
Hello guys!
I'm working on a program that that uses URLLIB to extract href data from the webpage. I need to scan the tag at particular position and repeat the process for several no of times. Consider that I need to find the link at 3rd position and use URLLIB to scrap all the href from that link and repeat the process for some no of time. But My code is stuck! Any help for me pls? Thank you.
def scrap(x,y):
import urllib.request, urllib.error, urllib.parse
from bs4 import BeautifulSoup
url = urllib.request.urlopen(x).read()
soup = BeautifulSoup(url, 'html.parser')
tags = soup('a')
lists = []
for tag in tags:
hand = tag.get('href',None)
lists.append(hand)
if y == 0:
return (None)
else:
link = lists[2]
y = int(y)
y = y - 1
return(scrap(link,y))
print(link)
a = input('Enter the link-')
b = input('Repeat:')
call = scrap(a,b)``` eager furnace
I think tags = soup('a') is supposed to tags = soup.find_all('a')
 pure folio
What are some projects you guys recommend for nueral networks
 ancient rampart
Has anyone solved 8-Puzzle game using A*? If yes, what is the best heuristic we can get?
Heuristics I've found to best the fastest are: linear conflict, gaschnig and manhattan distance
last peak
@tight sparrow do u have inf recursion error
tight sparrow
yes
but thats why i used if statement
i dont know whats wrong
now i have change the code a bit
last peak
its here
return(scrap(link,y))
when you do return scrap(..
tight sparrow
import urllib.request, urllib.error, urllib.parse
from bs4 import BeautifulSoup
import ssl

ctx = ssl.create_default_context()
ctx.check_hostname = False
ctx.verify_mode = ssl.CERT_NONE

def scrap(x,y,z):

    url = urllib.request.urlopen(x).read()
    soup = BeautifulSoup(url, 'html.parser')
    tags = soup('a')
    lists = []
    for tag in tags:
        hand = tag.get('href',None)
        lists.append(hand)
    if z == 0:
        return(None)
    else:
        a = lists[y]
        scrap(a,y,(z-1))
    print(a)


x = input('Enter the link-')
y = int(input('Position:')) - 1
z = int(input('Repeat:'))
call = scrap(x,y,z)
its here
return(scrap(link,y))
when you do return scrap(..
@last peak i have corrected it!
resolved the looping issue!
last peak
okay this will specify how many times u will loop
tight sparrow
no its like
ill open a link
then ill read all the href and store the new links again
then from that newly stored links ill open another link
last peak
okay what happens when tehre is no 3rd
tight sparrow
its not good but i know all these links consist of atleast 50 links
last peak
okay if u know for sure then, theres no need to cover it
.
now I see that uare opening a new list in every fn
should that be holding all your previous links clicked
last peak
u need to pass that thru recursion then
change it to scraps(x,y,z,link_list):
and the last link to return scraps(x,y,z,link_list)
tight sparrow
how i cant get you?
tight sparrow
mm ill try!
last peak
.
tight sparrow
okay
last peak
lets clean this code up a little its a bit lengthy to fix up
tight sparrow
yes
i though using function will be simple, but in this case for loop will be easier and this code is bit slow too
so i just wanted to finish what i started so im still doing it
last peak
import urllib.request, urllib.error, urllib.parse
from bs4 import BeautifulSoup
import ssl

ctx = ssl.create_default_context()
ctx.check_hostname = False
ctx.verify_mode = ssl.CERT_NONE
#x=url
 #y=ind#z= repeat
link_hist=[]
def scrap(url,ind,repeat,link_hist):

    url = urllib.request.urlopen(url).read()
    soup = BeautifulSoup(url, 'html.parser')
    tags = soup('a')
    #I am assuming u just want to keep track of the one
     if repeat ==0:
         return None
     else:
         new_url = tags[ind].get('href',None)
         link_hist.append(new_url)
         return scrap(new_url,ind,repeat-1,link_hist)

x = input('Enter the link-')
y = int(input('Position:')) - 1
z = int(input('Repeat:'))
call = scrap(x,y,z)
@tight sparrow is this what ur looking for
just to keep track of some indexed href on every link
tight sparrow
yeah suree
last peak
okay specify the encoding when u read the file
with open('test', encoding='utf-8', mode='rb') as f:
    f.read()
 civic mountain
Hello I am looking for a way to train GAN which outputs a tensor containing integers only. How can I do it?
I'm using pytorch
When I load my custom image dataset, I need to astype to float32 for the training to even run properly, but I am getting pretty bizarre results.
My real data set can only contain 4 different pixel colour, and I want to impose the same rule on the output image.
After going through documentation, I found out about quantization, but I don't think that's what I exactly need.
 serene scaffold
I'm trying to figure out what this function means
the context is a perceptron. I think this is a soft activation function.
 tall barn
An automated test on my assignment requires that I use a pandas Panel. Of course, the provided IDE uses a version of pandas that has deprecated Panels. As such, I get the error about Object() takes no parameters. Any thoughts?
serene scaffold
What's knet referring to?
@heady hatch somehow I failed to mention thatknetis what I had no idea bout. My bad.
I'm pretty sure it's another way to represent sigmoid as well
 hasty grail
@civic mountain Maybe you can do a softmax across 4 features and use argmax to get the feature with the highest value. What loss function are you using though?
velvet thorn
An automated test on my assignment requires that I use a pandas Panel. Of course, the provided IDE uses a version of pandas that has deprecated Panels. As such, I get the error about Object() takes no parameters. Any thoughts?
@tall barn that's...really old.
civic mountain
@hasty grail I'm only getting started so I was following an article which uses mnist dataset. Then I modified that code to run on my dataset. I think the loss function used was bceloss.
hasty grail
ok then what you should do is use a softmax output and a categorical crossentropy loss
bceloss is only sensible for outputs and ground truths that are in the range of [0, 1], e.g. binary classification
 unreal breach
Can anyone make me understand what data science is? The google definition didn't worked out for me
tall barn
@velvet thorn yep. My job training classes are full of these sorts of issues
Sometimes they ask us to use libraries that have no release for the version of Python we’re using
It’s baffling
 fiery turtle
Can anyone make me understand what data science is? The google definition didn't worked out for me
@unreal breach working and manipulation of raw data using statistical analysis
unreal breach
@unreal breach working and manipulation of raw data using statistical analysis
@fiery turtle Can you give me an example?
bright turret
Hypothesis: cold weather fronts in warm months cause hurricanes.
Data: temperatures and hurricane occurences
Science: Use ANOVA or ANCOVA test on temperatures and hurricane data to measure whether there is statistically significant correlation between the data
Repeat
 whole sage
hasty grail
whole sage
hasty grail
have you tried scipy?
lapis sequoia
is there any way that i can use gpu for my model in kaggle?
it keeps on saying out of memory
odd yoke
out of memory errors don't mean you are not using the GPU
odd yoke
depending on the type of memory error you get specifically, it can mean you don't have enough RAM, enough VRAM (gpu not good enough etc)
hasty grail
can you show a screenshot of the error you're getting?
lapis sequoia
yeah one sec
hasty grail
also what DL framework are you using
odd yoke
have you tried reducing your batch size
lapis sequoia
its 32
odd yoke
yeah, reduce it to 16 or 8
odd yoke
sure why not
odd yoke
your model is still too big to fit into your GPU
lapis sequoia
omg!
but its too low
i have only three layers
with 32 and 64
for conv
for dense 32
hasty grail
can you print the summary of your model?
lapis sequoia
one sec
hasty grail
you have 16GB GPU memory so it shouldn't run out that easily
lapis sequoia
model.add(Conv2D(32,kernel_size = (3,3),activation = 'relu',input_shape = image_shape))
model.add(MaxPool2D(pool_size = (2,2)))
model.add(Dropout(0.5))
model.add(Conv2D(64,kernel_size =(3,3),activation='relu'))
model.add(MaxPool2D(pool_size = (2,2)))
model.add(Dropout(0.5))
model.add(Flatten())
model.add(Dense(32,activation = 'relu'))
model.add(Dense(1,activation ='sigmoid'))
model.compile(loss ='binary_crossentropy',optimizer = 'adam',metrics=['accuracy'])
this is my model
hasty grail
you need to downsample your image even more by adding more conv layers before feeding them into the dense layer
otherwise it will become an absolute monster
hasty grail
just keep adding pooling + conv
lapis sequoia
umm will it not be too complex?
hasty grail
you're doubling the number of filters but reducing the spatial size by 4 for each block so it should be ok
since your image is very large you probably need that many layers
odd yoke
your input images shouldn't be that large
hasty grail
perhaps you should resize your image to something smaller
odd yoke
the impact of the size of image gets smaller as the image grows, you can probably get away with a 512x512 in almost every cases
in fact most computer vision systems use less than that
mild topaz
hello , how i can decide my epoch based on no of images in a folder for training a CNN model?
odd yoke
you can't really, you should monitor your metrics while the model is training and stop the training accordingly
hasty grail
use EarlyStopping
odd yoke
the method we use at work is we save the model every N iterations (and keep the best M models), and set some large number of iteration, so that we don't have to come back too often to check, we've had issues with early stopping when the model was hitting local minimas
hasty grail
Even with large patience values?
lapis sequoia
no
i will give about 10 ?
<ipython-input-44-fbf68c74bcf6> in <module>()
----> 1 model.fit_generator(train_image_gen,validation_data = (test_image_gen),epochs=30)

10 frames
/usr/local/lib/python3.6/dist-packages/tensorflow/python/eager/execute.py in quick_execute(op_name, num_outputs, inputs, attrs, ctx, name)
     58     ctx.ensure_initialized()
     59     tensors = pywrap_tfe.TFE_Py_Execute(ctx._handle, device_name, op_name,
---> 60                                         inputs, attrs, num_outputs)
     61   except core._NotOkStatusException as e:
     62     if name is not None:

UnimplementedError:  Fused conv implementation does not support grouped convolutions for now.
     [[node sequential_6/conv2d_40/Relu (defined at <ipython-input-41-fbf68c74bcf6>:1) ]] [Op:__inference_train_function_6183]

Function call stack:
train_function```please can someone help me with this error ?
model.fit_generator(train_image_gen,validation_data = (test_image_gen),epochs=30)
lapis sequoia
yes
but some extra layers
model.add(Conv2D(32,kernel_size = (3,3),activation = 'relu',input_shape = (224,224,1)))
model.add(MaxPool2D(pool_size = (2,2)))
model.add(Dropout(0.5))
model.add(Conv2D(64,kernel_size =(3,3),activation='relu'))
model.add(MaxPool2D(pool_size = (2,2)))
model.add(Dropout(0.5))
model.add(Conv2D(64,kernel_size =(3,3),activation='relu'))
model.add(MaxPool2D(pool_size = (2,2)))
model.add(Dropout(0.5))
model.add(Conv2D(64,kernel_size =(3,3),activation='relu'))
model.add(MaxPool2D(pool_size = (2,2)))
model.add(Dropout(0.5))
model.add(Conv2D(64,kernel_size =(3,3),activation='relu'))
model.add(MaxPool2D(pool_size = (2,2)))
model.add(Dropout(0.5))
model.add(Conv2D(64,kernel_size =(3,3),activation='relu'))
model.add(MaxPool2D(pool_size = (2,2)))
model.add(Dropout(0.5))

model.add(Flatten())
model.add(Dense(32,activation = 'relu'))
model.add(Dense(1,activation ='sigmoid'))
model.compile(loss ='binary_crossentropy',optimizer = 'adam',metrics=['accuracy'])```can you print out the model summary?
also I think you're adding way too much dropout
arctic wedgeBOT
Pasting large amounts of code
If your code is too long to fit in a codeblock in discord, you can paste your code here:
https://paste.pydis.com/
After pasting your code, save it by clicking the floppy disk icon in the top right, or by typing ctrl + S. After doing that, the URL should change. Copy the URL and post it here so others can see it.
lapis sequoia
okay!
arctic wedgeBOT
Hey @lapis sequoia!
Uh-oh! It looks like your message got zapped by our spam filter. We currently don't allow .txt attachments, so here are some tips to help you travel safely:
• If you attempted to send a message longer than 2000 characters, try shortening your message to fit within the character limit or use a pasting service (see below)
• If you tried to show someone your code, you can use codeblocks
(run !code-blocks in #bot-commands for more information) or use a pasting service like:
lapis sequoia
!code-blocks
arctic wedgeBOT
Discord has support for Markdown, which allows you to post code with full syntax highlighting. Please use these whenever you paste code, as this helps improve the legibility and makes it easier for us to help you.
To do this, use the following method:
```python
print('Hello world!')
```
Note:
• These are backticks, not quotes. Backticks can usually be found on the tilde key.
• You can also use py as the language instead of python
• The language must be on the first line next to the backticks with no space between them
This will result in the following:
print('Hello world!')
how do i print my summary?
but i searched stack over flow its says because of color channels
hasty grail
model.summary()
lapis sequoia
no its not showing the output
hasty grail
are you using the correct data format? (channels_first vs channels_last)
lapis sequoia
yes!
its 224,224
i didnt give channels because its 1
my image_shape is (224,224,1)
hasty grail
well there you go
hasty grail
I thought you already solved the problem by yourself
hasty grail
my image_shape is (224,224,1)
This is correct input
just use data_format='channels_last' in your conv layers
and maxpool
hasty grail
do elaborate
lapis sequoia
one sec
I had a similar error, the problem was with the number of channels for my image and the number of channels I specified in the model. So check the number of dimension of your image and check the value specified in the input shape ensure they are the same
this is the answer
hasty grail
looks correct to me
hasty grail
can you try iterating through your generator and try printing the output shape of each iteration?
lapis sequoia
datagen?
Found 5216 images belonging to 2 classes.
Found 624 images belonging to 2 classes.
train and test imagegen
hasty grail
for x, y in gen:
    print(f"x.shape={x.shape}; y.shape={y.shape}")
    break
well you see the problem is that your generator is outputting images with 3 channels
hasty grail
looks like you didn't configure your generator properly
hasty grail
you need to set color_mode='grayscale' in tf.keras.preprocessing.image_dataset_from_directory
if that's what you're using to get the data
hasty grail
np
lapis sequoia
🙂
raw mortar
has anyone tried cuda in wsl2? I don't have a windows 10(2004) system now so was not able to try it out.
https://docs.nvidia.com/cuda/wsl-user-guide/index.html
The guide for using NVIDIA CUDA on Windows Subsystem for Linux.
 cedar sky