#data-science-and-ml
1 messages · Page 258 of 1
 lapis sequoia
 bronze skiff
close enough
do you know how to set up conda?
your best bet is to just install the anaconda distro
lapis sequoia
no
 odd yoke
https://www.tensorflow.org/install did you follow this ?

TensorFlow
Learn how to install TensorFlow on your system. Download a pip package, run in a Docker container, or build from source. Enable the GPU on supported cards.
bronze skiff
google "how to install anaconda"
bronze skiff
okay, what did you get
lapis sequoia
ERROR: Could not find a version that satisfies the requirement tensorflow (from versions: none)
ERROR: No matching distribution found for tensorflow
And what metrics did you refer to? @odd yoke
odd yoke
for example you could get the distribution of various metrics like precision, recall, the data itself, etc
lapis sequoia
did you upgrade pip?
@bronze skiff yes
Which ones would most ML engineers look for
@bronze skiff python --version Python 3.8.6 PS C:\Users\Admin> pip --version pip 20.2.3
Or which are most important'
odd yoke
these would require things to be taken care of depending on the project of course, first to check the precision, recall, that would mean constantly annotating a portion of the data you retrieve
if you want to check the distribution of the different features in your data, or some other metrics like, idk, the number of objects in an image or whatever, that your algorithm can compute, or that you can directly get from the raw data, but that's also obviously project specific
there isn't a magic bullet for when to re-evaluate a deployed model
bronze skiff
@lapis sequoia post your error message in full after a failed install
lapis sequoia
@odd yoke That is really interesting and helpful
bronze skiff
and something to remember when you reevaluate-- make sure you have some kind of data promenance/lineage scheme set up
otherwise you'll get boned in longer projects
lapis sequoia
@bronze skiff
@odd yoke When you say annotating, just so I am clear, annotating what exactly?
Or could clarify that really quickly
odd yoke
the data that you get after you've deployed the model
lapis sequoia
Ah I see
bronze skiff
@lapis sequoia you're using a 32-bit version of windows? at least your python is 32-bit
you need a 64-bit version of python to run tensorflow
bronze skiff
no prob
see that your python is running from python38-32
which is the 32 bit version
you need to reinstall it
lapis sequoia
yes im do
So if there was a tool that miraculously existed that would solve that problem and provided you metrics , would you ever use it? @odd yoke
Or rather how many ML engineers could you see using it
And also how hard is it for ML engineers to start adopting new software within their teams?
odd yoke
Obviously it depends but if it is really miraculous, then sure, it's a rampant problem on the projects the various teams are working on here
And I'd say it depends on the tool and the team itself (i know boring)
lapis sequoia
Hahaa
also are you saying just the predictions being made - for the annotating the data you received after deploying?
odd yoke
If the tool is a simple plug and play stuff you can integrate into existing tools, sure
no, actually manually annotating the data
the goal is to check if the data has changed so that it no longer fit the model, if you use the model itself, you have no way of knowing if the result is good or not
lapis sequoia
Ohhh I see
This is really helpful
When you said integrations to existing tools, which existing tools out there? @odd yoke
odd yoke
if it's a python library, it's a lot easier to integrate than if you have to change to a different cloud provider or whatever
that kind of stuff
lapis sequoia
Yeah thats beter
*better
I can see that especially if people are already relying on the big giants these days
odd yoke
btw, keep in mind i'm still a student (not for long!) so there's a high chance i'm talking out of my ass
thought it'd be a good idea to let you know
lapis sequoia
Yeah I understand, you know a lot though
@odd yoke And again, if you don't mind me asking, you are an ML engineer - for image processing?
odd yoke
not quite sure what i am either to be fair
we do "research" so we just do whatever we think is cool
except when we have to write reports for 3 months straight
i have barely worked on the deployment part for example
lapis sequoia
Ah I see, so more of analyzing ?
odd yoke
i've been working a lot on developing our internal pipeline tool and implementing whatever current state of the art model we see for various image related tasks
i'm a lot more on the programming side of things than some of my other colleagues
which are a lot more on the statistics/analysis side
lapis sequoia
Ohh so would you say that you are the engineer for the data scientist
bronze skiff
titles are mostly useless
odd yoke
yeah but i also participate in exploration of new models and their implementation, which is my favourite part
also yeah ^
lapis sequoia
Ohh thats cool
bronze skiff
at small startups a data scientist means literally anything and everything
bronze skiff
what kind of models have you explored recently ign?
odd yoke
working a lot on semantic segmentation the past year, we've been tryharding on deeplab for months but it's not cutting it i think, we're gonna go into something simpler like a u-net variant
bronze skiff
ah, cool
odd yoke
i want to finally try GANs but i'll be gone before they start :/
bronze skiff
i've been spending some time on CNNs with more types of symmetries in their inductive biases, so they get properties like g-equivariance for a lie algebra g
but i'm guessing your problem domain doesn't exploit those biases above the standard translation equivariance
that's sad 😦 gans are absolutely boss
though i can't say i've ever used them successfully at my job
odd yoke
other than the fact that i don't know what a "lie algebra" is, yeah i don't think we're gonna need anything other than traditional convnets
as i said we experimented with deeplab, which uses "atrous spatial pyramid pooling", which can be used to find patterns at different scales, but we haven't noticed any great improvement with or without it
bronze skiff
i thought the entire point of deep CNNs was to find patterns at different scales
the entire "exponential receptive field"
bronze skiff
right, which is what the g-equivariant CNNs are for
i guess this is another approach?
odd yoke
ASPP is a serie of dilated convolution in parallel with different dilation rates (the kernels are filled with more or less 0s) that are merged into one
it adds a bit of scale invariance
"a bit" as in, it is still limited by the biggest kernel in that serie
idk if the concept was first introduced in deeplab or another paper
but it's pretty simple, kinda made me think about what one needs to do to publish a paper on DL
bronze skiff
i think the entire dilated convolution bit is used a lot everywhere
i do a lot of NLP so 1-d autoregressive temporal CNNs are a staple
lapis sequoia
@odd yoke Also, out of curiosity, when you said make it a form of a python library. im not sure how a python library could actually get into someone's infra
odd yoke
that was just an example of how (not) intrusive a tool can be
lapis sequoia
ohh i see
odd yoke
i just gave the 2 extremes
lapis sequoia
That is an interesting thought
But a good point, not having one to move cloud providers
unless it is integrated to amazon's or google's
odd yoke
one where you add new stuff by adding a python dependency, the other where you have to use a different cloud provider just for one "thing", whatever it may be
i know even if amazon released an incredible tool on aws, we wouldn't move to it, as every team is using gcp
as per company policy
lapis sequoia
ohh
odd yoke
i'm assuming many companies are like that
lapis sequoia
Hmm
Yeah thats true
ok im in
tensonflo installed
@odd yoke Does your company have to approve the tools you use?
is there any quick hello world project
odd yoke
not really
lapis sequoia
projects*
odd yoke
not stuff like libraries at least
lapis sequoia
Ah I see, and what are current examples for instance (if you can share) that you use
odd yoke
google "iris tensorflow tutorial" @lapis sequoia
i won't go into specific details, but we use the generic data science/numerics tools, like numpy, pandas, tensorflow etc
lapis sequoia
Ahh I see
But not really a separate platform I am assuming
more of libraries
If an engineer decides to work with a third-party platform for analytics, does that have to be apprived beforehand?
odd yoke
yes we try as much as possible to use python for everything so that it's easier to re-use by other teams, and yes
odd yoke
yes
lapis sequoia
Well that would then make it hard to integrate to newer platforms haha
Is it hard for an engineer to find a new tool and ask managers to start using it? I would assume that there are plenty out there right now that they can use
If they are relying solely on python libraries, then how do they expand or automate to third party services?
odd yoke
I haven't had to ask personally but yeah it's a pain
Moving to lucidchart took like a year lmao
we don't use third party services other than the ones already approved by the IT team really
lapis sequoia
@odd yoke Yeah that is a long time
What got lucidchart to be approved? Was it by popular demand from engineers to push it to being approved?
odd yoke
many people wanted it
lapis sequoia
That always makes me wonder
bronze skiff
anyone here use a lot of bayesian techniques in their work?
lapis sequoia
How a software can easily trend
among teams
Is it suually word of mouth among people? @odd yoke
And oh wow just searched up lucid chart, if I am not wrong, is it a flowchart software???
odd yoke
yeah it's for making diagrams and stuff
lapis sequoia
I would assume people want like automated annotations
*would want
Or rather automated deployment
lapis sequoia
Or automated monitoring
Especially as you stated before, if it is curated to your project's needs, and provides some forecast of your model's quality using metrics
I couldn't imagine why they haven't tried incorporating new software
And again if you don't mind me asking, but is the company you work like Lyft or Airbnb or more research oriented?
 fringe cove
hi i just need a quick fix i dont know where i'm wrong
just looking to open a simple csv file with panda
import os
import pandas as pd

df = pd.read_csv("./csv/PHMEV/OPEN_PHMEV_2014.CSV")
print(df.head(5))
but gives error tokenizing data 😦
 delicate jackal
try \ instead of /
fringe cove
ok i found that i need to read that csv with the follwing encoding
western europe (windows-1252/WinLatin1)
could it be that ?
trying your solution
also i put the file in the same directory to avoid the / \ problems
and gives error
lapis sequoia
helo
fringe cove
openoffice is able to open it so i should be able to with pandas right ?
lapis sequoia
if i have to make a face detection NN woth tensorflo do i have to download a dataset?
can pandas read tho
fringe cove
i believe they can read chinese but my file is encoded with french unicode ><
 snow birch
So I am having a bit of trouble working with pandas dataframes. Is there a way I can perform column correlation based on a row value? Basically I got a table:
  M       v    v   v
  M       v    v   v
  F       v    v   v
F v v v```Is there a way to do a correlation of x,y,z when gender==M or gender==F?
or should I be creating new dataframes that are a subset of the main dataframe?
 velvet thorn
So I am having a bit of trouble working with pandas dataframes. Is there a way I can perform column correlation based on a row value? Basically I got a table:
  M       v    v   v
  M       v    v   v
  F       v    v   v
  F       v    v   v```
@snow birch groupby corr
 keen wedge
hello
I would like to know that being a JS developer is it okay to learn ML using JS, or learning it using Python from scratch would be better?
 cold harness
Hi, I want to do a text recognition in a static image, what are the libraries/apis to start with ?
 tough dust
if i have to make a face detection NN woth tensorflo do i have to download a dataset?
@lapis sequoia nice id bro
velvet thorn
I would like to know that being a JS developer is it okay to learn ML using JS, or learning it using Python from scratch would be better?
@keen wedge the Python ecosystem for ML is a lot more robust IMO
 olive lake
Hi Everyone!
 mild topaz
Traceback (most recent call last):

  File "E:\demo3\image_classification.py", line 107, in <module>
    assert (x_train.shape[1:]  == (imageDimensions)),  "the dimension of training images are wrong"

AssertionError: the dimension of training images are wrong```i have kept my imageDimensions as (64, 64, 3)
and my all images are of (64, 64)
mild topaz
(1126,)
also i am following this tutorial https://www.youtube.com/watch?v=SWaYRyi0TTs

Train and classify Traffic Signs using Convolutional neural networks This will be done using OPENCV in real time using a simple webcam . CNNs have been gaining popularity in the past couple of years due to their ability to generalize and classify the data with high accuracy. ...
mild topaz
can anyone look into this issue?
Traceback (most recent call last):

  File "E:\demo3\image_classification.py", line 107, in <module>
    assert (x_train.shape[1:]  == (imageDimensions)),  "the dimension of training images are wrong"

AssertionError: the dimension of training images are wrong```
can anyone look into this issue?
solved this issue by resizing all the images of same dimensions
lapis sequoia
can some body help me with cnn?
am actually trying to do cats and dogs classification with keras
I have tried adjusting params but i get a way low accuracy
can someone help me with that?
from keras.models import Sequential
from keras.layers import Conv2D,MaxPooling2D,Dropout,Flatten,Dense,Activation

model=Sequential()
model.add(Conv2D(32,(3,3),activation='relu',input_shape=image_shape))

model.add(MaxPooling2D(pool_size=(2,2)))
model.add(Dropout(0.5))
model.add(Conv2D(64,(3,3),activation='relu'))

model.add(MaxPooling2D(pool_size=(2,2)))
model.add(Dropout(0.5))
model.add(Conv2D(128,(3,3),activation='relu'))

model.add(MaxPooling2D(pool_size=(2,2)))
model.add(Dropout(0.5))
model.add(Flatten())
model.add(Dense(128,activation='relu'))

model.add(Dropout(0.5))
model.add(Dense(1,activation='sigmoid'))
model.compile(loss='binary_crossentropy',optimizer='adam',metrics=['accuracy'])
these are my layers!
 celest timber

❤️ Check out Weights & Biases and sign up for a free demo here: https://www.wandb.com/papers
❤️ Their instrumentation of a previous paper is available here: https://app.wandb.ai/authors/alae/reports/Adversarial-Latent-Autoencoders--VmlldzoxNDA2MDY
📝 The paper "Learning Tempo...
 hasty grail
@lapis sequoia Make sure that you have properly rescaled your input images
lapis sequoia
Why won't my rows with NaN be dropped?
When I do patient.dropna(how='any', inplace=True) no data is shown when I run patient.head()
velvet thorn
@lapis sequoia that means all your rows have at least one null value
lapis sequoia
What is the best practice to work with this? Obviously I can't drop all rows, then what data will I work with
velvet thorn
What is the best practice to work with this? Obviously I can't drop all rows, then what data will I work with
@lapis sequoia it depends.
on your data
perhaps
you should take a step back
and ask yourself
"is there any other way to work with my data other than dropping nulls?"
lapis sequoia
I don't want any bias in my analysis
lapis sequoia
To get some feedback or alternative perspective on how I could process this data before training my model
velvet thorn
okay
when you say "bias"
what do you mean in this case?
just to make sure we're on the same page
lapis sequoia
So first, the absence of data reduces statistical power, which refers to the probability that the test will reject the null hypothesis when it is false.
Second, the lost data can cause bias in the estimation of parameters. Third, it can reduce the representativeness of the samples.
Fourth, it may complicate the analysis of my study. Each of these distortions may threaten the validity of the trials and can lead to invalid conclusions.
velvet thorn
yup, fair enough.
okay, so
general principles.
wouldn't you agree
that the reason data is missing matters?
e.g. you know of "missing completely at random" vs "missing at random" vs "missing not at random", right?
understanding why the data is missing will affect how you deal with it.
next, you should consider the importance of each feature to your final analysis.
for example, if a feature is only a form of metadata (e.g. a serial number), then null values will not be important
and you can safely ignore them.
again, this will inform how you deal with missing data.
this would be a good start IMO
lapis sequoia
So please guide me on this one. We have a dataset with patient info in terms of Covid-19, the state their in, date of symptom onset, etc. I would assume that these are missing at random?
velvet thorn
no.
it is impossible to tell
without looking at the methodology
okay, one step back
do you understand
the difference between the various types of missing data?
lapis sequoia
Sure
velvet thorn
okay, that's good
if you're asking for my opinion, I honestly have no idea
I don't know your dataset
perhaps you are right
lapis sequoia
The data is pulled from Kaggle, impossible to know the methods they have used to record the data, at least on this one
velvet thorn
but ultimately that's a decision for you to make
in that case
IMO
you should make the assumption you consider most reasonable
lapis sequoia
Thanks. Well, basically you just stated what I have already read on Towards Data Science website
I wouldn't have asked here if that would have helped me
velvet thorn
that's true, but I have no idea what you read before this
lapis sequoia
Ok, I appreciate your input anyway. One last thing
 hushed flax
How to convert 3000 words into strings and putting them into one list using pycharm
 fierce shadow
Hey guys, does anybody knows if there is a way of training a model from the images provided online?
I mean, if I am not wanting to download the images locally in my machine
mild topaz
Traceback (most recent call last):
File "E:\demo3\image_classification.py", line 182, in <module>
axs[i].imshow(x_batch[i].reshape(imageDimensions[0], imageDimensions[1]))
AttributeError: 'numpy.ndarray' object has no attribute 'imshow'``` pure sedge
import pandas as pd
import numpy as np
df = pd.read_csv('BankNote_Authentication.csv')
df.head()```
hey m using pycharm and my csv file is not being read , it says Process finished with exit code 0!!!! spark stag
@pure sedge do you want to print(df.head()), because unless that is in pycharms console that will not produce any output
 warm moth
I have a date time column of format DD/MM/YYYY HH:MM:SS I am unable to use the parse_dates argument. It gives the dates in the format YYYY-MM-HH and deleted the Time. How can I parse the column
I also tried making a func for date_parser
date_parser= lambda x: pd.datetime.strptime(x, "%d/%m/%Y %H:%M:%S")
Please ping me with @warm moth if you can help
warm moth
Alright, So I think I fixed it. In my test data set, I had these three entries;
05/10/2004 00:00:00
06/10/2004 00:00:00
07/10/2004 00:00:00
and I did the following
df = pd.read_csv(path + "Datetime test.csv", index_col='datetime')
and then
df.index = pd.to_datetime(df.index, format='%d/%m/%Y %H:%M:%S')
When I did df.head()
I didnt see the time and had the date in the YYYY-MM-DD format. When I changed the time to something other than 00:00:00 for some values, I got the correct result. Correct me if I made any mistake
 flat quest
@lapis sequoia
This is one of those things where you have to ask yourself if its better to make some assumptions (introducing bias), or making no assumptions but have very little data.
Many times having a little bias provides stronger results due to the lack of sufficient information. It may complicate the analysis of the study a bit,
but that's why you have to understand the pattern of the missing data before filling it in
 green widget
So I am not really sure if this would be considered "data science" But if anything its damn close. I am trying to do a really simple MD simulation and have come across an error that I have never dealt with before (very new).
I dont really understand what this means, since these values should very much have a "size" no?
 grave frost
@green widget It would be more helpful If you can post your whole code in there
grave frost
I meant in the text box, you can use triple (`) to make a code snippet in discord.
like this
import matplotlib.pyplot as plt
#Defines Avagadros and Boltzmann constant
AN = 3.0622e23
BN = 1.3806e-23
#Defines the parameters of the system
natoms = 100
mass = 1e-3
dt = 1e-15
temp = 300
steps = 100
epsilon = 3.180e-3
sigma = 2.928

#Defines lenonard Jones Interactions calculations
def lj_interactions(r, epsilon, sigma):
    return 48 * epsilon * np.power(
        sigma, 12) / np.power(
        r, 13) - 24 * epsilon * np.power(
        sigma, 6) / np.power(r, 7)

def initial_vel(temp, natoms):
    R = np.random.rand(natoms) - 0.5
    return R * np.sqrt(BN * temp / (mass * AN))

def find_accel(pos):
    ac_x = np.zeros((pos.size, pos.size))
    for i in range(0, pos.size - 1):
        for j in range(i + 1, pos.size):
            rx = pos[j] -pos[i]
            r_magnitude = np.sqrt(rx * rx)
            scalar_force = lj_interactions(r_magnitude, epsilon, sigma)
            force_on_x = scalar_force * rx / r_magnitude
            ac_x[i, j] = force_on_x / mass
            ac_x[j, i] = -force_on_x / mass
            return np.sum(ac_x, axis=0)

def new_pos(x, v, a, dt):
    return x + v * dt + 0.5 * a * dt * dt

def new_vel(v, a, a1, dt):
    return v + 0.5 * (a + a1) * dt

def md_run(dt, steps, temp, x):
    pos = np.zeros((steps, 3))
    v = initial_vel(temp, 3)
    a = find_accel(x)
    for i in range(steps):
        x = new_pos(x, v, a, dt)
        a1 = find_accel(x)
        v = find_accel(v, a, a1, dt)
        a = np.array(a1)
        pos[i, :] = x
        return pos

x = np.random.rand()
sim_pos = md_run(dt, steps, temp, x)

#From stackoverflow
for i in range(sim_pos.shape[1]):
    plt.plot(sim_pos[:, i], '.', label='atom {}'.format(i))
plt.xlabel(r'Step')
plt.ylabel(r'$x$-Position/Å')
plt.legend(frameon=False)
plt.show()```I hope that helps
 dusty ember
Hi, everyone! I'm working on the docs for Matplotlib (https://matplotlib.org/index.html) and I created this survey to find out more about who's using the library and how they use it. This is part of a project I'm working on from this year's Google Season of Docs (https://developers.google.com/season-of-docs/docs/participants/project-matplotlib-jeromev). Documentation always has room for improvement, and with the help of the community, more people can make use of the resources available to accomplish their tasks.
I'm hoping for anyone and everyone who's heard of Matplotlib to be able to respond to the survey with their experiences. Whether you're just getting started with making visualizations or you're deep into the source code, accessibility and navigation of the documentation are important parts of getting work done. The hope of this ongoing project is to lower the barrier of entry for new users and also getting right to the point for experienced developers.
The data will not be used for marketing or any other purpose other than to help improve the docs. I'm happy to answer any questions or clarify anything! Thank you for your support in whatever way you feel comfortable!
Matplotlib User Survey (https://forms.gle/ndfTPrNcY4iis1918)
 brittle agate
Hey, guys, anyone can explain. What is reason or powerful feature of PyTorch in comparing with Tensorflow.
And wtf, why is PyTorch so popular, how TF.
I speak about 2020.
 charred blaze
TL;DR: PyTorch has a saner API and starting getting quite the mindshare in the academic world back in 2018
which eventually percolated to the industry.
lapis sequoia
data science same as ml?
grave frost
@brittle agate @charred blaze Yeah, Pytorch has a strong hold on the academic side but you are missing a key fact - Google offers one of the best Cloud services for ML along with other things. Businesses use GCP, start using tools like AutoMl and TPU's (which again are Google's) make it a very wide known business tool and the go-to lib for any task/project involving ML.
A lot of these factors make Businesses thus more inclined to use a Google Ptoduct, especially when it also closely ties in with other G products they use on a daily basis.
What does that mean? More jobs would have TF requirement (with only a small note of appreciation if you know PyTorch, but not a major factor). So in the long run, TF would actually cross Pytorch and remain there.
flat quest
also tf 1.0 was based entirely on sessions. It was a total pain.
Much easier to work with pytorch back then. Now not so much
grave frost
Though I guess PT will still be very relevant especially in reseach areas
@flat quest It was, but 2.x has compleetly changed the scene
flat quest
yeah ik
basically tf adopted most of the ideas pytorch already had
so the differences between the two weakened.
Id expect TF to be more used by academia as well as time goes on, just because its the natural complement to many of google's products. Or maybe we'll see a new DL library even. Who knows?
grave frost
Yeah, Google pretty much owning the whole AI business
And the quantum computing business too.
 desert oar
Flux is already popular in the Julia world (and written in Julia)
You also have these other ML libraries like MXNet although I don't know who actually uses them
brittle agate
@grave frost
Oki doki.
 tidal sonnet
Anyone know where this error is coming from?
I did it just like the one in the example :(
 tidal bough
why are you multiplying a cell by a list [0]?
Matplotlib animations are pretty cool. This one was done with celluloid.
 untold rose
nice
tidal sonnet
why are you multiplying a cell by a list
[0]?
@tidal bough OH MY GOSH... THANK YOU
Idk how I didn't realize :(
AssertionError:
Arrays are not almost equal to 7 decimals
What is this error?
Google not being too helpful rn 😬
tidal bough
@tidal sonnet It means an assert specifically intended to check this failed 😛
velvet thorn
Idk what that means... i'm new to this 😅
@tidal sonnetassertis basically a way to check if something is the case and raise an error if not
example:
def divide(a, b):
    assert b != 0, 'b cannot be 0'.
    return a / b
 austere swift
has anybody here tried using cupy instead of numpy?
if so how much of a performance gain did you get?
 bold ledge
any smarty pants here have a second about for me to ask about S.V.D when it comes to lossy/image compressions?
 rustic apex
How long does it take to learn pandas, Numpy, Seaborn, MatLab ect?,,,,
 south gull
Using a function from a math package is usually super easy, if you know the actual math
if you don't, you probably wouldn't be using it, to start with
 slow adder
hi all. I am a super beginner (only halfway through a Python crash course). I am having some trouble installing matplotlib on my Win10 Laptop. got python3.8 but I keep getting ModuleNotFoundError: No module named 'matplotlib.pyplot' I was wondering if you could help me. I have already installed matplotlib using python -m pip install --user matplotlib
austere swift
make sure you're in the same python environment as you installed it in
slow adder
thanks. sorry, total beginner here: does 'environment' mean having the module saved in the same folder as where matplotlib is installed?
 regal spindle
Sort of but not really
 clear mulch
I am new to Data Science , On what skills should I focus ?
south gull
for me it took me about a month of grinding
pandas, Numpy, Seaborn, MatLab, etc in a month. I really doubt this 🤣
an overview of it, sure, but everything, nah
I am new to Data Science , On what skills should I focus ?
whatever you find interesting
 raw otter
anyone know the best way to create a custom numpy dtype? i'd like to create a fraction dtype
or at the very least, a custom pandas dtype.
mild topaz
Traceback (most recent call last):

  File "E:\demo3\image_classification.py", line 234, in <module>
    model = myModel()

  File "E:\demo3\image_classification.py", line 220, in myModel
    model.add(Flatten())

  File "C:\Users\Admin\anaconda3\lib\site-packages\keras\engine\sequential.py", line 182, in add
    output_tensor = layer(self.outputs[0])

  File "C:\Users\Admin\anaconda3\lib\site-packages\keras\engine\base_layer.py", line 446, in __call__
    self.assert_input_compatibility(inputs)

  File "C:\Users\Admin\anaconda3\lib\site-packages\keras\engine\base_layer.py", line 358, in assert_input_compatibility
    str(K.ndim(x)))

ValueError: Input 0 is incompatible with layer flatten_2: expected min_ndim=3, found ndim=2```import pandas as pd
import numpy as np
df = pd.read_csv('BankNote_Authentication.csv')
print(df.head())```i want to print result , but it says Process finished with exit code 0 in pycharm
mild topaz
try print(df.head(5)) @pure sedge
 graceful gyro
Hi, I have been advancing my Python knowledge with some textbooks and tutorials for a considerable time. I have been using VSCode and happy with it so far.
I am now setting my environment for web and data science projects.
To me it seems like the only thing I need as an extra is Jupyter, but should I really need to install Anaconda or an IDE such as Pycharm?
I'll be glad to hear some opinions 
pure sedge
done @mild topaz thankss 🙂
hasty grail
VSCode works fine for me. Also imo, Docker > Anaconda in terms of containerization.
 edgy cloud
mild topaz
edgy cloud
mild topaz
MemoryError: Unable to allocate 1.10 GiB for an array with shape (1760, 525, 425, 3) and data type uint8``` chrome kernel
I got pinged here? anyone calling me
mild topaz
@chrome kernel hii
i pingged u
MemoryError: Unable to allocate 1.10 GiB for an array with shape (1760, 525, 425, 3) and data type uint8```
i need help here?
chrome kernel
first of all, why is it trying to allocate ~1GiB of data for a small array
what does your code look like?
mild topaz
https://paste.pythondiscord.com/moqubavame.coffeescript my code here @chrome kernel
line 66 giving me an error
chrome kernel
Are you using linux @mild topaz ?
mild topaz
no, windows 10 @chrome kernel
chrome kernel
hmm
I would've just said echo 1 > /proc/sys/vm/overcommit_memory to allow for more python memory allocation

Stack Overflow
I'm facing an issue with allocating huge arrays in numpy on Ubuntu 18 while not facing the same issue on MacOS.
I am trying to allocate memory for a numpy array with shape (156816, 36, 53806)
with...
One of the replies have a windows solution
mild topaz
@chrome kernel thanks
lapis sequoia
hi everyone, does anyone know of any good NLP practice training datasets, like the MNIST dataset for images?
warm moth
I have a nice emails dataset if you would like. I got it from a friend so I don't know the repo link. I can share it via Google Drive if you wish.
 zinc stone
@lapis sequoia fast.ai has a nice collection; https://course.fast.ai/datasets
The Course and the Book
grave frost
@lapis sequoia NLP in images?
austere swift
@south gull yeah it was just a basic overview on how to use them i didnt learn like every feature
graceful gyro
Hi, I have been using VSCode and happy with it so far.
I am now setting my environment for web and data science projects.
To me it seems like the only thing I need as an extra is Jupyter, but should I really need to install Anaconda or an IDE such as Pycharm?
I'll be glad to hear some opinions
zinc stone
@graceful gyro if you're happy with vscode, go for it, especially if you do web projects as well since vscode is happy with whatever language. you probably have the python plugin for vscode? there are some built-in conveniences for datascience in that, like notebook support and interactive window etc https://code.visualstudio.com/docs/python/data-science-tutorial
anaconda is nice for having separate environments (collections of packages) for separate projects; maybe in one project you need an older version of python than the latest and anaconda can help with that
 lament vortex
Hi @graceful gyro.
@zinc stone already gave you some good information. It is possible to do data science projects using vscode but I suggest to use Jupyterlab or jupyter notebook for that. At the beginning it may be weird to use them but if you get use to them you will fall in love with them ;-)
Installing jupterlab and jupyter notebook is so easy. You just have to install Anaconda and then you will have all of them.
zinc stone
i've tried and failed to love jupyterlab so many times 🙂
@lament vortex do you happen to know if/how two .py files can share the same console in jupyterlab?
 heady hatch
Hey all. What does it mean when validation loss is lower than the training loss?
Such as
https://3qeqpr26caki16dnhd19sv6by6v-wpengine.netdna-ssl.com/wp-content/uploads/2018/12/Example-of-Train-and-Validation-Learning-Curves-Showing-a-Validation-Dataset-that-is-Easier-to-Predict-than-the-Training-Dataset.png
Couple reasons I was thinking of is validation is easier than training or training has a higher loss because of dropout.
 graceful gyro
@lament vortex @zinc stone Thank you. I am just a little biased against Anaconda from my beginner times a couple of years ago 🙂 I might be expecting to hear "oh install Anaconda because..." or "no, use VSCode and Jupyter notebook, it's fine", I am not sure really 🙂
lapis sequoia
what are the most used packages/modules in machine learning?
 pale thunder
numpy, pytorch/scikit-learn/keras/tensorflow
lapis sequoia
hi guys im trying to run a neural network through google colab and when im trying to train the model this is the error message that keeps poppin up . "ModuleNotFoundError: No module named 'pycocotools._mask'" can someone help me out ?
 surreal nacelle
Hey, do you guys have an idea of what might be going on with these decision boundaries ?
https://imgur.com/a/5lqmqsi (this is a gallery, not just one pic)
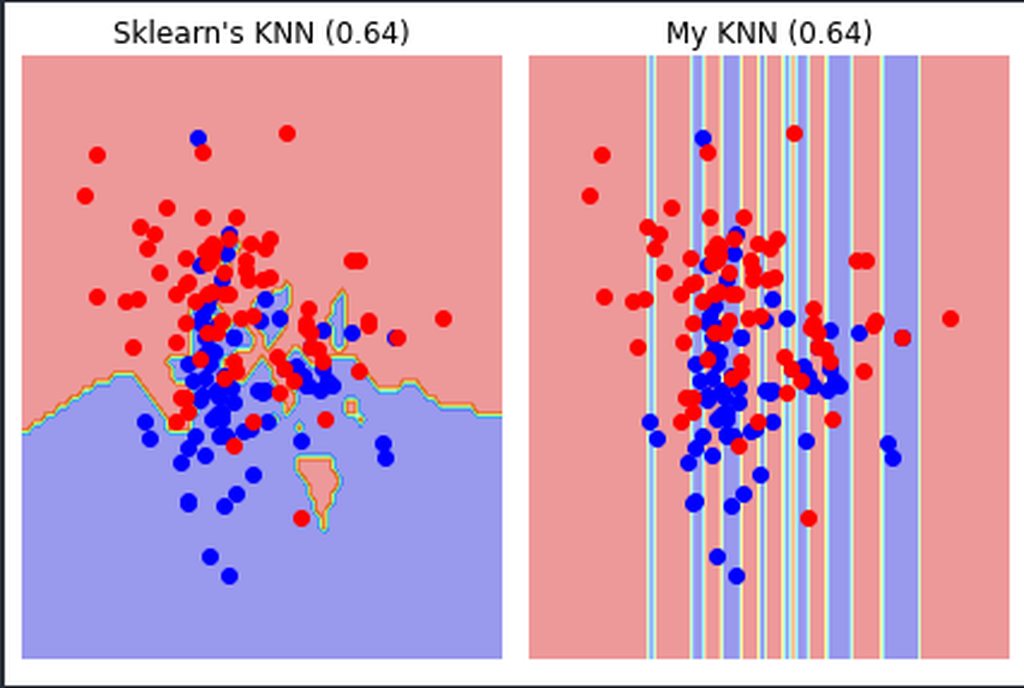
@lapis sequoia install the lib
surreal nacelle
pip show pycocotools
lapis sequoia
ty
lapis sequoia
@surreal nacelle its installed, but i still get ModuleNotFoundError: No module named 'pycocotools._mask'
surreal nacelle
why are you using this ?

GitHub
I have installed pycocotools with "pip install git+https://github.com/philferriere/cocoapi.git#subdirectory=PythonAPI", however when I try to implement python model_main.py it giv...
regal spindle
Hey guys,
I've been working on this for a week and still no luck. I used this tutorial: https://jamesbowley.co.uk/accelerate-opencv-4-3-0-build-with-cuda-and-python-bindings/ to set up cuda opencv for object detection. Using cuda v10.2, cudnn v8.0.3, and python 3.8 I buiilt opencv and the python bindings (from tutorial) into a separate conda environment. cv2.cuda.getCudaEnabledDeviceCount() reports my device so it seems to be set up properly. But now when I attempt to use cvlib to simply detect objects. I get a warning:
2020-10-06 11:41:33.033174: I tensorflow/stream_executor/cuda/cudart_stub.cc:29] Ignore above cudart dlerror if you do not have a GPU set up on your machine.```

Upon compile, and then an error:
```[ WARN:0] global C:\Users\m_bot\anaconda3\Lib\opencv-4.3.0\modules\dnn\src\dnn.cpp (1436) cv::dnn::dnn4_v20200310::Net::Impl::setUpNet DNN module was not built with CUDA backend; switching to CPU
Every frame afterwards. The code still runs but using my cpu and not gpu. The weird thing is that the path C:\Users\m_bot\anaconda3\Lib\opencv-4.3.0\modules\dnn\src\dnn.cpp is not even in my separate conda environment that the code is running from. That's the base conda environment. In fact I made sure that path now doesn't exist at all. Why would it be using that dnn module that doesn't exist?
lapis sequoia
what module should i use to make graphs
lament vortex
@zinc stone sorry for replying pretty late. I didn't understand your question. What do you mean exactly? Why do you want two .py files to share one console?
Also, why you failed to use jupyterlab?
Just let me know. Maybe I can help you to start using it 😉
@lapis sequoia So by graph do you mean plots or you mean graph with nodes and edges?
For plotting purposes you have several options such as matplotlib, seaborn, ... but seaborn is one of the most popular and used module for plotting
regal spindle
Why so hard to set up this environment for yolo detection on the gpu -_-
 serene scaffold
If I remove items from a dataframe, does that affect Grouped objects that are derived from it?
def stratified_sample(df: pd.DataFrame, label: t.Any, partitions: t.Dict[str, float]) -> t.Dict[str, pd.DataFrame]:
    samples = {}
    grouped = df.groupby(label)

    for partition_name, percentage in partitions.items():
        samples[partition_name] = taken_values = grouped.sample(frac=percentage)
        df.drop(index=taken_values.index)

    return samples


data = pd.read_csv('./data.csv')
stratified_sample(data, 'Class', {'a': .7, 'b': .3})
this way appears to be more effective
    for partition_name, percentage in partitions.items():
        samples[partition_name] = taken_values = grouped.sample(frac=percentage)
        grouped = df.drop(index=taken_values.index).groupby(label)
this won't be right though because after the first iteration, 70% will have been removed, so it will be trying to sample 30% of what's left
 stiff fable
what's the formula for getting the x, y coordinates of the middle of the screen?
regal spindle
width / 2, height / 2
 silent epoch
can i ask sql questions here, or only python?
velvet thorn
@serene scaffold you should not do that, in general
groupby caches computed results
silent epoch
Because i'm trying to import data into sql, however I have issues with the data type due to the date formatting. Also, in SQL, it considers the commas between the integers as two separate columns.
velvet thorn
!e
df = pd.DataFrame([[1, 1], [1, 2], [2, 3], [2, 4]])
a = df.groupby(1)
b = df.groupby(1)
a.mean()
df.drop(index=[2], inplace=True)
b.mean()
 arctic wedgeBOT
You are not allowed to use that command here. Please use the #bot-commands channel instead.
velvet thorn
ugh
oh well
Because i'm trying to import data into sql, however I have issues with the data type due to the date formatting. Also, in SQL, it considers the commas between the integers as two separate columns.
@silent epoch so what do you want to happen?
how are you trying to import the data?
silent epoch
i just want to import the csv file using postgresql
velvet thorn
use to_sql on the dataframe
silent epoch
like right after?
velvet thorn
right after what
silent epoch
oh i mean, i've never used the to_sql from pandas before. just looking up how to do it now
velvet thorn
basically it writes a pandas DF to an SQL table
silent epoch
@velvet thorn thanks gm. Don't know what changed after converting it to sql, but it imported fine now
 trail shell
Hey guys not sure if this is the right thing to use because I only have done very little in ml
but is there anyway to like find the users goal?
ex:
if the user adds a task called "send email to joe"
can i suggest something like
send email
which opens the mail app
if that makes sense
velvet thorn
Hey guys not sure if this is the right thing to use because I only have done very little in ml
@trail shell this is called NLP
natural language processing
it is doable, but not a simple problem in general
charred blaze
that's intent classification AFAIK
velvet thorn
that's intent classification AFAIK
@charred blaze yup, it is, more specifically
 bitter fiber
Hi guys, How would one create a function to filter data in a pandas dataframe with variable number of columns and values?
for example:
def filter_special(df, query):
    # query is [(0, 0, 1),
                (1, 1, 0),...]
    filtered = df[df[0'th column]==query[0] && df[1st column]==query[1] && df[2nd column]==query[2]]
i have this list of tuples with every combination of values (0, 0, 0), (1, 0, 0), (1, 1, 0) etc
bitter fiber
I have varying number of values and I have a working version but I am using a for loop.. So the data gods are not happy...
def filter_special(df, query):
    # query is (0, 0, 1)
    output = df
    for index, value in enumerate(query):
        output = output[output.iloc[:, index]==value]
return output```I just wrote and tested this and it works which is a start lol..
 last peak
yes iloc
fringe cove
can someone explain to me while reading data from a csv file, the len(row) change from 28 to 30 ? it makes me get some out of bounds error for the row[29] i want to use sometimes. thank you
last peak
def filter_special(df, query):
# query is [(0, 0, 1),
(1, 1, 0),...]
filtered = df[df.iloc[:,0]==query[0] && df.iloc[:,1]==query[1] && df.iloc[:,2]==query[2]]
does that not work
bitter fiber
I dont understand eddy
Yeah that doesnt because you are trying to == a dataframe with a tuple
last peak
you can do try to do them separtely then
fringe cove
ok so i have this csv file that have many columns up to 30. i iterate through it and strangely it seems that some colums doesnt disapear since when i try to log the number of columns - i.e len(row) - it should be 3à fixed through all the file but sometimes i get a len = 28 and not 30. since i try to use the 29 colum sometimes i got a out of bounds from the row[29]
arctic wedgeBOT
Hey @fringe cove!
Uh-oh! It looks like your message got zapped by our spam filter. We currently don't allow .txt attachments, so here are some tips to help you travel safely:
• If you attempted to send a message longer than 2000 characters, try shortening your message to fit within the character limit or use a pasting service (see below)
• If you tried to show someone your code, you can use codeblocks
(run !code-blocks in #bot-commands for more information) or use a pasting service like:
last peak
like
output1 = output[output.iloc[:, index1]==value]
output2 = output[output.iloc[:, index2]==value]
output13= output[output.iloc[:, index3]==value]
out_final = outpu1outputoutput3
does that work?
bitter fiber
right thats wut i looped above
columns is not rows eddy
you should print(df.shape)
df.shape has [rows, columns]
bitter fiber
Are you using pandas?
fringe cove
no simple csv reader
bitter fiber
oh
fringe cove
Pastebin
Pastebin.com is the number one paste tool since 2002. Pastebin is a website where you can store text online for a set period of time.
bitter fiber
idk man
do:
import pandas as pd
df = pd.read_csv("filename.csv")
print(df)
J'ne sais pas; possiblement vous lit soulement le rows
fringe cove
tokenizing error
bitter fiber
Right. but using csv reader will give you a mess later on.
fringe cove
  2 df = pd.read_csv("scripts/csv/PHMEV/OPEN_PHMEV_2014.CSV",encoding='latin-1')
  3 print(df)
perfect. did the error recommend using engine="python"?
you can keep csv in your codebase
just use pandas to look at the data
bitter fiber
Your getting tokenizing error because your csv is formatted incorrectly
like:
col1, col2
1,
2, 2```trying ti print head
bitter fiber
coo
bitter fiber
yep
last peak
@bitter fiber how about something like this
df[bool(u*v) for u,v in (zip(df.iloc[:,0]==1, df.iloc[:,1]==1))]
just repeat that for 3 cols
bitter fiber
its going to be 1 and 0 forever
last peak
i mean for picking which rows u want
bitter fiber
it looks good i just cant read it lol like grok it fully
fringe cove
put ur code inside ' ``` '
fringe cove
not this one ^
last peak
oh okay thanks
bitter fiber
lol
Eddy your code was a mess
do you know about * when passing a list through a function?
like
iter = [1, 2, 3]
sumfn(*iter)
never read about it
  2 df = pd.read_csv("scripts/csv/PHMEV/OPEN_PHMEV_2014.CSV",encoding='latin-1',    engine = 'python')
  3 print(df.head(5))
at line 24451 it seems there is a problem
fringe cove
fck
fringe cove
oh probably yes
fringe cove
ok
bitter fiber
for speed you can then save it as CSV but with delimiter = "|"
fringe cove
ok i got a null byte detected
pass in engine -c instead
i saved the file in .xls format btw
fringe cove
oh forgot read excel sry
bitter fiber
you may need to pip install some xlreader library
but it should be self explanatory
fringe cove
ead_excel() got an unexpected keyword argument 'encoding'
last peak
df[
[bool(i*v*w) for i,v,w in         zip(df.iloc[:,0]==1,df.iloc[:,1]==1,df.iloc[:,2]==1)]
]
theres the 3 col version
you can make it more generic i guess for n col version
oh also i just realized u can use the .apply function too
ah but ull have to store the bool in a new col, maybe not
well u can store same place, but then it gets ugly
fringe cove
@bitter fiber ok i got a print from df.head
fringe cove
gives me 35 cols
bitter fiber
dirty data huh?
fringe cove
bro
fringe cove
yes
bitter fiber
wuts x?
fringe cove
i printeddh.head(5)
so 5
tellls me 65535 rows
but in openoffice calc i had way more like 2M5
it is 1GB file 65 k rows seems not good to me
dirty data huh?
@bitter fiber 2014 csv file registering all the french drugs codes it is dirty afff
and i have up to 2020 to do lol
and many more
bitter fiber
bro we are on the same boat
lol.. I got 2 new clients and need to pump out some work before 2 AM cause i need atleast 5 hours of sleep to start work tomorrow
fringe cove
i'm lucky enough to not be urged by time
bitter fiber
and i cant eat cbd candies cause they destroy your liver lmaao
We are all urged by time
last peak
hey do you guys know if there is some kind of a soft limit for how big a dataframe can get running with ipython in linux or git bash terminal
I am trying to get a column out of a table with 11 mill rows
fringe cove
well i'm stuck at 65535 lol
bitter fiber
every environment has their own maximums but I would say your ram is the capacity
with some virtual ram
I have 256 GB RAM on my workstation 🙂
last peak
oh wow
bitter fiber
Because pandas is in memory
fringe cove
arfff
fringe cove
thinkpad ?
fringe cove
yeah ok
bitter fiber
I wish I had a mac for work.. my first job was a nice mac
last peak
Do you use it for ML?
bitter fiber
but i broke it and got a new job before they found out lol..
fringe cove
well i have a mac i like it very much but only for leisure
bitter fiber
I use workstation for my text processing and my thinkpad for stats stuff
fringe cove
for work i just love the simple ubuntu
bitter fiber
yeah I have ubuntu on my workstation
fringe cove
bro we buddies
fringe cove
maybe it is not enough pandas handling 1GB file ?
last peak
ah that must be nice
fringe cove
1M lines
last peak
i guess i have to use iterators to avoid this ram cap
fringe cove
i checked with htop and my memory never really fluctuate or fill tho
bitter fiber
This is why people use streaming things like kafka
fringe cove
big blocks of data
bitter fiber
Stack Overflow
I am trying to read a large csv file (aprox. 6 GB) in pandas and i am getting a memory error:
MemoryError Traceback (most recent call last)
<ipython-input-58-
chunks like reading pieces of the data at a time; there are many names for thiws
fringe cove
the lol thing is i just need to read these data to insert in into another database in django
last peak
oh i like this, thanks
fringe cove
i saved my file as xls as u said 😮
bitter fiber
I told you something more complicated
turn into XLSX and save with pipe delimited should be fine with your small data set
you can also QUOTE the cells in pandas
bitter fiber
so that each cell has ", | i am an ugly data tweet", etc..
fringe cove
so i saved my csv into xls and i use pandas with read excel right now
 river crest
May I ask something here?
fringe cove
dont ask to ask, just ask
bitter fiber
you should ask politely.. thats not bad.
haha
atleast when im here.
ima get a late night snack brb roflolmao
river crest
I am facing some problem in loading images in my online jupyter notebook running on binder?
anyone have any idea hoe to upload images from my local storage and how to retain those images if for future work.
bitter fiber
by local storage do you mean your file system or lan network?
because your online jupyter notebook probably can only connect from online servers
river crest
I got success in loading those images directly like I just use upload button on the home page of the note book but it will not retain those images for future work
bitter fiber
ah. because jupyter online is in memory only i think
river crest
because your online jupyter notebook probably can only connect from online servers
@bitter fiber
M having those images in my computer
bitter fiber
are you paying for server space to save those files?
to not pay: you can just make a github account or repo and drop the images there then use http link
river crest
no
not paying it' just a free space to learn data science
bitter fiber
yep
river crest
to not pay: you can just make a github account or repo and drop the images there then use http link
@bitter fiber
I have a github accnt
bitter fiber
Use your data hat brotha; remember data can flow over the internet with "GET" requests and links
fringe cove
i have been facing my computer doing nothing
bitter fiber
you can inject the image with a requests.get("https://github.com/acctname/link_route.png")
fringe cove
from last message
fringe cove
i need my rows broo
bitter fiber
no you dont lol.
river crest
you can inject the image with a
requests.get("https://github.com/acctname/link_route.png")
@bitter fiber
ohkk thanks
will try this
bitter fiber
"You need to rationalize what you have and what you need and how to get what you need from what you have."
-Buckler, the late great Data Engineer for some company that everyone knows.
fringe cove
let me face that sentence
river crest

fringe cove
i need my rows
bitter fiber
you don't need rows you need data structures
to structure the data in a way that your mind understands it
fringe cove
well i need to iterate through each row to get the data tho
bitter fiber
@bitter fiber
ohkk thanks
will try this
@river crest
Note that you need to pip install and import requests
yeah
fringe cove
since i need to add each as a entry each at a time
bitter fiber
wuts the problemo?
fringe cove
problem is i have 65536 rows
river crest
yes I have installed all required packages
fringe cove
when my file has 1M rows
bitter fiber
no you don't..
I asked like 100 points above: what is the result of print(df.shape)
fringe cove
65535,35
fringe cove
what is nippet please?
fringe cove
ubuntu
bitter fiber
google: how to snippet in ubuntu
bitter fiber
going to sleep
bitter fiber
can u highlight column A?
fringe cove
bitter fiber
Bro.. all that can be is that your reading in the wrong filename
lol
maybe your reading the wrong file..
bitter fiber
rofl.. I mean Im sure it's happened to the best of us
fringe cove
fcking open ofice trash
bitter fiber
lol
fringe cove
oh and also openoffice tells me
it cant open all the lines
so there must be more than 1M
loool
bitter fiber
Hahah
bitter fiber
You could read it as text with open("filename.csv") as file: file.read()
and save it in chunks
Chunk it up
I used to be a line cook lol
back in highschool
data is like cooking: if it all doesnt fit in the pot/sautee then chunk it
 teal star
how do you make a Multi-Target Regression model? and how different is the process from single target regression(Prediction and Metric Evaluation)?
pure sedge
Is flask not available on free py-charm edition?
 lilac kindle
what is a good way to build an infographic in python?
 cerulean flint
Is there a way to check if an Excel file in SharePoint has been edited with Python?
I want to trigger an action based on changes to a file in a SharePoint location.
cerulean flint
Already found a way all, thanks anyways!
 plain thicket
which is best freemium api to make chatbot?
zinc stone
@zinc stone sorry for replying pretty late. I didn't understand your question. What do you mean exactly? Why do you want two .py files to share one console?
Also, why you failed to use jupyterlab?
Just let me know. Maybe I can help you to start using it 😉
@lament vortex haha, i use it now and then, but failed to love it so far 😄 i usually separate my code, so i have functions and/or classes in separate files that i import into my main notebook/.py file where i do the high level stuff so to speak. so while testing the functinos, it's convenient to share the kernel with the main file. two files sharing the same kernel is possible in jupyterlab, but to run single/multiple lines for a .py file it has to output to a console window, and even though two files can share a kernel they cant share a console. at least not from what i've found so far. does that make sense?
 old meteor
Hello, I am using df.concat to add a serie to a dataframe, but the result shows that the added serie has no column name. So I tried to use series.rename('name_for_the_column') to give the serie name before adding it to the dataframe. However, series.name shows that its name is still 'none'. Any idea?
lament vortex
@lament vortex haha, i use it now and then, but failed to love it so far 😄 i usually separate my code, so i have functions and/or classes in separate files that i import into my main notebook/.py file where i do the high level stuff so to speak. so while testing the functinos, it's convenient to share the kernel with the main file. two files sharing the same kernel is possible in jupyterlab, but to run single/multiple lines for a .py file it has to output to a console window, and even though two files can share a kernel they cant share a console. at least not from what i've found so far. does that make sense?
@zinc stone yep. Now it makes sense. Actually for these purposes I use IDE as well. I use jupyterlab or jupyter notebook when I want to start a new machine learning project because it is easier to do experiment and test different things. Also, I think it is way better for visualizing and plotting the data. Finally, when I'm done with the project and then I want to use it in production I try to use an IDE such as vscode. So I'm not even sure if it is possible to do that or not.
old meteor
So the question is how I should give a serie a name so that after it is concated to the other dataframe, it has a column name
 paper niche
how are you concatenating / doing the renaming? a simple example like this should work, for example.
import pandas as pd
df = pd.DataFrame({'a': [1, 2, 3], 'b': [1, 2, 3]})
ss = pd.Series([4, 5, 6])
new_df = pd.concat([df, ss.rename('c')], axis=1)
@old meteor
 hearty token
Could anyone help me out for a selenium problem in #help-pear
zinc stone
@lament vortex for prototyping/experimenting i love atom+hydrogen, soo convenient with inline results and ability to run single lines, just the selection (which can be part of a line) , or entire cells
lament vortex
@lament vortex for prototyping/experimenting i love atom+hydrogen, soo convenient with inline results and ability to run single lines, just the selection (which can be part of a line) , or entire cells
@zinc stone I haven't felt that I need a replacement for Jupyterlab or Jupyter notebook but maybe I give it a try.
zinc stone
fair warning: the more editors you try the more you realise they all have one or two great things and you'll wish there was one that had them all 😄
hearty token
My code:
try:
    main = WebDriverWait(driver, 10).until(
        EC.presence_of_element_located((By.CLASS_NAME, 'col-sm-6 my-1'))
    )
    print (main.text)
except:
    print("Exception Founded")
    driver.quit()```
above is an excerpt of the code i'm using to locate an element with a class named 'col-sm-6 my-1' using the selenium module for web scrapingalthough that element is identifiable
its throwing an error that it doesn't exist
am i doing anything wrong?
Ignore my question above ^^, I managed to fix it
lapis sequoia
I need help, keep getting this error ModuleNotFoundError: No module named 'pycocotools._mask, even tho i have pycocotools installed
ping me if you can help
old meteor
@old meteor
@paper niche Thank you. I just tried your method and it works.
I'll try once again to use series.rename('c') before using concating.
It doesn't work if I do (as in your example)
ss.rename('c')
new_df = pd.concat([df, ss], axis=1)
the ss won't have a column name 'c'
Why is that?
paper niche
because by default, ss.rename() doesn't modify the series "in-place"
you either do
ss = ss.rename('c')
# or
ss.rename('c', inplace=True)
Much thanks! I just learned that I might use more 'inplace' in the future.
lapis sequoia
can someone help me with my cats and dogs classification with keras?
my val_Accuracy is constant at all epochs!
from keras.layers import Conv2D,MaxPooling2D,\
     Dropout,Flatten,Dense,Activation,\
     BatchNormalization
from keras.optimizers import SGD
opt = SGD(learning_rate = 0.001,momentum = 0.85)

model=Sequential()
model.add(Conv2D(64,(3,3),activation='relu',input_shape=(image_height,image_width,image_channel)))
model.add(MaxPooling2D(pool_size=(2,2)))
model.add(Dropout(0.5))

model.add(Conv2D(128,(3,3),activation='relu'))
model.add(MaxPooling2D(pool_size=(2,2)))
model.add(Dropout(0.5))

model.add(Flatten())

model.add(Dense(128,activation='relu'))
model.add(Dropout(0.5))
model.add(Dense(1,activation='sigmoid'))
model.compile(loss='binary_crossentropy',
  optimizer=opt,metrics=['accuracy'])

model.summary()
this is my layer
here's the google colab file

 grave frost
@lapis sequoia how did you split the val data?
grave frost
validation data
lapis sequoia
but how do i split it?
grave frost
Then how can you calculate val accuracy without val data?
lapis sequoia
but its there!
i have 2 folders
train and test
train has cats and dogs
test has cats and dogs too
grave frost
test dataset is for "testing" to see that the model generalizes. Val data is usually derived from the training data
lapis sequoia
yeah but i use test data as well for validation
i have done train_image data gen with train folder and test with test folder
grave frost
That is not a very good practice
lapis sequoia
actually for testing i take some other photos
grave frost
Allright. You can usually follow some online tutorial if you are new to ML
lapis sequoia
am not new!
can you please check my colab ?
I just cant find a way out,my val_accuracy is constant at all epochs
grave frost
Well, an online tutorial is just for guidance, not for exactly copy-pasting code...
I dont see it being constant
grave frost
Maybe, can you try increasing the batch size?
lapis sequoia
like 16 - 32 ?
i have tried it too
i have tried changing my learning rates too
the thing is I cannot change my layers
grave frost
why?
lapis sequoia
its instructed not to
grave frost
where?
lapis sequoia
am doing this for a project
grave frost
uh-huh
lapis sequoia
only the layers
grave frost
Well, then you can't expect to squeeze much performance out of them. 70% seems good enough
lapis sequoia
oh then is it perfect for that condition ?!
grave frost
But I don't expect mroe that 5% increase
lapis sequoia
but its not right for me
grave frost
upsample the data, it's the time-tested way
lapis sequoia
thats ok but i just want the maximum with that
grave frost
Hmmm.. is there any restriction on the number of parameters?
and how much data do you have?
grave frost
how much?
grave frost
Then just use a Image Augmentation library and apply all those filters (especially the elastics)
lapis sequoia
augmentation ?
grave frost
Just google it
lapis sequoia
yeah just that ?
grave frost
ofc, it can 10x your data
lapis sequoia
like image data gen does right ?
grave frost
just don't apply it to the testing set
grave frost
Extremely basic - only Hflipping and Vflipping
lapis sequoia
which one ?!
grave frost
I used this one:- https://github.com/aleju/imgaug pretty good
 lapis sequoia
imgaug file ?
grave frost
What?
lapis sequoia
in that github repo
grave frost
Yeah, just install it and use
grave frost
Much more easier if you do it on your own computer
And since you have so less data, upload wont be a prob
lapis sequoia
but i dont trust my laptop with deep learning
grave frost
It's not DL- it's basic programming and a bit of maths
lapis sequoia
it took like three days for a model to train previously
grave frost
Just read up more about it
grave frost
your welcome 🙂
lapis sequoia

grave frost
Anyone know of any resource online that doesn't ask for a credit card and can provide high RAM M.L environments like Colab and Kaggle?
lapis sequoia
you should probably think of getting aws @grave frost
grave frost
Yeah, but it requires a card
lapis sequoia

It provides a platform for anyone to develop deep learning applications using commonly used libraries such as PyTorch, TensorFlow and Keras.
pale thunder
mat @ mat1
lapis sequoia
hope this helps @grave frost
desert oar
@fading burrow also np.dot
rustic apex
Is the pandas_datareader, is the number of stock information, is that limited to by the minute pings?
tidal sonnet
is R still used alot?
pale thunder
yes
tidal sonnet
kk
 earnest forge
is R still used alot?
@tidal sonnet roughly speaking, R is used for academic purposes and Python for commercial goals
tidal sonnet
Ah... that makes sense
charred blaze
actually my company does use R for some time series stuff in production
but yeah, Python's used way more.
 mossy badger
speaking of which, anyone know of a good server or whatnot to ask for help with R? Tried devcord but it's always very dead
 sage palm
Can someone help me? It have to implement some math. The math is hard (but I have a good grasp of it), but the coding part is very easy for someone who is familiar with Python.
I have written some myself, but it does not work 😕 I have used the whole day one it.
desert oar
@mossy badger freenode #R is somewhat active
sage palm
It will be great if you can!
Direct implementation of the above and with a stopping criteria:
desert oar
I would use a while loop and increment n each iteration, until the criterion is reached
last peak
oh thats a great idea
sage palm
It is a bit more complicated than that. If you do not mind I will like to share my screen and talk you throgut.
I would use a
whileloop and incrementneach iteration, until the criterion is reached
This is my idea
last peak
Ah i might be okay with that if I wasnt at work rn
sage palm
If you guys do not have time. It is fine. I understand.
desert oar
What are eta and P?
last peak
you can paste code here, we can take a look at it
sage palm
P is a sub-stochastic matrix. eta is eta = max (-a_ii).
I'm implementing an alternative definition of exp over sub-intensisty matrices.
This is the problem:
desert oar
can you show what you already did, if anything?
oh, use a code block
3 ` characters
!code-block
arctic wedgeBOT
Discord has support for Markdown, which allows you to post code with full syntax highlighting. Please use these whenever you paste code, as this helps improve the legibility and makes it easier for us to help you.
To do this, use the following method:
```python
print('Hello world!')
```
Note:
• These are backticks, not quotes. Backticks can usually be found on the tilde key.
• You can also use py as the language instead of python
• The language must be on the first line next to the backticks with no space between them
This will result in the following:
print('Hello world!')
import numpy as np
from scipy.linalg import expm
from math import factorial


def exp2(A,x,epsilon):

    # Defining eta.
    eta = np.max(-np.diag(A))

    # Initializing. This is the partial sum corresponding to n=0.
    last_partial_sum = np.exp(-eta*x) * np.eye(A.shape[0])


    # Defining the matrix P
    P = np.eye(A.shape[0]) + 1/eta * A

    # n is the corrent power.
    n = 1


    while True:
        nth_power_of_P = np.linalg.matrix_power(P,n)

        nth_term = np.exp(-eta*x) * (eta*x) ** n / factorial(n) * nth_power_of_P

        nth_partial_sum = last_partial_sum + nth_term


        summ = 0
        for n in range(0,n+1): # 0 and n shall be included!
            summ = summ + np.exp(-eta * x) * (eta*x)**n/factorial(n)
            n = n + 1
            return summ

        if  summ > 1 - epsilon :
            return nth_partial_sum , n


        last_partial_sum = nth_partial_sum

        n = n + 1


# Testing

A = np.array([
                [-5, 2, 3],
                [2, -6, 4],
                [4, 5, -9]
])

A_over_20 = A/20

x = 1

epsi = 1e-4
thanks!
sage palm
Yes, the answer is just a scalar. Which is wrong.
sage palm
yes
sage palm
x ≥ 0 is a scalar
desert oar
ah, yeah
so you should have scalar * scalar * matrix
so the result should be a matrix, right?
desert oar
delete the return summ line
i assume that was left in there by mistake from previous testing?
ok i see, your logic is somewhat more convoluted than it needs to be. but it's fine
but i think that line is the problem. do you see why?
sage palm
 nth_term = np.exp(-eta*x) * (eta*x) ** n / factorial(n) * nth_power_of_P

OverflowError: int too large to convert to float
when removing the line.
There is no latex support here 😦
desert oar
no, there isn't
i see
cpython has a maximum float size
but not a max int size
so you can't use built-in floats to do arbitrary math on really huge numbers, like what you would get from really big factorials
sage palm
Are you 100 % sure?
I did something very similar in a previous problem.
My only problem is that I can not implement this:
@desert oar But I can see why it does not make since to return summ
Wait, maybe my code is actually written as I should!
I'm taking a course in numerical analysis. So this must be a pathalogical case?
desert oar
you probably know more about numerical analysis than me.. but what i do know is that factorials get very big, very fast
how fast should this converge?
before you conclude that you found a pathological case, is your epsilon unreasonably small? are your other inputs sensible?
sage palm
Yes, epsilon must be too small for the computer to handle! The epsilon is choosen be me.
I tried 0.1, and it worked!
last peak
haha
sage palm
This is my second python program!
@desert oar
I can give you a voice over of the problem. It will the be eaiser for you to help me.
Please tag my name, if someone answers me. So I can be able to see the reply immediately.
What can I do to see more significant digits?
desert oar
@sage palm when printing? use format
!e ```python
import math
print(format(math.pi, '0.18f'))
@desert oar :white_check_mark: Your eval job has completed with return code 0.
3.141592653589793116
!e ```python
import math
print(format(math.pi, '0.64f'))
@desert oar :white_check_mark: Your eval job has completed with return code 0.
3.1415926535897931159979634685441851615905761718750000000000000000
(of course math.pi itself has limited precision)
desert oar
the console prints the repr of the object
repr of a float is hard-coded to 17 decimal places https://github.com/python/cpython/blob/master/Python/pystrtod.c#L796

GitHub
The Python programming language. Contribute to python/cpython development by creating an account on GitHub.
!e ```python
import math
print(repr(math.pi))
@desert oar :white_check_mark: Your eval job has completed with return code 0.
3.141592653589793
rather, 17 characters
also note that these aren't "significant figures" - just length of the resulting string
you would need to do some more work to get proper scientific sig figs
sage palm
My prof. said the code does not work. At least he was nice enough to say it does not work. The assigment is not graded but I have to pass it to come to the theoretical exam (which is for me much eaiser.)
sage palm
so you can't use built-in floats to do arbitrary math on really huge numbers, like what you would get from really big factorials
@desert oar I think this is true
I'm not sure why that works and mine do not. (not 100 % that the output is correct)
 turbid halo
holy shit
that is why
I feel so discouraged
when wanting to learn more python
that seems so advanced
like I feel like I can never get to that level
wow
 cedar sun
hi
i am using amd gpu
so i believe i dont have cuda (?)
or do i? how can i know or install them?
i wanna use pytorch (i believe) wiuth gpu acceleration
 jaunty cove
Is anyone familiar with Dask?
velvet thorn
that seems so advanced
@turbid halo there are different types of complexity
from a pure programming perspective, that's actually pretty simple
but it's relatively advanced mathematics
so yeah...even if code is simple, if it does something related to a domain which you know nothing about, it can look discouraging
but don't worry so much about that! focus on being able to do stuff in your chosen field
 wintry mesa
does anyone know how to use iGraph fo data science?
 deft harbor
@jaunty cove to a degree, just ask the question
last peak
!e
arctic wedgeBOT
You are not allowed to use that command here. Please use the #bot-commands channel instead.
last peak
!e ```python
import math
print(repr(math.pi))
jaunty cove
@deft harbor I have imported some CSV files as dask dataframes and I need to get the count of unique values for the PKID.
Here is essentially what I have so far:
count = df.groupby(df.column)
count = count.column.unique().compute()
print(count)
but this does not run and doesnt give an error
last peak
def test():
  pass
 plucky zephyr
if the purpose model to predict, is it important to make model not overfit ?
i'm use catboost and still struggle
austere swift
yeah its pretty important
whats the point of predicting your training set right if you cant predict anything else lol
jaunty cove
if the purpose model to predict, is it important to make model not overfit ?
i'm use catboost and still struggle
@plucky zephyr Are you asking how not to overfit the model, or just if its's important? Or both lol
austere swift
if you wanna know how one of the easiest ways is to just add some l1/l2 regularization and dropout
and also try to get more generalized data and a larger dataset
jaunty cove
Dask seems to be pretty uncommon... What are some good ways to deal with large datasets in Python?
velvet thorn
Dask seems to be pretty uncommon... What are some good ways to deal with large datasets in Python?
@jaunty cove how big
jaunty cove
@velvet thorn Total dataset is 1tb, but the sample my team and I are going to be working with is about 100gb
jaunty cove
We are most likely going to be performing clustering , but I am having trouble even running basic descriptive analyses
jaunty cove
I think I am just confused about the general syntax for Dask. I have followed the documentation verbatim, but I am still being thrown errors
velvet thorn
yeah.
distributed computing is hard.
how much experience do you have
with Python/coding in general
jaunty cove
I am pretty novice, I am in a masters program now, but am still pretty new to Python