#data-science-and-ml
1 messages · Page 256 of 1
 grave frost
FC layers are just another term in TensorFlow/Keras to indicate Dense layers
oh, I thought Fully connected.
grave frost
I don't see the similarity between a conv layer and Dense
 brittle agate
I messed up with R-CNN.
grave frost
Ah- np
grave frost
np
 dire acorn
Hey guys anyone have time for a quick question?
brittle agate
Yes.
grave frost
@modern hatch My only problem with using cross-entropy loss was that the accuracy was 0.0000e+ and the loss was negative. I think that it may be due to some other factor. Could you provide some ideas to fix that?
dire acorn
I need to turn the numbers generated by the labelencoder() back into words for easy readability and I am not sure how to
brittle agate
I can't help with it, sorry.
dire acorn
Oh no!
 modern hatch
@grave frost I wouldn't worry about your loss function but your problem formulation. Why should this work? Come up with a simple, made-up encryption method and see if you can get a decent result on that
grave frost
@modern hatch Well it is just an experimentation,  don't get all hyped up 🙂
My problem was regarding accuracy. Even for a random guess, it is not correct
modern hatch
I'm not, just trying to be constructive
I mean, even predicting the plain text from a "cypher" that permutes the input isn't trivial
grave frost
ofc it isn't
That's the whole point of a cypher
Hmm... I think there is an error with my validation data generator. Will debug it tomorrow to see if it works.
 proven kite
someone tell me whats wrong with my implementation of data science?
i mean linear regression lmao
 serene scaffold
My AI prof has the formula Sigma[i=1, n](w_i x_i) where w and x are both 1x3 arrays
proven kite
pls help
serene scaffold
is that basically the sum of the elements for the inner product of w and x?
@proven kite what is this code doing that isn't what you wanted?
proven kite
wrong out put
ill send u a screenshot
actually fuck hang on
heres the full thhing from the jupyter notebook
 ripe forge
What's the correct formula? As it stands, this is a logical error yes?
Tough to answer without knowing what the code is intended to write out.
 gentle widget
.help
 solid aurora
Do y'all know of a TensorFlow quickstart that includes reading images from files (not the tf.data module), performing augmentations, and training a model using them?
I just need example code to look at because I've never used the TensorFlow API before
 hasty grail
Is there a particular reason why you are avoiding tf.data?
solid aurora
@hasty grail as far as I understand, tf.data is sample datasets
but maybe I'm misunderstanding?
I'm probably thinking of sklearn.datasets
 rustic apex
I created a “task” to create a jupyterlab project and start it, but, how can I also include to install Numpy and Pandas as well?
rustic apex
@deft harbor that installed fine. It creates a ENV, Jupyterlab project and starts it, but how do I then have it contribute and install np and pd?,
When I run my task of installing both, they do, but I want that to install them all in one command of the whole project
 deft harbor
Did you use anaconda, pip, or something else?
solid aurora
@deft harbor so I found tf.keras.preprocessing.image_dataset_from_directory, but I'm kinda stuck on tensorflow 2.0.0 which doesn't seem to have that
is there a similar way to load images in the TF 2.0.0 api?
rustic apex
@deft harbor i used pip3
deft harbor
@rustic apex ```
pip3 install pipenv
mkdir task
cd task
pipenv installed jupyterlab pandas numpy
pipenv shell
jupyterlab lab
Then just use import using basic commands inside jupyter
@solid aurora I used from_tensor_slice last project
rustic apex
@deft harbor do I need to use pipenv? I haven’t used that command. I use:
Python3 -m venv venv
Python source ./venv/bin/activate
deft harbor
No, but its the way I find to work with projects outside conda
solid aurora
@deft harbor ok, so I need to load the images and convert to tensors myself
deft harbor
Makes it easy to deploy to production
deft harbor
There is a tensforflow hub way of doing it, bit I've never tried that. I think its google just trying to get my data. 
solid aurora
@deft harbor uh is that method uploading your data to tensorflowhub and then downloading it?
ngl that seems roundabout and dumb
ugh I think I might as well figure out how to get tensorflow 2.3.0 working
all the tensorflow tutorials I find are for 2.3.0
rustic apex
@solid aurora yes, but I would like that to be installed within the task that creates the project
solid aurora
wdym "task"??
i've never used jupyterlab before, is it a jupyterlab-specific term?
jupyter notebooks definitely don't have tasks
rustic apex
@solid aurora a task is in VSCode, it’s a json file
solid aurora
ok paste the code for that json file here please
also how are jupyterlab and vscode working together, are you using the jupyter notebook view of vscode?
rustic apex
@solid aurora I’m not by my computer now.... i looked I there’s a “delendsOn” part of the code, and then I guess it links to the task that’s being triggered.
hasty grail
@solid aurora If you're unwilling to upgrade to TF2.3 you can always look at the source code for the function and copy the operations into your code
solid aurora
Hmm not a bad idea
 lapis sequoia
can someone please help me with this
the error thrown is : AxisError: axis 2 is out of bounds for array of dimension 2
lapis sequoia
so should I stop using Image data gen?
hasty grail
you can just add a color channel
hasty grail
yeah
lapis sequoia
to (1125, 1600,1)?
lapis sequoia
pic?
hasty grail
np
lapis sequoia
should i consider reshaping all the images?
hasty grail
if you want to use the generator on each image then yeah
and have to add a color channel when feeding it to the model anw
lapis sequoia
its 1 right ?
hasty grail
yes
hasty grail
you're overcomplicating it 😛
hasty grail
🙂
lapis sequoia
thanks man it worked! @hasty grail
hasty grail
np
 olive lichen
hello, first foray into coding. working with nltk. would anyone here be interested in helping me with some homework questions?
 velvet thorn
hello, first foray into coding. working with nltk. would anyone here be interested in helping me with some homework questions?
@olive lichen don't ask to ask, just ask.
olive lichen
@velvet thorn good to know for next time when i'm not sleepy, thank you
 zealous ermine
Can we ask about gpu requirements for machine learning here?
 cedar sky
Can we ask about gpu requirements for machine learning here?
@zealous ermine Ofcourse you can
zealous ermine
Yay 🙂 ok so for machine learning, why is it recommended to have more VRAM? Does it just make stuff faster?
Like do I need to store the whole model in vram, or can I store it partially in ram, and it’s just faster if the whole thing is in vram?
 odd yoke
some models take up a lot of VRAM, thus, simply can't run on smaller GPUs
You would store the entire model in (V)RAM
in fact i don't think i've ever used a model that was below 12GB when used with a batch size of 16/32
except toy stuff
@zealous ermine, ping, in case you left
zealous ermine
Sry back (good ping)
So I need to store the whole model in vram?
I can’t have some of it in vram and the rest in ram?
odd yoke
You could do that, but that would tank performances
zealous ermine
Ah :/
When u say you’ve never used a model below 12GB, how big are your models on average?
odd yoke
moving arrays back and forth between the GPU <-> CPU is extremely expensive, especially if you do that multiple times per iteration, i wouldn't be surprised if it gave you worse performances than just using the CPU directly
~20GB
+- 4 on average i'd say
needless to say we don't use GTX cards
zealous ermine
Would you use a 3090?
odd yoke
I would probably love to, but I don't make that choice
rn we use quadro cards
or whatever is available on GCP
zealous ermine
Quadros are a little expensive, especially since you can’t also use them for gaming 😂
odd yoke
well you can, but the speed/price ratio is bad
if it's for personal use, don't worry about it really, i have a 1650 at home and do just fine
admittedly i don't do heavy stuff of course
zealous ermine
gtx1650?
zealous ermine
I’m trying to decide if I go with 3080 which is reasonably priced, or 3090 because i’ll eventually want the vram
But sounds like 3080 is fine
odd yoke
it also depends on what you want to do as well, are you planning on training DL models on video or large text corpora ? or mostly use "traditional" statistical models like regressions, svm, etc ?
 native bay
Hey guys how can I start with ML and AI
lapis sequoia
Are you familiar with data analysis?
lapis sequoia
For those that are complete beginners in Data Science or Machine Learning, i have made a small Youtube channel where i upload weekly videos teaching Data Science:

If you find any of my videos to be useful please consider subscribing, that would be a great help!
cedar sky
Hey guys how can I start with ML and AI
@native bay I think Andrew Ng's ML course is a great way to start
cedar sky
For those that are complete beginners in Data Science or Machine Learning, i have made a small Youtube channel where i upload weekly videos teaching Data Science:
@lapis sequoia Great man.... Try growing your channel and I have subscribed to it
lapis sequoia
Will do thanks for the motivation
cedar sky
I really liked the way you went about the subject.. The presentation was great
Shall I post your channel link in another ML community?
lapis sequoia
@lapis sequoia cool videos
 keen root
Hi, this is probably a stupid question, but can anyone help me understand how does this model differ from a simple perceptron?
odd yoke
a perceptron would only have the last layer
the simplest implementation of a perceptron in keras would be py model = Sequential() model.add(Dense(N))
solid aurora
The importance of VRAM is allowing the GPU to store the training data in VRAM rather than in regular RAM, which is more higher latency to the GPU
@zealous ermine
odd yoke
yes it does
solid aurora
which btw, the model itself is probably quite small
ok yea fair enough both need to
but like, the data itself is really the limiting factor in training time
odd yoke
that's because the number of parameter in the model is inherently tied to the size of the input
lapis sequoia
InvalidArgumentError                      Traceback (most recent call last)
<ipython-input-67-e45e4d54822b> in <module>()
      1 res = model.fit(image_data_gen.flow(X_train,y_train,batch_size=batch_size),
      2                 validation_data = (X_test,y_test),
----> 3                 epochs=epochs)

8 frames
/usr/local/lib/python3.6/dist-packages/tensorflow/python/eager/execute.py in quick_execute(op_name, num_outputs, inputs, attrs, ctx, name)
     58     ctx.ensure_initialized()
     59     tensors = pywrap_tfe.TFE_Py_Execute(ctx._handle, device_name, op_name,
---> 60                                         inputs, attrs, num_outputs)
     61   except core._NotOkStatusException as e:
     62     if name is not None:

InvalidArgumentError:  Can not squeeze dim[2], expected a dimension of 1, got 2
     [[node binary_crossentropy/remove_squeezable_dimensions/Squeeze (defined at <ipython-input-67-e45e4d54822b>:3) ]] [Op:__inference_train_function_50516]

Function call stack:
train_function```can somebody help me with this error ?
please?
i have used model.add(Flatten()) also to squeeze
_________________________________________________________________
Layer (type)                 Output Shape              Param #
=================================================================
conv2d_3 (Conv2D)            (None, 222, 222, 32)      896
_________________________________________________________________
max_pooling2d_3 (MaxPooling2 (None, 111, 111, 32)      0
_________________________________________________________________
dropout_10 (Dropout)         (None, 111, 111, 32)      0
_________________________________________________________________
conv2d_4 (Conv2D)            (None, 109, 109, 64)      18496
_________________________________________________________________
max_pooling2d_4 (MaxPooling2 (None, 54, 54, 64)        0
_________________________________________________________________
dropout_11 (Dropout)         (None, 54, 54, 64)        0
_________________________________________________________________
conv2d_5 (Conv2D)            (None, 52, 52, 128)       73856
_________________________________________________________________
max_pooling2d_5 (MaxPooling2 (None, 26, 26, 128)       0
_________________________________________________________________
dropout_12 (Dropout)         (None, 26, 26, 128)       0
_________________________________________________________________
flatten_1 (Flatten)          (None, 86528)             0
_________________________________________________________________
dense_16 (Dense)             (None, 128)               11075712
_________________________________________________________________
dense_17 (Dense)             (None, 1)                 129
=================================================================
Total params: 11,169,089
Trainable params: 11,169,089
Non-trainable params: 0
_________________________________________________________________
this is my model.summary
is the data preprocessed and it looks good?
yeah i checked the shape !
(3066, 224, 224, 3)
x_train's shape
(3066, 2, 2)
y_train's
(3066, 2, 2)?
yes
keen root
Thank you
yes it does
@odd yoke
lapis sequoia
the output is 2 * 2 ___?
which output ?
y_train
what is the label a image?
with mask and without mask
its a classification prob
I mean you provide input and what is the ouput?
a class?
no when i try to make .fit it gives an error
i cant see any output
it just says dim error
maybe link the notebook?
are you using colab?
yeah!
colab!
yeah share the notebook
download and share?
 arctic wedgeBOT
Hey @lapis sequoia!
It looks like you tried to attach file type(s) that we do not allow (.ipynb). We currently allow the following file types: .3gp, .3g2, .avi, .bmp, .gif, .h264, .jpg, .jpeg, .mkv, .mov, .mp4, .mpeg, .mpg, .png, .tiff, .wmv, .svg, .psd, .ai, .aep, .xcf, .mp3, .wav, .ogg, .webm, .webp, .flac, .afdesign, .m4a.
Feel free to ask in #community-meta if you think this is a mistake.
lapis sequoia
wot
it deleted the notebook link
yeah there is it
🤦♂️

what happened ?
nothing it didnt allow to upload notebook files
which one ? !
oh yeah!
the server
hmm the code looks fine to me 
same here but why its showing the damn error?
an you find ?
can you ?
lemme try no guarentee tho
its ok though thanks a lot !
i think there is a prob with y_train right ?
i never worked with 3 dims for labels
image_data_gen = ImageDataGenerator(rotation_range=20,
                                    height_shift_range=0.2,
                                    width_shift_range=0.2,
                                    shear_range = 0.15,
                                    horizontal_flip = True,
                                    zoom_range =0.15,
                                    fill_mode = 'nearest')
something wrong here?
image_data_gen = ImageDataGenerator(rotation_range=20,
                                    height_shift_range=0.2,
                                    width_shift_range=0.2,
                                    shear_range = 0.15,
                                    horizontal_flip = True,
                                    zoom_range =0.15,
                                    fill_mode = 'nearest',
                                    class_mode='binary')
I added class_mode='binary'
yeah!!!
god!
did it work?
no its restaring kernel
restarting
oh ok
i am an idiot!
keep forgetting some params!
😅
TypeError: init() got an unexpected keyword argument 'class_mode'
bruh imagine remembering them
lol yeah
wait
how?!
i just remember giving the same for some other classification prob!
that should be in flow_from_directory
cedar sky
you need class_mode only when you are flowing from directory
lapis sequoia
oh!
i should convert this into test and train flow ?
yes since you are reading data from directory right
yeah!
what!!!
this is running!
how?!
this time this one is running !
though i didnt change the code !
👀
🤣
luck?
idk lol
no just suspicious
I am also doing the same thing but classifying dogs and cats :)
great i have done that!
maybe for 3 times lol
also it will take an hour or so to train your model
i got 90% acc
nice
yeah thats why i use google colab
I did baseline model which gave 72 %
now adding data augmentation
try using some other hyper params!
baseline model took 30 mins to train for 30 epochs 😢
like steps_per_epoch
yeah
omg!
I am actually reading a book
yeah same here!
fchollet on deep learning
sebastian 's
mine
this one is great!
nice pdf?
no
rough copy
nice
you ?
pdf?
yeah
those days are over
 high ravine
Can someone help me out with a recursive function in python, ive a hierarchical ruleset stored on an online DB and am able to fetch it in to a df, i need help in building the recursive logic to categorize a score based on that ruleset
lapis sequoia
oh great i feel reading book is better to mark
everythingh is digitalized
yeah
lol yeah
i am still nervous !
running this
if epoch 1 runs successfully then its success :)
ripe forge
what's a hierarchical ruleset?
lapis sequoia
its almost!
great!
it gave an error
ValueError: logits and labels must have the same shape ((None, 1) vs (None, 2))
high ravine
what's a hierarchical ruleset?
@ripe forge something where the ranges are defined in a tree structure
lapis sequoia
yeah about that

Stack Overflow
I tried to replace the training and validation data with local images. But when running the training code, it came up with the error :
ValueError: Can not squeeze dim[1], expected a dimension o...
there is a similar error
yeah i used thisa bit !
flow from dir!
cedar sky
@lapis sequoia I think I found the mistake you made
cedar sky
In the validation data instead of having: validation_data = (X_test,y_test), have a seperate ImageDataGenerator instance with no hyperparam and use: instance.flow(X_test, Y_test)
cedar sky
yes
lapis sequoia
then i should also add batch_size there itseelf!
cedar sky
the validation data should be of similar type to train data
lapis sequoia
yeah i just made my y _train to 2 dim
cedar sky
then i should also add batch_size there itseelf!
@lapis sequoia It's not needed it already defaults to 32
lapis sequoia
oh
cedar sky
yeah i just made my y _train to 2 dim
@lapis sequoia ohh
lapis sequoia
is that fine ?
it was 3 before!
y_train.shape = 3 dims
now 2
res = model.fit(image_data_gen.flow(X_train,y_train,batch_size=batch_size),
validation_data = (X_test,y_test),
epochs=epochs)
but this also gave an error!
I think this type of data preparation is safest to me
from keras.preprocessing.image import ImageDataGenerator

train_datagen = ImageDataGenerator(rescale=1./255)
test_datagen = ImageDataGenerator(rescale=1./255)

train_generator = train_datagen.flow_from_directory(
    train_dir,
    target_size=(150, 150),
    batch_size=20,
    class_mode='binary'
)

validation_generator = test_datagen.flow_from_directory(
    validation_dir,
    target_size=(150, 150),
    batch_size=20,
    class_mode='binary'
)
yeah bt i have no train and test data
i just used sklearn's train_test_split
lapis sequoia
how do i load a model which was saved using model.save and not model.save_model ?
rip I am training for 100 epochs now
will see you one eternity later XD
lol!
your pc will die eventually
so no replies
XD
nah google colab 
then thats fine!
I need to learn how to train on GPU
now its running on colab CPU
which is a bit slow
same here!
i have to learn to use it with gpu
omg i got a better dataset!
ok time to do hw meanwhile
multitasking 💯
lol!
you the great!
you use vs code?!
yep to take notes
what!
I read the pdf and take my notes
how?
what!
🤣
I write in markdown
you are next generation
lol no
seriously man!
Its easy to take it in this way I can even include code blocks
which format?
like this
oh yeah!
its not a txt file lol
yes a markdown file

Learn the Web
A cheat sheet for understanding and writing in Markdown and YAML.
oh great though
grave frost
I am getting val_accuracy to be 0.000e+0 for my model when using keras and TensorFlow. Though the loss seems to be decreasing. Can anyone provide some pointers on how to fix that?
 austere swift
what does your output look like?
like is it one-hot encoded, sparse classes, is it a regression, etc
grave frost
@austere swift Integers in a giant list. their locations corresponding to the input list. Though I can also convert it to other dtypes
lapis sequoia
What is the problem description?
grave frost
What do you mean by a "problem description"? Like should I explain my task I want to perform?
lapis sequoia
yes
grave frost
It is basically a sequence2sequence where I have a list of input sequences as numpy array and the same thing with the corresponding outputs.
My model consists of mostly Dense and Dropout layers
Hmm.. my val_labels look very weird. My val_train looks great and since it was the same function, I assumed that val_labels would be good to go too. Let me debug it first
 cold mortar
subject = input("What is your favourite subject" + name)
Can someone tell me how to make it have a space between subject and the name when i print this?
 worthy olive
does anyone know if it's possible to extrapolate a surface given a set of 3d points? (using python)
interpolation sounds simple - just curve fitting. but idk how extrapolation works
 last peak
YES
hey so just so I am on same page
theres all kinds of extrapolation methods right, I can think of very easy ways, but you want some sort of ML or gradient descent alogirthm to find your next point
have to do more research about that
but the way I see it is, interpolation, you are doing a fit in between datapoints, but extrapolation you are doing to do fits outside of the datapoints
worthy olive
correct
last peak
you can take a 2d case for an idea and build the intuition for 3d
for 2d, given the data points, youd way to lets say use linear regression if the point is close enough
or use a higher order regression
if that helps
but you are generally going to get some y=f(x) some guess function and use that to guess your points outside of dataset
so similarily you are going to have to build a z=f(x,y) for 3d, using like gradient descents or umm direction derivaties in x and y or whatever coordinate system u want
worthy olive
so thinking in 2d - if i have 3 points that form a triangle (and ground truth is a rectangle/plane in 2d), it is unclear that any regression model would guess that the "4th corner" of the rectangle/plane exists
like my undrstanding of splines is that they perform well for interpolation, but break down at the ends of the distribution. and splines are fairly complex models
last peak
hold on, can you explain what a spline is
worthy olive
it's like piecewise regression
so you divide your x axis (or feature space) into several regions, and fit a function (linear, polynomial etc) within each region
then just connect the curves to get your complete curve
last peak
oh okay i see spline now, ive worked with bezzier curves, spline is general version of that
oaky sure, so that make sense
this is the idea of higher order regerssion
worthy olive
im just not sure how any algorithm can infer that an entire plane exists when i only give you 3 points. if that makes sense
last peak
you cant in 2d
you can only guess a real functon
what do you mean by plan and rectangle in 2d,
worthy olive
okay fine - move to higher dimensions
last peak
that wont have a real function
worthy olive
if you move to higher dimensions, just imagine a surface
last peak
okay sure
worthy olive
rectangle, triangle, plane
but if i give you three points. do any algorithms infer the "fourth point"/rectangle?
most reasonable guessses would just connect the dots and say "hey you got a triangle bud"
last peak
yes I see what u are saying, thats an interesting problem, I think this a case you can build up differently
do you have data points for multiple rectangles, triangles
worthy olive
so you're saying if i had more than 3 points, then the other points would suggest the presence of a rectangle or triangle
last peak
based on that data you can infer from the points you are given if first it is of class rectangle and triangle, and then see which point would best fit according to the patterns fo rthe 4 points in a rectangle
and 3 vertex in triangle
worthy olive
i mean, but both a triangle and rectangle would fit well?
last peak
oh nevermind I dont understand the problem , I though you were saying u were given the vertices
yes that is true, you cant say anything if the points are just colinear or something
worthy olive
well ideally we'd like all the vertices, but we don't have all the data, just some training sample
i see
last peak
you need enough points to see that there is no triangle than can connect
worthy olive
i suppose - depending on the algorithm - it might make a generalization. that is, triangle is a simple subset of a rectangle, so the algorithm "assumes" the more general case
last peak
hmmmm
worthy olive
i guess im looking for an algorithm that will make assumptions of that sort
last peak
can we talk aobut the problem actually
how are you getting the data
like for example if its rectable and triangle
the probability of the spread of the data is going ot be different
we are talking about some rectangle and triangle planes right
worthy olive
thats a very long story - but it's latent codes from a GAN that correspond to training images
and the idea is to - in this N dimensional space - use the latent codes to fit a surface that compasses all the data points and extrapolates to the (most likely) shape of the manifold
last peak
like if its a triangle and u sample it enough, a bunch of times i mean it should form a triangleish shape
worthy olive
yeah i understand
but theres always the case that we may not have that sufficient quantity of data to make that inference
last peak
and the area will be around the area of the 2 surronding curves
u can take them as lines and do cross product
olive lichen
hello, i'm working with nltk, and i've been given this code. I've been asked to determine what's wrong with the code. the goal output is to print the 10 most frequent bigrams (pairs of adjacent words) of a text, omitting bigrams that contain stop words.
last peak
ah nvm that doent help hmm
worthy olive
therefore, i'd like an algorithm that just assumes "everything that lies on a plane (be it a triangle, hexagon, polygon) is the most general surface possible (rectangle)"
last peak
hmm
what would you want ideally?
do you need to classify shape like triangle,rectangle
worthy olive
well im hoping theres a nonlinear extension to that
because the linear case is literally always a plane (rectangle)
last peak
i am confused about the problem statement now,
lets say you are gievn some random 3d surface
finite
worthy olive
ok
last peak
you want a function z=f(x,y) that as infinite
that would fit your surface right
ideal world
worthy olive
yes, and im realizing right now that you'd never get a triangle - always a rectangle. fuckn ell duh
last peak
lol
worthy olive
because if z is a linear surface/hyperplane - it will always be a plane
last peak
thsi is true
worthy olive
so if you fit 3 points to z, it's just gonna be a plane oriented in whatever way
last peak
yes this is why i was talking to aobut finite shapes
worthy olive
ah i see
last peak
if its an infinite plane therse no shape
if its finite then you get a probablility distribution
on how the points will spread out
worthy olive
right. yeah for some reason i didn't make the infinite vs finite distinction
thanks for spit balling lol
deft harbor
If you have a bunch of images, all of different dimensions, and want to find the cosine similarity.. what is the best way to handle the issue of the images being different dimensions and sizes?
One idea was to crop to the largest dimensions and then scale if need be, but that seems like it would remove a lot of useful information.
worthy olive
i mean dot product requires the dimensions to be equal so you can't really compute similarity that way. i think the only way would be to downsample to the smallest resolution then compute similarity
deft harbor
yeah, thats sort of what i was thinking
figured I would ask in case someone had a better idea that prevented lost data
worthy olive
@last peak okay shit actually i can't use an infinite surface 😅 . I need to sample uniformly from this space (can't just assume gaussian and mostly take points from close to the mode), and therefore need some "boundaries".......
on one hand, the infinite surface is very helpful because it includes directions that were not already present in the data. on the other hand, i have no idea how to truncate these directons...
last peak
if its close to a known point
then you can take a plane approximation of the surface close to the point
and use the equation of that plane ax+by+cz = d, to get values for points (x,y,z)
@worthy olive If its a sample of a surface and its close, what id do is pick a direction lets say unit vector in x, and then do linear regression line on a small distance there, and rpeat it for unit vector y, then you have those 2 vectors one in x and 1 in y, then take cross product of that to get the normal line <a,b,c>
then plane: ax+bx+cz = d
you can solve for d by using one of those points
only thing is this is no good for points further away unless your data set is already plane like
you could do some gaussian disribution stuff though
like consider set of planes from repeating his process with other points
and pick the most likely or give an array of some likely approximations
worthy olive
hmmm ok. i'll have to think on it
last peak
sure lemme know what u come up with, im interested too
itd be nice if u find a library that does the spline or some other polynomial curve surfaces to approximate
incase ur points are considerably far from sample
and ur surface is inherently very curvy
worthy olive
Ok. So i think i will do something like impose a distribution (maybe nonparametric?) on the surface. In order to include all "corners" that the original data previously didn't include, I will have to select a variance that is sufficiently large. I can possibly base this off of a z-score of the original data
So the variance is just some hyperparameter. Make it sufficiently large. Cool. I think the challenge is the distribution. If the curve has many peaks, should you really throw a unimodal distribution over it? Probably not. The distribution should correspond to the surface in some way... just need to figure that out
deft harbor
This isn't data science in the straighest sense, but say I train a CNN autoencoder on a series of images. I think went to create a web frontend where people can upload there images, and then it will be ran through just the encoding of the pretrained autoencoder. How would I actually go about using that model with a web interface?
Would I just create a backend .py file importing the model and weights, then pass the image via post to this script?
 wise garden
Any idea why DataFrame.diff() would add a random column of null values in the middle of my data
 stable otter
anyone know how to save a model in pytorch
velvet thorn
Any idea why DataFrame.diff() would add a random column of null values in the middle of my data
@wise garden which axis?
wise garden
1
wise garden
wasn't talking about first col I said middle
wise garden
df.columns = np.arange(1,41)
velvet thorn
oh
okay
so that's the reason?
I was about to ask about integer overflow
🥴
but yeah I forgot the simplest possible reason
wise garden
I don't think so, I had someone else run my exact code and no random null column
maybe its a version problem I just didn't think that'd be the case
velvet thorn
np
lapis sequoia
bruh I forgot to save the model that I trained yesterday
I didn't downlod the saved model to my local pc
now I need to train it again

hasty grail
Use checkpoints next time
austere swift
^
those saved me quite a few times
one time the guy who was fixing my AC flipped the wrong breaker and it shut down my training server lol
lapis sequoia
yeah I am such a rookie
lapis sequoia
Hey guys, running python3 -m notebook will open up my jupyter notebook in the browser however when running the standard way jupyter notebook I get zsh: command not found: jupyter.
Is there a solution to this?
maybe because those modules are not in the PATH?
type this
echo $PATH
and see if the directory of above package is present inside PATH
alexanderberg@Alexanders-MacBook-Pro ~ % echo $PATH
/Library/Frameworks/Python.framework/Versions/3.8/bin:/usr/local/bin:/usr/bin:/bin:/usr/sbin:/sbin```hmm it is in the PATH
hmm it is in the PATH :GWgoaThinken:
@lapis sequoia How do you see that?
/Library/Frameworks/Python.framework/Versions/3.8/bin
first line in the PATH
What does that have to do with Jupyter?
to run a command it must be in the PATH
the system scans those directories and searches for jupyter in it
if there is one it will execute that
Yeah I can run python3 -m notebook so it works but it should be just jupyter notebook.
yeah ye
did you try jupyter-notebook
I have just installed python3 from python.org but I haven't set any Path variables in nano or such things. So everything is just standard
did you try
jupyter-notebook
?
?
@lapis sequoia Yes that worked too
shouldn't python be set up usually innano ~.zschrc
Cause when I installed ipykernel when running my first .ipynb is said something about consider putting in PATH
or something along those lines.
yes you need to do that step
see the last section in this page
since you are in MacOS
yes you need to do that step
@lapis sequoia That is obsolete. Python 2.7?
I have a mac from this year so i have zsh, does it make a difference?
no I mean replace that python version with yours
I think the correct way to do is jupyter-notebook
I never tried jupyter notebook
did you try it before?
It is the official way
As per the instructions from Jupyter themselves
Yeah it worked before I did a factory reset of my laptop
Thanks for your help, I will try to solve it somehow
 mild topaz
Traceback (most recent call last):

  File "E:\demo3\image_classification.py", line 71, in <module>
    assert (x_train.shape[1:] == (imageDimensions)),  "the dimension of training images are wrong"

AssertionError: the dimension of training images are wrong```Quick question - If I convert a list containing some elements along with a csv column for integers into a Pandas DataFrame (something like this :- ['a','b','c','d'],123 would the DF have 5 columns, like this :-
col1 | col2 | col3 | col4 | col5 (numeric type)
'a'  |  'b' |  'c' | 'd'  | 123
?
Like would it ignore the [] brackets or would that also form a seperate column? (one for each bracket)
 kindred ridge
Don't think you can convert that list..
 lost moth
I believe each list entry would go into a row rather than a column. This is a good case for a dict comprehension, probably followed by a merge:
df1 = pd.read_csv(path_to_csv)
df2 = pd.DataFrame({f'col{i}': element for i, element in enumerate(lst)})
df1.merge(df2)
So, I have a dataframe with X and y columns. The X was produced from SKLearn's PCA method, and behaves as expected. y was produced from LabelBinarizer, and also works as expected. I then do the following:
clf = KNeighborsClassifier(n_neighbors=5, weights="distance", n_jobs=-1)
X, y = df["X"].to_numpy(), df["y"].to_numpy()
X_train, X_test, y_train, y_test = train_test_split(X, y)
clf.fit(X_train, y_train)
This gives me the following traceback:
TypeError: only size-1 arrays can be converted to Python scalars

The above exception was the direct cause of the following exception:

Traceback (most recent call last):
  File "cif3r/models/model_eval.py", line 117, in <module>
    main()
  File "/home/dal/.cache/pypoetry/virtualenvs/cif3r-fHcryY4V-py3.8/lib/python3.8/site-packages/click/core.py", line 764, in __call__
    return self.main(*args, **kwargs)
  File "/home/dal/.cache/pypoetry/virtualenvs/cif3r-fHcryY4V-py3.8/lib/python3.8/site-packages/click/core.py", line 717, in main
    rv = self.invoke(ctx)
  File "/home/dal/.cache/pypoetry/virtualenvs/cif3r-fHcryY4V-py3.8/lib/python3.8/site-packages/click/core.py", line 956, in invoke
    return ctx.invoke(self.callback, **ctx.params)
  File "/home/dal/.cache/pypoetry/virtualenvs/cif3r-fHcryY4V-py3.8/lib/python3.8/site-packages/click/core.py", line 555, in invoke
    return callback(*args, **kwargs)
  File "cif3r/models/model_eval.py", line 111, in main
    clf.fit(X_train, y_train)
  File "/home/dal/.cache/pypoetry/virtualenvs/cif3r-fHcryY4V-py3.8/lib/python3.8/site-packages/sklearn/neighbors/_base.py", line 1130, in fit
    X, y = check_X_y(X, y, "csr", multi_output=True)
  File "/home/dal/.cache/pypoetry/virtualenvs/cif3r-fHcryY4V-py3.8/lib/python3.8/site-packages/sklearn/utils/validation.py", line 747, in check_X_y
    X = check_array(X, accept_sparse=accept_sparse,
  File "/home/dal/.cache/pypoetry/virtualenvs/cif3r-fHcryY4V-py3.8/lib/python3.8/site-packages/sklearn/utils/validation.py", line 531, in check_array
    array = np.asarray(array, order=order, dtype=dtype)
  File "/home/dal/.cache/pypoetry/virtualenvs/cif3r-fHcryY4V-py3.8/lib/python3.8/site-packages/numpy/core/_asarray.py", line 85, in asarray
    return array(a, dtype, copy=False, order=order)
ValueError: setting an array element with a sequence.
I've checked to see that X_train and y_train have the same shapes, and they do. Both have the object dtype in the parent dataframe, which I assume shouldn't make any difference with to_numpy() Any ideas what might be wrong here? Let me know if there's any other output/info I can give, and thanks in advance!
lapis sequoia
 proven phoenix
[technologies: AWS Glue, PySpark, Python3]hello guys, I am trying to figure out how to pass variables to a function I created. This function is called on each record of my glue DynamicFrame (aws wrapper of a spark dataframe) but I can't figure out how to give extra arguments to my function. I need to use map(). I can either use
- my dynamic frame directly DynamicFrame (Glue) => https://docs.aws.amazon.com/glue/latest/dg/aws-glue-api-crawler-pyspark-extensions-dynamic-frame.html#aws-glue-api-crawler-pyspark-extensions-dynamic-frame-map which would be something like my_dynamic_frame.map(replace_null_string)
- or Map.apply() => https://docs.aws.amazon.com/glue/latest/dg/aws-glue-api-crawler-pyspark-transforms-map.html#aws-glue-api-crawler-pyspark-transforms-map which would be Map.apply(frame=my_dynamic_frame, f=replace_null_string)
My function is something like that
# how to pass string_type_columns as parameters with kwargs or something else?
def replace_null_string(rec, string_type_columns???):
    # do something with the rec and the arg string_type_columns
    ...
    return rec
I already have my list prepared, I just want to be able to give it to the apply function and transfer it to my function replace_null_string().
Any idea? Thanks a lot
Overview of the AWS Glue DynamicFrame Python class.
The Map transform builds a new DynamicFrame by applying a function to all records in the input DynamicFrame.
proven phoenix
Nevermind, it is not possible because of the implementation of map() in the dynamicframe
    def map(self, f, preservesPartitioning=False,transformation_ctx = "", info="", stageThreshold=0, totalThreshold=0):
        def wrap_dict_with_dynamic_records(x):
            rec = _create_dynamic_record(x["record"])
            try:
                result_record = _revert_to_dict(f(rec))
                if result_record:
                    x["record"] = result_record
                else:
                    x['isError'] = True
                    x['errorMessage'] = "User-specified function returned None instead of DynamicRecord"
                return x
            except Exception as E:
                x['isError'] = True
                x['errorMessage'] = E.message
                return x
        def func(_, iterator):
            return imap(wrap_dict_with_dynamic_records, iterator)
        return self.mapPartitionsWithIndex(func, preservesPartitioning, transformation_ctx, info, stageThreshold, totalThreshold)
=> result_record = _revert_to_dict(f(rec))
 worn sphinx
Hi there, i wanna advance my feature engineering skills for the Kaggle's competitions. Are there any good guidelines on this subject?
 raw blaze
@worn sphinx there are literally hundreds, if not thousands, of books regarding machine learning, model building, feature engineering and the likes
loads of free ones too. Just google
 desert oar
I'm not aware of any good "general purpose" references in feature engineering
There are plenty of scattered recommendations in stats and ML books, and books on more specific topics like dimension reduction
As well as domain specific feature engineering for NLP, image processing, etc
 chrome orbit
Hey guys, I'm trying to learn to use plotly and i'm trying to plot 2 datasets... 1 is a bar chart and it has date and time on the x axis... and the second is a horizontal line (using scatter). when i added in the time to the bar chart (was only date before) i cannot see the horizontal lines anymore... i'm thinking its because the axis are all different
anyone know how i can fix that?
this is from the bar chart
this is from the horizontal line
last peak
oh ur dates replaced *the points?
chrome orbit
i think so
is there anyway i can create that similar layout on the xaxis using update_xaxis?
dire acorn
@chrome orbit is there a specific reason you want to use that lib? there are others that do similar things.
chrome orbit
plotly?
dire acorn
yup
last peak
matplotlib
dire acorn
thats it
I like seaborn but to each their own. seaborn as some graphics that just make you look good
chrome orbit
hmm
ok. will take a look
i heard mpl is good
so plotly is not that good? it is damn confusing to learn thats for sure lol
chrome orbit
yeah. basically a scatter plot and then horizontal lines in them
with x-axis having the time & date similar to the pic above
last peak
oh so a barplot
wait horizontal lines
Why are these horizontal lines in a scatter plot
import plotly.graph_objects as go
fig = go.Figure(go.Scatter(
x = [1, 2, 3, 4, 5, 6, 7, 8, 9, 10, 11, 12],
y = [28.8, 28.5, 37, 56.8, 69.7, 79.7, 78.5, 77.8, 74.1, 62.6, 45.3, 39.9]
))
fig.update_layout(
xaxis = dict(
tickmode = 'linear',
tick0 = 0.5,
dtick = 0.75
)
)
fig.show()
You could do something like that if u want ticks
from here : https://plotly.com/python/tick-formatting/
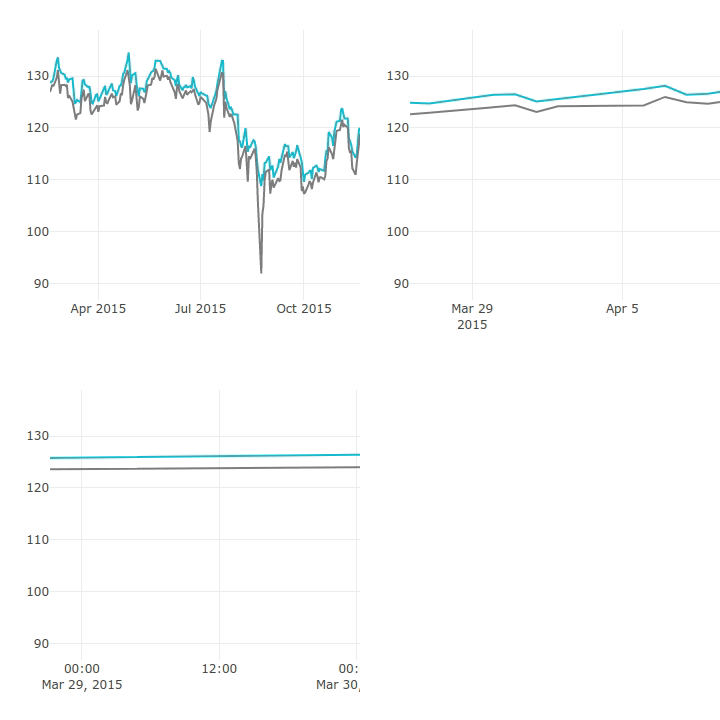
How to format axes ticks in Python with Plotly.
import plotly.graph_objects as go
go.Figure(go.Scatter(
x = [1, 2, 3, 4, 5, 6, 7, 8, 9, 10, 11, 12],
y = [28.8, 28.5, 37, 56.8, 69.7, 79.7, 78.5, 77.8, 74.1, 62.6, 45.3, 39.9]
))
fig.update_layout(
xaxis = dict(
tickmode = 'array',
tickvals = [1, 3, 5, 7, 9, 11],
ticktext = ['One', 'Three', 'Five', 'Seven', 'Nine', 'Eleven']
)
)
fig.show()
Or like this where you can replace the tictext with those dates
fig.update_layout(
title = 'Time Series with Custom Date-Time Format',
xaxis_tickformat = '%d %B (%a)<br>%Y'
)
you can also use this, it gives you dates, just change the format like you want
if you scroll down on that website it also shows u how to define a start and end time and tick sparsity
@chrome orbit
last peak
hey yeah?
chrome orbit
ok ill try it out @last peak and let you know
dire acorn
i have a program where I returned text to the console but now I want to assign it to a dataframe and I am not sure how to do that.
last peak
@chrome orbit ok cool
do u want to make a new df or is there an existing df u want to ad to
dire acorn
whole new dataframe. i extracted the text from pdf files.
I think it is an issue with how I am initializing classes.
dire acorn
yea...
well the end goal is just to create a one column with all text extracted from pdfs assigned to a data frame.
but that may not be the best way to do it
last peak
if its like word by word u can always just do
pd.Series([w1,w2,w3])
and then do pd.DataFrame({col_name : series})
or simply take as an array
dire acorn
darn. I have no idea how may words there are. its like an 800 page pdf haha
last peak
oh u want the whole txt in just one row then?
last peak
ok sure
dire acorn
but if you know of a better way to analyze text let me know 🙂
last peak
then do
pd.DataFrame({'words' : set(text.split()}))
oh u want distinct words then
are u thinking of counting words
dire acorn
nah not counting
last peak
you might have to change that set back into list
dire acorn
spilt might work
last peak
ya and use set to get distinct
dire acorn
is there a good way to save the text printed on the console?
dire acorn
hmmm i think I did that one sec
last peak
whever you are calling that print make it just append to the end of a file
dire acorn
yea i did use stdout
last peak
ok so change stdout to some file
or you can put it as a variable
and then pickle it
or just pickle a dataframe
dire acorn
class Savecsv(Transform):
    def test(text):
        sys.stdout= open("text.csv","w")
        print(text)
        sys.stdout.close()
        return "compeleted"
some ppl like to keep everythign as objects so
dire acorn
that's how i have my object set up and I passed the previous class extracting the text through that object.
dire acorn
nope haha
last peak
u see the text there in text.csv
with open ('myfile', 'a') as f: f.write ('hi there\n')
with open('text.csv','w') as f:
f.write(text)
dire acorn
shoot i am not getting it
sys.sdout = open("text.csv", "w") as f?
then f . write text
last peak
class Savecsv(Transform):
def test(text):
with open('text.csv','w') as f :
f.write(text)
return "compeleted"
like that
 last peak
lol
 split eagle
I've been working with a large data frame trying to isolate studies that started before 2018-06-01. After looking through online resources, I've come to this: import datetime
df_start_date = df_studies[(df_studies["start_date"] <= "2018-6-1")] This code did not produce any errors, but I wanted to make sure that the values in "start_date" will be read as dates and not strings. Are there any changes I need to make to this code to ensure that or is it ok as is?
dire acorn
check the data type with .dtype
last peak
@split eagle that comparison really works with date objects?
just make sure date obj can handle a comparison with a str.. or else you might have to make that date object first
df_start_date = df_studies[(df_studies["start_date"] <= pd.Timestamp(2018,6,1)]
try this if the dtype is not right like thisbi pointed out then ud get an error
or else ur going to have to do a mapping
on that column to change them into date objects
split eagle
I used the code from your last message and got this error message: File "<ipython-input-8-a5e9b3181afa>", line 18
df_start_date = df_studies[(df_studies["start_date"] <= pd.Timestamp(2018,6,1)]
^
SyntaxError: invalid syntax
The syntax error was apparently the last brace, which i don't understand.
last peak
oh okay can you do a df_studies.head()
and show me the output here
split eagle
Sure thing. Give me a sec.
last peak
and u do have import pandas as pd right
split eagle
yes
df_studies.head() gave this error...
NameError Traceback (most recent call last)
<ipython-input-9-8de5dcb0e6b0> in <module>
----> 1 df_studies.head()
NameError: name 'df_studies' is not defined
hold on, i think i ran things out of order.
last peak
oh okay also
its df_studies.dtypes
show me that output too
just make sure its a date obj
split eagle
Yep
nct_id object
nlm_download_date_description object
study_first_submitted_date object
results_first_submitted_date object
disposition_first_submitted_date object
...
ipd_url object
plan_to_share_ipd object
plan_to_share_ipd_description object
created_at object
updated_at object
Length: 64, dtype: object
last peak
okay so they are justobject you have to make that a date obj first then
split eagle
^df_studies.dtypes. I got this earlier (sorry. I think I forgot to mention that.)
split eagle
Do I make an object a date with datetime()?
last peak
oh umm can u see if datetime can handle string of that format
then you can do the same with the other string too instead of pd.Timestamp
I was just going to use pd.Timestamp all over again
for example you can do:
my_list = list(map(lambda x : pd.Timestamp(int(x.split('-')[0]),int(x.split('-')[1]),int(x.split('-')[2])), df_studies['start_date']))
then you can get a list of true and false values to put into the df
like
true_falses = [dt <= pd.Timestamp('2018-01-1') for dt in my_list]
df_start_date = df_studies[true_falses]
.
split eagle
@last peak What about something like this?pd.to_datetime('-', format='%Y%m%d', errors='coerce')
serene scaffold
I have a dataframe and the third column tells us what class that row represents. And I want to use 75% of the data for training and 25% for test. So once I do df.groupby(2) how can I pull a representative sample from 75% of that? This is for homework but I know how I could do it with random and loops and stuff and I want to learn how to do it in pandas.
 charred blaze
you select randomly N indexes and use those to retrieve the relevant rows
no need to use loops
Don't quite recall the exact functions to do that in Pandas but it is possible from what I recall.
dire acorn
@split eagle change datatype like this .astype('datetime64') for whatever column the date info is in
 fading wigeon
Yay machine learning
Also, is it supposed to be this hard to plot graphs inline in jupyter notebooks?
 kind granite
Show your code, gonna be easier
fading wigeon
I think I figured it out from SO. Apparently you need to have this in the first code cell %matplotlib inline
fading wigeon
My first day using notebooks, lol
Boss being super anal about me using and loving it
charred blaze
I find them overrated personally... I only use them when necessary, basically for plotting some data and some explanations about some results
and it's typically a good idea to not have all your code inside a notebook, some of it should be outside of it in a src folder or something
charred blaze
but if you're doing a lot of data analysis work... yeah, you'll be living inside notebooks.
fading wigeon
Is there an easy way to export code from a notebook to a file?
dire acorn
@fading wigeon it depends what you do with them. for my job we put them everywhere. I meant to ask you what error did you get from jyputer
charred blaze
not to mention that versioning Jupyter Notebooks... is quite bothersome.
fading wigeon
I've gotten two errors from Juptyer thus far. At first I just got an error message that only said error and then it just says In [*] which I guess means the program was stuck doing things
charred blaze
https://docs.google.com/presentation/d/1n2RlMdmv1p25Xy5thJUhkKGvjtV-dkAIsUXP-AL4ffI/edit -> An interesting presentation from 2018 which made the rounds back then and brings up some pitfalls when using notebooks

Google Docs
I Don't Like Notebooks hi, I'm Joel, and I don't like notebooks Joel Grus (@joelgrus) #JupyterCon 2018
fading wigeon
I'll check it out, I like avoiding pitfalls
charred blaze
I think everyone does : D
yeah, that latter error means that your Jupyter Kernel is stuck running that cell
fading wigeon
So many pitfalls... I've already encountered a few on my first day
last peak
@chrome orbit you can manually do it
import plotly.graph_objects as go
go.Figure(go.Scatter(
x = [1, 2, 3, 4, 5, 6, 7, 8, 9, 10, 11, 12],
y = [28.8, 28.5, 37, 56.8, 69.7, 79.7, 78.5, 77.8, 74.1, 62.6, 45.3, 39.9]
))
fig.update_layout(
xaxis = dict(
tickmode = 'array',
tickvals = [1, 3, 5, 7, 9, 11],
ticktext = ['One', 'Three', 'Five', 'Seven', 'Nine', 'Eleven']
)
)
fig.show()
like adding more tickvals and more ticktext
you have to generate the list of datetimes yourself
velvet thorn
I have a dataframe and the third column tells us what class that row represents. And I want to use 75% of the data for training and 25% for test. So once I do
df.groupby(2)how can I pull a representative sample from 75% of that? This is for homework but I know how I could do it withrandomand loops and stuff and I want to learn how to do it in pandas.
@serene scaffold hint
you can groupby stuff that is not in the DataFrame, as long as it has the same length along the grouping axis
serene scaffold
thxxxx
the prof postponed that assignment because everyone in that class is also taking the data science class, and there's a data science project due tomorrow
it's with rapid miner
I think I'd rather rapidly mine coal and deal with the adverse effects of that.
chrome orbit
cant do it automatically? @last peak
 bold ledge
hi, if i want to find the dot product of EACH row in the blue circle vs the red array. how would i do so (do i broadcast?reshape? splice axis?) (its a 5x7, and i have a 7x1) i want to multiple each of the 5 rows of 7, but that 1x7 array.
velvet thorn
@bold ledge so the result should be of shape (5,), right?
bold ledge
i think that worked thanks @velvet thorn
velvet thorn
yw
 tidal sonnet
I can't figure out this practice question for the life of me :(
Any Ideas on how to goa round working it out?
I tried going thru the options one by one... but i'm obviously still doing something wrong...
last peak
@chrome orbit you probably can, i am just not familiar with this library sry
@tidal sonnet u have it right
tidal sonnet
:o
Thank you
last peak
-2(<3,4,1> - 3*<1,3/2,1/2>)
last peak
no whats in bracket is done first
last peak
sure lol
@tidal sonnet
a = np.array([3,4,1,7])
b=np.array([1,3/2,1/2,9/4])
-2 * (a - 3*b)
array([-0. , 1. , 1. , -0.5])
i motivate numpy lol
tidal sonnet
:o
I'll get into that as soon as I understand the maths >:)
But thanks for the advice
last peak
ya good idea
by the way
you can also solve for that transformation matrix, to go from step 2 to step 3
T A = B
a=[[1,3/2,1/2],[3,4,1],[2,8,13]]
b=[[1,3/2,1/2],[0,1,1],[2,8,13]]
a=np.array(a)
b=np.array(b)
Then you can solve for T by doing left inverse of A on both sides
T = BA^-1
and T should resemble what u see as the answer just in matrix form
tidal sonnet
I don't understand...
How did that work...
Have i been subtracting the vectors wrong?
tidal sonnet
3 4 1
1 1.5 0.5
2 2.5 0.5 x -2
last peak
oh dont forget the 3*
tidal sonnet
OHHHHHHHHHHHHH
[3, 4, 1]
[3, 4.5, 1.5]
[0, -0.5, -0.5] x -2
AHHHHHHH
I SEE IT NOW
Deepest appreciation
last peak
sure thing 👍
tidal sonnet
what is meant by linear combination?
Does that mean adding them together and then giving them a Scalar?
Or giving them a scalar separately then adding them together?
It's more of the method i'm interested in learning
last peak
linear combination of 2 vector v1,v2
is k1v1 + k2v2
so the new vector you get from this is a linear combination
for example
v=<v1,v2,v3>
u=<u1,u2,u3>
so a liinear combination of u and v can be
2*<v1,v2,v3> + 3*<u1,u2,u3>
=<2v1+3u1, 2v2+3u2, 2v3+3u3
That's basically it for linear combination, for echelon form they just do this over and over until you have 0s in the lower left triangle
so that you are able to use back substitution from bottom to top
last peak
yw
 spiral yew
I'm wondering wheter I should use my desktop pc which can run either windows or linux or my macbook pro. The desktop pc has pretty good specs (a quad core cpu, 16gb ram, and a nvidia 980 gpu). my macbook on the other hand has like a dual core cpu and 16gb of ram. For deep learning and computer vision stuff, which computer/OS should I use? I either use windows on the desktop pc, linux on the desktop pc, or use my macbook for coding the models and then training them on my desktop pc.
austere swift
well youd probably wanna train the models on the desktop cus of the gpu
but as for coding thats up to you
and same with os
its mostly preference
 plucky spindle
Hello guys, can someone recommend a python module to analyze files in .wav format, I need to convert the audio into text and apply machine learning, thanks in advance
austere swift
you can use the wave plugin to read it
and i think scipy can do it too
and scipy does it into numpy arrays so you can train straight off of that
spiral yew
@austere swift do u use linux or windows?
spiral yew
hm so windows is ur daily driver essentially?
austere swift
yeah windows is for like games and files and stuff and linux is for dev work
but you can use windows for both if you want
plucky spindle
@austere swift i see, reading the docs, thanks
austere swift
the only thing is linux doesnt have support for a lot of programs anyways
serene scaffold
group_0 = df[df[2] == 0 | df[2] == 0.] how can I express this for dataframes?
serene scaffold
yes, though it turns out df[2] == 0 works for both 0 and 0. so this is not necessary.
unless my code is silently doing something unexpected.
but it appears to be working
lapis sequoia
is the column named as 2?
serene scaffold
it doesn't have a name, it's just the third column
lapis sequoia
oh ok
serene scaffold
apparently serieses get array-like indexing if you specify that there aren't any headers.
lapis sequoia
yes
 thin terrace
I'm using some file-extensions as features in a classification problem. But I've got a feeling that it may make the feature vector too sparse, do you think it's a good idea to group the extensions by types and how would you categorize them if so?
The extensions I'm looking at are ['java', 'json', 'ts', 'xml', 'js', 'html', 'css', 'ini', 'py', 'cfg', 'sh', 'yaml', 'env', 'properties']
Perhaps 'src': ['java'], 'web': ['html', 'css'], 'script': ['json', 'ts', 'js', 'py', 'sh'], 'conf': ['xml', 'ini', 'cfg', 'yaml', 'env', 'properties']?
 glass jetty
That probably depends on the classification task. Sparsity is also not necessarily a problem, that depends on your system's memory limits etc., and on the specific model.
lapis sequoia
@plucky spindle Are you looking for speech-to-text?
There are several APIs. Google or Azure for example
you may also look into Mozilla's deepspeech
if there are privacy issues for example
thin terrace
That probably depends on the classification task. Sparsity is also not necessarily a problem, that depends on your system's memory limits etc., and on the specific model.
@glass jetty yeah I know. it's an RFC and afaik they don't like sparse features as the splits become messed up when you create dummies out of categorical features. I guess I could use a NN to avoid that problem
glass jetty
RFC = RandomForest?
thin terrace
yes (classifier)
lapis sequoia
What is the problem here?
 eager heath
Didn't you mean only one =?
mild topaz
Traceback (most recent call last):

  File "E:\demo3\image_classification.py", line 75, in <module>
    assert (x_train.shape[1:] == (imageDimensions)),  "the dimension of training images are wrong"

AssertionError: the dimension of training images are wrong```imageDimensions = 32, 32, 3 i am passing here
mild topaz
i am following this tutorial

Train and classify Traffic Signs using Convolutional neural networks This will be done using OPENCV in real time using a simple webcam . CNNs have been gaining popularity in the past couple of years due to their ability to generalize and classify the data with high accuracy. ...
 halcyon vale

Day 28 of #66DaysOfData! with Ken Jee
In my journey of Natural Language Processing, Today I have read and Implemented about Convolutional Neural Network...
mild topaz
@halcyon vale sorry to ping you can u look into my issue?
plucky spindle
you may also look into Mozilla's deepspeech
@lapis sequoia ok thanks for the info, i will search for it, yes i need speech-to-text for identify calls motives
 sand pivot
hey doe anyone know why u would get runtimewarning : invalid value encountered greater than equal when trying to make a boxplot?
lapis sequoia

GitHub
Building a deep learning model, which recognises cats and dogs. - gpk2000/Kitty-vs-Doggo
🙏 plz try this
mild topaz
@lapis sequoia is it related to my issue?
lapis sequoia
no It's my project
mild topaz
can u look into my issue ? @lapis sequoia
Traceback (most recent call last):

  File "E:\demo3\image_classification.py", line 75, in <module>
    assert (x_train.shape[1:] == (imageDimensions)),  "the dimension of training images are wrong"

AssertionError: the dimension of training images are wrong```print these and see where the issue is
mild topaz
can i share u my code so u get better idea what i am doing here?
https://paste.pythondiscord.com/tekulibage.coffeescript my code here @lapis sequoia
lapis sequoia
from scipy import stats

class AI:
    used = []
    @classmethod
    def get_answers(cls):
        times = int(input('How many answers: '))
        count = 0
        while count < times:
            AI.used.append(input())
            count += 1

    @classmethod
    def get_mode(cls):
        mostused = stats.mode(AI.used)
        spl = str(mostused).split("'")
        print(f'Most Used: {spl[1]}')

AI.get_answers()
AI.get_mode()
does anyone know a more optimized way to do this?
 fringe stag
hello, could some suggest way to detect rectangles in bitmap image. Like part of OCR or computer vision system. I want to understand round of table cell and table itself.
lapis sequoia
Hello, I'm looking for a feedback based on experience regarding ML forecasting technics issues in training the model in a small sample size and moving it to whole set of data, for example take a small sample of data that is very representative of the whole set test different models select one then go to the selected model train it in the whole set of data to see if that's the right model to use for our data ?
 real wigeon
anyone know how to append the output to a row? I'm using iterrows()
im iterating per row, and one of the columns is blank; im hashing an xls file and want to place the hashed values into the empty column (per row)
from flask import Flask
from flask_bcrypt import Bcrypt
import pandas as pd


df = pd.read_excel('/Users/daskjdhaDownloads/Employee Data Final.xlsx', names=['email','password',
                                                                                       'hashed password'])
app = Flask(__name__)
bcrypt = Bcrypt(app)


with open('hashed employee passwords.xls', 'a+') as f:
    for _, row in df.iterows():
        email, unhashed_password, hashed_password = row
        pw_hash = bcrypt.generate_password_hash(unhashed_password).decode('utf-8')
run = bcrypt.check_password_hash(pw_hash, unhashed_password)```I figured I'd ask here because pandas relates to data science..
I have a dataframe where each row is values to create a custom class.
class MyClass:
  def __init__(self, a,b,c):
    pass

df = pd.DataFrame([[1,2,3],[4,5,6],[7,8,9]])
fields= ['a','b','c']

# my objective is to convert my dataframe into a list of generated MyClass objects. So i do..
new_series = df.apply(lambda row: dict(zip(fields, row)), axis=1)
# for example for the first row this gives me: {'a': 1, 'b': 4, 'c': 7} which is want i want..
#however here, when I apply to create my custom class, I get the error

new_series.apply(lambda key_pairs: MyClass(**key_pairs)) # got multiple values for argument 'a' TypeError
Any advice?
Just for brevity, this works perfectly:
first_row = new_series.iloc[0]
obj = MyClass(**first_row)
 hybrid rampart
what do i have to do with these things?
deft harbor
class SiteAE(Model):
    def __init__(self):
        super(SiteAE, self).__init__()

        self.encoder = tf.keras.Sequential([
            layers.Input(shape=(BATCH_SIZE, IMG_HEIGHT, IMG_WIDTH, 3), name='Inp_enc'),
            layers.Conv2D(16, 5, 2, padding='same', activation='relu', name='C1_enc'),
            layers.Conv2D(32, 5, 2, padding='same', activation='relu', name='C2_enc'),
            layers.Conv2D(64, 5, 2, padding='same', activation='relu', name='C3_enc'),
            layers.Flatten(),
            layers.Dense(LATENT_DIM, activation='relu', name='D_enc')],
            name="Encoder")

        self.decoder = tf.keras.Sequential([
            layers.Input(shape=(LATENT_DIM, ), name='Inp_dec'),
            layers.Dense(4096, activation='relu', name='D_dec'),
            layers.Reshape((4, 4, 256), name='RS_dec'),
            layers.Conv2DTranspose(64, 3, 2, activation='relu', padding='same', name='C1_dec'),
            layers.Conv2DTranspose(32, 3, 2, activation='relu', padding='same', name='C2_dec'),
            layers.Conv2DTranspose(16, 3, 2, activation='relu', padding='same', name='C3_dec'),
            layers.Conv2DTranspose(3, 3, 2, activation='sigmoid', padding='same', name='Final_dec')],
            name="Decoder")

    def call(self, x):
        encoded = self.encoder(x)
        decoded = self.decoder(encoded)
        return decoded

autoencoder = SiteAE()
Model: "site_ae"
_________________________________________________________________
Layer (type)                 Output Shape              Param #
=================================================================
Encoder (Sequential)         (None, 64)                4259680
_________________________________________________________________
Decoder (Sequential)         (None, 64, 64, 3)         437283
=================================================================
Total params: 4,696,963
Trainable params: 4,696,963
Non-trainable params: 0
Any idea why my Transpose layers aren't actually scaling up the tensor?
It should be scaling the latent space to (256, 256, 3)
 mossy grotto
Hello... I'm looking to hire a tutor for a few hours for some help with matplotlib. If you have experience with DSP that would be even better. I'm using spyder and I have a lot of random questions. They are all fairly easy. Shoot me a message with some of your work and we can discuss rates and whatnot.
 dry hearth
Hi, I'm looking for a couple of minutes of someone's time here who's skilled in NLP to understand some things
 stark orchid
GitHub and Great Expectations just published an awesome GitHub action that is the first CI workflow for Data Pipelines available directly from PRs on GitHub.
https://twitter.com/HamelHusain/status/1311699555243552769?s=20


Really excited to announce the new @expectgreatdata GitHub Action!
The first CI workflow (that I know of) ✨✨for Data Pipelines✨✨ available directly from PRs on GitHub.
Read more about it here: https://t.co/MmzkrROADx
A teaser 👇, also thread: 🧵 (1/7) https://t.co/Ws8AUkB...
 Twitter
 heady hatch
@deft harbor I don't know enough about autoencoders, so I don't know if this will give you some insight.
_________________________________________________________________
Layer (type)                 Output Shape              Param #
=================================================================
dense_5 (Dense)              (None, 8, 8, 4096)        8192
_________________________________________________________________
reshape_1 (Reshape)          (None, 4, 4, 256)         0
_________________________________________________________________
conv2d_transpose_75 (Conv2DT (None, 8, 8, 64)          147520
_________________________________________________________________
conv2d_transpose_76 (Conv2DT (None, 16, 16, 32)        18464
_________________________________________________________________
conv2d_transpose_77 (Conv2DT (None, 32, 32, 16)        4624
_________________________________________________________________
conv2d_transpose_78 (Conv2DT (None, 64, 64, 3)         435
=================================================================
I noticed that the reshaping makes it 4, 4, 256. Then the Conv2DTranspose only shape up from there.
heady hatch
Ahh, I'm happy to hear that you're able to solve it! I'm planning on studying autoencoders later myself.
deft harbor
They are fun when you start doing CVAEs
You can make people smile, or make them change genders
This one is simple, as all I need for the project are the latent variables
heady hatch
latent variables similar to SVD and PCA? Oh no, never mind. Lots to learn.
 lone tusk
is this the right place to ask a panda question :3 ?
 fast plover
re: matplotlib; Is there a way for me to increase the y-axis 'excess' by a percentage? I mean instead of it bounding at the min and max of my dataset, increase that by like 10% in each direction
Documentation is incredibly dense so finding the exact thing I need is finicky.
 dreamy spoke
Hi there, If I want to get into the ML world, where should I start? Thanks in advance!
 paper niche
is this the right place to ask a panda question :3 ?
@lone tusk yes it is, feel free to ask
tidal sonnet
I have this matrix A which is:
[[1, 1, 1],
[3, 2, 1],
[2, 1, 2]]
Which multiplies with [a, b, c]
Which is equal to S = [15, 28, 23]
The Values of [a, b, c] were then found to be [3, -1/2, 0], and I have been told to put the A in echelon form.
The values i'm supposed to replace are A12, A13, A23 and s1, s2 and s3.
A = [[ 1 , A12, A13],
[ 0, 1 , A23],
[ 0, 0 , 1 ]]
s = [s1, s2, s3]
But no matter how I was doing it... I just ended up being confused. Because that would mean that the price for carrots (c) is equal to 0, and the price for banana's (b) is equal to -0.5...
since [a, b, c] were said to be the prices of apples, bananas and carrots, and s is the total for that day
A = [[1, 1, 1], [0, -1, -2], [1, 0, 1]]
s = [15, -17, 8]
I reach as far as here, but then I get stuck...
heady hatch
My linear algebra is a bit rusty but let's work through this step by step.
So what are the steps to turning A into REF (row echelon form)?
@tidal sonnet
tidal sonnet
subtract a scalar of row one from row 2, then row 3, aim being to get the trailing diagonals as 0
@heady hatch
heady hatch
@tidal sonnet how did you find the values of a, b, c to be 3, -1/2, and 0?
 molten bronze
I am trying to train a NEAT neural net to play a game with a screenshot as the input but I am having an odd bug. If I run the game in directx everything works fine but if it is running using the vulkan API I just get the same frame over and over. I need to run it in vulkan as it is far more performance friendly. I have seen some discussion on issues with capturing vulkan applications. Would anyone have any ideas?
 royal thunder
can anyone help me i cant understand what the diagram is saying
lapis sequoia
well, you have some data points the blue dots
and you probably want to predict the 'life satisfaction' based on the 'GDP per capita'
so you try to find a model which does that
as you see the blue dots seem to fit on a line (a linear model)
which is described by the equation life_satisfaction = theta(0) + theta(1) x GDP
now this diagramm shows some models for more or less random values of theta(0) and theta(1)
green line doesnt fit at all, red is doing better but way to low and blue is already doing an ok job
but could still be better, if theta(0) would be a bit higher
royal thunder
the blue line and red line intersects right? is that the point where poeple gets satisfaction?
royal thunder
so what does it mean?
lapis sequoia
well, theyre just examples for possible models
royal thunder
Oh i get it
lapis sequoia
and of these, blue model is the one that fits the data best
royal thunder
red?
lapis sequoia
red is far away from the data points
but got at least the right trend
it goes up
whereas green goes down
royal thunder
so the blue line is the trend where it shows satisfactory level right?
lapis sequoia
blue is doing ok, but is clearly not the optimal solution
royal thunder
what is the optimal solution then?
lapis sequoia
well, finding that one is often the data scientist job
royal thunder
i get that one now
lapis sequoia
and theres no general way to find an optimal solution. You have to define a goal before that
what is often used is the root mean square distance
thats getting really technical
not sure if that helps you
lapis sequoia
a good solution is one, where the line (the linear model) has a low distance
to the data points
royal thunder
oh i get it
lapis sequoia
so you are confident you can predict unknown values
however, there are several ways to think of distance
royal thunder
yeah i totatlly get it man
so i started like a day ago
with hands on machine learning on scikit and tensor flow in python
will you help me get better?
lapis sequoia
I can try, but others here will help you as well
lapis sequoia
finding a model to predict unknown data is a big part of machine learning
if not the essence
lapis sequoia
just ask a question here or in one of the help channels
royal thunder
yeah i wanna learn numpy tho
so i got headed to their website
it kind of showed me a 1500 pages reference guide so i want resources for now to study
you know any?
royal thunder
umm why?
lapis sequoia
Didnt use one myself
learned most of the stuff i know in school and university
and got a pretty solid mathematical background
 outer geyser
I would recommend checking out freecodecamp in yt for tutorials
royal thunder
i am not good in maths man
lapis sequoia
not sure about you
royal thunder
I would recommend checking out freecodecamp in yt for tutorials
@outer geyser checking that one thanks man
outer geyser
they have a 4 hour beginner course
lapis sequoia
yep, thats why you probably need other resources than Id watch
outer geyser
can I send links here? @lapis sequoia
royal thunder
i got low grades in math man wanna improve that
royal thunder
i wanna get good in linear algebra ,calculus and probability statistics man
outer geyser

Learn Calculus 1 in this full college course.
This course was created by Dr. Linda Green, a lecturer at the University of North Carolina at Chapel Hill. Check out her YouTube channel: https://www.youtube.com/channel/UCkyLJh6hQS1TlhUZxOMjTFw
This course combines two courses t...
check this one out @royal thunder ^