#data-science-and-ml
1 messages · Page 255 of 1
 hasty grail
hasty grail
hasty grail
yeah try that
 cedar sky
And then modify right
 safe sparrow
Im looking for a way to multiply all values of a TF layer
cedar sky
bb in 15 mins
@hasty grail Ok
safe sparrow
So fx, say that a concat layer has dim (None, 3) and i want to multiply all the 3 values in a matrix multiplication method, meaning my output is (3, 3) (np.outer)
Any way i can do this?
cedar sky
@hasty grail Thank You So Much For The Help
So fx, say that a concat layer has dim (None, 3) and i want to multiply all the 3 values in a matrix multiplication method, meaning my output is (3, 3) (np.outer)
@safe sparrow I am not sure abt your question
safe sparrow
So
[1, 2, 3] is the tensor fx
i want [1x1, 1x2, 1x3][2x1, 2x2, 2x3][3x1, 3x2, 3x3]]
cedar sky
ok
safe sparrow
ffx * makes text tilted
cedar sky
one sec let me think
safe sparrow
But i also want it to be easy to do with division aswell
cedar sky
You could have [[1], [2], [3]] * [1, 2, 3]
safe sparrow
I mean, the issue isnt getting the output, that's essentially just [[f*g for g in list] for f in list]
But it's translating it into tensorflow thats the issue
cedar sky
tf.matmul maybe
 somber dune
safe sparrow
somber dune
safe sparrow
what i want is in np.outer (for multiplication only) but that doesnt translate into tensors very easily
safe sparrow
Im trying to make a function that just takes all cross multiplications of the inputs
Same with cross divisions
cedar sky
Oh I am not very sure about it... Maybe someone else can help sorry
safe sparrow
Its alright
hasty grail
@cedar sky Did it work?
hasty grail
@safe sparrow a simple Google search yielded me this https://stackoverflow.com/questions/33858021/outer-product-in-tensorflow
cedar sky
I think that error is only because of the unavailability of gpu
hasty grail
Nice
cedar sky
Thanks very much DarkLight
hasty grail
No problem 🙂
 brittle agate
Uh...I hate so much one thing. Why people can't do simple searching on Google?
Why people. Just google and find the fucking decision.
 mild topaz
hii, i tried so much on google
but i do not get anything related to
how i can do template matching or pattern matching on documents?
brittle agate
Of course, if u didn't find decision after 3 hours. Of course, write question.
how i can do template matching or pattern matching on documents?
@mild topaz
U tried to ask it at StackOverflow?
mild topaz
not on so..
brittle agate
Go to Stack and ask. It's good way to find answer.
hasty grail
have you done the OpenCV tutorial?
mild topaz
kept on hold for now
hasty grail
Do it
I don't get why are you putting that on hold
Even for documents you're essentially doing the same thing, so OpenCV is still applicable
mild topaz
can you share the tutorial ?
hasty grail
mild topaz
see i tried this , done as same as this
hasty grail
and then?
mild topaz
now i have a different task
mild topaz
see this
mild topaz
but this is like feature matching , i guess ?
mild topaz
i am doing image matching or template matching
hasty grail
P.S. OpenCV also has feature matching
I found all this from a simple Google search
mild topaz
if uploaded image matches with the template then it is a valid image
hasty grail
extract a bunch of features from the template image that would identify it as such
then match each of them against the input test image
the more features matched, the more likely it is valid
mild topaz
okay let me go for this
hasty grail
it's just a very general methodology, never messed with this field myself
hasty grail
?
Explain
looks like you have found a pretty decent match
I don't see what's the problem
hasty grail
maybe you should learn NumPy
mild topaz
does it solve problem?
hasty grail
no, but it is a tool for other libraries to solve problems
if you're into data science using Python, NumPy is basically a must
you can use NumPy to manipulate the outputs of OpenCV
since the images in OpenCV are NumPy arrays
!d numpy
 thin terrace
Hey,
I have a df where multiple rows belong to eachother and are identical except for the values in a particular column. I want to combine these rows into one and turn the values of the particular column into new columns to keep the data in the new combined row. I demonstrate this in the picture below - the df above the blue line is the format I have, under is the result I want to achieve. How is this done in a simple way?
 weary ravine
https://stackoverflow.com/questions/64027528/how-could-i-get-my-intern-computer-audio-in-real-time
Guys could you help me 👆

Stack Overflow
Ok so i would like to make a program that listen my computer audio in real time, and when it says some word what i defined as important it alerts me... (the code is in python), I used the speech
 glossy vale
 frail arch

 tidal sonnet
Is it better to learn machine learning using octave, or sololearn's machine learning with python course?
 grave frost
Hey Y'all! I want to train a TensorFlow model which would accept an input (which is an alphanumeric string) and would try to find the pattern between the input (string) and a corresponding output. My question is very simple- Can I use a simple list like [0.12, 0.53, ...] with values between 0 and 1, convert it into a tensor (probably tf.float16) and feed it to the model? So the Pandas DataFrame would look something like this:-
0                 1          #Columns
[<some_list>]    [233]       #1 will have any random integer b/w 1 and 2.5 Million-enough for int32
[<another_list>]  [34255]
.......            .....     #And so on
I was planning to use make_csv to build the Dataset object and feed it inputs formatted as [tf.float16, tf.int32] So just wanting to confirm - is this approach correct?
hasty grail
Yes but how are you generating the numbers in that list?
grave frost
@hasty grail Planning to simply divide the encoded integers obtained earlier by 10 (to normalize b/w 0 and 1) and use that in a list
 tidal bough
you can convert a list into a tensor, yes
 rustic apex
Is broadcasting kinda like a “pattern”?
hasty grail
How would you handle the alphabet characters then?
tidal bough
the only caveat I can see happening, mind, is that since usually the input tensor has shape (n_samples,n_features), you may have to make it an (n_samples,1) (2d) tensor rather than an n_samples, (1d) one. @grave frost
grave frost
Hmm.. How can I make it 2D then?
tidal bough
with numpy it's .reshape, almost certainly about the same with TF.
grave frost
So should I reshape before the list goes in, or after obtaining Tensor from the TF utility?
tidal bough
https://colab.research.google.com/github/yandexdataschool/Practical_RL/blob/coursera/week1_intro/primer/recap_tensorflow.ipynb
here's a TF primer, by the way.
So should I reshape before the list goes in, or after obtaining Tensor from the TF utility?
Well, you need (I'm assuming) the tensor to be 2d when it's passed to the model. So right after you make one from a list.
grave frost
This good? :
<tf.Tensor: shape=(4, 1), dtype=int64, numpy=
array([[1],
       [2],
       [3],
       [4]])>
Is broadcasting kinda like a “pattern”?
Think of it as a combination of auto-expanding and auto-tiling dimensions
grave frost
I reshaped it b4 making it a tensor
Tho it forced me to switch to int64 (was using int32)
hasty grail
Imo you should make it one-hot
tidal bough
that looks right, yeah, it's 2d now
hasty grail
conceptually a '1' in your input is no further from '2' than it is to '9'
tidal bough
Tho it forced me to switch to int64 (was using int32)
it shouldn't have, but neither should it matter - I believe all models internally use floats, so it'll be converted when you pass it to the model.
grave frost
@hasty grail I can use some other nums for the alphabets (I only have 6 - Hex)
So a-f can be from 11-16
hasty grail
I'm going to bed soon, but if you're planning on helping them @tidal bough, the background is that they are trying to build a ML model to assist in decoding hashes.
We already had a discussion about that yesterday on this chat around this time
tidal bough
hmm, it's not inconcievable, but probably not going to work. Though it does sound like something you can potentially get serious articles from if it works 🙂
"BREAKING NEWS: AI BREAKS SHA256"
grave frost
@tidal bough It isn't supposed to work - It's a naive POC, a baseline
That's the whole point of crytography
That it is totally random
@tidal bough This sort of thing :-
array([[0.3],
       [0.7],
       [0.9],
       [0. ],
       [0.6],
       [0.7],
       [0.3]])>
Will be in every input to output line of the dataset (so this is how every element in first column of DF will look like). So would the input be like:- ([[0.3, 0.5, 0.4], [0.7, 0.6, 0.1]]) Like a giant array to store all the inputs in one place and outputs in another array, or will it all be individual?
tidal bough
not sure what you mean
what's the shape of each input point?
like, how many values should be transformed into one output?
grave frost
One list per output. The shape in 2D would be (40,1) so like 1 input will be a single list with 40 elements. the outputs would be an integer
Sample:- [0.3, 0.5, 0.6, 0.0, 0.1, 0.9, 0.2, 0.1, 0.7, 0.9, 0.1, 0.3, 0.1, ........] , 1 Where that 1 would be corresponding output. And yes, it is a csv dataset
So this whole thing is 1 line - a single sequence.
rustic apex
Is broadcasting pretty much applying a pattern to a array/ list?
tidal bough
@grave frost Right. The entire input to the model should be a 2d tensor, where each row is a single example. I thought you had a single feature, hence my comments about 2dness. If you have 40 features, then your entire input will be a (n_samples, 40) tensor - each row being an input point. And the output will be n_samples, or something like that
 lapis sequoia
Can someone help me with numpy?
I'm learning it yet, but I have to a function to calculate euclidean distance
import numpy as np
def de(v1, v2):
    a = np.subtract(v1, v2)
    b = np.exp(a, 2)
    c = np.sqrt(b)
    #distancia = np.sqrt(np.exp((np.subtract(v1, v2), 2)))
    print(c)
vetor1 = np.full((3,3), 7)
vetor2 = np.full((3, 3), 9)
de(vetor1, vetor2)
but I don't know how to do the exponencial part, since the exp() function is for the e^x
tidal bough
power, or just use Python's ** operator
also, you can just use - instead of subtract.
lapis sequoia
even for vectors?
tidal bough
Yes. It's kinda the whole point of numpy - being able to easily manipulate multidimensional arrays like that.
grave frost
@tidal bough I didn't understand. I should keep the entire input like this [[input_1], [input_2], [input_3], ....]?
So this gigantic array in 1 files?
tidal bough
Also, numpy.linalg.norm implements the Euclidean norm efficiently 🙂
https://numpy.org/doc/stable/reference/generated/numpy.linalg.norm.html
So your function is pretty much just:
import numpy as np
def de(v1, v2):
    print(np.linalg.norm(v1-v2))
@grave frost The input to the model should be a 2d array, with a point per row. So if you're passing 20 inputs (each of which a row of 40 values), you'll pass a (20,40) array and get a (20,) array of outputs back.
(well, tensor, not array)
grave frost
Yeah, but doesn't that put all those values in 1 array/tensor?
lapis sequoia
@tidal bough how could you do that without this numpy function?
grave frost
Like if I pass 2.5M inputs, my input array with have (2.5M, 40) shape, which would mean basically the entire thing in 1 array?
tidal bough
@lapis sequoia Like you are doing it.
import numpy as np
def de(v1, v2):
    print(np.sqrt(((v1-v2)**2).sum()))
subract them, square the difference, sum it, take the square root.
tidal bough
Like if I pass 2.5M inputs, my input array with have (2.5M, 40) shape, which would mean basically the entire thing in 1 array?
@grave frost Yup, if you want to calculate them all. Though the only reason it's done this way is because it's generally faster to calculate the outputs for a whole bunch of inputs at once instead of one at a time. In your case, however, the big array will probably not fit into memory, so you'd want a compromise - split it into smaller batches that are comfortable to process.
grave frost
@tidal bough Right, so I make 2 files - one with all the inputs and one with all the outputs, and TF will automatically understand that [0] elem of first tensor in input files corresponds to [0] in output file?
Could you point me to some resources to accomplish that?
tidal bough
Right, so I make 2 files - one with all the inputs and one with all the outputs, and TF will automatically understand that [0] elem of first tensor in input files corresponds to [0] in output file?
Well, TF will not do anything like this for you, you'll have to actually load the files as tensors first.
grave frost
Like in the loading dataset for TF part
Right, I know how to do that
@tidal bough Are you sure about that? https://www.tensorflow.org/tutorials/structured_data/feature_columns#create_an_input_pipeline_using_tfdata
 tidal bough
About what? This is about making Datasets from pandas dataframes.
grave frost
Right, but they do not seem to be concactenating all their feautures in 1 file...
tidal bough
I don't see them even working with files, only dataframes.
grave frost
Yeah, but I also have a dataframe
Ok. I wil make a input file like this:-
[[row_1_list_here],
[row_2_list_here],
....
]
And give the same treatment for the outputs.
tidal bough
I don't really get what you mean, to be honest.
grave frost
I am enquiring whether this is how the input file's format will look like
Then for tf.data.dataset I have readymade batch and processing functions to split into train and val and construct a generator for the model to generate in batches
I will store inputs in a seperate generator and outputs in a seperate generator, and pass them in model.fit(input_gen, outputs_gen, ..other args). Does all that look right?
So to conclude, @tidal bough
- I make my files in the above specified format (if it looks alright)
- I convert each file into a dataframe, making them easier to work with
- I do not do splitting into train and val before and just put the args in
model.fit()to accomplish all that - Then I make a
.datasetgenerator to load and batch the data accordingly. - Finally I pass it all into
model.fit(inputs_gen, outputs_gen, <and_all_other_args>)
Does that look alright to you?
This is the format for the input files:-
[[row_1_inputs_list_here],
[row_2_inputs_list_here],
[0.3, 0.4, 0.5, 0.1, 0.1, 0.7, ....],
[0. 0. 0. 0. 0. 0. 0. 0. 0. 0. ....],
....
[last_inputs_list]]       #And closing square brackets in the end
 stuck portal
I am having trouble validating an xml with an xsd schema. The validator that I built works for other schemas and xml but not for this particular xml/xsd pair. The XSD in question throws the error when I try and just generate a schema from it.I have been stuck with the same error for a week now and I have not been able to get resolve it despite me and a friends best efforts.
Code:
schema_file = open('/Users/CyberJesus/Downloads/MileHigh/EDGEServerMedicalClaimSubmission.xsd')
my_schema = xmlschema.XMLSchema(schema_file, base_url='/Users/CyberJesus/Downloads/MileHigh/')
Error:
xmlschema.validators.exceptions.XMLSchemaParseError: unknown type 'vo:MedicalClaimDetailServiceLine':
Schema:
<xsd:element xmlns:xsd="http://www.w3.org/2001/XMLSchema" maxOccurs="1" minOccurs="1" name="includedDetailServiceLine" type="vo:MedicalClaimDetailServiceLine" />
Path: /xsd:schema/xsd:complexType/xsd:sequence/xsd:element[20]
Schema URL: file:///Users/CyberJesus/Downloads/MileHigh/MedicalClaimDetail.xsd
 livid temple
Hi guys/gals, i am scraping data with selenium and a lot of the data will have different # of headers/fields... it is not all uniform. I want to eventually put it into pandas/postgres database for analysis but i feel i would need to look at the data manually before hand. My thoughts are put it into a CSV file first, then clean it manually and just look at the data to do a "sanity check"... but was wondering if anyone here had suggestions on what might be a better way to go about this? Is this a standard way of doing things?
 velvet thorn
Hi guys/gals, i am scraping data with selenium and a lot of the data will have different # of headers/fields... it is not all uniform. I want to eventually put it into pandas/postgres database for analysis but i feel i would need to look at the data manually before hand. My thoughts are put it into a CSV file first, then clean it manually and just look at the data to do a "sanity check"... but was wondering if anyone here had suggestions on what might be a better way to go about this? Is this a standard way of doing things?
@livid temple if the data will have different numbers of headers, why do you want to put it into a single file?
livid temple
@velvet thorn well, some of the JSON data will have nested objects, i just want to make sure the data im scraping is appropriate to put into a database before loading it. Because i could see me having to make constant changes to some of the data
velvet thorn
@velvet thorn well, some of the JSON data will have nested objects, i just want to make sure the data im scraping is appropriate to put into a database before loading it. Because i could see me having to make constant changes to some of the data
@livid temple some?
what kind of database, incidentally?
livid temple
Postgres database
velvet thorn
if you want to use pandas, you'll probably need to normalise your data...?
pandas isn't really meant for denormalised data
livid temple
@velvet thorn yes, well i might want to use pandas for it, in which case i would have to normalize everything
but i think i could do a lot of analysis just via jupyter notebooks/shell_plus
livid temple
right now i just finished writing my selenium script, but there could still be errors from some of the objects... that's why i kind of wanted to see it with my eyes before just loading all the data into a db
velvet thorn
because CSVs are also meant for tabular data
at least use a JSON (for storage), I think
livid temple
@velvet thorn that's probably a good suggestion... just use a JSON file ?
velvet thorn
yeah, why not
livid temple
@velvet thorn good suggestion i think ill try that
just never done that before, i've used json many times just never wrote a json file
velvet thorn
yup, it's p simple
lapis sequoia
import json

class typing:
    def __init__(self):
        self.Any: None = None

def read(path: (str,)) -> (typing.Any,):
    with open(path, "r") as file:
        return json.loads(file.read())

def write(path: (str,), data: (typing.Any,)) -> (None,):
    with open(path, "w") as file:
        file.write(json.dumps(data))
return```@livid temple
example of what you can do.
 odd yoke
that code confuses me to the maximum
velvet thorn
@lapis sequoia what...is that supposed to be?
self.Any: None = None what is this?
(typing.Any,) or this?
🥴
odd yoke
- why is typing a class here and not the builtin module ?
- how are static type checkers supposed to know what Any is supposed to be
- why are there tuples
- why not use
load/dumpdirectly
tidal bough
oh god this is so cursed
- why do you have an instance variable which has type None always
(if it's not always None, why is it typehinted like that?)
odd yoke
wait yeah, typing.Any crashes anyway
velvet thorn
- why is there a
return
lapis sequoia
to confuse the shit out of anyone who looks at my code.
also that shouldnt crash. maybe im wrong
WAIT
import json

class typing_:
    def __init__(self):
        self.Any: None = None

typing = typing_()

def read(path: (str,)) -> (typing.Any,):
    with open(path, "r") as file:
        return json.loads(file.read())

def write(path: (str,), data: (typing.Any,)) -> (None,):
    with open(path, "w") as file:
        file.write(json.dumps(data))
return```there
lapis sequoia
yee
velvet thorn
anyway, I would say that this is both off-topic and not helpful for #data-science-and-ml (maybe just not helpful)
lapis sequoia
(its not helpful, its confusing)
lapis sequoia
Anyone have a recommended service for running code on GPU instances? For example, https://datacrunch.io offers dedicated servers running Nvidia Teslas. What are some other services out there that I should know about. I'm not interested in AWS, Google, or Microsoft.
DataCrunch
High-end Tesla V100 GPU servers, excellent prices. Order your instance and be up and running in minutes.
 wise garden
is there a better way to assign observations in df to binary?
df.loc[df['response']== 'YES', 'response'] = 1
df.loc[df['response']== 'NO', 'response'] = 0
velvet thorn
is there a better way to assign observations in df to binary?
@wise gardendf['response'] = df['response'].map({'YES': 1, 'NO': 0})
alternatively, df['response'] = (df['response'] == 'YES').astype(int)
(although that would mean that any non-'YES' response gets turned into 0, too)
which is fine if you only have 'YES' and 'NO'
velvet thorn
yw
 unique basalt
Alright so I'm using Selenium and I'm not 100% sure where to ask this question but I see the most pop ups for it here
I have a project and I'm using the module for a part of it that has me go onto twitter and copy the usernames that have specfic characters in there
I'm just trying to interact with the page so I'm using this for example
driver.find_elements_by_xpath('//div[@class="css-4rbku5 css-18t94o4 css-1dbjc4n r-1loqt21 r-1wbh5a2 r-dnmrzs r-1ny4l3l"]')[5]
But running that always returns IndexError: list index out of range
But if I check on here https://twitter.com/search?q=%22Podcast%22&src=typed_query&f=user, and search for the xpath I get 40 results
velvet thorn
has the page loaded?
velvet thorn
hm
did you inspect
the HTML sent to the driver?
it could be that Twitter knows that you're not a real user
velvet thorn
you can see the HTML of the actual page loaded by the driver
driver.html I think?
it's been a while since I've used Selenium
unique basalt
yeah I have no idea either lmao
 bronze schooner
Have someone read "Hands On Machine Learning" ?
If the answer is yes. Can you give me any advises to have the best knowleage?
velvet thorn
your xpath is wrong then
most likely
when you fetch with Selenium the xpath is different
unique basalt
Okay @velvet thorn I made it work via navigated through links
I think you were right and It was getting stuck on something else but idk
Any chance you know how to navigate to elements?
I'm trying to scroll down to populate more results
nvrmind got it
 limpid oak
I have df in which each row contains points(gps cord) info, my code connects those points and makes polygon which is desired output, but due to error in data, polygon plotted wierdly or one point away from actual site
any suggestions?
I come with this solution suppose you have 3 points A, B, & C. You can find the slope of a line from points A & C. You can then compare it with A & B and B & C. If the difference is above threshold x, then discard point B
hasty grail
Can you illustrate your problem with an example?
limpid oak
think like you have your farm, using gps you walked along your farm plot to record points
when walked around four corners, you have this file, using this you can make polygon
but due to error one point is recorded very away from your farm plot, but its get connected
think like 100km away
hasty grail
you can compare the distances between the points and filter out the points that are very far away from the others (in a relative sense)
 merry fern
when you use .agg, that is numpy correct?
what parameters can I pass other than sum, mean, min, can I pass .agg(mode)? I'm looking for a list somewhere...
im actually curious what the starterpack is for data-science, like what docs to read other than pandas, numpy seems like a great one to just read thru the whole thing
limpid oak
@hasty grail by taking means of previous points?
hasty grail
pandas is built on numpy so yeah xD
Compute the pairwise distance between all of the points then find the ones that are outliers @limpid oak
limpid oak
can you help me in code?
merry fern
diff_cols = ['Quantity', 'Price']

df_agg_diffs_int_pb = df_int_agg[diff_cols] - df_pb_agg[diff_cols]
how to specify those 2 cols when the Type col ='Bond'?
 old meteor
Hello, I've been using openpyxl for dealing with an accounting excel file. But as it's getting more complicated, like fetching json data from difference sources on the web, I'd like to get an idea about whether pandas is the tool I need. With my basic understanding, pandas is good with dataframe. However in my excel sheets it's not always so tidy. I mean there can be cells in some rows unrelated to the columns index. I wonder if that'd be difficult for pandas to handle. Can I suddenly fill in a cell that has nothing to do with the column or row? As for openpyxl, it treats every cell individually.
hasty grail
import numpy as np
from scipy.spatial.distance import cdist

max_std_from_mean = 2.0

# points: shape (num_points, n_dims)
distances = cdist(points, points)
mean, std = np.mean(distances), np.std(distances)
abs_std_scores = np.abs((distance - mean) / std)
return distances[abs_std_scores.max(axis=-1) > max_std_from_mean]
@merry fern
something like this maybe
merry fern
diff_cols = [np.where(['Type']=='Bond', ['Quantity', 'Price'])] @hasty grail simple as that?
hasty grail
edited, please look agian
merry fern
hmm, mine doesn't work bc numpy is expecting x, y
oh @hasty grail that's about my question about numpy
thank you
hasty grail
I have no idea what your array looks like
merry fern
true
this is the code
diff_cols = [np.select(['Type'] == 'Bond', ['Quantity', 'Price'])]

df_agg_diffs_int_pb = df_int_agg[diff_cols] - df_pb_agg[diff_cols]
df is Type, Quantity, Price
I'm trying to aggregate by 'Quantity', 'Price' only when 'Type'="Bond"
hasty grail
why don't you select it using Pandas API then
merry fern
is that loc
limpid oak
@hasty grail `import tkinter as tk
from tkinter import filedialog
Filetype = [('all files', '.*'),('shapeFile','.shp'), ('text files', '.txt')]
root = tk.Tk()
root.withdraw()
FilePath=filedialog.askopenfilename(title='Select Your .csv file as Input')
#print(FilePath)
SaveFilePath = filedialog.asksaveasfilename(title='Enter Shapefile name to save in Directory',
filetypes=Filetype,defaultextension='.shp')
import geopandas as gpd
import pandas as pd
from shapely.geometry import Polygon,Point
import json
import numpy
InputFile = pd.read_csv(FilePath)
#InputFile
InputFile['geofence_poly'] = InputFile['PlotGeoFence'].apply(f)
def f(row):
try:
return Polygon([(pt['Longitude'], pt['Latitude']) for pt in json.loads(row)])
except:
return numpy.nan
ErrorGeoFencingUpdatedData = InputFile
InputFileRefined = InputFile.dropna(subset=['geofence_poly'])
#InputFileRefined.head(2)
ErrorGeoFencingUpdatedData.to_csv(SaveFilePath[:-4]+'Error.csv')
InputFileGDF = gpd.GeoDataFrame(InputFileRefined,crs={'init' :'epsg:4326'},geometry=InputFileRefined.geofence_poly)
#InputFileGDF.head(2)
#list(InputFileGDF)
InputFileGDF1 = InputFileGDF[['designation','season','added_by','year','added_date',
'PlotGeoFence','mode','plot_marking','geo_fencing_status',
'district','subdivision','taluka','village','hostfarmer',]]
#InputFileGDF1
InputFileGDF2 = gpd.GeoDataFrame(InputFileGDF1,crs={'init' :'epsg:4326'},geometry=InputFileRefined.geofence_poly)
#InputFileGDF2
InputFileGDF2.to_file(SaveFilePath)`
hasty grail
diff_cols = df[df['Type'] == 'Bond']['Quantity', 'Price']
# or
diff_cols = df['Quantity', 'Price'][df['Type'] == 'Bond']
apply boolean mask and select the cols you need
hasty grail
@limpid oak Oops I pinged the wrong person before
import numpy as np
from scipy.spatial.distance import cdist

max_std_from_mean = 2.0

# points: shape (num_points, n_dims)
distances = cdist(points, points)
mean, std = np.mean(distances), np.std(distances)
abs_std_scores = np.abs((distance - mean) / std)
return distances[abs_std_scores.max(axis=-1) > max_std_from_mean]
This one is for you
merry fern
hm didnt work
limpid oak
@hasty grail sorry , but no idea where to apply it
merry fern
KeyError: 'Type'
hasty grail
That means you don't have a column 'Type'
merry fern
AHHHH
hasty grail
Also I missed some brackets
merry fern
Im' doing it at the wrong step
hasty grail
diff_cols = df[df['Type'] == 'Bond'][['Quantity', 'Price']]
# or
diff_cols = df[['Quantity', 'Price']][df['Type'] == 'Bond']
should be like this
merry fern
so this is what i need to change:
    'Quantity': 'sum',
    'Price': 'mean'
})```and I want to filter Type=Bond there
hasty grail
@limpid oak I suppose you have a way of getting a list of coordinates. You stack them into an array points and run the above code
@merry fern df[df['Type'] == 'Bond']
merry fern
.groupby on the outside or inside df?
hasty grail
you run your code after df[df['Type'] == 'Bond']
merry fern
full code
df_int = pd.read_excel(
    filenames['int'],
    sheets['int'],
    header=0,
    usecols=[0, 2, 4, 5],
    names=['Type', 'ISIN', 'Quantity', 'Price']
)
df_int = df_int.sort_values(by=['Type', 'ISIN']).reset_index()
df_int['Price'] = df_int['Price'] * 100
df_int_agg = df_int.groupby(['Type', 'ISIN']).agg({
    'Quantity': 'sum',
    'Price': 'mean'
})
df_int = pd.read_excel(
    filenames['int'],
    sheets['int'],
    header=0,
    usecols=[0, 2, 4, 5],
    names=['Type', 'ISIN', 'Quantity', 'Price']
)
df_int = df_int.sort_values(by=['Type', 'ISIN']).reset_index()
df_int['Price'] = df_int['Price'] * 100

# New line of code
df_int = df_int[df_int['Type'] == 'Bond']

df_int_agg = df_int.groupby(['Type', 'ISIN']).agg({
    'Quantity': 'sum',
    'Price': 'mean'
})
 desert oar
@merry fern .agg accepts a function whose first argument is a Series in addition to the magic strings
it looks like a string passed to .agg can be any method name on Series https://github.com/pandas-dev/pandas/blob/v1.1.2/pandas/core/groupby/generic.py#L239-L240

GitHub
Flexible and powerful data analysis / manipulation library for Python, providing labeled data structures similar to R data.frame objects, statistical functions, and much more - pandas-dev/pandas
so sum and mean are valid because there are Series.sum and Series.mean methods
velvet thorn
diff_cols = df[df['Type'] == 'Bond'][['Quantity', 'Price']]
# or
diff_cols = df[['Quantity', 'Price']][df['Type'] == 'Bond']
should be like this
@hasty grail no, you should not do this
use .loc when you want to select both rows and columns
hasty grail
Oh, didn't know that
cedar sky
Hey guys, yesterday I installed tensorflow but it seems to lack some required package and I am not able to find info abt it in google can anyone over here help me
hasty grail
Sure, go on
hasty grail
those errors appear because you're not using a GPU
hasty grail
wdym it doesn't work
Process finished with exit code 0
This means it successfully executed
cedar sky
tf.add(1, 2).numpy()
hasty grail
you're not printing the result
cedar sky
yeah just for the trial I used tensorflow
hasty grail
Btw you can use the common Python operators for tensors just like numpy
e.g. a + b instead of tf.add(a, b)
 wild pine
is there are common approach to finding the shortest distance between two nodes in a network?
right now my ideas are A* (a pathfinding algorithm) or simply trying out every possible path, but i feel like there gotta be a more effecient way to go about it..
btw every edge is assumed to have the same length. I'm interested in the amount of nodes on the path
uhm... i don't know if it has any significance to the problem, but it's a directed graph, and i'm stepping backwards towards the root.
basically i want to know how far any given node is from the 'root' layer of the graph
hasty grail
A* is pretty good in general
Try that first
If it doesn't work then maybe you should consider caching
wild pine
Alright i'll give that a go. that's also an algorithm I have some experience with, so that's pretty neat.
Tyvm ^^
hasty grail
np
As mentioned in the wiki page
Thus, in practical travel-routing systems, it is generally outperformed by algorithms which can pre-process the graph to attain better performance
 cosmic heron
Hi gues, i'm trying to start learning machine learning, i'm starting with linear regression, because it seems the easiest. I'm just confused as to why it's off for seemingly easy functions.
This is my code:
from sklearn.model_selection import train_test_split
from sklearn import linear_model
from sklearn.metrics import mean_squared_error, r2_score
import matplotlib.pyplot as plt
from pandas import DataFrame

# nums from 1 - 100
xaxis = [[x] for x in range(101)]

# squares of nums from 1 - 100
yaxis = [[x**2] for x in range(101)]

xaxis_train, xaxis_test, yaxis_train, yaxis_test = train_test_split(xaxis, yaxis, test_size=0.2)
model = linear_model.LinearRegression()
model.fit(xaxis_train, yaxis_train)
yaxis_pred = model.predict(xaxis_test)
print(xaxis_test)
print(f"Coefficients: {model.coef_}")
print(f"Intercept: {model.intercept_}")
print(f"Mean squared error (MSE): {mean_squared_error(yaxis_test, yaxis_pred):.2f}")
print(f"Coefficient of determination (R^2): {r2_score(yaxis_test, yaxis_pred):.2f}")
plt.scatter(x=xaxis_test, y=yaxis_test, color='green', marker='+', alpha=0.5, label='Test Data')
plt.scatter(x=xaxis_test, y=yaxis_pred, color='blue', marker='+', alpha=0.5, label='Prediction Data')
plt.legend(loc='best')
plt.xlabel('Regular Number')
plt.ylabel('Reqular Number Squared')
plt.show()

That's the fit...
I don't understand why it's so off? They're just squares.
hasty grail
You can't fit a straight line to a function that isn't linear very well
cosmic heron
That made sense immediately 😮

I was about to complain, but you're right, I thought it'd be linear
hasty grail
I mean, y = x^2 is a quadratic function
cosmic heron
Yes, and now my math deficiencies show 😢
So basically, each algorithm works best when you know what kind of function is present?
hasty grail
Instead of "algorithm" you should consider them as "model"s
if you're trying to model something that doesn't follow the assumptions upon which the model is based on, naturally it won't perform very well
cosmic heron
Yes, that makes sense, thank you man, a lot of tuts I try to follow make leaps in assumption of my knowledge
You just helped me bridge a gap
Looking at polynomial regression now
hasty grail
np
velvet thorn
Instead of "algorithm" you should consider them as "model"s
@hasty grail hm I kind of disagree?
like a model is IMO the combination of algorithm and parameters
hasty grail
In their usage of the word in
So basically, each algorithm works best when you know what kind of function is present?
I feel that substituting it for "model" would be more appropriate
velvet thorn
yeah, so in that case I think “algorithm” is appropriate
e.g. in a case of a nonlinear relationship between features and (categorical) target one would use SVM
and the SVM, as fit on the data, would be the model
because “model” in this sense means a concrete function relating features with target, right?
which the idea of an SVM in the abstract sense (maximise distance between data and dividing hyperplane) is not
at least, that’s my two cents
odd yoke
yeah I agree, 2 different SVM models fit on different data are different models, but based on the same algorithm
hasty grail
Hmm maybe I should have used "model type" instead, generally I use "algorithm" in the sense of optimization (learning) process
velvet thorn
I think the democratisation of ML has also muddied the waters in the terminology department
I’m more or less totally self-taught though so 🤷♂️ no idea.
hasty grail
<- same lol
velvet thorn
like I usually hear “model” used the way you did
but I always felt that was wrong (e.g. if you look at the definition of “statistical model”)
lapis sequoia
Where do i learn AI?
 vast nacelle
I have just started learning using a combination of SoloLearn and books
grave frost
Hey all. I wanted to build a TF model to basically find the relationship between the input and the output. The model takes an alphanumeric string converted to a "list of floats" between 1 and 0 (like [0.3, 0.1, 0.4, ....] ) the outputs are integers (like1234431).
So to just double-check my approach:-
- I make my input and outputs files in the below specified format (in the code block) like an array of values.
- I convert each file into a dataframe, making them easier to work with
- I do not do splitting into train and val before and just put the args in model.fit() to accomplish all that
- Then I make a
tf.dataset generatorto load and batch the data accordingly. - Finally I pass it all into
model.fit(inputs_gen, outputs_gen, <and_all_other_args>)
Does that all that look right ?
This is the format for the input/output files:-
[[row_1_inputs_list_here],
[row_2_inputs_list_here],
[0.3, 0.4, 0.5, 0.1, 0.1, 0.7, ....],
[0. 0. 0. 0. 0. 0. 0. 0. 0. 0. ....],
....
[last_inputs_list]]       #And closing square brackets in the end
 austere swift
You can also put the data into numpy arrays and let model.fit() handle the batch size so you dont need the tf.dataset
grave frost
The data comprises of 2.5 Million rows
 vital thistle
Not sure if this is the right place to ask.
I have a dask data frame with 26 columns. I want to group by 8 of those columns and sum the hits column but I'm not sure of the most efficient way to do this in dask? e.g.
df_train_group = df_train.groupby(['col1', 'col2', 'col3', 'col4', 'col5', 'col6', 'col7'])['hits'].sum()
This creates a series type object where npartitions=1 which is impossible to load.
I have also tested with the approach below, but this is also quite slow and memory intensive:
def sum_hits(d):
'''
summarize hits, and return an dataframe for the single value-ed array
'''
return pd.DataFrame({'hits':[d.hits.sum()]})
dask_job = df_train
.set_index('col1', 'col2')
.pipe(dd.from_pandas, npartitions=20)
.groupby(['col1', 'col2', 'col3', 'col4', 'col5', 'col6', 'col7'])
.apply(sum_hits, meta={'hits':'f8'})
grave frost
@austere swift So I can just make a ndarray and simply pass it in the model.fit() function with no other processing?
austere swift
Yeah that’s what I usually do with smaller sets it’s easier
But you need 2 arrays btw, features and labels
grave frost
I ma trying to make 2 lists and converting them to ndarray. Funny thing is that the list takes hardly 40 Mb. But let's see
@austere swift Would you mind confirming the shapes of both the features and labels arrays?
My both arrays are shaped (n_samples,)
 celest rock
Hello, I'm trying to generate a random array of 10 weights that sum to 1, but I need to cap each weight to (0, 0.2). I'm currently using:
weights = np.random.dirichlet(np.ones(num_tickers), size=1)
I can't set upper bounds to each weight using this method, and I think there's a more efficient way than using a while loop.
austere swift
@grave frost the shape for the features should be (n_samples, feature_shape) so for example if you had 10k 3 channel 256*256 images it would be (10000, 256, 256, 3) and for the labels its just (n_samples, n_classes) so if it had 10 classes it would be (10000, 10)
grave frost
uh-oh
@austere swift My data would be like [ [<row_1>], [<row_2>], ...] Is there any way to make that in 2D?
austere swift
I guess i worded that wrong, its not supposed to be 2d, it can be whatever dimensions you want
feature_shape means like the shape of the features
so like i showed in the case of 256*256 images, that was a 4d array
grave frost
So can't it be 1D?
austere swift
yeah it can be
grave frost
but (n_samples,) is 1D. So why would that be wrong?
austere swift
it woudn't be
I just worded it wrong
you're right that would work
but anyways, [ [<row_1>], [<row_2>], ...] would be 2d
odd yoke
@celest rock np.random.uniform(0, 0.2, 10) works but the sum is approximately 1.0, not exactly, not sure if that's wanted
austere swift
yeah thats 2d
grave frost
Yeah, but it's also in string (the list is a string, not a list type)
austere swift
ohh I didnt notice the quotes
austere swift
I'm pretty sure a 1d array would work, but i've never tried it
grave frost
np 🙂
Yep, UnimplementedError: Cast string to float is not supported
Now that's a problem
celest rock
I've tested np.random.uniform(0, 0.2, 10) but there are instances where the sum can go as low as 0.5 and as high as 1.2, which is unfortunately too far from 1
odd yoke
do you really need the bounds to be exactly 0-0.2 ?
celest rock
Yeah but maybe the two constrains would require a more complex function than i thought
odd yoke
cus you can scale by the sum to exactly reach 1
austere swift
@grave frost oh yeah i forgot to mention you can't use strings lol
youd have to tokenize them
odd yoke
at the cost of potentially going over 0.2 as the max
grave frost
@austere swift Yeah, it's was actually converted to string for concatenating, but I forgot to remove the str(). I will try it again
odd yoke
x / x.sum()
celest rock
The dirichlet generator works nicely to sum to 1 but there are some instances where each weight can be up to 0.8, and the other 9 are super small
grave frost
Got it in list and the shape changed (1249999, 40).
Guess it made the whole thing in 1 string
odd yoke
makes it so that new_x.sum() == 1.0
celest rock
Ah okay I'll try that. Thanks!
grave frost
A general Numpy question: Does numpy pad the elements in an array by default?
array([ 1, 2, 3, ..., 1249997, 1249998, 1249999])
which meaning of pad are we using here ? and in what context ?
grave frost
@odd yoke I was referring to the leading whitespaces in the single digit values in the array. The expectation was there was to be no spaces anywhere , like ([1,2,3...])
I am training my model but am getting this error:-
InvalidArgumentError:  Input to reshape is a tensor with 12880 values, but the requested shape has 40
     [[node gradient_tape/sequential/embedding/embedding_lookup/Reshape_1 (defined at <ipython-input-11-5ee2d5c14aa0>:13) ]] [Op:__inference_train_function_3135]

Function call stack:
train_function
I think this is stemming from the fact that the shapes of the due to the embedding layer is not agreeing with the shape expected with the data. Now, my model has only Dense layers and Droput layers with BatchNorm at the end.
This is kinda what the code is like:-
model = tf.keras.Sequential([tf.keras.layers.Embedding(vocab_size, embedding_dim, batch_input_shape=[batch_size, None]),
  tf.keras.layers.Dense(2500, activation='relu'),
  tf.keras.layers.Dropout(0.15),
  tf.keras.layers.Dense(3500, activation='relu'),
  tf.keras.layers.Dense(5500, activation='relu'),
  tf.keras.layers.Dropout(0.15),
My batch_size is 1, and vocab_size is manually set to 19. I tried changing the no. of neurons in the Dense layers but that also gave no change in error.
So my question is that what factor here is affecting the shapes of the tensors in the model? is there any easy way to debug this?
I tried changing the vocab_size, but the error still complains of the 12880 values...
I tried switiching to GPU and this is what I got:-
InvalidArgumentError: 2 root error(s) found.
  (0) Invalid argument:  assertion failed: [Condition x == y did not hold element-wise:] [x (loss/SparseSoftmaxCrossEntropyWithLogits/Shape_1:0) = ] [40 1] [y (loss/SparseSoftmaxCrossEntropyWithLogits/strided_slice:0) = ] [1 40]
     [[node loss/SparseSoftmaxCrossEntropyWithLogits/assert_equal_1/Assert/Assert (defined at <ipython-input-10-68251a7f16ec>:33) ]]
     [[gradient_tape/sequential/embedding/embedding_lookup/Reshape_1/_22]]
  (1) Invalid argument:  assertion failed: [Condition x == y did not hold element-wise:] [x (loss/SparseSoftmaxCrossEntropyWithLogits/Shape_1:0) = ] [40 1] [y (loss/SparseSoftmaxCrossEntropyWithLogits/strided_slice:0) = ] [1 40]
     [[node loss/SparseSoftmaxCrossEntropyWithLogits/assert_equal_1/Assert/Assert (defined at <ipython-input-10-68251a7f16ec>:33) ]]
0 successful operations.
0 derived errors ignored. [Op:__inference_train_function_2871]
use
.locwhen you want to select both rows and columns
@velvet thorn thank you... i need to work on this
rustic apex
Is “broadcasting” basically a pattern?
merry fern
sweet. fixed my code 🙂
lapis sequoia
I'm trying to make a project but for some reason it does not perform well on test data. I was suspecting overfit but training loss is too big and so is validation loss. training accuracy and validation accuracy are both low. Is it possible that the model is underfitting or the data is unrepresentative or insufficient
heres the loss graph
 narrow surge
Does anyone know why sometimes sort_values gives a key error
I looked online and it doesn't make too much sense as to why I can do it sometimes and why I can't do it other times
lapis sequoia
Hey guys, I'm in trouble, trying to concat 2 df, I'd like to concat them side to side, but Idk what's wrong...
tidal bough
@lapis sequoia I like looking at accuracy-over-epoch too, but I believe that if the model reaches a plateau (normally indicating the end of the training) and it's just too low-accuracy, it simply means the model isn't complex enough to predict the data. Underfitting, not overfitting.
lapis sequoia
Well thing is its not my code, but i noticed that the accuracy plot is not reaching a plateau. It's fluctuating and cutting off on one of the initial epochs because validation loss is increasing and there is a patience argument. Which is why I suspect that the data is bad, but i definitely also suspect underfitting
I'm gonna try to train on all epochs first and then see
merry fern
Hey guys, I'm in trouble, trying to concat 2 df, I'd like to concat them side to side, but Idk what's wrong...
@lapis sequoia use this site to share your code:
https://paste.pythondiscord.com/
brittle agate
When u are making GAN's model.
velvet thorn
I looked online and it doesn't make too much sense as to why I can do it sometimes and why I can't do it other times
@narrow surge show examples, otherwise it could be more or less anything.
@lapis sequoia don't post pictures; post code. it's super hard to see.
@odd yoke I was referring to the leading whitespaces in the single digit values in the array. The expectation was there was to be no spaces anywhere , like
([1,2,3...])
@grave frost it's just a display thing
the representation in memory is the same
rustic apex
Is:
“df = pd.read_csv(“./FileName.csv”)
df.head()
The default way of linking/showing a file? I tried that on Kaggle, but it didn’t work
 deft harbor
Your path is weird. Is it in the project root directory?
desert oar
@rustic apex "didn't work" is too vague. what went wrong? do you see an error message? is the result different from what you expected? what exactly where you expecting? what do you mean by "linking" a file?
 junior fossil
Hello all, I work in Full Stack Development as of now and I want to move to analytics. I have got a voucher to apply for DA-100 Power BI certification. Any advice on where I should start learning, courses that you recommend for this? thanks in advance 🙂
rustic apex
@desert oar I got it to work 👍
cedar sky
Hello all, I work in Full Stack Development as of now and I want to move to analytics. I have got a voucher to apply for DA-100 Power BI certification. Any advice on where I should start learning, courses that you recommend for this? thanks in advance 🙂
@junior fossil Would you want to do Machine Learning
junior fossil
yeah, but I was told it's good to start with data science and move to ML or AI later
lapis sequoia
how do I do a per row calculation with pandas?
 untold aspen
 timber junco
i want to ask, how to avoid overfitting, my train data is good with 90% auc score, but my test data under 70%, i have doing normalization but it is not good enough, any idea ? btw i using SVM kernel rbf
velvet thorn
how do I do a per row calculation with pandas?
@lapis sequoia what calculation?
cedar sky
i want to ask, how to avoid overfitting, my train data is good with 90% auc score, but my test data under 70%, i have doing normalization but it is not good enough, any idea ? btw i using SVM kernel rbf
@timber junco Using a L2 regularization will probably help
else try data augmentation
If possible try getting more training data
i want to ask, how to avoid overfitting, my train data is good with 90% auc score, but my test data under 70%, i have doing normalization but it is not good enough, any idea ? btw i using SVM kernel rbf
@timber junco normaliztion only helps in speeding up the training it won't be very helpful to prevent overfitting
i want to ask, how to avoid overfitting, my train data is good with 90% auc score, but my test data under 70%, i have doing normalization but it is not good enough, any idea ? btw i using SVM kernel rbf
@timber junco And what is the project you are taking up? Just out of curiosity
timber junco
@cedar sky wow thx, i will try it, my project is credit fraud detection
this is my evaluation
cedar sky
@cedar sky wow thx, i will try it, my project is credit fraud detection
@timber junco Oh nice
@cedar sky wow thx, i will try it, my project is credit fraud detection
@timber junco And welcome
yeah, but I was told it's good to start with data science and move to ML or AI later
@junior fossil I think Andrew Ng's ML course might be a good place to start
Else for data science I found a couple of specializations in coursera but I have not taken them yet... I think browsing around in coursera might help you a lot
junior fossil
@junior fossil I think Andrew Ng's ML course might be a good place to start
@cedar sky I have been meaning to do this!
 ruby glade
Hey newbie question,
how do we iterate through the features and how to iterate through the data points?
for r in range(max_r):
    reg = LinearRegression(fit_intercept=False)
    reg = reg.fit(X[:,r], y) #I tried to iterate through features, didn't work
    #Extra note: I tried reg.fit(X[r], y) for the data points, didn't work
    y_pred = reg.predict(X)
    linreg_error[r] = mean_squared_error(y, y_pred)
Thanks in advance!
unique basalt
Okay so I'm trying to use cookies to open Selenium now
from selenium.webdriver.chrome.options import Options
import time

options = Options()
options.add_argument("user-data-dir=C:\\Users\\####\\AppData\\Local\\Google\\Chrome\\User Data\\Profile 1") #Path to your chrome profile

driver = webdriver.Chrome(executable_path=r'C:\Users\arcaz\Documents\GitHub\Trello_Bot\chromedriver.exe', chrome_options=options)

driver.get("https://www.google.com")```And every time I run this my profile basically doesn't get loaded
But if I run this
from selenium.webdriver.chrome.options import Options
import time

options = Options()
options.add_argument("user-data-dir=C:\\Users\\####\\AppData\\Local\\Google\\Chrome\\User Data") #Path to your chrome profile

driver = webdriver.Chrome(executable_path=r'C:\Users\arcaz\Documents\GitHub\Trello_Bot\chromedriver.exe', chrome_options=options)

driver.get("https://www.google.com")```It doe
does*
 upper forge
Hi everyone! I am trying to extract relevant data from Job descriptions and resumes. I think that using the simple_transformers library is the quickest path to good results. I have wondering whether when approaching this problem it would be better to approach it as a Named entity recognition problem or a Question Answering problem. I have attached some more info in my stack post https://stackoverflow.com/questions/64057111/how-to-decide-between-ner-and-qa-model
Any advice appreciated!
Stack Overflow
I am completing a task involving NLP and transformers. I would like to identify relevant features in a corpus of text. If i was to extract the relevant features from job description for instance the
grave frost
@upper forge If it was me, I would have leveraged the pre-trained GPT model to make it into a summarisation problem
Invalid argument: {{function_node __inference_train_function_11035}} Compilation failure: Input to reshape is a tensor with 1640 values, but the requested shape has 40
Can someone tell me what factors affect the shape of tensors in an embedding layer? I changed the Embedding_dims but it still complains that input is 1640 values, which should have changed
batch_input_shape is set to [batch_size, None] . My BS is 1, so [1,None]
upper forge
this is the result from the documentation. are u accounting for input length?
@upper forge If it was me, I would have leveraged the pre-trained GPT model to make it into a summarisation problem
@grave frost Can you explain that a bit more?
 thick turret
Hello, I have a quick question about date time and adding it to the a new column
Alright to post my code?
grave frost
@upper forge Basically you would feed input data as the job description/resume and would have a corresponding output file containing the "relevant data". Summarisation is a process in which a model trains to respresent a data input as a much smaller data output. So it can convert an entire essay into key points (like taking notes). You could do the same with the GPT model (1 or 2 whichever you prefer). It is pretrained on English corpus and so already understands the language well. You would just need to fine-tune some layers for it to work on your specific task and it would 'extract' the necessary data which you want.
I recommend you use the Fairseq library to accomplish that. It has a variety of architectures including the GPT and BER T ones and has compherensive docs as well as good Github support
Also batch_input_shape is not in the tf.keras.embeddings docs, so can anybody explain why it doesn't cause any error?
 rigid citrus
Can anybody recommend me something related to Data Science.... Like what should I do,read.... Currently I'm a batchelors in Statistics
grave frost
What do you find interesting?
upper forge
Also
batch_input_shapeis not in thetf.keras.embeddingsdocs, so can anybody explain why it doesn't cause any error?
@grave frost i got the screencap from the fdocs
 glacial mauve
i want to data science with python please suggest some course
grave frost
Does anybody know how to define batch size for embeddings in tensorflow
upper forge
I recommend you use the
Fairseqlibrary to accomplish that. It has a variety of architectures including the GPT and BER T ones and has compherensive docs as well as good Github support
@grave frost interesting,. I have never used the fairseq library before.Do you know if it is any different than transformers?
Does anybody know how to define batch size for embeddings in tensorflow
@grave frost can you attach a stack post or a small code sample so we can see the issue a bit clearer?
grave frost
Is Transformers that HF one?
grave frost
Well, I personally don't prefer it because it was too clunky and heavy for my use-case. It is not operable with other libraries so that ends up writing a lot of code for me
limpid oak
@hasty grail need some help for your given code
`import numpy as np
from scipy.spatial.distance import cdist
max_std_from_mean = 2.0
points: shape (num_points, n_dims)
distances = cdist(points, points)
mean, std = np.mean(distances), np.std(distances)
abs_std_scores = np.abs((distance - mean) / std)
return distances[abs_std_scores.max(axis=-1) > max_std_from_mean]`
grave frost
is there any way to feed numpy arrays to the model.fit() training function in batches?
I have a numpy array, but it is just too big to be fed in one go and causes and OOM error. So, is there a way to pass the arrays as normal variables in model.fit(arr_1, arr_2) while still retaining batches yet not using anything like tf.dataset or somthing
 sweet cargo
Hello, i am fairly new to python and i am interested in learning machine learning and or ai development. if anyone knows how i can start please let me know. Thank you.
grave frost
I would highly recommend the Google ML crash course. It is full of interactive graphs and let's you play around and understand topic intuitively. Since it is for beginners, it would build up your knowledge from scratch
ruby glade
Hey, I'm going to try to ask again :D
how do we iterate through the features and how to iterate through the data points when feeding it into a reg.fit()? *(reg = LinearRegression(fit_intercept=False))
for r in range(max_r):
    reg = LinearRegression(fit_intercept=False)
    reg = reg.fit(X[:,r], y) #I tried to iterate through features, didn't work
    #Extra note: I tried reg.fit(X[r], y) for the data points, didn't work
    y_pred = reg.predict(X)
    linreg_error[r] = mean_squared_error(y, y_pred)
fig, ax = plt.subplots(1,3, sharey=True)
sns.barplot(x='Year', y='Case Date Time', data=df_year, ci="sd", ax=axes[0])
Is giving me the following issue with Seaborn but I dont understand why
NameError: name 'axes' is not defined
 uncut shadow
Well, it looks like It's not about seaborn, but rather you just didn't define axes variable
uncut shadow
👍
thick turret
@uncut shadow do you mind if I ask another question
was able to get the code running, but wanted to make it so that I have a 3 x 3 grid, with each line having 2 plots, 1 taking 2horizontal spaces, and then a smaller one
I tried using ax=ax[0,:1]
but it wont work for me and gives the following error
AttributeError: 'numpy.ndarray' object has no attribute 'bar'
@uncut shadow this is what it looks like
fig, ax = plt.subplots(3,3, sharey=True)
sns.barplot(x='Year', y='Case Date Time', data=df_year, ci="sd", ax=ax[0,1])```I thought putting the ax=ax[0,:1]
would do it but no luck
grave frost
I think there is a problem arising in the loss function I am using. Since I am trying to make a seq2seq model, I was using the categorical_crossentropy loss for it, but I think I am using the wrong one. Can anyone advise me on which loss to use for sequence2sequence problems?
rustic apex
Is this a “way” to follow? Or what type of model is this?
odd yoke
it just shows that numpy can operate on anything that implements the array protocol
including dask, cupy, etc
rustic apex
@odd yoke ok, so there isn’t a full-reference to match things up, like that?
lapis sequoia
Unsure whether this is the correct channel for this question but
Can I stream a js file to my python script? So I have a .js file which launches a websocket connection, which will be streaming data out of it. Can I have it stream that data to my python script?
I found that u can call .js scripts from python files but that is rather a one-time execution instead of an actual stream of data?
 kindred ridge
Hi guys, is it ok with pandas questions here?
I got a dataset, with some timestamps = 25:02:20
When I use
df['Time'] = pd.to_datetime(df['Time'],format= '%H:%M:%S' ).dt.time
it raises a valueError, so my plan is to change all values over 23:59:59 to the next day ( 25:02:20 = 01:02:20 ) and add one day to the date (wich is in a second cell)
I can't find a good way to do this. Any tips?
Seems like I can do it with a for loop like this:
for times in df['time']:
if times[:2]=="24":
times = "00:"+times[3:]
And then I only need to find the connected date cell..
Edit: Didnt work 😦
Edit 2 (last for tonight)
for i, row in df.iterrows():
if row['time'][:2]=="24":
df.at[i,'time'] = "00:"+row['time'][3:]
works :D..
 gray phoenix
Hi,
I have a question in regards to pandas. I've look on SO, it looks like I would have to incorporate io.open. I just don't know how I would add that to my line of code
Error Code:
UnicodeDecodeError: 'utf-8' codec can't decode byte 0xf3 in position 6: invalid continuation byte
`
def create_book():
global book_df
book_path = r'PATH'
book_files = glob.glob(book_path + "/*.csv")
li_book = []
for filename in book_files:
book_df = pd.read_csv(filename, index_col=None, header=0)
li_book.append(book_df)
book_frame = pd.concat(li_book, axis=0, ignore_index=True)
`
Disregard that I sorted the issue.
For anyone that was curious.
'
for filename in book_files:
book_df = pd.read_csv(filename, index_col=None, header=0, engine='python'
)
li_book.append(book_df)
'
velvet thorn
@kindred ridge I wouldn’t recommend that
in general, for loops in pandas are not good for you
desert oar
it's not bad to loop over files and concat them
i think that's correct
@gray phoenix it looks like the files are not UTF-8 encoded. was it emitted from Excel? if so you probably need to pass encoding='windows-1252' to pd.read_csv
velvet thorn
it's not bad to loop over files and concat them
@desert oar yup, fair enough
but they were looping over a DF
I was replying to the previous person
I didn't read the code not in a codeblock
desert oar
ah
 dire acorn
Anyone in hear have time for a quick chat?
 slender nymph
rustic apex
slender nymph
rustic apex
What libraries should you learn “in order”? I’m using Numpy and Pandas right now
desert oar
@rustic apex start there. scikit-learn is nice
austere swift
So I'm using grayscale images with a DenseNet201 model from torch hub and I modified the output classes and the input channels to match my data but I still get the error saying the channels don't match
model = torch.hub.load('pytorch/vision:v0.6.0', 'densenet201', pretrained=False)
model.features[0].in_channels = 1
model.classifier.out_features = 15
thats the code that modifies the model
and I get this error
RuntimeError: Given groups=1, weight of size [64, 3, 7, 7], expected input[1, 1, 128, 128] to have 3 channels, but got 1 channels instead
so it seems like it didn't modify the model, but I'm not sure why
when I do it in a python interactive shell it works
well i didnt try training it in interactive but it modifies the model fine
!e
import torch
model = torch.hub.load('pytorch/vision:v0.6.0', 'densenet201', pretrained=False)
print("Before changing:", model.features[0])
model.features[0].in_channels = 1
print("After changing:", model.features[0])
 arctic wedgeBOT
You are not allowed to use that command here. Please use the #bot-commands channel instead.
austere swift
the bot doesnt have torch so it wouldnt work either way but anyways yeah idk the issue
dire acorn
@rustic apex I prefer sns it is really good at vizuals
Does anyone have any thoughts on working with categorical data?
cedar sky
What do you guys think is better tensorflow 2.0(including keras) or pytorch
Does anyone have any thoughts on working with categorical data?
@dire acorn I am not sure abt it
dire acorn
@cedar sky I have not worked in that lib
I know i need to but man
then i have to read the wiki
and figure it out and stuff
austere swift
@cedar sky it depends on the use case lol
keras is really easy to use for like beginners and stuff but isnt very good for large datasets
pytorch is faster tho since it uses a lower level api
dire acorn
^
austere swift
I personally use both depending on the application
If i'm just experimenting with something and messing around and its not very complicated I use keras but when I wanna do an actual project I use pytorch
dire acorn
i am a noob and have only used pytorch lol
austere swift
if you know pytorch at all youre not a noob lol
pytorch is pretty complicated to understand
dire acorn
im cheating pycharm auto completes lol
austere swift
I started out like 2 or 3 years ago with keras then when my projects became more complex i started learning pytorch
I still never learned basic tensorflow w/o keras
dire acorn
plus I still get messed up when it comes to creating projects.
for me I find analyzing data easier than creating things
austere swift
the main things I get messed up on is stuff with array and tensor shapes though
austere swift
the one thing i dont understand is why cant everybody use the same format, channels first or channels last
pytorch uses first and keras uses last so whenever i create numpy arrays with the data I have to convert if i wanna test each one out
dire acorn
but that would make sense next your going to ask people to actually create good documentation
austere swift
documentation I'm fine with lol
dire acorn
haha well you give me hope as I learn more 🙂
austere swift
I usually just mess with it until it works somehow
and then see what I did wrong originally
dire acorn
I hope to do well in a kaggle comp but I always get nerves when I start it
austere swift
I've never really done any kaggle comps or anything
I entered in once and never did it
dire acorn
really everyone I have talked to away from this discord is like do it!
but I find it hard to begin
austere swift
I like making up my own projects and just fucking around with it until it works, you can learn a lot by just messing with the code
dire acorn
haha that is true
austere swift
the only things that really aggravate me is when there are errors that either make absolutely no sense or have a really weird solution
i.e cuda errors
austere swift
sure
dire acorn
i have created a pdf merger and text extractor the text is printed out to the console. But I can't figure out how to assign the console text to a csv file. Which I want to pull and create a data frame from
austere swift
code?
dire acorn
sure one sec
from pdfminer3.layout import LAParams, LTTextBox
from pdfminer3.pdfpage import PDFPage
from pdfminer3.pdfinterp import PDFResourceManager
from pdfminer3.pdfinterp import PDFPageInterpreter
from pdfminer3.converter import PDFPageAggregator
from pdfminer3.converter import TextConverter
import io
import pandas as pd
import PyPDF2
from PyPDF2 import PdfFileMerger, PdfFileReader
import pandas as pd
import numpy as np
import csv
import sys
class Transform:
    # method for extracting data and merging it into one pdf

    def __init__(self):
        try:
            source_dir = os.getcwd()
            merger = PdfFileMerger()
            for item in os.listdir(source_dir):
                if item.endswith("pdf"):
                    merger.append(item)
        except Exception:
            print("unable to collect")
        finally:
            merger.write("test.pdf")
            merger.close()

#running that method extract
    def extract(self):
        resource_manager = PDFResourceManager()
        file = io.StringIO()
        converter = TextConverter(resource_manager, file, laparams=LAParams())
        page_interpreter = PDFPageInterpreter(resource_manager, converter)

        with open('test.pdf', 'rb') as fh:
            for page in PDFPage.get_pages(fh,
                                          caching=True,
                                          check_extractable=True):
                page_interpreter.process_page(page)

            text = file.getvalue()

        # close open handles
        converter.close()
        file.close()


        return text


    def savecsv(self, text):
        sys.stdout= open("text.csv","w")
        print(text)
        sys.stdout.close()


print(Transform.extract().savecsv())
#
# class textsave:
#     def df(self, text):
#         sys.stdout = open("extracted.csv", "wb")
#         sys.stdout.close()
#
# print(Transform.df())
I'm making an App to deploy model in .tflite format but the model failed. It ran while I tested it in Python, so is it possible that the image dimension I'm passing the model (which includes a batch dimension) is causing the problem?
It was trained with tf image data generators, but the image im passing it on the app doesnt have batch dimension. Its the only thing i can think of atm
kindred ridge
@velvet thorn Iv read that looping in pandas are bad, so I tried to avoid that, but can't seem to find a good alternative. Its slow as hell ( like 3secs for that operation on 4 rows ) but it works.. Im open to suggestions on how to do it correct 😄
lapis sequoia
Unhandled Exception: PlatformException(Failed to run model, Attempt to invoke virtual method 'org.tensorflow.lite.Tensor org.tensorflow.lite.Interpreter.getInputTensor(int)' on a null object reference, java.lang.NullPointerException: Attempt to invoke virtual method 'org.tensorflow.lite.Tensor org.tensorflow.lite.Interpreter.getInputTensor(int)' on a null object reference
this is the error I'm getting
grave frost
@lapis sequoia Just Google it
lapis sequoia
wasnt much help obviously
i found mainly errors and solutions in Java
but I'm using Flutter/Dart
grave frost
well, the only person most qualified to answer this is a person who is both into ML and Webops. I recommend you post it on S.O if you can't find the answer
Anyone here who might have worked on TPU's /XLA?
lapis sequoia
TPUs yes
cedar sky
Hi guys do you have any ideas abt the tensorflow: Data and Deployment Specialization(https://www.coursera.org/specializations/tensorflow-data-and-deployment)...
If yes, please share your thoughts abt it

Coursera
3,000+ courses from schools like Stanford and Yale - no application required. Build career skills in data science, computer science, business, and more.
lapis sequoia
Installed Anaconda on my new Mac. Running “conda info” shows command not found. What is there problem here?
Anaconda navigator to be specific
 knotty warren
Hello, I'm trying to pack elements of a numpy array two by two in tuples : python print(array) array = pack2By2(array) print(array)
would give ```
[ 1, 2, 3, 4, 5, 6, 7]
[ (1,2), (3,4), (4,6), (7,nan)]
or
[ (1,2), (3,4), (4,6), 7]
I could implement the function pack2By2 but maybe it already exists? dense knot
Guys, how does parallel coordinate visualization work?
velvet thorn
Hello, I'm trying to pack elements of a numpy array two by two in tuples :
python print(array) array = pack2By2(array) print(array)would give ```
[ 1, 2, 3, 4, 5, 6, 7]
[ (1,2), (3,4), (4,6), (7,nan)]
or
[ (1,2), (3,4), (4,6), 7]I could implement the function pack2By2 but maybe it already exists?
@knotty warren ...so you want an array containing tuples?
knotty warren
Yep
limpid oak
I'm interested @lapis sequoia
lapis sequoia
No AI channel?
 spark stag
you can talk about AI here, thats within the topic of this channel
 short mist
Hey y'all I got a question and I'm not sure if it fits here or elsewhere but I got a feeling it might fit here?
I also can't find python help: available
I just need someone to help me create and derive splines on python and then output those derivations... I found some online guides that might help but I'm having trouble trying to figure out how to implement it into our class's data and just would like some clarification/someone to talk it through with
So uh... @ or DM me
And if this isn't the right channel, direct me to it cuz I literally can't find python help: available
cedar sky
@lapis sequoia share the link I will try to join
 fathom summit
Question with cv, it's more math/grouping/general programming, but I use cv:
I've never used .ravel(), so I'm not too sure how to pull out the peaks from here
fathom summit
Given a black and white image, let's say I have a range of 50-80. How can I manipulate the image where all pixels between the colour 50-80 stay the same, and the rest get converted to [255]
rustic apex
Can CSV be compiled into another format? Like how SASS compiles CSS?
 wispy canyon
probably not...
odd yoke
yes of course it can
you can represent a csv as a json where the header represent keys in an object with the rows being arrays
not that you should
rustic apex
@odd yoke I’m wanting to create a “order history” to show the activity, of a retail site. It would obviously be separate from the site, but it can show a trend and projection of sales
@odd yoke that is, creating a site with Django, and then having orders all recorded. So I can use it with Numpy/Pandas
 frail kindle
I have a question about workflow in Jupyter Notebooks. I have a project where I've scraped web data into a Pandas DF, but if I save the notebook and close out, I would need to re-run the scrape to get my DF info back. What I've been doing is saving the DF into a .csv and then just loading it back into the notebook after the scrape section. Is there a better way to keep a DF alive between exits/opens, so that I don't have multiple .to_csv / .read_csv sections throughout my notebook?
austere swift
Okay I fixed my issue from yesterday so for anybody curious for some reason modifying the in_channels of the conv layer didn't actually modify it so i just did model.features[0] = Conv2d(1, 64, kernel_size=(7, 7), stride=(2, 2), padding=(3, 3), bias=False) to replace the entire layer instead
well it did modify it but it just didnt work right for some reason
when i did print(model.features[0]) after modifying it it printed as if it was a single channel but still didn't work
@frail kindle I think the csv method is probably the best way if not the only way to do that, when you close the notebook it closes the kernel too so itll remove the df from memory so you can't really do that any other way
frail kindle
@austere swift Ah, thanks. Feels messy, but it's good to have some reassurance that it might just be the best I can do.
velvet thorn
Yep
@knotty warren ...why?
that’s not something one would normally do because it prevents you from taking advantage of the structure of arrays
austere swift
just ask your question
 rugged cairn
@austere swift I wanna use RL to solve discrete and continuous control problem. Which algorithm should I use?
 chilly blaze
What do I code if I'm into statistics/data?
austere swift
anybody know a good way to save pytorch models to .h5 files?
livid temple
Hi guys/gals, anyone have any tips on consolidating data? I have some data in a JSON format that i need to join with another data source. what is the best way to go about this? Would joining on pandas columns be a good way to go about this, or just dumping everything into postgres and querying via the shell?
ORM**
velvet thorn
Hi guys/gals, anyone have any tips on consolidating data? I have some data in a JSON format that i need to join with another data source. what is the best way to go about this? Would joining on pandas columns be a good way to go about this, or just dumping everything into postgres and querying via the shell?
@livid temple is it flat?
arctic wedgeBOT
Hey @lapis sequoia!
Uh-oh! It looks like your message got zapped by our spam filter. We currently don't allow .txt attachments, so here are some tips to help you travel safely:
• If you attempted to send a message longer than 2000 characters, try shortening your message to fit within the character limit or use a pasting service (see below)
• If you tried to show someone your code, you can use codeblocks
(run !code-blocks in #bot-commands for more information) or use a pasting service like:
lapis sequoia
Trainable params: 16,282,498
Non-trainable params: 1,152```

somebody help!help with what
lapis sequoia
my gpu is melting
lol i am making some mask detector can you help with that?
will it take more time?
velvet thorn
oh
lapis sequoia
with open cv
velvet thorn
so it's a classification problem
lapis sequoia
yeah
velvet thorn
go on
lapis sequoia
i used binary_crossentropy
lapis sequoia
the eta
velvet thorn
go on
lapis sequoia
will it break ?
velvet thorn
okay you're going to need to give a lot more details
such as:
- model architecture
- GPU model
- what you mean by "break"
lapis sequoia
from keras.layers import Dense,Conv2D,MaxPool2D,Flatten,Dropout,BatchNormalization
from keras.callbacks import EarlyStopping
from keras.optimizers import Adam
opt = Adam(learning_rate = learning_rate,decay = learning_rate/epochs)
early_stop = EarlyStopping(patience=2,monitor=['val_accuracy'])

model = Sequential()
model.add(Conv2D(64,kernel_size =(4,4),input_shape =(224,224,3),activation ='relu'))
model.add(MaxPool2D(pool_size =(2,2)))
model.add(Dropout(0.5))
model.add(BatchNormalization())
model.add(Conv2D(128,kernel_size =(4,4),activation ='relu'))
model.add(MaxPool2D(pool_size =(2,2)))
model.add(Dropout(0.5))
model.add(BatchNormalization())
model.add(Conv2D(384,kernel_size =(4,4),activation ='relu'))
model.add(MaxPool2D(pool_size =(2,2)))
model.add(Dropout(0.5))
model.add(BatchNormalization())
model.add(Flatten())
model.add(Dense(64,activation = 'relu'))
model.add(Dropout(0.5))
model.add(Dense(2,activation ='softmax'))
model.compile(optimizer =opt,loss='binary_crossentropy',metrics=['accuracy'])```it is fine ?
velvet thorn
where did you get this from
lapis sequoia
i made!
velvet thorn
uh.
lapis sequoia
why? any problem ?
velvet thorn
I don't think I helped you at all actually @lapis sequoia
but you're welcome 🙂
hope it goes well for you
 solid aurora
So if I use a dataset licensed under GPL2 (which doesn't have the clause "or any later version") to train a model used in my app, what licenses can I use on my code?
I assume GPL2 is for sure allowed?
I was hoping to make the code for the app AGPL3, is that legal?
I'm not sure if and how "data" counts for "derivative works" because once the model is trained it doesn't need the dataset, yet without the dataset the model can't be created
arctic wedgeBOT
Hey @mortal widget!
It looks like you tried to attach file type(s) that we do not allow (.csv). We currently allow the following file types: .3gp, .3g2, .avi, .bmp, .gif, .h264, .jpg, .jpeg, .mkv, .mov, .mp4, .mpeg, .mpg, .png, .tiff, .wmv, .svg, .psd, .ai, .aep, .xcf, .mp3, .wav, .ogg, .webm, .webp, .flac, .afdesign, .m4a.
Feel free to ask in #community-meta if you think this is a mistake.
 mortal widget
Guys, there is this data set in a ".csv" file. When converted to pandas data frame it looks normal, but if it is split into arrays it returns an array with string that contains all the data. What would be some ways of getting this data to a shape where it can be made to a standard pandas data frame that can be fed to a sci-kit learns' algorithm?
There is an example data set that behaves similarly to the expected and it does not appear it can be sent here. What has been tried so far is converting everything into a numpy array, then feeding that in, but it behaves very unexpectedly. Rephrasing of the question would be, how do you turn normal arrays into pandas data frame with labeled columns (provided all information is available)?
lapis sequoia
How does one actually remove Anaconda completely from mac?
alexanderberg@Alexanders-MacBook-Pro ~ % sudo rm -rf/opt/anaconda3
Password:
rm: illegal option -- /
usage: rm [-f | -i] [-dPRrvW] file ...
       unlink file
alexanderberg@Alexanders-MacBook-Pro ~ %
I followed the official guide from the Anaconda docs how to uninstall safely.
 pale thunder
missing space after rf, though I am not sure that deletes it
lapis sequoia
Oh, that worked, however then I get:
rm: /opt/anaconda3: Directory not empty
alexanderberg@Alexanders-MacBook-Pro ~ % ```I went to the folder location and the anaconda3 is empty however I still for some reason have the Anaconda Navigator left in the launchpad, what is happening?
All good, sorted it. Thanks!
lapis sequoia
what are some common reasons why my code runs on GPU but not TPU? I made sure that TPU gets initialised and connected and followed recent documentation on using TPUs
The errors have no search result, Even the one Stack Overflow question remotely resembling it has no answers
 eternal geyser
Is it possible to get latest dataset for google playstore apps ? I have an old dataset from kaggle.
grave frost
@lapis sequoia What lib are you using?
lapis sequoia
Tensorflow
keras
model runs fine if i remove strategy.scope() just TPU fucks it up for some reason
update is I disabled eager execution after reading docs, now im getting an Assertion Error but only one error instead of 9 like before
grave frost
Those 9 are actually just 1, repeated on each worker
lapis sequoia
yeah but how to resolve it tho, should i send the error here
grave frost
I myself had an error (and got only 2 hits for it). The only person who can help is someone who is a core dev in that stuff. Even then, feel free to post it here
I am getting loss: 0.0000e+00. Apparently, there is some gradient explosion. I tried making a few tweaks from online, but none of them work. Any suggestions?
Also, the model starts training from this loss, so somehow I doubt there is a gradient explosion
This is the model's summary:-
Pastebin
Pastebin.com is the number one paste tool since 2002. Pastebin is a website where you can store text online for a set period of time.
 thin sphinx
I am trying to use subplot to create imshow graphs of 175 gray scale images from the MNIST number recognition data.. I can successfully plot a small number of them, but for some reason the graphs start to lay on top of eachother when i loop over all 175 images. I tried using fig.tight_layout but no help
lapis sequoia
I want to analyze a banks funds on a quarterly basis between the years 2006 and 2015. Each txt file represents the data for every quarter of respective year but I wonder how I could concatenate them so that for example the each quarter of 2006 is appended to for example df_2006 then do that for each year?
I have the example in R but would like to do it in Python
grave frost
Does anybody know how to make a model consider it's loss by using the validation accuracy? Like I want to make my model not to consider improving by not judging the loss, rather by the validation accuracy. Is this possible to implement?
eternal geyser
Is there a way to get quickly 10,000 app's names in the google play store. So far I have found AppBrain which has a limit of 50.
lapis sequoia
Anyone know how to make a bar graph that is stacked without using matplotlib
austere swift
why not matplotlib?
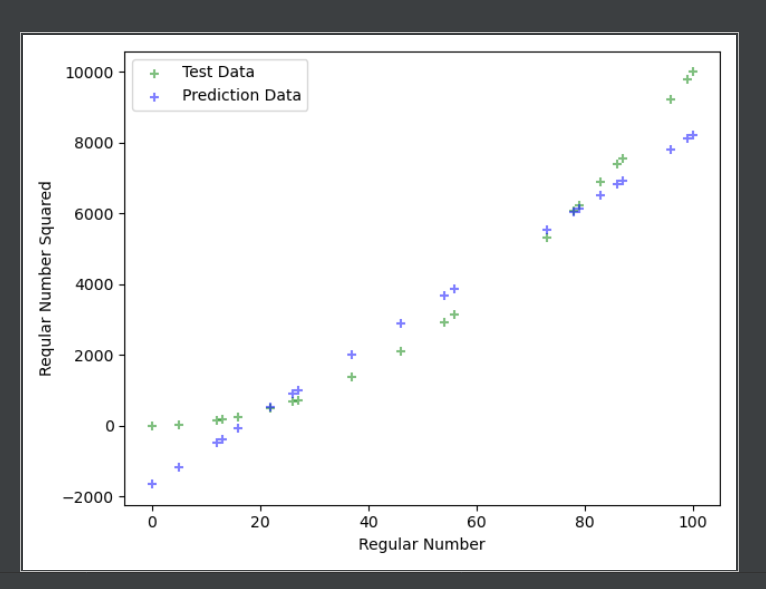
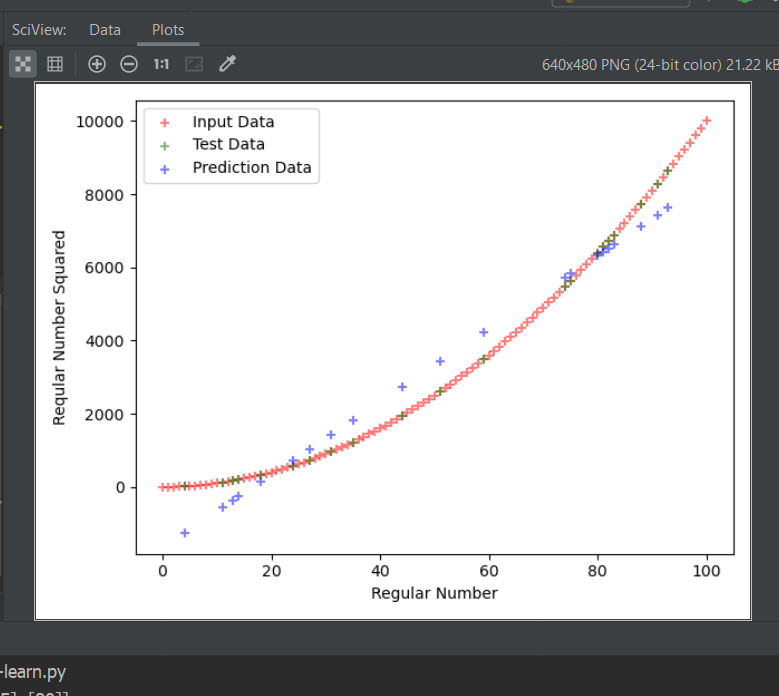 lapis sequoia
He said I can't use programs but
There is a graphics.py thing
Do you want me to send it to you
Keep in mind i'm using wing
 earnest forge
Is there more convenient and compact way to plot histogram with strict y-axis boundaries of maximum value?
i've come up only with that:
arr = np.random.randn(1000)
fig = plt.figure()
sad = fig.add_axes([0,0,1,1])
qoqo = sad.hist(arr)
y, x, _ = plt.hist(arr)
sad.set_ylim([0, y.max()])
@austere swift want me to dm you it?
😢
"The stacked bar graphs are made of rectangles. You need to come up with formulas for the coordinates of this rectangles."
 ruby kraken
Hey guys,
I am currently looking for a new Laptop for studying and programming. As I want to get started with machine learning I was wondering whether there are any requirements that i forgot about and that could prevent effective training of my neuronal networks.
My current requirements for the new Laptop are:
- a nividia Graphicscard for running Cuda. Current favorite is the NVIDIA® GeForce RTX™ 2060 (6 GB GDDR6 dedicated). I am not to certain whether 6Gb dedicated are enough to load bigger neuronal networks...
- 16Gb of RAM, as I plan to run at least 2 VMs with different Distributions of Linux(most likely not simultaneously tho)
- 512 GB of SSD, I could imagine that this could be bottleneck if I have huge amounts of training data, but its hard to find a laptop within my budget that packs more than that
- Intel® Core™ i7-10750H with 6 cores, a base frequency of 2.6 GHz and a boost frequency of up to 5 GHz. If ive done my research correctly this one isnt too important for the AI thing but the high boost frequency comes in handy when compiling normal programms
For Programming in General I mainly paid attention to an lightened keyboard with a deep keytravel and a display that is both bright and at least 15.6 Inches
Im aware that is quite likely that in case I'll get totally into machine learning that this is hardly ever going to be enough and will then have to do the training via external services.
However I want to get into it by doing the training locally and see where things are going.
I Would be glad if you could let me know whether I forgot something or if those components are an absolute overkill
austere swift
about how much is your budget for it?
ruby kraken
initially i was looking for something around 1k but my current favorite is around 1510
- €
austere swift
what country?
ruby kraken
germany
austere swift
yeah you probably wouldnt be able to get those specs for 1k anyways
which one were you looking at thats 1510?
ruby kraken
Der ultradünne, ultraleichte und unglaublich kraftvolle OMEN 15 Laptop beweist, dass Spitzen-Performance gar nicht viel Platz braucht. Mit leistungsstarker NVIDIA Grafik, überwältigender Prozessor-...
only drawback that i could figure out about that one was the relatively low runtime
austere swift
yeah if youre gonna be training machine learning stuff youd probably want something thats good for being on a lot of the time
ruby kraken
well i can just plug it in over night to train
austere swift
yeah i think that one is fine
ruby kraken
ok thanks mate
austere swift
a lot of laptops have really bad coolers that start to overheat if left for a while but that one seems to have a decent cooler
ruby kraken
ok good to know, as i dont have any idea what to look for concerning cooling
austere swift
yeah the main thing is a lot of laptops have their vents on the bottom which restricts a lot of the airflow, its fine for normal use but under load it can heat up a lot
I obviously can't really like know how good of a cooler it is just by looking at it but since it has most of the vents on the sides and back it seems like it wouldn't have that issue
ruby kraken
makes sense yeah
tidal sonnet
How is this linearly dependent??????????/
under what condition??
Could it be it only has to match in at least 1 case to be considered linearly dependent?
 strong field
Saint: There are constants k1 and k2 such that k1 * a + k2 * b = c. Therefore they're linearly dependent.
velvet thorn
Is there more convenient and compact way to plot histogram with strict y-axis boundaries of maximum value?
i've come up only with that:arr = np.random.randn(1000) fig = plt.figure() sad = fig.add_axes([0,0,1,1]) qoqo = sad.hist(arr) y, x, _ = plt.hist(arr) sad.set_ylim([0, y.max()])
@earnest forge what do you mean?
or rather, what's wrong with what you did?
 gaunt roost
quick question, Im new to data science but in order to use the pandas and matplotlib libraries do I NEED to use Jupyter Notebook or can I just use a file and direct the output to the command line or a file (if its a graph or something like that)
velvet thorn
quick question, Im new to data science but in order to use the pandas and matplotlib libraries do I NEED to use Jupyter Notebook or can I just use a file and direct the output to the command line or a file (if its a graph or something like that)
@gaunt roost no and yes, in that order
gaunt roost
@velvet thorn thanks my dude
solid aurora
OpenCV is a much underappreciated tool
it really needs a round of applause!
it saved my ass yet again today
deft harbor
golf clap
lapis sequoia
yo does anyone have experience with GANs
im having trouble writing a fit function
im not sure how to go about it
gonna post a pastebin of my code
Pastebin
Pastebin.com is the number one paste tool since 2002. Pastebin is a website where you can store text online for a set period of time.
tried following the tensorflow tutorials nothing makes sense to me
hasty grail
The TensorFlow tutorial already has code for the train_step function, have you tried that?
deft harbor
Is that what you are working from?
Wow, just searched dcgan tutorial to see if I could find something else to help. A lot of medium post out there with horrible results.
lapis sequoia
my thing is similar but ive tried using the train step function from the pix2pix and the DCGAN tutorial and neither seem to work
i only kinda used it as a loose basis for how to build the model, but my model structure is different and my model is somewhat different to both of those models in that it takes an image input and tries to reconstruct it
in principle its similar to pix2pix but it isnt the same and the pix2pix function doesnt work with mine
apparently i had to change my file types and shit
im so confused cos essentially all im doing is unloading randomised numpy arrays that were the image and then feeding that into it
but i feel like im hitting my head on a brick wall trying to figure this out i just have no bloody clue as to what i should do
hasty grail
Can you post your code with the custom function?
lapis sequoia
its not custom haha its the same as the pix2pix one
i can paste what i used before tho
hasty grail
can you paste the entire model building + training code in the same pastebin?
lapis sequoia
on it
@hasty grail https://pastebin.com/0tjCWsxc
Pastebin
Pastebin.com is the number one paste tool since 2002. Pastebin is a website where you can store text online for a set period of time.
hasty grail
btw what is the problem you're running into?
Your generate_images function seems to be only for demo purposes, and as such shouldn't have training=True
 steel hatch
complete noob to data sci and matplotlib. can someone point me in the right direction in getting a heatmap working from coordinates?
i am trying to overlay the heatmap over a base image to use for a project of mine. trying to accomplish something like this:
 ripe forge
I think your searches on this matter may improve if you avoid using the term heat map for this
Even though logically I understand you, heatmap is used for something else. Try the phrase "geo plots"
steel hatch
thank you, i appreciate your help.
ripe forge
No worries! There's also a formal term for something similar called chloropleth
You may be able to repurpose geopandas + ggplot or something similar to achieve the actual plotting
lapis sequoia
@hasty grail sorry i was just out at the time, i can get rid of the generate images function i just wanted to see how it worked without training but when i run the training function it doesnt work
i would get this
<ipython-input-24-608d75c738e2> in <module>()
----> 1 fit(g_in, EPOCHS, t_in)

<ipython-input-22-f1b391f94ac8> in fit(train_ds, epochs, test_ds)
      6         display.clear_output(wait=True)
      7
----> 8     for example_input, example_target in test_ds.take(1):
      9         generate_images(generator, example_input, example_target)
     10         print("Epoch: ", epoch)```

TypeError: 'numpy.float64' object is not iterableumm can you print out example_input and example_target?
actually wait it's test_ds that is the problem
lapis sequoia
yeah
hasty grail
I don't see your test_dataset being defined anywhere
lapis sequoia
idk if its a problem with how im loading and saving my data (im using sentdex's method but using h5py instead of pickle
hasty grail
can you print out its elements?
lapis sequoia
t_in = test_in.get('images')
t_in = (np.array(t_in,dtype='float32')-127.5)/127.5```ok then what is test_ds?
lapis sequoia
i just copied and pasted the stuff directly from the pix2pix site, but when i was using it in my model it was t_in
like i changed it
i got rid of it like today cos it wasnt working
hasty grail
make sure your dataset is working properly first
lapis sequoia
like my train function
yeah ive been able to unload my data and print out images with matplotlib
hasty grail
ok, then how did you convert it into a TF dataset?
lapis sequoia
g_inps = tf.data.Dataset.from_tensor_slices((g_x_in, g_y_in))
but that doesnt work
idk if thats the problem or if i should make a new training function im not sure whats easier
would loading in my images as an npz file be better?
hasty grail
ahh that might be the issue
can you iterate through g_inps and see if the outputs are correct?
do the same for your test dataset
lapis sequoia
sorry not sure what you mean
hasty grail
for x, y in g_inps:
    print(x, y)
    break
oh sure
[[[0]
  [0]
  [0]
  ...
  [0]
  [0]
  [0]]

 [[0]
  [0]
  [0]
  ...
  [0]
  [0]
  [0]]

 [[0]
  [0]
  [0]
  ...
  [0]
  [0]
  [0]]

 ...

 [[0]
  [0]
  [0]
  ...
  [0]
  [0]
  [0]]

 [[0]
  [0]
  [0]
  ...
  [0]
  [0]
  [0]]

 [[0]
  [0]
  [0]
  ...
  [0]
  [0]
[0]]], shape=(256, 256, 1), dtype=uint8) tf.Tensor(6, shape=(), dtype=int32)```and for test input i get
     14
---> 15 for x, y in t_in:
     16     print(x, y)
     17     break

ValueError: too many values to unpack (expected 2)```your test dataset is incorrect then
lapis sequoia
i just changed it to basically the same thing
and got similar results
t_x_in = test_in.get('images')
t_y_in = test_in.get('labels')
t_in = tf.data.Dataset.from_tensor_slices((t_x_in, t_y_in))

for x, y in t_in:
    print(x, y)
break```do you think running my code now will work?
 lime ocean
Does anybody know how I can make a list of pixels contained by each cell in this plot?
it's a voronoi plot using scipy.spatial
I have written two voronai generator algorithms but they are too slow for any practical purposes
import math
import random
from PIL import Image

def distance(x1, y1, x2, y2):
    return math.hypot(x2 - x1, y2 - y1)

# define the size of the x and y bounds
screen_width = 1260
screen_height = 1260

# define the number of points that should be used
number_of_points = 16

# randomly generate a list of n points within the given x and y bounds
point_x_coordinates = random.sample(range(0, screen_width), number_of_points)
point_y_coordinates = random.sample(range(0, screen_height), number_of_points)
points = list(zip(point_x_coordinates, point_y_coordinates))

# each point needs to have a corresponding list of pixels
point_pixels = []
for i in range(len(points)):
    point_pixels.append([])

# for each pixel within bounds, determine which point it is closest to and add it to the corresponding list in point_pixels
for pixel_y_coordinate in range(screen_height):
    for pixel_x_coordinate in  range(screen_width):
        distance_to_closest_point = float('inf')
        closest_point_index = 1

        for point_index, point in enumerate(points):
            distance_to_point = distance(pixel_x_coordinate, pixel_y_coordinate, point[0], point[1])
            if(distance_to_point < distance_to_closest_point):
                closest_point_index = point_index
                distance_to_closest_point = distance_to_point

        point_pixels[closest_point_index].append((pixel_x_coordinate, pixel_y_coordinate))

# each point needs to have a corresponding centroid
point_pixels_centroid = []

for pixel_group in point_pixels:
    x_sum = 0
    y_sum = 0
    for pixel in pixel_group:
        x_sum += pixel[0]
        y_sum += pixel[1]

    x_average = x_sum / len(pixel_group)
    y_average = y_sum / len(pixel_group)

    point_pixels_centroid.append((round(x_average), round(y_average)))
# display the resulting voronoi diagram
display_voronoi = Image.new("RGB", (screen_width, screen_height), "white")
for pixel_group in point_pixels:
    rgb = random.sample(range(0, 255), 3)
    for pixel in pixel_group:
        display_voronoi.putpixel( pixel, (rgb[0], rgb[1], rgb[2], 255) )

for centroid in point_pixels_centroid:
    print(centroid)
    display_voronoi.putpixel( centroid, (1, 1, 1, 255) )

display_voronoi.show()
because my algorithm does 1260*1260*16 distance calculations for just 16 points, let alone 5000 points
but scipy.spatial Voronai works great for generating a plot with 5000 points
the main issue is that I can't convert the plot into pixel lists
I am trying to get pixel lists for each node so I can use them with pillow to calculate the average shade of all pixels within the node area
so I can generate something like this
lapis sequoia
woah thats cool
hasty grail
@lapis sequoia idk, just try it yourself
 arctic vale
Hi
I've latest versions of JDK, H2o and Python installed on my laptop but during h2o model training, xgboost is unable to load. Can anybody help me in sorting it out ?
 merry ridge
I have a dataframe with a column of strings and I have a separate list of substrings. I know that each string in my column always contains exactly one of the substrings in my list and I'm trying to make a new column containing that unique substring but I'm having a lot of trouble figuring out how to do this.
I could do it in a really sloppy way by iterating through my data frame one row at a time, taking that string and comparing it to every item in my list of substrings, but I was hoping to apply this to all rows at once
desert oar
@merry ridge any time you want to iterate over rows, use .apply or .map instead
one option:
special_strings = [ ... ]

def get_special_substring(y):
    for s in special_strings:
        if s in y:
            return s

data['special_substring'] = data['content'].map(get_special_substring)
or with regex:
import re

special_strings = [ ... ]

special_pattern = '|'.join(map(re.escape, special_strings))
data['special_substring'] = data['content'].str.extract(special_pattern)
Thanks for the help. I was trying to do something like what you were doing in the first option but I was very far from the correct syntax
 cloud ledge
Hi all, I'm trying to create multiple heatmaps with different distributions of data, but I'm having a hard time making the data comaparable
For instance, because the distributions of data are different, the color scales on the heatmaps are different
Even if I normalize using population max/min
lapis sequoia
Which IDE do you all use for data science?
grave frost
Is there any way to have a model judge it's performance by val_accuracy rather than the loss? So for training it would ignore the loss and would only work towards increasing the validation accuracy
...trained using cross-entropy loss. At each step, the network produces a probability distribution over possible next tokens. This distribution is penalized from being different from the true distribution..
So for RNN's, cross-entropy works fine since it would basically be doing multi-class prediction on each timestep. However, if my architecture produces a whole output at once (not token-by-token like RNN) then which loss would I have to use in that case? I couldn't find that specific loss, so I wanted the model to be penalized if even a single character is out of place
Therefore, a model that trains by maximising the validation accuracy.
 modern hatch
@lapis sequoia VS Code is great
@grave frost I don't know what you're doing, but have you looked into CTC loss
grave frost
Does seem to be promising, I will surely look into it
Basically I am trying to do sequence2sequence where I give my model a input and output and then the model has to learn the relation between them both
modern hatch
OK, yeah CTC might be relevant, it's commonly used in speech recognition
or it was last year when I was looking into it, things move fast
grave frost
It sure does in ML 🙂 I was thinking that relu was the most popular A-function in the place, but apparently even that has been overtaken by swish in many cases.
modern hatch
yeah activation functions can be hard to keep up with
I routinely come across versions I've never heard of
but at the same time there's still a lot of papers that use relu
grave frost
@modern hatch A small question - in the ctc_loss there is mention of something called frames in the logits argument (https://www.tensorflow.org/api_docs/python/tf/nn/ctc_loss) could you give a clue about what it is supposed to be?
 silver lion
has anyone used statistics stuff - to help design hardware - example occurances of byte , word , long usage and speed optomizations
desert oar
im sure it can be done. are you talking about taking physical measurements (or running simulations) and doing statistical analyses on the data? or are you talking about designing hardware that can make statistical inferences while it's running, for runtime optimizations?
modern hatch
@modern hatch A small question - in the
ctc_lossthere is mention of something calledframesin the logits argument (https://www.tensorflow.org/api_docs/python/tf/nn/ctc_loss) could you give a clue about what it is supposed to be?
@grave frost I think it's just the number of time steps? The documentation is really bad
grave frost
@modern hatch Would you happen to know any other such loss function that is much easier to implement?
"number of time steps" so like the length of the input sequence?
modern hatch
From the documentation page I think it's more like the longest input sequence you're going to use
and then the logit_length parameter tells the function how many you're actually using for that sequence
wait maybe not
yeah something is inconsistent here
grave frost
My each input sequence is list. Seems a bit ambiguos for that
modern hatch
Logits parameter description is: tensor of shape [frames, batch_size, num_labels], if logits_time_major == False, shape is [batch_size, frames, num_labels].
logits_time_major description is: (optional) If True (default), logits is shaped [time, batch, logits]. If False, shape is [batch, time, logits]
so apparently frames = time
it's the logit_length parameter that is getting me because "tensor of shape [batch_size] Length of input sequence in logits. " is ambiguous to me
is that the length of the input sequence you're actually using - but as measured in logits instead of time steps?
so time_steps * n_classes?
haha sorry to point you to such a complicated loss - it might not be nessary if you don't have a potential many-to-one relationship between your sequence and the label sequence
grave frost
My single input sequence is a list of 40 element, and there would be 16 classes from RNN pov. so would logits == 40*16?
No, there is no "many-to-1" relationship 🙂
modern hatch
so your network output is a full 40x16 matrix?
grave frost
no sense of time in my model, it is not an RNN
It would make an output in 1 go. RNN's generate per-character
modern hatch
why is it a sequence if there's no sense of time
grave frost
Why would I need sense of time to predict some other sequence?
modern hatch
by sense of time I just mean that you'd expect more correlation between step 2 and step 3 than step 2 and step 35
or at the very least some dependency of later steps on earlier steps
grave frost
Uh-Oh. There is no correlation between the characters in output sequence/ or dependency
My attempt is to find a relationship between the input and output sequences and to determine if it even exists. So I guess I could go with that approach for now
modern hatch
like an edit distance?
or a multi-label setting maybe
given the input sequence, what is the probability of seeing each character in the output?
overall though it sounds like you're going to have a hard time getting anything you can be sure about
DL is fantastic at finding spurious correlations
so if you're looking to ask "is there correlation here" you're going to get a lot of "yes" that doesn't mean anything
grave frost
Well, the main thing I want is not correlation, but for the model to predict correctly on test data, right?
As long as it gets a good accuracy, I am happy
But the problem is all in the loss
modern hatch
DL models can fit random permutations of labels on image data
modern hatch
that's exactly the point - fitting random labels means that even when the images are labeled randomly, the models learn features that correlate with the nonsense classes
grave frost
But that's a pro for DL right? I don't get what you are driving at
modern hatch
Just saying be careful with
My attempt is to find a relationship between the input and output sequences and to determine if it even exists.
because there could be only a spurious relationship
grave frost
I don't see the harm in a spurious relationship, as long as it actually performs well
Perhaps the spurious relationship might be a vulnerability of the said sequence that model was able to find?
modern hatch
a vulnerability?
grave frost
Well, let's leave that for time being. So is there way to make ctc_losswork with this? Like if it is theoretically possible, then only would it make sense to invest time and effort in it
modern hatch
to the degree I have any idea what's going on here, no
grave frost
Well, my attempt is to decode encrypted an hash and derive plaintext from it as a basic POC
modern hatch
if there is no temporal correlation or many-to-one relationship in the output then CTC probably isn't a good idea
you're trying to predict plaintext from cyphertext?
grave frost
Yes, in a nutshell
modern hatch
for what kind of algorithm? I can't imagine that would work for anything considered secure
desert oar
theyve been working on this for a while
grave frost
No, it isn't designed to work
theyve been working on this for a while
@desert oar A bit of an understatement since I have written over the model thrice by now, after trying every input pipeline ever 🙂 sad thing not to understand everything
I am using a simple architecture with Dense layers. It does seem to me that model will produce output like an RNN does but I am not sure
Rather, consider “edit distance”, the minimum number ofchanges (insertions, substitutions, deletions) required to reconstruct the ground truth from the output.
This seems a bit redundant for my problem. The only other things I could find were:-
Embedding losses, discriminator networks ,n-gram losses
Any ideas for that perfect loss function?