#data-science-and-ml
1 messages · Page 249 of 1
 wintry sapphire
 oblique vine
no, 23 000 people on Python server, nobody knows about matplotlib, sorry
 fast bluff
lol smartass
oblique vine
ironic comment, but you asked for it :V
you are probably at the beginning of the road, so I will explain what I've learnt about asking questions:
Always ask as detailed and as technical question as you can, precisely what are you looking for, and make sure its not problem you can google in 1 minute, cause somebody will criticize you about that 😛
fast bluff
Normal help me dad
oblique vine
We're a large, friendly community focused around the Python programming language. Our community is open to those who wish to learn the language, as well as those looking to help others.
 serene scaffold
@wintry sapphire it's always best to ask your question right away. That way someone can see if they know the answer and get started answering it.
wintry sapphire
alright so
this is my current dataframe
I want to be able to make it look something similar to this
the return is the mean
and std is the volatiltiy
@serene scaffold @oblique vine
Hi can anyone help me with this too
I dont get why my
like htis
 modest rune
Regarding this:
np.column_stack((np.ones(len(s)), s*d, (s*d)**2, (s*d)**3, s, s**2, s**3, s**4, s**5, d, d**2, d**3, d**4, d**5))
I would like to do something like this:
parameters = (np.ones(len(s)), s*d, (s*d)**2, (s*d)**3, s, s**2, s**3, s**4, s**5, d, d**2, d**3, d**4, d**5)
np.column_stack(parameters)
I have a feeling there is a way to do that... I'm just drawing a blank.
If it is not clear what the problem is...
I think this:
parameters = (np.ones(len(s)), s*d, (s*d)**2, (s*d)**3, s, s**2, s**3, s**4, s**5, d, d**2, d**3, d**4, d**5)
will evaluate parameters immediately, but I don't want parameters to be evaluated until np.column_stack(parameters) is called.
The purpose is... I can define parameters once, and then as s and d change, I can reuse parameters without having to have (np.ones(len(s)), s*d, (s*d)**2, (s*d)**3, s, s**2, s**3, s**4, s**5, d, d**2, d**3, d**4, d**5) copy and pasted throughout my code.
AHA! I think eval() does what i need!
https://realpython.com/python-eval-function/

In this step-by-step tutorial, you'll learn how Python's eval() works and how to use it effectively in your programs. Additionally, you'll learn how to minimize the security risks associated to the use of eval().
It's like the python developers read my mind. But, they had to time travel to the future first.
 spark stag
you could also just have a function that takes s and d as args@modest rune
modest rune
@spark stag I am not following you... mind posting a couple line pseudocode explaining?
oh, I know what you mean
spark stag
well i just mean py def parameters(s, d): return (np.ones(len(s)), s*d, (s*d)**2, (s*d)**3, s, s**2, s**3, s**4, s**5, d, d**2, d**3, d**4, d**5) so you can just type parameters(s, d) whenever you want that tuple
modest rune
yeah.
I think I like eval better because I can do things like this:
s_exp = 's, s**2, s**3, s**4, s**5'
d_exp = 'd, d**2, d**3, d**4, d**5'
other_exp = 'np.ones(len(s)), s*d, (s*d)**2, (s*d)**3'
expression = '({}, {}, {})'.format(other_exp, s_exp, d_exp)
 lapis sequoia
hey y'all, this is probably some basic super basic pandas stuff, but maybe you take pity on my code and help:
df1 = pd.read_csv(f"btcusd.csv")
df1['datetime'] = pd.to_datetime(df1['Date'], format="%Y-%m-%d %I-%p")
for i in df_dict:
    df2 = df_dict[i]
    df2['datetime'] = pd.to_datetime(df2['created_utc'], unit='s')
    df2['datetime'] = pd.to_datetime(df2['datetime'], format="%Y-%m-%d %I-%p")
    df2['datetime'] = df2['datetime'].apply(lambda x: x.replace(minute=0, second=0, microsecond=0))
    merged = pd.merge(df1,df2,on='datetime', how='outer')
    merged.fillna(0,inplace=True)
    newscoredf=merged.groupby('datetime')[['score']].agg('sum')
    final = pd.concat([cdf.set_index('datetime')[['Open', 'Close']],newscoredf],axis=1)
what i am trying to achieve is have a final dataframe where all scores are mapped to the datetime of df1
but if loop through my df_dict and map to the final df, each df in the loop overwrites the final dataframe
there is probably some easy fix that i am too stupid for.... but in my defense it is already late here in germany...
 frigid hazel
I have a question. I have reference line a, with n-amount of tokens. I split this line into sets of 5 tokens, and then scan whether I can find these five tokens in another large text. Per line, I am taking about 11 seconds; which is quite long. There is no algorithm in place. I just split text into lists, and then do a substring match. I am not looking for actual code, but rather a direction as to where I can look to speed such a search.
lapis sequoia
@frigid hazel you could use the threading library to speed this up
frigid hazel
yes, I have been entertaining that idea
lapis sequoia
you assign a certain amount of workers (based on your hardware) a number of tokens. they search for the tokens in the text in parallel
frigid hazel
especially since I just experimented with Go, and saw its ability to do concurrent computations
lapis sequoia
so if you have 11 workers it would take 1 second all in all (roughly)
frigid hazel
hmmm
lapis sequoia
frigid hazel
noted, thanks
lapis sequoia
but you have to be careful if all workers write to the same variable
you should use something like mutex = Lock() from the threading library
frigid hazel
I was also thinking of maybe creating an index of the second text
where you could pre-emptively end up at the middle of the text
lapis sequoia
then the variable is locked for only one worker at a time and no stuff is overwritten
frigid hazel
rather then having to do the journey all the way up there (going per 5 tokens attempts at matching)
then the variable is locked for only one worker at a time and no stuff is overwritten
@lapis sequoia good tip
lapis sequoia
do you have any insight on my problem above?
i am not quite familiar with pandas. it is some basic issue...
frigid hazel
yeah, your Python code does not look terribly complicated were it not for the fact that I too have not used that lib
you are referring to
lapis sequoia
oh well... i'll figure it out. thanks though
may i ask what kind of project you are working on? it sounds interesting
are those word tokens you are searching for?
frigid hazel
yeah, it is basically to find the amount of citations of one work in another work
fast bluff
Please halppp
ts = ForeignExchange(key='secret',output_format='pandas')
avdf = ts.get_currency_exchange_intraday(from_symbol='USD',to_symbol='EUR',interval='1min',outputsize='compact')
#This returns a tuple which is the root of all my issues (I think)
avdf.drop(['open','high','low'])
#Returns "tuple object has no attribute drop"
#So I tried converting it into a list a few ways
df = list(avdf)
#This worked but I'm still having the same issue
df.drop(['open','high','low'])
#Returns "list object has no attribute drop"
#So I thought maybe it was because I had to directly link it to pandas. So I tried this
df = pd.DataFrame(ts.get_currency_exchange_intraday(from_symbol='USD',to_symbol='EUR',interval='1min',outputsize='compact'), columns=avdf.columns, index=avdf.index)
#But still no luck.. It returns "tuple has no object columns"
#Getting annoyed and it's probably a super easy fix so if anyone could help me out, that would be greatly appriciated :D
hey guys any ideas on how to merge the lower part with the upper part by date using pandas would be highly appreciated
lapis sequoia
How does one add a Label onto a barplot
like on the bar itself
 flat quest
yeah for sure no problem! @wild pine
Definitely, its likely theres many variations on or in the original paper. It looks like from the paper tho individuals organisms eventually get grouped into species and then only get culled within their species. It seems to have improved their accuracy significantly, so you might want to add speciation and cull within a specie rather than the whole population.
But that's adding another complexity, so try the simplest genetic algorithm first and then improve from there :D.
 granite python
Hey, I was given by my Uni department a simulator which uses scipy.stats.genlogistic and scipy.stats.johnsonsu to create two distributions and calls in the simulation .rvs() on the object each time it wants a random number from it.
Probably 80-90% of the simulation time is attributed to the .rvs() function. Is there a better / faster way to get a random number based on the distribution without having to pregenerate random numbers and pick from them?
 velvet thorn
How does one add a Label onto a barplot
like on the bar itself
@lapis sequoia.annotate
Hey, I was given by my Uni department a simulator which uses scipy.stats.genlogistic and scipy.stats.johnsonsu to create two distributions and calls in the simulation .rvs() on the object each time it wants a random number from it.
Probably 80-90% of the simulation time is attributed to the .rvs() function. Is there a better / faster way to get a random number based on the distribution without having to pregenerate random numbers and pick from them?
@granite python how many random numbers do you need
like a ballpark estimate
so let me get this straight
every time you need ONE random number youu call the .rvs method once?
granite python
@velvet thorn each simulation usually generates 28k of each for other functions which is why the .rvs() has such a heavy impact.
Yes, its being called for each time a random number is needed from either the genlogistic or johnsonsu distribution
velvet thorn
like
okay, sorry for asking again because I want to be perfectly clear
you call .rvs once for each random number?
i.e. the number of calls is equal to the number of numbers you use?
lapis sequoia
@velvet thorn got it thanks. Was able to get it done. I didn't know .annotate existed.
granite python
Yes, its being called each time a random one is needed.
So a specific example would be: For each event in the simulation a random disposition time is needed based on the hour (we actually have 24 different scipy.stats.genlogistic objects)
disposition_time[hour].rvs()```okay
rvs has a size parameter
do you use it?
it's vectorised so generating a large number of numbers at once is much more efficient
I'm guessing you don't
based on that description
granite python
I don't think it's being used, this is how it's being called.
velvet thorn
okay, then you should
you might need to add a bit of additional plumbing
to make sure the right distribution yields the right values
but the real quick profiling I did here
for genlogistic
a for loop generating 1000 values takes 40 ms
a single call with size=1000 takes 88 us
or ~50x less time
hm, if you use 10000 values the speedup becomes 100x
granite python
So basically I would call .rvs(size=1000) and save the array and then just go through that / pick randomly from it?
granite python
Awesome, thank you so much! Really appriciate it 🙂
 dense copper
hey guys, not sure if this is really a data science question but what would be the best way yall could think of to "uniquify" a list of dicts in Python? I posted a question in the #help-chestnut channel also but got some message about cooling down lol so I'm not sure if anyone can see it. It's the first message I sent in here so I'm not sure what I did wrong 😂 but if this is the wrong place and anyone feels like helping over there I'd be very grateful 🙂
velvet thorn
hey guys, not sure if this is really a data science question but what would be the best way yall could think of to "uniquify" a list of dicts in Python? I posted a question in the #help-chestnut channel also but got some message about cooling down lol so I'm not sure if anyone can see it. It's the first message I sent in here so I'm not sure what I did wrong 😂 but if this is the wrong place and anyone feels like helping over there I'd be very grateful 🙂
@dense copper what do you meanuniquify
like remove duplicates?
Awesome, thank you so much! Really appriciate it 🙂
@granite python no problem
dense copper
@velvet thorn yep, exactly. Take this for example:
[
  {'ownername': 'SERLET BERTRAND', 'officertitle': 'Senior Vice President'},
  {'ownername': 'SERLET BERTRAND', 'officertitle': 'Senior Vice President'},
  {'ownername': 'SERLET BERTRAND', 'officertitle': 'Senior Vice President'},
  {'ownername': 'RUBINSTEIN JONATHAN', 'officertitle': 'Senior Vice President'},
  {'ownername': 'RUBINSTEIN JONATHAN', 'officertitle': 'Senior Vice President'},
  {'ownername': 'RUBINSTEIN JONATHAN', 'officertitle': 'Senior Vice President'}
]```I'd basically want just one of each in the result
velvet thorn
hm
okay it depends on constraints
there is a naive but slow solution
that can be optimised depending on what constraints apply.
dense copper
yeah there are a few caveats.
one would be that there will always be the same keys, but some may be empty, and I would not want duplicate names
velvet thorn
what do you mean "duplicate names"
duplicates are determined by full equality, right
not by a subset of keys/values
dense copper
Hmm let me think about this actually. My gut reaction is to say I only want ONE name with its title, and other keys from the same dict
[
  {'ownername': 'SERLET BERTRAND', 'officertitle': 'Senior Vice President'},
  {'ownername': 'SERLET BERTRAND', 'officertitle': ''},
  {'ownername': 'SERLET BERTRAND', 'officertitle': 'Senior Vice President'},
  {'ownername': 'RUBINSTEIN JONATHAN', 'officertitle': ''},
  {'ownername': 'RUBINSTEIN JONATHAN', 'officertitle': 'Senior Vice President'},
  {'ownername': 'RUBINSTEIN JONATHAN', 'officertitle': 'Senior Vice President'}
]```
e.g. I would want the same result from this as from the abovemy 2nd reaction would be to say I want to effectively "squash" the dicts into a single "complete" one, but I'm not actually sure I'd want to do that now due to the nature of what I want the final result to be
velvet thorn
hm
you need to decide what you want first, I think
because the appropriate solution will vary
based on that.
dense copper
Ha, my ex GF said the same thing!
velvet thorn
😦
dense copper
I think a reasonable solution would be to take the first occurrence of each name and use that one as the "authoritative" one, cause the reason there are multiple is because the data is coming from forms filled out by the same people on different dates
but I probably don't want to squash the dicts because that would imply I'm mixing a title from a prior date with a name that currently doesn't have one which might not be accurate, since their job title might have changed.
I'm basically trying to parse a collection of Form 4 SEC filings to build a list of the key execs in a company
I think I might just need to iterate through this list once and do it the clunky/manual way w/ if statements and build a new object
velvet thorn
efficiency doesn't sound like it's important
for your use case
in which case I would just build a new list and check for membership in it
dense copper
yeah
this works.
people = []
seen = []
for person in results:
    if person['ownername'] not in seen:
        people.append(person)
        seen.append(person['ownername'])
in that case you can use a set for seen
though it wouldn't matter since I believe your data is small
velvet thorn
well
seenis just to keep track of the names
@dense copper yes, but membership testing for asetis more efficient.
@wintry sapphire look up TickLocators in matplotlib
dense copper
ahh ok, so would this be better?
people = []
seen = ()
for person in results:
    if person['ownername'] not in seen:
        people.append(person)
        seen.add(person['ownername'])
ohh I thought you could make an empty set with a set comprehension like you can do with lists/generators
derp
thanks lol
velvet thorn
[] isn't a list comprehension, it's a list literal
wintry sapphire
@velvet thorn
I did this
` pos = np.arange(0, 15.0, 2.5)
    plt.bar(pos,sharpe_ratio,color='blue',edgecolor='black')
    plt.xticks(pos, stocks)`
But i get a value error instead
velvet thorn
like I said
just go Google TickLocator
and don't tag me please
there's usually no need
to set ticks manually like that
you can just use a tick locator object that does it for you.
wintry sapphire
Oh
 marsh belfry
hello
i would love and appreciate some help on a question i have for an assignment, it is due in 2 hours and ive come to the last couple questions and im stuck lol basically i have to make some code that : Write code to calculate the average temperature for each year. Save them in a new
array. Plot the new array using a specified color and line style. Use labels on x and y
axes and add a title. Find a way to show the years (e.g 1950, 1960, ..., 2000) on the x
axes
using Matplotlib
velvet thorn
@marsh belfry show your data exactly as is
marsh belfry
its a little over 2000 characs so itll be a file?
 arctic wedgeBOT
Hey @marsh belfry!
Uh-oh! It looks like your message got zapped by our spam filter. We currently don't allow .txt attachments, so here are some tips to help you travel safely:
• If you attempted to send a message longer than 2000 characters, try shortening your message to fit within the character limit or use a pasting service (see below)
• If you tried to show someone your code, you can use codeblocks
(run !code-blocks in #bot-commands for more information) or use a pasting service like:
marsh belfry
i can halve the data and send it?
[60.8 60.44 58.28 53.78 54.68 47.66 46.58 46.94 50.36 53.24 57.2 58.82
60.44 61.88 60.26 56.48 50. 45.86 47.12 46.58 51.26 53.06 55.58 57.2
59.36 62.6 58.64 56.48 51.8 48.38 45.86 48.38 51.62 54.32 55.58 60.26
59. 59.36 59. 54.32 51.26 48.02 47.12 49.64 51.08 52.52 57.74 59.72
61.7 63.14 62.6 54.14 53.78 50.18 46.76 47.12 50.54 52.16 57.2 59.
61.52 63.32 60.62 57.56 54.32 46.4 45.5 49.64 50.72 55.22 57.02 59.9
65.12 62.24 57.56 61.7 53.06 49.82 47.3 48.02 51.98 54.86 57.56 60.44
63.68 64.4 63.68 58.64 53.78 49.28 46.04 49.82 51.08 52.52 55.58 56.66
59.9 63.14 61.7 54.86 51.8 48.92 46.04 48.38 50.72 56.48 57.38 61.16
63.5 61.7 60.62 57.02 48.2 47.66 48.02 49.64 51.98 50.72 55.76 60.44
62.06 61.52 58.1 55.58 52.88 49.28 48.02 47.3 50.72 55.4 56.3 57.2
61.7 62.6 58.28 56.48 51.26 48.2 46.94 47.12 49.1 56.66 56.84 62.24
64.58 62.06 61.34 56.84 56.3 50.9 48.74 48.92 51.26 56.66 57.74 59.9
62.42 64.22 60.08 54.32 51.8 47.66 46.4 46.04 50.18 54.5 54.32 58.64
59.72 62.78 59.54 55.22 51.26 47.66 48.74 48.74 50. 53.24 56.3 60.8
65.84 61.7 58.1 55.4 51.8 48.38 44.78 46.58 50.54 51.26 54.86 59.18
60.08 64.22 61.34 57.02 49.82 48.2 46.4 46.04 49.82 53.24 53.96 57.56
60.08 61.16 60.08 56.3 51.8 46.94 45.86 50.18 49.1 55.04 55.76 60.26
61.16 61.7 64.04 55.58 53.24 49.1 45.68 48.56 49.1 51.98 55.58 57.92
61.34 59.9 60.98 54.68 50.72 45.86 45.5 48.02 53.96 51.98 57.56 62.96
64.76 61.52 61.88 57.92 49.64 49.82 49.46 49.1 51.44 54.86 57.56 61.34
62.78 65.66 61.88 58.1 54.14 52.52 47.3 50.54 51.62 53.6 56.66 60.62
60.98 59.9 62.6 57.2 51.62 44.78 47.48 46.22 52.34 54.14 58.28 56.66
61.52 63.14 60.8 56.3 52.7 49.82 46.58 48.38 51.98 53.78 57.56 60.98
60.44 64.94 56.84 56.48 51.62 48.38 48.38 47.66 51.98 53.06 57.92 62.78
65.84 64.22 62.78 58.82 54.32 46.94 46.76 49.28 50. 53.24 53.96 57.56
60.44 56.84 60.08 55.94 52.16 46.76 46.58 48.92 49.28 52.34 54.14 59.18
59.54 60.62 59.9 56.66 49.64 48.2 47.12 47.66 46.94 52.34 54.86 57.56
62.6 64.22 61.88 59.36 51.98 47.48 48.38 49.64 50.54 52.34 56.48 60.08
62.96 62.24 60.8 56.66 51.26 49.82 48.38 46.76 50.36 52.88 58.1 59.36
61.7 61.7 58.1 55.58 52.88 48.92 47.66 48.2 52.34 54.5 54.86 57.56
64.04 63.5 63.14 59.54 52.16 50.18 48.02 46.4 50.72 52.16 56.48 61.34
62.78 64.4 60.44 54.14 52.88 47.3 46.58 48.92 50. 51.62 56.48 56.48
60.08 60.44 60.26 55.4 51.08 48.56 46.58 48.38 51.44 54.14 55.4 58.64
59.18 61.52 62.24 57.38 51.26 51.26 49.1 50.36 51.08 53.78 58.28 62.06
65.48 63.5 59.54 57.02 52.16 51.62 49.64 48.02 52.16 52.7 55.58 61.52
66.2 64.22 60.44 58.64 53.42 49.28 45.86 46.58 50.36 53.96 57.02 60.26
64.76 61.88 58.28 56.12 53.78 49.82 47.84 51.62 51.98 54.14 57.56 59.72
62.6 63.5 58.82 54.68 51.8 50.54 49.28 49.64 53.24 55.22 57.56 62.24
64.76 62.06 62.06 57.74 53.24 48.92 45.86 49.1 52.52 55.76 57.2 58.46
62.6 66.2 62.42 56.84 54.32 49.28 49.1 49.82 50.54 54.68 56.3 60.8
61.52 62.42 60.26 55.4 52.88 47.3 47.12 50.54 52.88 53.42 54.32 58.64
62.6 60.8 57.56 52.16 48.56 48.2 48.2 46.58 48.02 51.08 56.66 57.2
59.72 59.54 57.74 54.14 52.52 51.08 49.46 47.48 49.1 54.5 53.6 58.1
62.42 64.4 59.18 58.1 53.78 48.02 47.66 50.18 50.36 52.34 55.58 59.54
61.34 63.14 60.98 58.46 53.24 48.2 46.58 47.84 50.72 53.06 54.86 62.24
63.32 62.96 59.36 58.1 52.34 48.56 47.3 47.48 54.14 54.86 55.04 58.28
59.9 63.32 59. 55.04 54.68 49.28 47.12 48.38 49.1 53.6 56.48 59.
62.42 66.74 63.68 58.64 54.14 49.1 51.62 48.38 52.88 55.4 56.66 60.98
65.48 64.76 64.04 57.74 55.76 50.36 49.64 49.1 53.24 55.58 57.74 58.28
60.98 62.06 58.82 57.56 54.5 50.9 50.9 49.28 51.62 54.5 53.96 62.06]
thats all data
the way it works is the temps of months over tim
time
starting from 1950 so 60.8 is the temp of jan 1950 and so on...
in Farenheight
these are the final questions i am stuck on and have no clue what to do here, it is due in about 90 minutes and yeah i have come to you for help as its my last hope hahahah
marsh belfry
I am doing it for a Statistics assignment and they have smacked us with an assignment that uses another form of calculating, im fine with Excel but when it comes to Python my mind just cannot think logically
and ive been really struggling over this for the past 8 days and yeah lol i thought id try ask for some assistance
but i do understand if its against your policy etc i dont mean for you do do the work for me yaknow
to do*
wintry sapphire
hi, can anyone help me see
why does my output not become
graphs that are side by side
        fig = plt.figure(figsize = [16,5])

        ax = plt.subplot(1,2,1)

        stocks = [stk_pairs[0], stk_pairs[1],'Portfolio']
        pos = np.arange(len(stocks))
        sharpe_ratio = [indv_sharpe[0] * 100, indv_sharpe[1] * 100 , pf_ratio * 100]

        plt.bar(pos,sharpe_ratio,color='blue',edgecolor='black')
        plt.xticks(pos, stocks)
        plt.title('Sharpe ratio (%)',fontsize=20)
        plt.show()

        ax = plt.subplot(1,2,2)
this is my output
but I dont know why
it is not coming out side by side
 cedar crag
Screen not wide enough?
wintry sapphire
I doubt its the screen
cause
I maanged a same size
of graph
above
@cedar crag
cedar crag
Okay. Honestly I don't really have any other advice, just wanted to make sure you had tried making sure your screen or browser window (or whatever that is) was wide enough and it wasn't wrapping to "help you out"
wintry sapphire
👍
velvet thorn
but i do understand if its against your policy etc i dont mean for you do do the work for me yaknow
@marsh belfry not mine in particular, but it is against the server's policy
so while I would like to help you, the most I can do is point you to matplotlib's documentation
which is probably not very helpful for you
velvet thorn
however, .mean(axis=1) should at least get you to the mean temperature for each year
then all you need to do is to get another array that contains the year numbers
and then you're more or less set
marsh belfry
so dude 1 quick question though
not helping with those ones
how would i go about finding an average of some numbers
velvet thorn
if it's a numpy array?
.mean()
if it's a list, from statistics import mean
then the same thing
mean(data)
marsh belfry
yeah so check my code real quick ill tell ya what i mean
velvet thorn
>>> from statistics import mean
>>> mean([23, 21, 1])
15
i am wanting to find the coldest winter, so these are winter months, and i need to get the year that had the coldest winter
sorry my code isnt great
 cursive swan
I don't think you should use statistics.mean at all
according to SO it's much much slower than sum/len and np.average
like 35x slower
marsh belfry
Find the coldest winter where the average of the June, July and August temperature
is the minimum among all the years. Print the year out.
yeah im not good at this lol
sorry
i am doing a stats paper and they have given us coding...
i did not sign up for this lmao
marsh belfry
what would be a simple way of finding the coldest winter do you thinkk
?
as you can see by my code i aint very good at this hahaha
cedar crag
@bold ledge If you were creating a 2-d array, it might look like acc.shape = (k, j). The syntax (x,y,...) creates a tuple like bossreaper said, a list of items. But since this example is making only a 1-d array the syntax looks strange.
 bold ledge
ahh so then the comma is not necessary?
cedar crag
no, it must be present
bold ledge
oh
cedar crag
The shape must be a tuple, but it can be a 1 element tuple. The syntax to create a tuple is parens and a comma
(1,) and (1, 2, 3) are both tuples, but (1) is just a 1 in parenthesis lol
bold ledge
i see
cedar crag
A tuple is an immutable ordered list of items. Sort of like a list [1, 2, 3] except the items cannot be changed.
velvet thorn
I don't think you should use statistics.mean at all
@cursive swan true, but there is a reason for that.
statistics.mean doesn't perform naive summation, unlike sum.
in this case it won't matter, since it's mostly meant to handle cases where you have large differences in the magnitude of your summands.
however, the amount of data here is also very small, so the increased runtime won't matter either.
as for using np.mean...I discussed it before that (use it if your data is in np.ndarray form, which it should be)
Find the coldest winter where the average of the June, July and August temperature
is the minimum among all the years. Print the year out.
@marsh belfry you wantargmin.
marsh belfry
what is argim?
velvet thorn
>>> a = np.array([3, 6, 9, 2, 5, 1, 4, 9, 11])
>>> a.argmin()
5
>>> a[a.argmin()]
1
argmin gives you the index of the lowest value in an array.
do you see how that would be useful?
marsh belfry
ah yes that makes sense! That is helpful, i have already taken a guess at the coldest year and submitted it. i could not get my head around all of it hahaha but thanks a bunch
 hasty grail
There are quite a few things in that image, what do you mean by "that"?
 glacial rune
Is there a limit to the size of a text file that python can read?
hasty grail
I think it's limited by how much you can load into memory (aka your RAM)
hasty grail
unless you're going over 1 GB it won't really be a concern imo
glacial rune
I think I will be 😄
hasty grail
what's in that text file?
lapis sequoia
what does it mean if your ANN makes purely random predictions with no improvement over the epochs
 desert oar
Always check for programming errors first
And then check to make sure you didn't screw up your data somehow
And if you're sure that both of those things are fine then your model is just useless, maybe the features and the target don't actually have any relationship
 burnt prawn
lapis sequoia
burnt prawn
lapis sequoia
Anyone here familar or have experience using scikit?
 balmy ice
Hey guyz i am creating a chatbot. I want some more data to make my bot more advance.
Did any of you know some websites where i can get the data?
 paper niche
@lapis sequoia do you have a specific question that you want to ask? feel free to just put it out here and someone who can, will.
 runic stream
Hey anyone knows any video links or pdf for learning how to implement GRU in Keras? Need it for a project.
I know the basics of GRU, just need help with the implementation
 vocal sluice
HELLO, do u guys know any tutorial that help to write me tensorflow object detection webcam script {python code} i know there is many tutorial on youtube but i cant find "how to write python script for for object detection" if anyone know can u share link with me .......🙃
lapis sequoia
@paper niche Just looking for tutorials on it and how to upload data. Not sure if it takes .CVS but it is new for me
paper niche
@lapis sequoia (I'm assuming you mean scikit-learn, the ML library) The official tutorials on their documentation are pretty in-depth and a good introduction to the topic, if you're just trying to get into ML/data science.
As for uploading data, where to? The usual workflow with sklearn estimators is you would load in your dataset (csv, or otherwise) with pandas, into a pandas DataFrame, then pass it through some preprocessing functions/transformers, and finally to an estimator (e.g. LinearRegression).
balmy ice
Hey guyz i am creating a chatbot. I want some more data to make my bot more advance.
Did any of you know some websites where i can get the data?
@balmy ice check this plz @molten hamlet
fast bluff
df = pd.DataFrame(ts.get_currency_exchange_intraday(from_symbol='USD',to_symbol='EUR',interval='1min',outputsize='compact')
``` Can someone please help me get this command working I've posted a few times with more details if needed molten hamlet
you can always post on #❓|how-to-get-help @balmy ice
you probably get more help there
 wispy star
Hi what is the most efficient way performing an operation of one row of a numpy array with all other rows
Or is there a better frame work for doing that?
 novel remnant
what do you mean?
 shadow fiber
Hey all! Im doing a project with a lot of xml data and I want to have full xpath support. Is ElementTree / lxml the way to go?
modest rune
@tidal bough I have a problem I could use some help with. I am trying out multiple libraries (scipy, scikit-learn, statsmodels) in order to fit the implied volatility surface of a stock option (see the screenshot to see the progress I am making).
The strike vs. IV plot is full of lots of data points (from here on referred to as A). The expiration vs. IV plot has few data points and the data points are not evenly space (from here on referred to as B).
This is causing problems:
- Regarding B, there really isn't enough data points to properly fit the curve. Meaning, even by hand I cannot draw an ideal curve, I can only get close.
- For many of the curve fitting algorithms, the feature with more points (A) seems to influence the curve more.
So, I was thinking. Maybe I should somehow do a simple linear interpolation for B before using that data to do the entire surface fit. Thoughts?
fast bluff
Yooo
How do I turn this into an editable pandas dataframe?
ts.get_currency_exchange_intraday(from_symbol='USD',to_symbol='EUR',interval='1min',outputsize='compact')
Its from Alpha_Vantage's Foreign Exchange shit to pull ETF data
Been fighting with it for awhile and been asking for help but not getting anywhere
modest rune
Importing data into Pandas is very specific to the format of the data.
modest rune
do you have the raw data?
 upbeat cradle
so you can access columns if you did for example
df = ts.get_currency_exchange_intraday(from_symbol='USD',to_symbol='EUR',interval='1min',outputsize='compact') ?
fast bluff
ts = ForeignExchange('KEY',output_format='pandas')
#Get stock data
avdf = ts.get_currency_exchange_intraday(from_symbol='USD',to_symbol='EUR',interval='1min',outputsize='compact')
so you can do access avdf['1. open'] ?
fast bluff
I'm not sure what you mean. I'm able to pull and see all the data but if I try to run
avdf.drop(['open','high','low'])
I get this
Assumed it was bc it was a tuple not a list so I've been trying to find a way to convert it with no success
I'm able to have Alpha Vantage store the data is a JSON or CSV. I assumed the pandas datatype would be best but would using a different one solve my issue?
modest rune
which library are you using to pull data from Alphavantage? This one?
https://github.com/RomelTorres/alpha_vantage

GitHub
A python wrapper for Alpha Vantage API for financial data. - RomelTorres/alpha_vantage
fast bluff
Yeah
modest rune
ok, one sec
fast bluff
tyty
@upbeat cradle Just saw your message. If I try that it says "TypeError: tuple indices must be integers or slices, not str"
but avdf[1]
modest rune
Try this:
avdf[0].iloc[:,2]
that should return the column with index 2
which should be a series
fast bluff
Worked great! Thank you!
modest rune
ok, this was the problem...
upbeat cradle
nice solve german 🙂
fast bluff
I'm very new with data science and pandas and its all just kinda been going over my head
modest rune
ts.get_currency_exchange_intraday() returns a tuple, a 2 element tuple. Only the first element in the tuple contains the pandas data frame. The second element contains meta-data. I was able to determine this from the wrapper api's github source.
fast bluff
ohh I understand
modest rune
So, you need to first, get to the first element in the tuple, before you start indexing the pandas dataframe.
fast bluff
That explains the output I got from avdf[1]
modest rune
I used iloc instead of 1. open, that way I didn't have to worry about using the exact right string. But, you could have used this and it probably would have worked:
avdf[0]['1. open']
based off of the screenshot you posted.
modest rune
np, good luck
1st difficulty with pandas, figuring out how to get your data into pandas. You have that solved! 2nd most difficult thing, figuring out how to index things.
fast bluff
I'm gonna need it lol Data-science is completely new to me. I just wanted to make some money lmao
 naive cliff
Hi, Everyone! I just cleaned up a nice set of data in R and am ready to visualize it, but really can't decide how best to do it. Can anyone make a suggestion? I would love to plot the locations on a map of the Balkans according to coordinates
modest rune
@naive cliff The most beautiful plots i have seen were created using plotly
And gnuplotlib seems to be super popular too.
 crisp jewel
is there any channels for machine learning?
modest rune
Matlabplotlib is probably the most popular, but all of the plots i think look a bit dated.
For your specific scenario, i think plotly is perfect.
@crisp jewel you are in the right place. I think 30% or more of the questions asked on this channel are ML related.
modest rune
But, I wouldn't say this channel is the best place to find ML experts, but it probably is for the Python server.
crisp jewel
In one video he explained it as the number of features , and it made sense . like vectors and direction . But for some reason in another video we used 16 dimensions for just a model that detects either sentence is sarcastic or not
that means we are embedding words either they are sarcastic or not and then somming . which means we should be using 1 dimension
that's how I see it
modest rune
@crisp jewel i guess Friday nights are not the best time to get help. Usually this channel is more active.
desert oar
@crisp jewel can you show more of the model code? it probably is not only that one layer
 deft surge
@crisp jewel Embedding dim refers to how many dimensions you would like to encode the vocabulary in. In your example of detecting a sentence if it is sarcastic or not. Vocab size would be the language vocabulary possible and embedding dim which is 16 represents that each word would be encoded into a 16 dimension vector. This 16 dim vector uniquely identifies a word.
dense copper
hi, if I have a list of datetimes (or more specifically, strings of YYYY-MM-DD format), given I've searched for a date that doesn't exist in the list, what would be the most elegant way to see if another one exists within a few days of that date?
{'date': Timestamp('2015-09-18 00:00:00'), 'close': 28.363}
{'date': Timestamp('2015-09-17 00:00:00'), 'close': 28.48}
{'date': Timestamp('2015-09-16 00:00:00'), 'close': 29.102}
{'date': Timestamp('2015-09-15 00:00:00'), 'close': 29.07}
{'date': Timestamp('2015-09-14 00:00:00'), 'close': 28.828}
{'date': Timestamp('2015-09-11 00:00:00'), 'close': 28.552}
{'date': Timestamp('2015-09-10 00:00:00'), 'close': 28.142}
{'date': Timestamp('2015-09-09 00:00:00'), 'close': 27.538}
{'date': Timestamp('2015-09-08 00:00:00'), 'close': 28.078}
{'date': Timestamp('2015-09-04 00:00:00'), 'close': 27.317}
Here's an example...what if I search for e.g. 9/12 or 9/13 and I want to get one the closest surrounding date?
velvet thorn
hi, if I have a list of datetimes (or more specifically, strings of YYYY-MM-DD format), given I've searched for a date that doesn't exist in the list, what would be the most elegant way to see if another one exists within a few days of that date?
@dense copper convert to datetime first
then subtract from the desired date
take absolute value
and compare to a threshold
dense copper
do you mean convert to an epoch timestamp?
velvet thorn
that means we are embedding words either they are sarcastic or not and then somming . which means we should be using 1 dimension
@agent0ne#1596 nope, that's not right
remember that embedding produces features
there'll be an additional step that, from those features, predicts the target, which is a binary class
do you mean convert to an epoch timestamp?
@dense copper likedatetime.datetime
but an epoch timestamp will work too
the nice thing about datetime.datetime and datetime.timedelta is that it does the work of converting to days for you
dense copper
Alright thanks, that's got my gears turning and I found a quick solution already, but trying to see how it works
this is really clean
def nearest(items, pivot):
    return min(items, key=lambda x: abs(x - pivot))
only thing I don't quite understand is the key parameter
velvet thorn
hm
 tidal bough
For example:
tidal bough
!e
lst = list(range(-10,10))
print(min(lst)) # -10
print(min(lst, key = abs)) # 0
You are not allowed to use that command here. Please use the #bot-commands channel instead.
tidal bough
oh, right. See comments.
dense copper
@velvet thorn I think that's ok since it's a list of items but I can adjust it slightly to get the date key out of the object
velvet thorn
yeah
like I meant I thought what you wanted was just to know if such a date existed
which would be a slightly different algorithm
dense copper
nah I am just trying to get 1y, 3y, 5y price performance so if the date 3y ago was on a weekend or holiday or something I wanna just get the closest one I have data for.
doesn't have to be perfect
velvet thorn
why aren't you using pandas incidentally
dense copper
lol I am actually, I have just already converted the df to a dict. but I just found the iloc function has a nearest feature so I think I'm just going to convert it to a dict after I get the stuff I need from it
lapis sequoia
How to learn pandas any specific cources ?
 median cairn
lapis sequoia
median cairn
lapis sequoia
@Dagger thanks it helped me 👍👍
lapis sequoia
hi
I have two columns in a df, I want to output the minimum of both in a third column
how do I go about this
paper niche
in pandas? df[[col1, col2]].min(axis=1)
 frigid veldt
Can I use ? or :column in Postgres?
 still verge
how many here use pyspark daily?
paper niche
I do, primarily pyspark sql
still verge
I do, primarily pyspark sql
@paper niche any impressions on it?
paper niche
what do you mean?
still verge
how is it like for you?
paper niche
Well, considering the alternative is writing sql, I very much prefer writing in pyspark
still verge
tht makes sense, i get pandas jumbled up with it thouhg
paper niche
it's not exactly a replacement for pandas; I wouldn't bother with pyspark if you're not dealing with huge amounts of data though
My data are on s3; I read it in and process them via pyspark sql, & convert them to a wide pandas dataframe/json.
And complete my data analysis and visualization using pandas. etc.
still verge
do ytou know of any good viz packages for pyspark?
paper niche
As I mentioned, the alternative is writing sql to pull data from the database. And for me, pyspark is much more flexible and has a clearer syntax than pure sql
no, unfortunately not. my interactions with pyspark has been limited to data extraction & queries only, I haven't done ML/streaming/viz directly from pyspark before
 mossy dragon
does python have any data viz libraries that are as good as ggplot2 yet
still verge
thanks @paper niche !
 wind panther
hey guys! im fairly new to programming (just finished CS50) and was wondering which library is the "best" for OLS or multiple regression
i was just thinking of a project to start and since I use regression quite a lot at work I had the idea to create a webapplication where I can upload some data and it should run some regressions for me (eg all possible combinations of the dependent with independent variable combinations) and output the results in a pdf file or sth like that
the app should be able to read the data from an excel or csv file (if that is of any relevance)
 pine hill
hey guys! im fairly new to programming (just finished CS50) and was wondering which library is the "best" for OLS or multiple regression
@wind panther have you taken a look at statsmodels?
wind panther
No I haven't I am currently looking at pandas, sklearn and numpy. Do you recommend looking at statsmodels?
pine hill
yes it gives you more options than sklearn when it comes to linear models in particular
sorry I'm not the best expert in statsmodels, but I saw it's more flexible and gives a good summary of the models you build
wind panther
great, thank you! I will definitely have a look
thanks for taking the time to give me some advice!
pine hill
no problem
lapis sequoia
guys how do you make that code box here in discord
in pandas?
df[[col1, col2]].min(axis=1)
this one
pine hill
try three ticks
or one if inline
GitHub
Google Chrome, Firefox, and Thunderbird extension that lets you write email in Markdown and render it before sending. - adam-p/markdown-here
 brittle agate
How to eneble TensorFlow ROCm in distro Manjaro?
 chrome laurel
so im new to data science and i picked up a pandas course and i feel im getting bombarded by all this stuff i just want to ask do i rly need to know all of this or the course is getting deep?
 earnest forge
I'm new in this field, too. But can make a simple analysis of csv files and such. So, it is actually helpful to operate on your data with Pandas's DataFrames.
 finite night
Anyone know of a decent way to start with machine learning?
tidal bough
I very much recommend https://www.coursera.org/learn/machine-learning for an introduction; it's an amazing and free course.
 stoic escarp
Building neural networks from scratch in Python introduction.
Neural Networks from Scratch book: https://nnfs.io
Playlist for this series: https://www.youtube.com/playlist?list=PLQVvvaa0QuDcjD5BAw2DxE6OF2tius3V3
Python 3 basics: https://pythonprogramming.net/introduction-le...
finite night
Thank you.
lapis sequoia
Function Definition in Python by Sadrach Pierre, Ph.D. in TData Science https://towardsdatascience.com/function-definition-in-python-bae11c29f4cd?source=social.tw

 gusty oak
Can I use plotly.com for line charts?
 heady flume
guys please guide me how can i become a data scientist...:)
and what subjects are required???
tidal bough
statistics, mainly.
earnest forge
then corresponding question: do I need to do a master in permutations and combinations? they are useful sometimes, but they don't seem be to harsh examples in real world
i am certainly not friends with this topic
heady flume
statistics with programming language?
earnest forge
and what subjects are required???
@heady flume in a nutshell:
Math:
Linear Algebra
Statistics
Calculus
Programming:
Python:
Pandas
Numpy
Seaborn
Matplotlib
and some more useful libraries
R:
all above but called different
SQL
Excel
heady flume
i am certainly not friends with this topic
@earnest forge i'm not good in calculus 😦
tidal bough
Statistics has a lot of grounding in probability theory, and it has relations with combinatorics. I'd say that you shouldn't strive towards learning combinatorics, but you'll likely have to anyway 🙂
 iron ruin
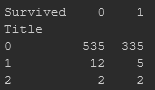
How should i deal with this case where two levels of categorical variable are very small and one is big? https://prnt.sc/uc2hre
 tidal bough
You mean, like, when there's a lot more examples of one class than of another?
earnest forge
@heady flume i edited it, look up
heady flume
@heady flume in a nutshell:
Math:
Linear Algebra
Statistics
Calculus
Programming:
Python:
Pandas
Numpy
Seaborn
Matplotlib
and some more useful libraries
R:
all above but called different
SQL
Excel
@earnest forge 🙂 wow...lot of programming laguage required
earnest forge
How should i deal with this case where two levels of categorical variable are very small and one is big? https://prnt.sc/uc2hre
@iron ruin if this is important data, contrasting to all others, then you can't get rid of it. in a contrary, you can, if its percentange to all data is less than 15%
@earnest forge 🙂 wow...lot of programming laguage required
@heady flume well. it's not simple as it seems. you need a few of programming, but a lot of business intelligence
 runic hawk
@iron ruin First of all, what are you trying to accomplish?
tidal bough
https://elitedatascience.com/imbalanced-classes
Here's an article about class imbalance and some ways to mitigate it, if I understand your problem right.
iron ruin
thanks for help and usefull article 
earnest forge
anywy, I mentioned not all tools you need. every day there are more and more new to operate with. so you should be ready to learn Java, C++.
@earnest forge are you a data scientist 🙂
@heady flume I am not, i am just slowly learning it
if you are not ready to spend money on courses, then arrange or find a curriculum yourself. i did this
earnest forge
mostly, you need to know about dependences. i mean what is x^2 etc.
integration not a frendly topic for me, too. but if you know basics of it, you can master miscellaneous
anyway, I just started learning recently, so don't take my words as sole true
heady flume
mostly, you need to know about dependences. i mean what is x^2 etc.
@earnest forge oh you started learning during lockdown....
earnest forge
I can share some very useful sites to you. one of them is https://towardsdatascience.com/

i started learning around 6 months ago.
my approach is to take everything as deep as it is possible for you now. cuz oftenly knowing basic concepts are not enough
heady flume
i started learning around 6 months ago.
@earnest forge thanks you very much 🙂
 lilac ferry
how do i set up xticks in seasborn catplot? Here's what i have right now
tried using xticks
lilac ferry
okay
lilac ferry
that still game the output same as the second pic
i tried it with sns.scatterplot instead of sns.catplot
and that worked
gusty oak
How do I install plotly?
novel remnant
pip install plotly
 rocky maple
Ah, so you're on windows
gusty oak
yeah
rocky maple
What does your python installation look like?
gusty oak
how can I show that?
rocky maple
Are you using Anaconda?
gusty oak
where do I check?
 pale thunder
py -m pip install plotly
gusty oak
ah well working now, i used py -m pip install plotly
I installed python via their site
pale thunder
 pale thunder
The windows binaries come with the py version manager
rocky maple
Anaconda on Linux is by far the easiest to set up
Although depending on the distribution, may have to avoid conflicts with system python.
Anyway... actually came here to ask a question.
So, I made a plot.
I did so with the following
def show_ntuple(ntuple, axes=True):
    n = len(ntuple)

    npimgs = [np.transpose(tensor.numpy(), (1, 2, 0)) for tensor in ntuple]

    axs = plt.subplots(2, n//2, constrained_layout=True, figsize=(16, 16))[1]

    for i in range(n // 2):
        axs[0, i].imshow(npimgs[i], interpolation='nearest')
        if not axes:
            axs[0, i].set_axis_off()

    for i in range(n//2, n):
        axs[1, i - n//2].imshow(npimgs[i], interpolation='nearest')
        if not axes:
            axs[1, i - n//2].set_axis_off()

    plt.show()
How can I get rid of the space between the top and bottom rows of images?
earnest forge
if you still haven't succeed in installing plotlib via comand line, i'm here to help you
rocky maple
Also,
fig, axs = plt.subplots(2, n//2, constrained_layout=True, figsize=(16, 16))
fig.tight_layout()
does nothing
earnest forge
add folder where is your pip3 and pip stored to PATH, it all will work
How can I get rid of the space between the top and bottom rows of images?
@rocky maple it is possible to work with images in plotlib?
wow, didn't know
rocky maple
Yeah, it's how you show images in notebooks
If you're working with images, anyway
You convert them to an ndarray first
It doesn't work with torch/TF tensors for obvious reasons
But it does work directly with PIL images
novel remnant
I just reduced the height of the plot and the space between was gone
also you can ravel ax obj to be easier to loop over
n = len(images)

fig, ax = plt.subplots(2, n//2, figsize=(16,6))
ax = np.ravel(ax)
for i in range(n):
    ax[i].imshow(images[i])
    ax[i].set_title(f'Image {i}')
    ax[i].set_axis_off()
plt.show()
the fig size controls the dimensions of the whole canvas, but since the images are not plotted in a symmetrical manner (like 3x3) they get resized to fit the width dimension, therefore there is a gap in the middle
rocky maple
Thank ya, that would be it
fast bluff
Do certain libs/functions limit certain operators???
df1['BC2'] = df1['1hma'] >= df1['2hma'] | df1['BC1'] == True
TypeError: unsupported operand type(s) for |: 'float' and 'bool'
tidal bough
uhh
pale thunder
The Boolean or operator is or not |
tidal bough
that looks like a precedence thing
pale thunder
| is tighter than comparison operators
tidal bough
Nah, I'm fairly sure | is the right one for elementwise OR on pandas Series.
df1['BC2'] = (df1['1hma'] >= df1['2hma']) | (df1['BC1'] == True)
Oh, ye, you want | there
tidal bough
might be able to drop == True in the last one if it's a boolean column.
modest rune
I have a problem I could use some help with. I am trying out multiple libraries (scipy, scikit-learn, statsmodels) in order to fit the implied volatility surface of a stock option (see the screenshot to see the progress I am making).
The strike vs. IV plot is full of lots of data points (from here on referred to as A). The expiration vs. IV plot has few data points and the data points are not evenly space (from here on referred to as B).
This is causing problems:
- Regarding B, there really isn't enough data points to properly fit the curve. Meaning, even by hand I cannot draw an ideal curve, I can only get close.
- For many of the curve fitting algorithms, the feature with more points (A) seems to influence the curve more.
So, I was thinking. Maybe I should somehow do a simple linear interpolation for B before using that data to do the entire surface fit. Thoughts?
I guess I am curious if maybe some sort of preprocessing step in scikit-learn helps with this type of scenario. Any advice is welcome.
Is my situation considered nested features?
 wet jasper
why am i getting numbers instead of the date for the x-axis?
 austere swift
what is tesla['Volume']
wet jasper
got it already 0-1200 are the indexes 😄 now i got the dates
austere swift
yeah it does index by default unless you specify another list for x
wet jasper
i see thx 😄
austere swift
Np
wet jasper
tesla = pd.read_csv('Tesla_Stock.csv')
tesla.set_index('Date',inplace=True)
tesla['Volume'].argmax()
Why is argmax still returning my Index instead of the date?
wet jasper
still gives me the index 😄
lapis sequoia
Would it be possible to write an AI in Python and teach it geometry?
tidal bough
What do you mean by that?
lapis sequoia
Dunno
 wary cosmos
Why does this say that there are n iterations of the for loop, each of which takes constant time?
tidal bough
well, why'd it take any more than that?
wary cosmos
because of the recursion
it should call merge 15 times in the example below
and i dont see how the time would be constant when the merges are getting larger which means more loops in the for loop
tidal bough
each iteration of the loop is constant time
the number of iterations is r-p, which is at most n, so we'll call it O(n)
so each execution of mergesort is therefore O(n)
and the number of executions is ~log(n,2)
hence O(n*log(n)) total
wary cosmos
if u are essentially saying the that each layer has n loops and there are (log base 2 (n)) + 1 layers then it makes sense
thanks
wary cosmos
so the merge part is O(n*log(n)) and the divide and conquer part is O(n)?
austere swift
anybody know where you can download .onnx files of different pretrained models (specifically densenet)
nvm i found it on github https://github.com/onnx/models

GitHub
A collection of pre-trained, state-of-the-art models in the ONNX format - onnx/models
still verge
what is everyuon'es opinion on masters of data science/bootcamps?
 magic valley
Hey guys, any book/paper recommendations for learning what neural net architecture works best for a given problem?
 frail arch
Does anyone know how to visualise graphdef model?
serene scaffold
@tidal bough for all the times #algos-and-data-structs is off-topic, I come here and see the most glorious CS-specific question
@still verge I'm enrolled in the data science concentration within my CS major, so maybe I'm biased. I don't think it fundamentally matters how you learned something as long as you actually know it, so I don't think a formal education is really necessary unless you need your attainment of knowledge to be accredited. But my guess is that a lot of data science bootcamps don't have great curriculums (I'd feel weirdly pretentious saying curricula) and that they were just developed to cash in on the excitement surrounding data science as a high-paying career possibility.
still verge
@still verge I'm enrolled in the data science concentration within my CS major, so maybe I'm biased. I don't think it fundamentally matters how you learned something as long as you actually know it, so I don't think a formal education is really necessary unless you need your attainment of knowledge to be accredited. But my guess is that a lot of data science bootcamps don't have great curriculums (I'd feel weirdly pretentious saying curricula) and that they were just developed to cash in on the excitement surrounding data science as a high-paying career possibility.
@serene scaffold what is the concentration like?
serene scaffold
@still verge I'm taking most of the classes for it right now, so I can't say for sure
still verge
that's fair, all good
velvet thorn
what is everyuon'es opinion on masters of data science/bootcamps?
@still verge bootcamps aren't very good IMO
for the community, okay.
that's it.
well, I've only been to one
which I've also taught
like if you're doing an early career switch they're viable I suppose?
especially if you're not super good @ learning alone
since they do give direction and structure
 storm sigil
Is creating a chess game which usees and AI and has millions of chess algorithms a advanced project
Can someone just explain the process to which to start this
velvet thorn
Is creating a chess game which usees and AI and has millions of chess algorithms a advanced project
Can someone just explain the process to which to start this
@storm sigil I think
you might not be clear
on what an "algorithm" is
you seem to think an algorithm refers to an optimal action, given a particular environment (e.g. what move to make, given a board state)
storm sigil
@velvet thorn this is what I mean
The algorithm attempts to MINimize the opponent's score, and MAXimize its own. At each depth
(or "ply" as it's as its referred to in computer chess terminology), all possible moves are examined,
and the static board evaluation function is used to determine the score at the leafs of the search tree
yes
velvet thorn
but which is best is determined by a SINGLE algorithm
storm sigil
I dont wanna do this, I just wanna know how this works, and what do u mean by whats your background like
storm sigil
ye i kinda know matrices and vector
storm sigil
u need maths for this?
velvet thorn
the simplest way to do this is an exhaustive search of all possible moves
so you build a tree of possibilities
storm sigil
how will u need maths for this @velvet thorn
velvet thorn
to a specified depth
then you prune based on current board state
and choose the paths that lead to the desired state (you winning)
since space and runtime requirements are exponential in the desired depth
storm sigil
ooh
velvet thorn
this quickly becomes untenable (especially at the start)
the dominant approach
has been
reinforcement learning-based
storm sigil
ye so u now that we can play chess against a computer i just wanna make it like that so I also will need AI right?
velvet thorn
yes
serene scaffold
I would make an algorithm that can create a game tree
storm sigil
wdym by game tree
serene scaffold
A tree of each possible move from a given point
And each possible move from those points
Etc.
You probably can't represent very many levels of that tree at a time
In memory
serene scaffold
Because in chess there are tons of possible moves.
serene scaffold
So I would make an algorithm that builds a tree as far out as is reasonable given your memory
And then picks whichever path either results in you winning in the fewest number of moves
Or whichever brings you to the best state
storm sigil
So I would make an algorithm that builds a tree as far out as is reasonable given your memory
@serene scaffold I dont have that much memory only 4 gb
storm sigil
ye i will do a bit of research then come back. But how is this related to data science, YE
serene scaffold
If you want to do machine learning, I heard making a neural net that can identify hand written numbers is pretty good.
storm sigil
oooh ok ok i will be back with a bit of research
serene scaffold
The algorithm I suggested isn't machine learning
Because you'd be using a heuristic.
storm sigil
whats a heuristic
velvet thorn
The algorithm I suggested isn't machine learning
@serene scaffold yup, but I would consider it AI
serene scaffold
Right
AI is when a computer does a task that applies knowledge
At least, a task that we think of as applying knowledge
Machine learning is a subset of that
Because with machine learning, you don't write a program to explicitly do something
You... I don't know. Throw data at matrices.
velvet thorn
more at algorithms, but yes
storm sigil
This is kinda similar to what I want to do,
https://www.youtube.com/watch?v=vnd3RfeG3NM&ab_channel=TechWithTim

This python pygame checkers tutorial covers how to create checkers using the python module pygame. We will create a checkers game from scratch and implement jumping, king pieces, double jumping graphics and more!
📝 Full Code: https://github.com/techwithtim/Python-Checkers
🌄As...
 steel atlas
Anyone know anything about R?
earnest forge
Hey i want to post an http request with a new ip
@glad canyon did you write a script for this?
or, at least, function?
 wraith trail
Hey Developers I am a 2nd year student and i want to build a system like jarvis of iron man. So i need your help I don't know where to start and what to do.
 split tree
hey im trying to make a heat map from this list
[[20, 1.0, 3640.2676214567728],
 [20, 1.1, 3190.2649994356034],
 [20, 1.2, 3338.9612570901445],
 [20, 1.3, 4406.935820439513],
 [20, 1.4, 5488.498928889102],
 [20, 1.5, 6228.414034825846],
 [20, 1.6, 7528.447420784376],
 [20, 1.7, 8912.749605088677],
 [20, 1.8, 7911.749653326551],
 [20, 1.9, 8994.501898272765],
 [21, 1.0, 3924.018277851048],
 [21, 1.1, 3197.2905903493493],
 [21, 1.2, 3390.459434226538],
 [21, 1.3, 4161.354270060336],
 [21, 1.4, 5161.491932611555],
 [21, 1.5, 7807.589114062448],
 [21, 1.6, 7637.5134730432155],
 [21, 1.7, 7357.725756999215],
 [21, 1.8, 8336.692113609643],
 [21, 1.9, 6066.429180017531]]
I would like to use the first value for the horizontal axis and the second value for the verticle axis and then colour by the last value but i cant figure out the correct way to make the dataframe
     idx = []
     cols = []
     values = []

     for i in results:
         idx.append(i[0])
         cols.append(i[1])
         values.append(i[2])

     idxx = [idx, cols]
     #hm = pd.Series(values, index=idxx)
     hm = pd.DataFrame(values, index=idxx, columns=idx)
     print(hm)
@split tree your data is already in a format suitable for pd.DataFrame (list of list), so just pass it in directly will do:
df = pd.DataFrame(results, columns=['x', 'y', 'c'])
Thank you 🙂
pine hill
guys I don't really know a lot of front-end web development, do you think I should learn any?
(as a data scientist)
split tree
by setting df = df.set_index('y') The verticle access is set, How do i set the x access?
`
     sb.heatmap(df, cmap='viridis')
     plt.show()
thats what im using to generate it
pine hill
guys I don't really know a lot of front-end web development, do you think I should learn any?
or in other words are there any easy libraries or web frameworks I should take a look at?
paper niche
@split tree ah, seaborn requires the "x" to be the columns of the df. you can pivot the dataframe:
sns.heatmap(df.pivot('y', 'x', 'c'), cmap='viridis')
 polar lava
can i ask here for encrypting in python?
i have a problem:
im new in python and i want to convert A string into Binary.
but when i check it with an Online-Converter then its a different Result
split tree
@paper niche Thank you very much 🙂
paper niche
guys I don't really know a lot of front-end web development, do you think I should learn any?
@pine hill I don't think it's that essential, but you can if you want to, I suppose. As for framework, flask's pretty popular and easy to get into
pine hill
@pine hill I don't think it's that essential, but you can if you want to, I suppose. As for framework, flask's pretty popular and easy to get into
@paper niche how about front-end?
paper niche
oops, front-end. misread, sorry. I don't have experience with any front-end libraries 😅
 cedar raft
should i read life 3.0 by max tegmark or the master algorithm by pedro domingos (its an easy read) after reading superintelligence
should i cool off and read an easy book
or
continue the streak of reading higher level material
has anyone here read all 3 books
btw if u have an answer to my question plz ping me
brittle agate
Hey guys, how to enable TensorFlow ROCm in distro Manjaro?
 eager root
I am trying to solve this problem https://justpaste.it/8nzf0 . It asks to implement a decision tree building algorithm. ID3 fits this problem. I implemented the solution at least to preparing the tree. As I am still new to machine learning, how do I print the expected output?
My code: https://pastebin.com/qbN9CUwe
Pastebin
Pastebin.com is the number one paste tool since 2002. Pastebin is a website where you can store text online for a set period of time.
 sudden pumice
Anyone know how can we store the 128 bit encoding of image for face recognition using hog model in the database?
crisp jewel
can anyone explain Global Average Pooling 1d in keras
this is an example ```"""Global average pooling operation for temporal data.
Examples:
input_shape = (2, 3, 4)
x = tf.random.normal(input_shape)
y = tf.keras.layers.GlobalAveragePooling1D()(x)
print(y.shape)
(2, 4)```
crisp jewel
up
wet jasper
import yfinance as yf


def get_stock_data(currentStock):
    #define the ticker symbol
    tickerSymbol = currentStock

    #get data on this ticker
    tickerData = yf.Ticker(tickerSymbol)

    #get the historical prices for this ticker
    tickerDf+str(currentStock) = tickerData.history(period='1d', start='2010-1-1', end='2020-9-6')


stocks = ['AAPL','MSFT','AMZN']
for currentStock in stocks:
    get_stock_data(currentStock)
im trying to import data of 3 stocks, any suggestions what do change? currently i get this error. is my way to name my new variable wrong?
  File "<ipython-input-47-b563d2bb>", line 13
    tickerDf+str(currentStock) = tickerData.history(period='1d', start='2010-1-1', end='2020-9-6')
    ^
SyntaxError: cannot assign to operator
tickerDf+str(currentStock) cannot be assigned to
wet jasper
for what?
can you explain that?
import yfinance as yf


def get_stock_data(currentStock):
    #define the ticker symbol
    tickerSymbol = currentStock

    #get data on this ticker
    tickerData = yf.Ticker(tickerSymbol)

    #name
    name = 'tickerDf'+currentStock

    #get the historical prices for this ticker
    name = tickerData.history(period='1d', start='2010-1-1', end='2020-9-6')
    print(name)


stocks = ['AAPL','MSFT','AMZN']
for currentStock in stocks:
    get_stock_data(currentStock)
this is doing what i want, i just want the variable 'name' to be named tickerDfAAPL or tickerDfAMZN
desert oar
@wet jasper you can't and shouldn't use variable names like that
python isn't designed for it
it theoretically is possible with some very ugly workarounds, but you really shouldn't
moreover, variables don't really work like that in python
the language is not dynamically scoped
assigning to name = inside a function like get_stock_data does not create a name variable outside the function
again, you can make that work, but you shouldn't try because it's not what the language is meant to do
just return the data instead
and use the returned value at the call site
import yfinance as yf

def get_stock_data(ticker_symbol):
    tickerData = yf.Ticker(ticker_symbol)
    return tickerData.history(period='1d', start='2010-1-1', end='2020-9-6')

stock_symbols = ['AAPL','MSFT','AMZN']
stock_histories = {}
for symbol in stock_symbols:
    stock_histories[symbol] = stock_get_stock_data(symbol)
this would be considered more conventional python style
wet jasper
ok gimme a min to understand 😄
import yfinance as yf


def get_stock_data(currentStock):
    #define the ticker symbol
    tickerSymbol = currentStock

    #get data on this ticker
    tickerData = yf.Ticker(tickerSymbol)

    #name
    #name = 'tickerDf'+currentStock

    #get the historical prices for this ticker
    globals()['tickerDf'+str(currentStock)] = tickerData.history(period='1d', start='2010-1-1', end='2020-9-6')
    #print(name)


stocks = ['AAPL','MSFT','AMZN']
for currentStock in stocks:
    get_stock_data(currentStock)
thats the solution i got currently
ok i think i understand your code: you are creating ONE dictionary instead of me storing data in each data frame. and now i can call each individual stock from the dictionary like stock_histories['AAPL'] and can work with that, right?
@desert oar
desert oar
yeah please do not use globals() like that
ever
yes exactly that is the idea
messing around with globals is counter to the basic language design
python functions are meant to be lexically scoped and you are meant to pass data out of a function by returning things
i can't think of any language where i would advocate for creating global variables like that, even dynamically-scoped languages like a bash script
wet jasper
ok thank you 😄 i started this week with python and im trying stuff, i found this "globals" on stackoverflow ^^
desert oar
basically, there's (almost) no good reason to do it and there are many good reasons not to do it
@wet jasper have you programmed in other languages before?
wet jasper
not much, i had 1 semester in C in a non computer science degree course and a bit html/javascript
desert oar
i see
wet jasper
my idea is to import a lot of stocks and vizualize and analyse them, as im learning python. What do you think is a good method of importing data? I researched websites like yahoo finance and quandl. Do you think there will be a problem like with requesting data too frequently?
@desert oar
tidal bough
I think there's a commonly used Python API for getting stocks
tidal bough
I think it was Alpha vantage that I saw used once, but now that I look at it, it's uhh, not good apparently.
here's an article though: https://medium.com/@andy.m9627/the-ultimate-guide-to-stock-market-apis-for-2020-1de6f55adbb
wet jasper
thank you thats cool
wet jasper
https://finnhub.io/docs/api#crypto-candles
import requests
r = requests.get('https://finnhub.io/api/v1/crypto/candle?symbol=BINANCE:BTCUSDT&resolution=D&from=1572651390&to=1575243390&token=')
print(r.json())
like this i get a json. a json is like a dictionary in python. do i understand that right? what are my options working with that json? i learned using a Data Frame in a Tutorial, which is easier to use to visualize data. Would i want to convert that json into a Data Frame?

Finnhub - Free APIs for realtime stock, forex, and cryptocurrency. Company fundamentals, Economic data, and Alternative data.
desert oar
json is a data format
tidal bough
@wet jasper Once you do r.json(), the JSON is converted into a dict. That's everything you need to know 😛
desert oar
you have numbers, strings (text), "null", true/false, arrays which correspond to lists, and objects which correspond to dicts
so its wont always be a dict
tidal bough
that's true
desert oar
but yes usually json data corresponds to a dict in python
tidal bough
but people always get confused when I say "dict/list/some combination of them" for some reason 😅
desert oar
fair enough
@wet jasper json data doesn't always correspond to a table (i.e. a dataframe)
a dataframe is like an excel sheet
json data can have a variety of different structures
but if you can "flatten" the json data into certain formats, then you can make a dataframe out of it
wet jasper
but is my general idea right? import the "json" format and then convert it? the json data look weird to my
desert oar
yes
wet jasper
my idea is to get something like this in the end:
desert oar
you'd need to read the documentation for any particular API to see what the data format is
wet jasper
formatoptional
By default, format=json. Strings json and csv are accepted.
desert oar
where do you see that
wet jasper
Finnhub - Free APIs for realtime stock, forex, and cryptocurrency. Company fundamentals, Economic data, and Alternative data.
on the website
here if you dont want to visit
desert oar
i see. CSV might be better if you want to just load it into pandas
but they dont provide a lot of detail here
and no information on the CSV version of the response
{
  "c": [
    217.68,
    221.03,
    219.89
  ],
  "h": [
    222.49,
    221.5,
    220.94
  ],
  "l": [
    217.19,
    217.1402,
    218.83
  ],
  "o": [
    221.03,
    218.55,
    220
  ],
  "s": "ok",
  "t": [
    1569297600,
    1569384000,
    1569470400
  ],
  "v": [
    33463820,
    24018876,
    20730608
  ]
}
you see this output example?
desert oar
because you request the resolution
so if you say resolution=D this will be daily i guess?
docs arent very clear
desert oar
importing?
desert oar
yes. it says in the documentation that you need to specify the resolution
wet jasper
im confused now 😄
import requests
r = requests.get('https://finnhub.io/api/v1/crypto/candle?symbol=BINANCE:BTCUSDT&resolution=D&from=1572651390&to=1575243390&token=')
print(r.json())`
if i do this i get ```JSONDecodeError: Expecting value: line 1 column 1 (char 0)
how would i integrate the resolution there? or you mean i need to specify the resolition first when using the dataoh wait nvm
the resolution is set to D in the website link already ok ok
desert oar
that means the response didn't have valid JSON data in it
as a matter of good practice, you should check to see if the .status_code of the response is 200 (success)
if it's not 200, the .reason attribute will usually provide some kind of error message
e.g. when i don't provide a valid token it says 401 and the message tells me that i'm unauthorized
also that doc shows bad habits using the requests library
the .raise_for_status() method can be helpful here
for example https://repl.it/@maximum__/finnhub-example
 wet jasper
you mean like this? print(r.status_code) this gave back 429
desert oar
(note that you should not share API tokens with other people. they are equivalent to passwords.)
yeah
so check r.reason to see what that 429 means
wet jasper
Too Many Requests
xD
rip
as i understood correctly these websites always want me to register on their site and do that with the API key right?
desert oar
yes
check out the example code i posted. i added some comments to help explain what's going on
i also recommend you look into some more structured learning material and not just google/stackoverflow
https://dabeaz-course.github.io/practical-python/
http://automatetheboringstuff.com/
either of these should be good
Practical Python i think is better, but Automate is a classic
wet jasper
alright let me check the code and try
thanks yes i defintely need practice 😄
btw what could people do with my API key, other than using the data from the website with MY KEY?
velvet thorn
btw what could people do with my API key, other than using the data from the website with MY KEY?
@wet jasper that's basically it?
but it's a big "basically"
e.g. imagine you pay for an API that lets you send mails at a certain cost
if someone had your API key they could spam people with emails that came from you
and you would get charged for it
wet jasper
ok yeah i see, only if somebody gets my API key to sensitive data
desert oar
or get you banned for TOS violations...
velvet thorn
yeah, that too
desert oar
just take it for granted that you should treat API keys like passwords
velvet thorn
and in particular, it's a good practice not to have API keys in code
but to load them from some external source (usually an environment variable)
the number of people who naively upload their code somewhere with their API key still in it is way too high
desert oar
(not every password is equally important)
wet jasper
ok i understand 😄
but to load them from some external source (usually an environment variable)
@velvet thorn how would that look like?
velvet thorn
example:
import os

try:
    key = os.environ['API_KEY'])

except KeyError:
    print("Couldn't get API key from environment. Did you forget to set it?")
    raise
yeah but then they have to know how to use env vars
and those can leak anyway, messy business
wet jasper
i feel reading from a file is safer 😄
velvet thorn
and those can leak anyway, messy business
@desert oar what kind of leakage are you thinking of
desert oar
well its more of a "you got pwned anyway" situation
more practically, managing env vars can be annoying
velvet thorn
hm
desert oar
(non root users can typically see env vars from other running programs, which might matter in some multi user contexts)
velvet thorn
oh
desert oar
but yeah without a "mature" dev setup env vars are a pain
velvet thorn
I guess we use them in different situations
wet jasper
@desert oar in your code you had this: py 'from': '1572651390', # 2019-11-01 23:36:30 how do you convert that timestamp?
desert oar
imo its easier to just write your key to a file like api-key.txt:
asdfjkl123559
and read it like this in python
with open('api-key.txt') as fp:
    api_key = fp.read().strip()
the .strip() makes sure there are no extra space, tab, line break, etc. characters at the start or end
velvet thorn
fair enough
desert oar
!e ```python
from datetime import datetime
dt1 = datetime.fromtimestamp(1572651390)
print('DateTime object constructed from POSIX timestamp:', dt1)
ts1 = dt1.timestamp()
print('POSIX timestamp recovered from DateTime object:', ts1)
@desert oar :white_check_mark: Your eval job has completed with return code 0.
001 | DateTime object constructed from POSIX timestamp: 2019-11-01 23:36:30
002 | POSIX timestamp recovered from DateTime object: 1572651390.0
!e ```python
from datetime import datetime
dt1 = datetime.strptime('2019-11-01 23:36:30', '%Y-%m-%d %H:%M:%S')
print('DateTime object constructed from text:', dt1)
ts1 = dt1.timestamp()
print('POSIX timestamp recovered from DateTime object:', ts1)
oh heck what did i do
wet jasper
what is the benefit from writing it in that format? if i ever want to use the real date i will always have to convert it...
desert oar
!e ```python
from datetime import datetime
dt1 = datetime.strptime('2019-11-01 23:36:30', '%Y-%m-%d %H:%M:%S')
print('DateTime object constructed from text:', dt1)
ts1 = dt1.timestamp()
print('POSIX timestamp recovered from DateTime object:', ts1)
@desert oar :white_check_mark: Your eval job has completed with return code 0.
001 | DateTime object constructed from text: 2019-11-01 23:36:30
002 | POSIX timestamp recovered from DateTime object: 1572651390.0
had the arguments flipped
@wet jasper the benefit is that this is how the API requires it
why does the api require it? because internally date/time things are usually stored as floating point numbers
so they dont want to screw around with parsing timestamps
they just want the number as-is
wet jasper
ok makes sense, its easier for them to store
desert oar
it's more that it's easier for them to validate the input
and they have to do less conversion
they would store it in that format no matter how the received the input
wet jasper
ok i see
so if people import data, they always also have a function that is converting the date right?
desert oar
not always, some libraries (like pandas) are smart enough to convert common formats
or they give you tools to convert a variety of formats without too much difficulty
wet jasper
resp_df['t'] = pd.to_datetime(resp_df['t'])
something like this?
thats pretty accurate xD
wait
and its wrong aswell
desert oar
i think to_datetime usually is meant for use on text ("strings")
im actually surprised it worked on the numerical data
wet jasper
what else would you use?
resp_df['t'] = pd.to_datetime(resp_df['t'], unit='s')
this somehow gave me the date but without times lol, even tho unit= s is for seconds... this is weird
desert oar
oh, because the default unit is "ns"
nanoseconds
good to always read the docs 😉
it's not the date without the time
it's just not showing you the time because that would take up too much space
wet jasper
resp_df['t'][0]
Timestamp('2019-11-04 00:00:00')
yeah makes sense
but why did it show the date 1970 so accurate above?
and cuts off a 00:00:00?
desert oar
the 1970 was from when you used nanoseconds
because you didnt set unit='s', it used the default which is unit='ns'
so all of your timestamps were in nanoseconds starting from 0
and 0 traditionally is 1970-01-01 00:00:00 UTC
i.e. midnight on jan 1st 1970 in the UTC/GMT time zone
wet jasper
ok thanks 😄 there is a lot of stuff to learn in computer scince 😄 i guess you studied that?
wet jasper
ok yeah i guess we got so many ressources with the internet today, everybody got access 😄
'to': '1599436542', #07.09.2020 um 01:55:42 Uhr
i set the date to today and it only gives me dates until 4th, why is that?
desert oar
good question. maybe they don't support dates that are so close to the present
might have to check the docs, or verify that you set the date correctly
wet jasper
as im trying to find whats the problem i restarted the code to get new data and it doesnt stop loading
desert oar
@wet jasper did you do something weird like trying to load a ton of data or print a ton of data?
wet jasper
nope its basicly the code you sent above more or less
only thing i did is "restarted the kernel"
in jupyter notebook
desert oar
maybe i did something wrong
or its a huge amount of data
try a smaller date range
and don't print the whole json response
wet jasper
let me try
but i mean it worked before
and what i changed is loading the api key from a txt file
ok i restarted everything and it works now ^^
 indigo obsidian
Hi, everyone. Total noob here working on a assignment for an online workshop: Basically I'm given a dataframe of companies, identified by their 'permno' with their stock 'price' and various other information on various 'date's. I need to construct a new dataframe with each unique 'permno,' it's last available 'price', the 'date' of that price. I've managed to do so using the following:
df_latest = df.groupby('permno')['date'].max().to_frame()
df_merge=pd.merge(df_latest, df, how="left", on=("permno","date"))
And then I would just have to remove the extraneous columns of data. But is there a more elegant way of doing this without using merge?
indigo obsidian
oh ffs. nvm they failed to mention that all the dates for each permno was already sorted in ascending order. literally all i had to do was
df_latest = df.groupby('permno').tail(1).loc[:,['permno','date','price']]
you mean week (as in "some months have 5 weeks and some have 4 weeks")?
A simple Google search yielded me this: https://exceljet.net/formula/get-month-name-from-date
afterwards you can use AVERAGEIF
read the link I posted above
indigo obsidian
i think what he means is he needs to calculate the mean correctly, and some months will be /4 and others are /5 based on the number of weeks
hasty grail
AVERAGEIF does that correctly, no?
indigo obsidian
@hasty grail oops, i didn't see the AVERAGEIF part in your first response. i should sleep
https://exceljet.net/formula/average-by-month

To average by month, you can use a formula based on the AVERAGEIFS function, with help from the EOMONTH function.
indigo obsidian
Does it actually have to be a function? can't you just use a pivot table?
 hasty oriole
Hey everyone. I'm trying to write a piece of code that takes a known column of a dataframe, and generates a new column with values based on the following values. I see how I can do this with a double loop, repeatedly getting values for indexes, but this seems inefficient, especially as I'm working with columns with millions of elements.
To make it more clear:
I'm looking to create a column where, for example:
new_column[i] =function_of(existing_column[i:i+15])
indigo obsidian
so... something like
df.loc[0, 'column_new'] = df.loc[0, 'column_old']
for i in range(1, len(df) -15):
    df.loc[i, 'column_new'] = df.loc[i:i+15, 'column_old'].function()
???
velvet thorn
Hey everyone. I'm trying to write a piece of code that takes a known column of a dataframe, and generates a new column with values based on the following values. I see how I can do this with a double loop, repeatedly getting values for indexes, but this seems inefficient, especially as I'm working with columns with millions of elements.
@hasty oriole use window functions
hasty oriole
Aha, perfect! thought there might be something like that, but couldn't find it through googling.
velvet thorn
yeah
the most common instance of this is what you might have heard called a "rolling average"
earnest forge
I did'nt clearly understand what rolling does
https://pandas.pydata.org/pandas-docs/stable/reference/api/pandas.DataFrame.rolling.html
are there any sources explaining this with all corresponding terms, such as window
 merry ridge
What do you not specifically understand about windows?
earnest forge
i dont even know what that means
earnest forge
what are you trying to do?
lapis sequoia
a bubble sort I suppose 
 opaque isle
boxplot does give the median,25% and 75% values. so is it appropriate?
earnest forge
box plots are usually used for group data
not ordinal
for example, efficiency of 3 top football players
 sage palm
Why can't Rodeo (IDE for DS) not be downloaded from the website?
I thing this very odd!
desert oar
Is that still being developed?
They probably want you to use Pip to install it, I assume they have installation instructions posted somewhere
 gentle sleet
based on World Bank data (PKB per capita) i would like to calculate avrage pkb from 1960 to 2019
^ why it does not search by row
and gives only 1960
i mean it should return number
like this 🙂
 pallid mica
Hi there im just learning to use matplotlib and wondering what I can use to change the increments on the X axis, right now its by .5 and I want by 1s. Thanks in advance
indigo obsidian
@pallid mica basically you can explicitly state where and how often you want your tick marks with plt.xticks or plt.yticks. So in your case:
plt.xticks(np.arange(min(x), max(x)+1, 1.0))
 safe sparrow
I want to extend the Dense layer in Keras, and add a trainable function BEFORE the normal weights and biases
So the input (x) gets a function applied (^y, where y is trainable), and then insert the x^y value into the normal Dense layer
 slate hollow
hey so for matplotlib.pyplot why do i have to call plt.show()? can't it just pop up automatically for me?
and yes i did ask this in #internals-and-peps, just asking here bc it's the more appropriate place
so i take it when you call plt.show() it like wipes all your changes and actually puts em on the screen?
velvet thorn
no, the actual documentation for the function
slate hollow
then no
velvet thorn
okay, you should look at it
because in this case I believe the documentation actually answers your question
 misty mica
Anyone able to clear up confusion on how to filter a dataframe using a column that contains a list? For example, when a dataframe column is not a list, I can filter with loc:
dfFiles = dfFiles.loc[dfFiles['file_ext'] == extFilter]
but if the column stores a list I can't just add an index:
dfFiles = dfFiles.loc[dfFiles['file_name_split'][1] == typeFilter]
In the above, the field "file_name_split" holds a list like: ['DIS', 'Xmorph', '20200509'] and I'm trying to filter based on the 2nd element of the list
velvet thorn
dfFiles.loc[dfFiles['file_name_split'].str[1] == typeFilter]
use snake_case, not camelCase in Python
and
why are you storing lists in DataFrames anyway?
that is generally bad practice
@misty mica
misty mica
I saw reference that suggested .str[1] but it returned an unexpected value, re-checking.
Yeah for some reason print(dfFiles['file_name_split'].str[1]) returns ' in every row even though the lists are always elements like my sample.
It's an unknown number of words in the file names I'm ingesting, so kept the list rather than splitting to n columns
indigo obsidian
that list element you're trying to find, does it only appear in the second spot if it appears at all? or can it appear in a different position and you want to filter those out?
velvet thorn
.str[1] should work
misty mica
are you sure they are
lists
@velvet thorn That was the issue, they show up as[SPY, WeeklyAdjusted, 20200509]but were actually strings. That's why.str[1]was doing nothing.
velvet thorn
yeah, that was my guess
misty mica
thanks!
What would you do as an alternative to storing a list in a dataframe column in a situation where the number of items is unknown?
velvet thorn
depends
on a few things
for example, the max number of columns
and how many rows you have
misty mica
In this case, it's whatever someone happened to name a file, I replace any non-alphanumeric values with a and then split on that space. In general people don't go crazy on file names so can't imagine it would ever be more than 10, but don't want to enforce a limit. I suppose I should probably just be using regex on the full file name when I need to, and splitting to the expected columns when it conforms to a certain naming convention.
indigo obsidian
since it's in a string, if the value you're trying to find only ever appears in the second position you could apply a lambda function
df[df['file_name_split'].apply(lambda x: 'typeFilter' in x)]
df[df['file_name_split'].apply(lambda x: 'typeFilter' in x)]
@indigo obsidian that's not what they want...
typeFilter is a variable.
misty mica
@indigo obsidian the .str[1] with loc did the trick, it was only a string because I had wrapped the split in str() and didn't catch it, so I just had to correct that flaw.
velvet thorn
In this case, it's whatever someone happened to name a file, I replace any non-alphanumeric values with a
and then split on that space. In general people don't go crazy on file names so can't imagine it would ever be more than 10, but don't want to enforce a limit. I suppose I should probably just be using regex on the full file name when I need to, and splitting to the expected columns when it conforms to a certain naming convention.
@misty mica also, what kind of operations do you need to perform?
desert oar
@velvet thorn I don't agree that it's bad practice, but it's definitely a more advanced technique
velvet thorn
@velvet thorn I don't agree that it's bad practice, but it's definitely a more advanced technique
@desert oar generally in the sense that if you don't know what you're doing, you probably shouldn't
desert oar
I actually wrote a hacky extension dtype type for it once, im sure you could write a better one backed by Arrow
misty mica
A time and a place I'm sure, but I think it makes sense to question whether it's helpful/necessary in my case.
desert oar
Valid
velvet thorn
I do agree that there are uses for doing such things