#data-science-and-ml
1 messages · Page 245 of 1
 cosmic lynx
 grave frost
How complex is the game? Like if you spam random keys, does it give you a chance to win?
cosmic lynx
You type in where it goes, and it places an X there, that’s it.
It does write out the grid though.
grave frost
I don't get it
cosmic lynx
I have it set up to say “what X co-ordinate” “what Y co-ordinate” then place it on a 3x3 grid and mark an “x”
grave frost
That's the whole game?
cosmic lynx
Yes, so far.
grave frost
What's the whole game look like in the end?
cosmic lynx
a 3x3 grid printed on the shell
Maybe I’ll make it have visuals you can click but I’m already having a hard time with the guts of how it works so that is later stuff.
 lapis sequoia
should i create a scientific calculator using numpy
 rotund fractal
can anyone here help me with finding probability of y as x increases?
 warped geyser
df.query('quest == "Wanted"')
This returns all the records for the value.
How to get value of a specific column?
grave frost
Well, someone had previously recommended me not to use BERT for seq2seq purposes. Can that person clarify why I shouldn't use BERT for that matter?
rotund fractal
need some guidance with a time series analysis of 1m stock data
grave frost
@rotund fractal What is the problem you are having? We cannot start answering a question until we know what is your query...
 quick crown
For linear regression,how do I identify relevant variables to include??
grave frost
@quick crown What do you mean by "relevant" variables?
quick crown
Like variables that actually makes an impact on the prediction
 pearl crystal
First, you should clean your data and then remove redundant independent variables (features)
quick crown
How would i know something is redundent?
pearl crystal
One factor you can use to detect redundant features is "VIF"
Variance inflation factor=> You want to remove multicollinearity between independent features.
You can use simple correlation matrix and VIF (more suitable)
If a feature is described with linear combination of other features, it will have high VIF (>=5)
 warped thistle
@quick crown i like ur name. a person of culture
 red fulcrum
What would the best way to go about checking if somebody's face is in an image given an example photo?
 jovial gust
of those doing data science here, have anyone thought of replacing pyspark with dark or ray?
 ancient lichen
is anyone here familiar with using machine learning to generate things? like using datasets of recipes to generate a new recipe?
 flat quest
uh, ur best bet would be GANs, but it probably won't be anything stellar @ancient lichen
ancient lichen
ok
 tidal sonnet
For data science, which one would be more critical, applied maths or pure maths?
 bitter harbor
i'd argue it depends on what you're doing
bitter harbor
thank you so much for getting into the math ❤️
ml is mostly a mix of linear algebra + stats
^ the logic behind it
tidal sonnet
🤔
bitter harbor
but what else you need to learn depends on how you use it/what you use it for
tidal sonnet
i'm only allowed to choose 3 subjectsss
pure/applied Maths, physics and computer science is what i decided would be most needed
 pastel compass
anyone have any cool project ideas for cnns that go beyond image classification?
bitter harbor
i'm only allowed to choose 3 subjectsss
pure/applied Maths, physics and computer science is what i decided would be most needed
those are the best subjects imo 😉
bitter harbor
I mean personally I find pure a lot more interesting
but then again I'm someone who learns about topology for fun..
tidal sonnet
🤔
 odd yoke
like 80% of my coworkers are applied math phd if that means anything to you, and their job title is "data scientist"
 odd yoke
ok, actually 80% applied math and physics phd
tidal sonnet
interestingggg
red fulcrum
while we are on math, I am a highschool student who is teaching myself a lot of math to have a better understanding of ml, currently working on calc, and plan on focusing on RL what all math do i need to learn?
bitter harbor
like I said it's mostly linear algebra and statistics
there's a bit of calc involved but it's next to nothing
red fulcrum
I plan on doing research in the future so i want to have a really good understanding of what is actually happening and why
lapis sequoia
@bitter harbor Are u learning computer science?
bitter harbor
if you want a good place to start i'd suggest watching 3b1b's videos on ml and la
I'm actually heading to uni in a couple months
but I'm mostly self taught
since like march
bitter harbor
just the general logic/concepts of nn's
tidal sonnet
nn is neural networks correct?
tidal sonnet
?
red fulcrum
its kinda like a quirky venn diagram
bitter harbor
kinda looks like a heart
red fulcrum
u right
 tidal bough
this is such a weird one, lol
it looks like it says that Machine Learning is different from all the other things in the diagram.
also, black text on a transparent background can backfire sometimes.
tidal bough
yeah, but it looks like one
bitter harbor
that's a weird looking chart ngl
^
 rapid ridge
I feel like creating a massive api for predict cybersecurity by mapping the whole internet , but is this legal / proofiteable?
rapid ridge
^ that's not data sci
@bitter harbor why not data sci? isnt this chan for big data?
bitter harbor
I'd consider it more networking imo
but you're going to come across a couple major issues
1 - the internet is huge (~18 petabytes/~18500 terabytes)
2 - there are some sites (personal/professional/governmental) that you won't know exist / won't be able to find
++ the whole security thing
rapid ridge
I was trying to mostly to start off from twitter, rss, facebook , google search , bing, shodan , apis , github , tech blogs, and more much data , but is this profiteable as it seems or to be developmeed?
bitter harbor
I can't think of a reason to do it, but you're not talking smaller companies, even just mapping out facebook would be a challenge
- new posts/sites/data are being created contantly
 modest rune
The more I use python for semi-large datasets, the more I dislike it.
95% of the time, when something is too slow in python, the recommended solution is to install a library that will do the math in C.
And... then, today, I was using scipy to run a cumulative distribution function about 10,000 times... (needed for backcalculating the implied volatility of the entire netflix option chain).
I used scipy.stats.cdf(), and the whole thing took 3 seconds. Not wanting that 3 second delay, I googled... ways to speed of spipy cdf and there was a github question in which someone answered... have you tried scipy.special.ndtr().
Well, scipy.special.ndtr() does the exact same thing as scipy.stats.cdf(), except that ndtr is simpler and doesn't allow you to set the boundary conditions... yet, ndtr, took 0.3 seconds to run... 1 order of magnitude faster.
Would my coding experience be so much simpler if I switched to C++? Or some other language that is faster?
bitter harbor
not simpler no
imo python's better for it not because it's quicker, but because it's already done
you could %100 implement it in c++/c/basic, but it's already been written + tested
modest rune
I have a hard time believing that python is one of the only languages with copious amounts of data-science library availability. Seems like an impossibility really, considering how slow python is... my guess is that I am only using python at this point because it is such a beautiful syntactical language and I feel in love with it quickly.
odd yoke
it's not the only language with a lot of libraries, but it's the one with the most of them
modest rune
What language do big data stock analysis programmers use?
odd yoke
and as you said, performance critical code is written in C/C++/Fortran, which is then used within python
modest rune
it's not the only language with a lot of libraries, but it's the one with the most of them
@odd yoke
Is it though? I have an electrical engineering background, so I am not that well informed about computer science topics, but... C++ has been around much longer than Python, my assumption it has the biggest set of libraries.
I realize python is super popular, especially in the open source community, so maybe I am wrong. I guess I will see if google has some insight into this.
odd yoke
for data science, python has no equal in terms of sheer amount of libraries by far
really the fact that C interop is so easy in python is what makes it popular
like, naive C is definitely worse than properly written numpy code in most cases, but it's also more annoying to write
so you either write python directly, or actually go all the way into C or C++ or w/e language and write properly parallelized code, which requires a lot of knowledge of how simd works, maybe you'll need to learn lapack/blas etc
modest rune
Hrmm... I had assumed, that unless I was intentionally writing my numpy, pandas, scipy code to use multiple cores, that I wouldn't be getting any multi-core speed improvements.
odd yoke
numpy does parallelization for you completely seamlessly
modest rune
Which, interestingly, is an efficiency I haven't tried to explore yet.
odd yoke
(almost seamlessly)
modest rune
numpy does parallelization for you completely seamlessly
@odd yoke
Yeah, but, do I need to set some flags or setting to make that happen?
odd yoke
nope
modest rune
Oh, so, if I am vectorizing, numpy is probably leveraging multiple cores.
That would explain the 1,000 X or more speedups I often see when I vectorize properly.
What are your thoughts on this...
https://learn.g2.com/big-data-programming-languages#:~:text=“Java is probably the best,most tested and proven language.
“Python is pretty simple and easy to learn, but tends to be a bit behind the times. New features are usually offered to Java first with Python not getting those features for a few updates.”
Java is by far the most tested and proven language. It has a huge number of uses and can run on almost every system – easily the most versatile language, so hugely useful for big data. Being portable, investing in Java is long-term beneficial for developers. As Oracle's Ron Pressler said, Java is 20-something years old. It will probably be big and popular in another 20 years. We have to think 20 years ahead.

Java has vast community support like Stack Overflow and GitHub, and while it may not be as streamlined as Scala or as powerful for data as R, it is still far better than any other language.” ```
What are the most popular programming languages for analyzing and operationalizing big data? Experts discuss the features of Python, R, Java, and Scala.
bitter harbor
you ever looked at hello world in java?
might be quicker but it certainly is a lot more complicated
odd yoke
java is a very big language in data engineering as well
but it's not as general as python
tbf, comparing "hello world"s is not a productive way to compare languages
modest rune
23 years ago, the CS classes needed for my degree were in Java. Back then, I liked the language well enough.
Haven't used it since then.
odd yoke
static typing is a huge benefit for big codebases
bitter harbor
tbf, comparing "hello world"s is not a productive way to compare languages
No you're completely correct, but my point is Java's not known for it's simplicity compared to other low-level languages
odd yoke
it's important to note that java is not commonly used for all of "data science", since it's what you were referring to in your initial question
and even in data engineering, python also has bindings for most libraries cited in that paragraph
lapis sequoia
Guys suggest me a project to do with numpy
Give a easy to project as well because I'm not advanced in..
odd yoke
Imo it's generally not a great idea to use a tool as the basis for a project, rather than the opposite
If you're just starting out with numpy, and don't have an actual project where you can put it at use, i'd say play with it in the interpreter, see how it behaves, do small benchmarks comparing different methods of writing code with it etc
lapis sequoia
Oh ok,I'm only learning because opecv require
modest rune
it's important to note that java is not commonly used for all of "data science", since it's what you were referring to in your initial question
@odd yoke
My question was really, if I were to better phrase it... would I have been better off writing my stock option analysis application in another language? Because making python fast has been odd and seemingly silly... Or, was python the best choice? Seems like maybe Java could have been a better choice? With my main complaint about Python being the truth that if python is slow, just find a library that does exactly what you want in C and it will be fast or vectorize which is a convoluted way of saying... write your code in such a way that we can send huge chunks of memory to C and crunch the numbers, that way we can avoid looping in python.
 unborn palm
A lot of data science is experimentation and quick iteration. Python excels in that area because of the style of coding, the APIs to the libraries, and available tools like iPython notebooks.
odd yoke
Otherwise really it's just a library to manipulate numerical arrays
modest rune
A lot of data science is experimentation and quick iteration. Python excels in that area because of the style of coding, the APIs to the libraries, and available tools like iPython notebooks.
@unborn palm
Good point
odd yoke
write your code in such a way that we can send huge chunks of memory to C and crunch the numbers, that way we can avoid looping in python
I mean, yeah, that's exactly what you should do
lapis sequoia
Hmm yeah if I learn the basics of numpy should be able learn opencv?
odd yoke
yes and no, it'll help you interact with the objects opencv uses for representing images
but that's about it
lapis sequoia
I Just wanna to make a face- recognition
So you saying aleast I need to be advanced in numpy to be good at opencv
odd yoke
no I'm saying numpy is important but it's only the first step
it's just that opencv returns numpy arrays everytime it returns an image
so you better know how to use them, at least superficially
lapis sequoia
Oh alright thanks for the information
bitter harbor
^ I'd say I know numpy, but there are some functions I've never used/looked at
modest rune
Another situation that is rubbing me the wrong way... I am using one of scipy's root solvers, optimize.root_scalar(bs_price, bracket=[0.0001,10.0], xtol=0.0001, rtol=0.0001, method='brentq') to backcalculate the implied volatility of options. Which ends up running anywhere from about 4 to 40 cumulative distribution functions (as part of running the black scholes model), per root solve. I can't vectorize that because (a) bs_price is a function I wrote in python and (b) the input to bs_price is the output of the previous execution of bs_price. So, it is slow. But, had I written the whole thing in C, I wouldn't even need to worry about vectorization.
Sorry... I should quit complaining, I really do love python.
Maybe, I am hoping my complaining will result in one of you providing me with some insight that I hadn't thought of before.
I'm constantly haven't to view the solution to things from a vectorization perspective, which in my opinion is totally not an intuitive way to look at things and is sometimes impossible.
Maybe there exists a python library that somehow lets you mix python and C... what if I could write something like this psuedocode...
# The whole thing is python and interpreted by python compiler

# C Psuedocode
for (i=0;i<10000;i++)
{
  ### Start Python
  function(x)
  ### End Python
}
that way I could avoid vectorizing in situations where it is either impossible, or unnecessarily convoluted.
flat quest
even if you had written the thing with c++, you'd need to leverage multiple cores to make it faster.
And writing code to leverage multiple cores is more difficult than single core. It's not like C/C++ magically figures out how to utilize multiiple CPUs and GPUs.
Python's mainly used because it has the ease of modern high-level langs (ML research profs aren't always the best programmers), while being able to leverage the performance of C++.
modest rune
I agree with the multi-core argument.
flat quest
As for mixing python and C, it's sort of possible using cython.
But vectorizing is unavoidable. Either on a higher level or lower level, operations need to be vectorized or everything's too slow.
odd yoke
sorry i can't read one message
modest rune
But vectorizing is unavoidable. Either on a higher level or lower level, operations need to be vectorized or everything's too slow.
@flat quest
OK, I'll read up on cython. I am pretty sure I remember someone telling me once that maybe I should be doing everything using cython, but at the time I didn't investigate that claim.
I am not sure I follow your statement operations need to be vectorized or everything's too slow.. It seems to me that vectorization is only needed because the data that needs to be crunched needs to be packaged together nicely so that it can be passed as one big chunk to C, so as to avoid doing any execution within python.
Am I correct that vectorization is only needed in slower languages?
I guess, vectorizing probably makes it easy for compilers to seamlessly leverage multiple cores.
odd yoke
no, "vectorization" is not only needed in slower languages, in fact, pretty much only low level languages have API interacting with the cpu for it
modest rune
in fact, pretty much only low level languages have API interacting with the cpu for it
@odd yoke
Can you rephrase that, I am having a hard time understanding what you mean.
odd yoke
there are instruction sets for doing operations on arrays faster by running multiple the same operation simultaneously on bigger chunks of data
such instruction sets are generally called SIMD, and they are used by pretty much every array library worth anything
including numpy
modest rune
OK, that makes sense to me, I had to design a CPU and ALU once and I can definitely understand from that that there would be gains to be made through vectorization because it would fit more nicely in how processors naturally want to crunch data.
odd yoke
these are basically special cpu instructions, so it's extremely low level
modest rune
I imagine, with multiple cores and GPUs, the benefits of vectorization have only multiplied.
odd yoke
SIMD isn't inherently multithreaded either btw, I'm not even sure if it commonly is
modest rune
thanks for all of the detailed replies, this has been very informative for me.
 halcyon sun
Hi I hope this is a good place to ask, since Anaconda is related to data science. My friend suggested I learn Python through, this https://github.com/jerry-git/learn-python3, And also to install anaconda. I've got anaconda installed and im running the tutorial in jupyter. I just don't know how anaconda is related to this and how can I incorporate it into into my learning expierence with jupyter.
 native patrol
@modest rune look into numba as well for perf gains
modest rune
@modest rune look into numba as well for perf gains
@native patrol
Will do, thankyou for the suggestion.
modest rune
@native patrol Thanks for the the numba suggestion, I just finished watching a few youtube videos about numba and cython. Both libraries would solve a lot of my problems, but Numba looks to be much more powerful and easier to use. I am curious how well numba works with custom pandas apply functions. Can numba vectorize those situations? If it can, that would be really cool.
odd yoke
numba is only aware of numpy, you'll need to go back and forth between pandas and numpy
modest rune
this article seems to disagree with you, or, I am misunderstanding the article or I am misunderstanding you...
https://towardsdatascience.com/what-can-you-do-with-the-new-pandas-2d24cf8d8b4b#:~:text=a)%20Making%20Pandas%20faster%20using%20Numba&text=The%20apply()%20function%20can,1%20million%20rows%20or%20greater).
The apply() function can leverage Numba by just specifying the engine keyword as ‘numba’. This makes executing functions easier for datasets which are large in size (1 million rows or greater).
Medium
The Pandas 1.0.0 version is out. These updates have long been awaited not only by the Python community but also by the Data Science…
This article makes a similar claim:
https://medium.com/swlh/6-ways-to-significantly-speed-up-pandas-with-a-couple-lines-of-code-part-1-2c2dfb0de230

Medium
I will review six tools that can boost your pandas code. For most of them just install the module and add a couple lines of code.
odd yoke
oh i didn't know it had that
 thin terrace
Is it true that we cannot compare the auc of two different models?
https://medium.com/@sidgoyal2014/limitations-of-auc-roc-technique-820e97a55b1d

Medium
As I had promised in my previous article, now, it’s time to complete our discussion on evaluation metrics for classification problems…
 hexed echo
hi guys, sorry if stupid question, does anyone by any chance know what distribution numpy random uses?
 desert oar
@hexed echo actually a great question, np.random.randn is uniform
@thin terrace that's an interesting article
the "limitations" section is not very well written, but i like the effort they put into motivating and constructing the ROC curve and the AUROC score
@molten hamlet maybe ask this in #algos-and-data-structs
 molten hamlet
desert oar
molten hamlet
desert oar
@thin terrace honestly i dont think they fully understand what they're writing either. maybe read this instead https://www2.unil.ch/biomapper/Download/Lobo-GloEcoBioGeo-2007.pdf
i think their concern is that 2 different models can make 2 very different sets of predictions and produce the same auroc score
and the big problem with auroc is that it only takes into account predictions on the positive instances
entirely ignoring predictions on negative instances
so you can have 2 models w/ the same TPR and FPR but wildly different TNR and FNR, with the same AUROC score
and that you can pretty freely permute the predicted values and the predicted probabilities and also get the same AUROC score
because there are lots of different curves that produce the same area underneath
maybe there's a more subtle argumen that i'm missing
 indigo steppe
hi,what are good sources for reinforcement learning in trading?i am familiar with the basic python syntax and concepts like loops,lists,tuples,if statements,classes ect
lapis sequoia
if i have a bunch of features like var1, var2, var3, var4, var5, and a response variable, how can i see what are the most important variables that contribute to the response?
 bold olive
Is there a way to visualize the results of a multiclass logistic regression classifier?
lapis sequoia
it's mainly categorical predictors that are being used vs a quantitative response
desert oar
yes, but what kind of model
linear regression? random forest? gradient boosting?
you can pretty much always use partial dependence though
lapis sequoia
i dont have a model rn. i guess my question is, is it possible to assess variable importance without building a predictive model?
desert oar
im a big fan of partial dependence
oh
you can do pairwise importances
e.g. compute the mutual information of each predictor and the response
but by definition those will not take the other predictors into account
for that you need a model. that's literally what a model does
lapis sequoia
ah so i have to construct a model
whats the difference between that and just using variable importance from a random forest
i assume random forest takes other values into account when calculating feature importance?
bold olive
@desert oar classification results with decision boundaries. I have multiple 3-class, 4-class and binary problems and want to visualize the outputs.
desert oar
feature importance in random forest specifically has to do with the reduction of the purity criterion due to splitting on that feature @lapis sequoia
so yes, kinda
because tree building is greedy, therefore the purity reduction will be somewhat dependent on the other features that are also being used to construct trees
lapis sequoia
ah right
desert oar
but probably not as dependent on other features compared to e.g. linear regression
lapis sequoia
okay so i have to build a random forest model? lol rip
lapis sequoia
i mean not random forest but i have to build some sort of model
desert oar
feature importances dont even really make sense without a model
a model is just a description of the relationship between inputs and outputs
@bold olive you can draw the decision boundaries in different colors or something, right?
bold olive
With the actual output values or random points?
desert oar
what do you mean
bold olive
As far as I know, it is only possible to draw a decision boundary with 2 or max 3 features for a 2D or 3D plot, correct?
Something like this.
bold olive
I used the top two PCA transformed features to get a visualization in the plot above.
But is there any other inherent way that some library provides?
desert oar
there are other dimension reduction techniques
but at some point you need to reduce the dimension
PCA, MDS, t-SNE, UMAP
bold olive
Right, so instead of PCA, other alternatives basically. But the method will be the same eh?
desert oar
same idea, yes
bold olive
I heard of a C-1 visualization (for C classes) that LogReg and LDA provides.
Wonder what that was.
bold olive
Yes, but in any case I think this is a good enough visualization already. I might try different reduction techniques and check it all out.
desert oar
beware some of them are very slow on big data
or might require complete distance matrices
bold olive
Right, thanks!
desert oar
you can use NMF for dimension reduction too on the right kind of data
bold olive
Ah, that's a bit tricky though.
thin terrace
@thin terrace honestly i dont think they fully understand what they're writing either. maybe read this instead https://www2.unil.ch/biomapper/Download/Lobo-GloEcoBioGeo-2007.pdf
@desert oar thanks, will check it out
 rare ice
How can I convert a Pyspark Dataframe into JSON AND do so in such a way that the output JSON is the exact same each and every time?
modest rune
I wonder if there is some sort of template you can create that your outputted json could conform too and be tested against to ensure correctness.
I am curious what the answer is to your question too.
desert oar
@rare ice pyspark + consistent ordering = why bother
you can save an array of rows
sort the dataframe first by row id or whatever, coalesce to 1 table, then save as json
maybe
or pull it into the driver node and save it with python's json.dump
what's even the purpose of this? seems like an XY problem
rare ice
@desert oar The purpose is for a snapshot style unit test. I have unit tests that perform an operation on a dataframe, and I have a snapshot of the results. If I cannot reliably produce the same output, then my snapshot test will fail.
If I perform operation 'foo` on a static input dataframe, I should get the exact same output each and every time.
desert oar
But why is the test dependent on row order
Because it's just comparing two file outputs verbatim or something?
rare ice
Yes. I am comparing the output of the test to a saved JSON file
desert oar
as far as im aware RDDs just arent meant to be ordered data structures
But you can sort the results of a specific query from a dataframe so idk
Did you try just sorting before saving?
Column ordering might also not be guaranteed
rare ice
I know my current method of dataframe to JSON conversion is not maintaining order:
from pyspark.sql import SparkSession, DataFrame
import json

my_df: DataFrame # Df after operation and to test

def dataframe_to_json_array(df: DataFrame) -> list:
  rows = df.collect()
  arr = [r.asDict(recursive=True) for r in rows]
  return arr

def json_dumps_default(obj):
  if isinstance(obj, datetime):
    return obj.isoformat()

def test_my_df(snapshot):
  json_arr = dataframe_to_json_array(my_df)

  snapshot.snapshot_dir = "snapshots"
  snapshot.assert_match(
    json.dumps(json_arr, sort_keys=True, default=json_dumps_default), "snapshot_my_df.json")
Currently looking at pysparks .toJSON() method as well as converting the pyspark dataframe into a pandas dataframe
desert oar
Wait what
Dont pyspark dataframes natively support json save format
df.orderBy('row_id').coalesce(1).write().format('csv').save('test.json')
Or whatever the right syntax is (on mobile rn)
rare ice
Yeah... You can write pyspark dataframes to JSON files easily enough. Converting them into a string of JSON that maintains order each execution is more challenging
From my reading of the pyspark docs, the dataframe .write() allows you to write a dataframe to a JSON file only, and not to a string variable
True, I could write it to a file and then read the JSON file using the standard json.load() method...
desert oar
It looks like your snapshot thing matches a json-ish object in python to a json file on disk?
What are you actually trying to test here?
rare ice
it matches a string to the contents of a file
desert oar
I see
Just try orderby before collect
See if that helps
Or convert toPandas and sort in the pandas df
Then .to_json to a StringIO
Instead of messing with collecting a list of RDDs like your code does
rare ice
from a quick glance at the pandas docs, it looks like pandas has some built-in ways to convert to json and maintain order
desert oar
Have you not used pandas before?
Pandas writing to json can be done row order preserving
rare ice
Mostly just used the pyspark dataframes, as I have mostly worked exclusively inside of a Databricks environment.
desert oar
@rare ice try .orderBy before .collect first
if that doesnt work, try pandas
df.toPandas().sort_values('a_column').to_dict(orient='records')
vs
[row.asDict(recursive=True) for row in df.orderBy('a_column').collect()]
should be pretty much the same thing
lapis sequoia
is there a way to measure association between like 100 categorical variables (both nominal and ordinal) and a continuous output
asking as a followup to the question i asked earlier today
 solid aurora
So I'm calculating the mean absolute deviation of a multi-dimensional numpy array
there's no numpy or scipy function to do that, so I need to implement my own
I've got a simple function working for 1-d arrays:
mad = lambda a: np.mean(np.abs(a - np.mean(a)))
but I need to figure out how I can give it an axis= parameter to let it work on multi-dimensional arrays
how would I do that?
i.e. if py mad([1, 2, 3, 4, 5]) == 1.2, then I want py mad([[1, 11], [2, 12], [3, 13], [4, 14], [5, 15]], axis=0) == [1.2, 1.2]
how would I do that?
somehow in it's current form it reduces a 2-d array to a single scalar ¯_(ツ)_/¯
ohhh I just pass an axis= to both np.means!
got it!
tidal bough
there's no numpy or scipy function to do that
@solid aurora that's actually questionable
modest rune
? - your edit cleared up my confusion
solid aurora
wait nvm what I just said only works for axis=0
@tidal bough so they have median absolute deviation but not mean absolute deviation in numpy
the developers of numpy on github said they don't intend to add a mean absolute deviation function
and I couldn't find it in scipy
again, only median absolute deviation
tidal bough
I was thinking that it's a special case of the mean error under the minkowsky metric, for p=1
but it seems they don't quite have that, either
so yeah, np.mean(np.abs(a - np.mean(a))) is probably the fastest way indeed
solid aurora
@tidal bough well that doesn't support working with multiple axes
and if I just pass the axis parameter to the means, it only works for axis=0
lapis sequoia
u wanna make this mad work with muti-dementaional array
tidal bough
What exactly doesn't support multiple axes?
solid aurora
hold on let me get you an example
modest rune
numpy.apply_along_axis()?
tidal bough
why'd that be needed?
lapis sequoia
@solid aurora like this?
lapis sequoia
yes
solid aurora
I think I need to fix the subtraction @lapis sequoia
how can I "subtract" along a certain axis
cuz by default you can only subtract shapes (p, q, r, ..., z) - (q, r, ..., z)
which is essentially axis 0
axis one would be (p, q, r, ..., z) - (p, r, ..., z)
tidal bough
uhm
In [151]: a = [[1, 11], [2, 12], [3, 13], [4, 14], [5, 15]]

In [152]: np.mean(np.abs(a - np.mean(a,axis=0)),axis=0)
Out[152]: array([1.2, 1.2])
ah, right, over the other one...
In [166]: np.mean(np.abs(a - np.mean(a,axis=1)[:,None]),axis=1)
Out[166]: array([5., 5., 5., 5., 5.])
so he give the mean and subtract the mean and a after that divide by how the total numbber of a
tidal bough
a - np.mean(a,axis=1) is doing (5,2) - (5,), which can't be broadcasted. So I do [:,None] on the latter, which just reshapes it from (5,) to (5,1).
solid aurora
mmhm ok
modest rune
does np.apply_along_axis(mad, 1, [[1, 11], [2, 12], [3, 13], [4, 14], [5, 15]]) not work?
tidal bough
Apply a function to 1-D slices along the given axis.
Execute func1d(a, *args, **kwargs) where func1d operates on 1-D arrays and a is a 1-D slice of arr along axis.
Hmm, wouldn't it be hella inefficient?
tidal bough
Like, it'd be applying the function to each element instead of vectorized.
modest rune
seems like it is applying it per 1D array, not each element.
But, maybe you are right, might be less efficient.
Probably need to test it.
solid aurora
seems like it is applying it per 1D array, not each element.
@modest rune yea it would have to, each element is pretty much impossible
but yea doesn't seem vectorized
I thinkI can get by with @tidal bough's solution with slices
lapis sequoia
did u got the mad?
modest rune
After seeing how seemingly similar functions can have wildly different performance in numpy, if I truly cared about performance, I would test it, before picking one. In my opinion, the implementation under the hood for both approaches should be similar.
But... should be AND are similar, are often not true.
Gut feeling, ConfusedReptiles approach is more likely faster.
tidal bough
def mean_abs_err(arr,axis=0):
    arr = np.array(arr)
    means = np.mean(arr,axis=axis)

    newshape = list(arr.shape)
    newshape[axis]=1 # same shape as original array, but with size 1 over the axis dimension

    errors = np.abs(arr-means.reshape(newshape))
    results = np.mean(errors,axis=axis)
    return results
there
@solid aurora think this solution is more general.
 fervent bridge
 1402/11331 [==>...........................] - ETA: 14:29 - loss: 65.5774 - accuracy: 0.0000e+00First Shape :  (480, 640, 3) Second Shape: (3145728,)
 1403/11331 [==>...........................] - ETA: 14:29 - loss: 65.5345 - accuracy: 0.0000e+00First Shape :  (480, 640, 3) Second Shape: (3145728,)
 1405/11331 [==>...........................] - ETA: 14:29 - loss: 65.4486 - accuracy: 0.0000e+00```Hmm my shapes seem to be converting correctly, after padding and flattening... I always end up getting this error though```python
ValueError: operands could not be broadcast together with remapped shapes [original->remapped]: (3,2) and requested shape (2,2)```I was thinking a lot about how the hell my solution could cause that before I realised you're a different person with a different problem 😅
fervent bridge
🙂
lapis sequoia
getting the mad
import numpy as np


def mad():
  a = np.array([[[(2,2,4,4),(4,5,6,7),(5,6,6,7),(3,4,6,7)]]])

  a_size = np.size(a) #getting the totoal element
  print(a_size)
  getting_mean = np.mean(a) #getting the mean
  #print(getting_mean) mean

  subtracting_a = np.subtract(a,getting_mean) #subtracting the array and mean
  #print(subtracting_a) subtracting array and mean of array

  dividing =  np.divide(subtracting_a,a_size) #divding subtract_array and a of a a_size

  print(dividing)


mad()
 velvet thorn
After seeing how seemingly similar functions can have wildly different performance in numpy, if I truly cared about performance, I would test it, before picking one. In my opinion, the implementation under the hood for both approaches should be similar.
@modest rune it's nontrivial to do that
would be nice but
modest rune
@velvet thorn why do you say that? performance testing functions is pretty straight forward.
velvet thorn
hm, not sure if I understood you correctly
what I meant was that the translation of Python code to SIMD instructions is not always simple
which is why different ways of doing the same thing can vary so wildly in terms of runtime
modest rune
I'm no expert with regard to vectorization, multi-core efficiency, and I don't really understand SIMD. But, I have found that when a function is vectorized vs not, the speed differences are substantial in python in relatively simple scenarios. I imagine in C that you might not notice differences as easily.
but, yes, I fully admit that it is possible that 2 different implementations show similar performance benefits, but those results might be misleading because the test setup wasn't testing enough scenarios.
I should rephrase all of that... I believe there to be much utility in simple performance testing of functions, even if those performance tests overlook certain scenarios.
as long as you understand the pitfalls of the test you setup
velvet thorn
yes, I agree that performance testing is crucial
In my opinion, the implementation under the hood for both approaches should be similar.
but I was responding to this part
I took you to mean that different ways of approaching the same problem in numpy should yield more or less the same performance characteristics
did I get you wrong
e.g. np.apply_along_axis(np.mean, 0, data) vs data.mean(axis=0)
modest rune
Oh, sorry, wasn't intending to mean that. I was thinking it is possible that both approaches are implemented in a similar or even same fashion under the hood.
the fact that data.mean(axis=1) doesn't work in all scenarios, as evidenced by @solid aurora's issue, might be one of the reasons np.apply_along_axis() was created in the first place.
@solid aurora just because I have already talked about it too much... here are the performance results for the two approaches, run 500 times each on my laptop:
  _     ._   __/__   _ _  _  _ _/_   Recorded: 18:15:16  Samples:  110
 /_//_/// /_\ / //_// / //_'/ //     Duration: 0.111     CPU time: 0.109
/   _/                      v3.1.3

0.110 <module>  perfTest.py:1
├─ 0.094 apply_along_axis  <__array_function__ internals>:2
│     [25 frames hidden]  <__array_function__ internals>, numpy
│        0.091 apply_along_axis  numpy\lib\shape_base.py:269
│        ├─ 0.065 <lambda>  perfTest.py:5
│        │  ├─ 0.046 mean  <__array_function__ internals>:2
│        │  │     [10 frames hidden]  <__array_function__ internals>, numpy
│        │  │        0.037 _mean  numpy\core\_methods.py:134
│        │  │        ├─ 0.028 [self]
│        │  └─ 0.019 [self]
└─ 0.015 <lambda>  perfTest.py:6
   └─ 0.014 mean  <__array_function__ internals>:2
         [8 frames hidden]  <__array_function__ internals>, numpy

[5. 5. 5. 5. 5.]
[5. 5. 5. 5. 5.]
the lamba approach is significantly faster.
modest rune
94ms when using apply_along_axis vs. 15 ms with mad2 = lambda a: np.mean(np.abs(a - np.mean(a,axis=1)[:,None]),axis=1)
velvet thorn
yeah, for sure
there should be a way to generalise this...
okay, I remember
def mean_absolute_deviation(data, axis):
    return np.abs(data - data.mean(axis=axis, keepdims=True)).mean(axis=axis)
this should work
keepdims makes it so the aggregation axis isn't collapsed
modest rune
worked, at it was even faster! Great Job!
I think I ran into a similar problem 2 months ago that I never figured out... ended up having to transpose things because I didn't know about keepdims
thanks @velvet thorn
modest rune
  _     ._   __/__   _ _  _  _ _/_   Recorded: 18:21:23  Samples:  115
 /_//_/// /_\ / //_// / //_'/ //     Duration: 0.117     CPU time: 0.125
/   _/                      v3.1.3

0.116 <module>  perfTest.py:1
├─ 0.087 apply_along_axis  <__array_function__ internals>:2
│     [25 frames hidden]  <__array_function__ internals>, numpy
│        0.085 apply_along_axis  numpy\lib\shape_base.py:269
│        ├─ 0.057 <lambda>  perfTest.py:5
│        │  ├─ 0.044 mean  <__array_function__ internals>:2
│        │  │     [10 frames hidden]  <__array_function__ internals>, numpy
│        │  │        0.039 _mean  numpy\core\_methods.py:134
│        │  │        ├─ 0.035 [self]
│        │  └─ 0.013 [self]
├─ 0.017 <lambda>  perfTest.py:6
│  ├─ 0.014 mean  <__array_function__ internals>:2
│  │     [6 frames hidden]  <__array_function__ internals>, numpy
│  └─ 0.003 [self]
└─ 0.012 mean_absolute_deviation  perfTest.py:10
   ├─ 0.010 _mean  numpy\core\_methods.py:134
   │     [2 frames hidden]  numpy
   └─ 0.002 [self]

[5. 5. 5. 5. 5.]
[5. 5. 5. 5. 5.]
[5. 5. 5. 5. 5.]
always feels good when you find it and it simplifies your work
modest rune
Correction on my part, the non-generalized lamba function seems to have the same performance as your function. Which ever one I execute first ends up being slightly slower.
solid aurora
Which ever one I execute first ends up being slightly slower
hmm... python has a JIT?
I'm just catching up to all these messages now 🙂
modest rune
It could also be an artifact of the performance profiler... I dunno.
solid aurora
that's possible
velvet thorn
Correction on my part, the non-generalized lamba function seems to have the same performance as your function. Which ever one I execute first ends up being slightly slower.
@modest rune it should be the same!
tidal bough
keepdimsmakes it so the aggregation axis isn't collapsed
@velvet thorn oh, now that's cool
velvet thorn
it's the same level of parallelisation
modest rune
Well, I think they are the same... when I swap their execution order, I see the same difference in speed, just swapped.
velvet thorn
I would be very surprised if they were not
solid aurora
ahhhhh I'm now stuck in tuple-list-nparray hell! I think I have a list of lists of 1-tuples of nparrays of 1-tuples of nparrays!
I don't even fucking know how that's possible!
plus, I swear it was working earlier and I didn't change anything related!
solid aurora
ohh 🤦♂️
I had some trailing commas at the end of my line
apparently x = 1, means x is now a 1-tuple
I forgot to remove the commas when I un-inlined elements from a large list literal
tidal bough
yeah, that's a bit of a gotcha
 grand mason
Good night people!
Someone can help me?
I need know a good way to process images for a classifier algorithm
velvet thorn
I forgot to remove the commas when I un-inlined elements from a large list literal
@solid aurora there are better ways to do such things
solid aurora
@velvet thorn hmm?
essentially I had convertedpy group = [ function(x1, y1, z1, some_really_long_argument[0]), function(x2, y2, z2, some_really_long_argument[1]), function(x3, y3, z3, some_really_long_argument[2]), ] into py g1 = function(x1, y1, z1, some_really_long_argument[0]), g2 = function(x2, y2, z2, some_really_long_argument[1]), g3 = function(x3, y3, z3, some_really_long_argument[2]), group = [g1, g2, g3]
I didn't remove those commas at the end
because of that, g1, g2, and g3 were tuples
how else should I have done that?
velvet thorn
how else should I have done that?
@solid aurora but why did you do that?
why not just add g1, g2, g3 = group at the end
(I misunderstood what you originally meant though)
either way is fine
solid aurora
ah ok
 static aurora
glad this place exists 🙂
 old thorn
hey so im trying to analyze a spreadsheet of food data using python, how would u guys recommend i go about this, im thinking that I would feed a CSV file into a Numpy array and work from there but i wanna hear other ideas
DM Me because i dont always check this server
modest rune
@old thorn you should use pandas. It will be perfect for your needs.
 ripe forge
Yep, dataframe makes sense
Can always convert dataframe to a numpy array at the very end if need be
 steel olive
Hi, I've create a service for generating cover letters using the GPT-2 model. Could you provide me some feedback? It's deployed on Cloud Run (GCP)
https://cover-letter-generator-gpt2-app-6q7gvhilqq-lz.a.run.app
P.D. I don't know if this kind of posts are fine on this channel, let me know
GPT2 Cover Letter Generator
 copper hemlock
is it just me or is it a little annoying to use pytorch with numpy instead of PIL? conversion to tensor and dtype tinkering was required i figured it out
but now i try to apply transformations but transformations on numpy arrays or tensors are limited, transformations should be done on PIL images, i could just convert numpy to PIL then apply transformations on PIL then convert to Tensor but is it worth the hassle?
i like using numpy for storing images as ndarrays in an easy way
is it like this or am i missing something?
lapis sequoia
what do you need pytorch for
you could just go the TF route all the way
@steel olive do you need special access to use gpt
like I saw gpt-3 access needed to be requested.. etc.. I'm not sure what the criteria is for gpt2
steel olive
@lapis sequoia yes, that's right. For GPT-3 you need an OpenAI API key. But for gpt-2 I've used the model trained from https://huggingface.co/
 lapis sequoia
pretty cool
let me try out what you've done.. will get back
checked yours.. seems it's great at predicting short sentences
not so much for long winded ones
like, I can't begin by thanking someone or using fillers about having had a meeting/interview with them and expressing interest in bla bla
but, as a general tool, it's predictive for the usual cover letter sentences
guess you trained it on a lot of cover letters?
how about using some from some top tier engineering schools
lapis sequoia
@steel olive
steel olive
@lapis sequoia hahahahah🤣
steel olive
I have another one for gpt-2 (the normal one): https://text-generator-gpt2-app-6q7gvhilqq-lz.a.run.app
GPT2 Text Generator
steel olive
Yep..I think so. It only works if you insert text from news or something like that
lapis sequoia
I wonder
if you can train it on a book and use it for Q&A
that would be helpful for FAQs
like, for example.. a book about a cloud platform
 random perch
GPT3 is crazy. Trained on 175 billion parameters compared to GPT2 that only had 1.5 billion.
 acoustic halo
Also a fun fact, it cost about $500mil to train
random perch
lol yeah
imagine someone tripping over a cable and shutting down the system while training and it crashes
im sure they have checks in place to prevent this exact situation
odd yoke
where did you see the $500M cost to train it ?
pretty sure every sources just mention a few millions
like <5M
I even doubt openai has that kind of money to begin with
 steady bronze
how to return similar values in column using pandas
lapis sequoia
nice but u can post this in python-general more useful for beginners @bleak fox
 bleak fox
nice but u can post this in python-general more useful for beginners @bleak fox
@lapis sequoia Thanks for advice...
 summer plover
hey @bleak fox
nice to see you got some videos to share. But just be careful about how you phrase it, we do not allow advertisement here.
bleak fox
nice to see you got some videos to share. But just be careful about how you phrase it, we do not allow advertisement here.
@summer plover yup, already on discussion with Modmail.... They said they are discussing in such case I'll delete this post..... Always there to support you guys. 😇
grave frost
@odd yoke Even if it was 500 million, Elon would still shell out the money, seeing his net worth....
odd yoke
not for one model, no
flat quest
I don't think it was that high, but definitely a couple mil. Openai could technically spend 500mil on a model, but last time I checked models don't cost 100 of mils just yet
 kind granite
you either specify mangle_dupe_cols when you read from the file, or you pass a new list for df.columns
kind granite
np
pearl crystal
In test hypothesis, we compare t score and z score with critical value oralternatively, p values with alpha values?
P value and alpha value are about area under the t distribution (tailed, from t score value)
and how can I remove redundant features? For example in linear regression
First I should find p values for each feature and then remove the features whose p values are less than 0.05 for example, then compute VIF and remove dependent features?
If I normalize my features, can I remove small coefficients instead of computing p values and compare them with alpha threshold value?
 solemn atlas
How can I get started with neural networks
bitter harbor
Start with linear algebra, stats and the basics of how a nn works
Then start getting into libraries
solemn atlas
@bitter harbor can I get some resources and link 😅 I will really appreciate them🙂
bitter harbor
Personally I’d recommend 3b1b’s series’s on nn’s+linear alg to start
bitter harbor
They’re on YouTube
solemn atlas
10 videos are there right 😅
bitter harbor
In what?
solemn atlas
The series u r talking about
bitter harbor
I think so?
modest rune
Looking for some guidance. In the python app I am writing, I am going to calculate the implied volatility surface of a stock's option chain.
Look at this wiki article if you don't know what I am talking about, under the "Implied Volatility Surface" section.
https://en.wikipedia.org/wiki/Volatility_smile
Here is a photo of what the data looks like when plotted.

Volatility smiles are implied volatility patterns that arise in pricing financial options. It corresponds to finding one single parameter (implied volatility) that is needed to be modified for the Black–Scholes formula to fit market prices. In particular for a given expiratio...
Here are my questions:
- In a generic data-science sense, what do you call that type of 3d plot/function?
- My data is discrete and the discreteness is defined by the available options types (A 2d array with one axis being 20 sets of expiration days and the other axis being 50 different strike prices, and the value of the array being the volatility at that point). What would I call the process of curve fitting or interpolating the data inbetween the discrete points, so that I can estimate what any value might be? Essentially, I'd like to make up my own custom expiration date and strike price (X, Y coordinate) and see what the value would be at that point? And, what functions in python would you recommend I study up on to achieve this feat? (I currently use scipy, pandas, and numpy).
I guess, I am looking for a jumpstart as to where I should start learning, so as to waste my time less.
I already know how to calculate the implied volatility surface using black-scholes and a scipy root solver.
One article i read suggests using a Chebyshev surface fit. Thoughts?
desert oar
a "3d surface plot" maybe?
interpolating and curve fitting are both valid terms for this
there are different ways to go about it. you can do something nonparametric like linear interpolation or splines, or you can do something like a gaussian process
if your grid points are closely spaced together, i'd start with linear interpolation and go from there
im actually not sure what the 2+d generalizations of splines are
modest rune
In my case, I don't actually need to plot all of the interpolated values, nor do I need calculate all of them. I only need to calculate on an as needed basis specific points. Which, might be different but similar functions? Or maybe it is the same function, and in 1 case I pass a 1 element array as the input and for doing a visualuztion you would pass a 2d array with the bounds and granularity chosen to produce the desired plot.
 shadow ridge
I am trying to avoid making a new DataFrame. Any suggestions on how to improve this.
I am inserting an additional 5 rows between each row.
df2 = pd.DataFrame()

for i, r in enumerate(df1[10:20]):
    a0 = df1[['Date_Time', 'Latitude', 'Longitude', 'Altitude']].loc[i].copy()
    a0['Date_Time'] = a0.Date_Time.value
    a1 = df1[['Date_Time', 'Latitude', 'Longitude', 'Altitude']].loc[i+1].copy()
    a1['Date_Time'] = a1.Date_Time.value
    res = pd.DataFrame(np.linspace(a0,a1,5), columns=['Date_Time', 'Latitude', 'Longitude', 'Altitude'])
    df2 = df2.append(res, ignore_index=True)
df2['Date_Time'] = df2.Date_Time.astype('datetime64[ns]')
@shadow ridge have you considered just appending the rows at the end, and then sorting it afterwards?
shadow ridge
yes,
@desert oar I am not exactly sure how and now I realize there is a bug in my code
i is not the index
desert oar
what is this code actually supposd to do?
shadow ridge
so when I have ....loc[i].copy()
desert oar
and what are the columns of df1? does it have an index?
shadow ridge
1min, will show
desert oar
ah, it looks like you're interpolating between every row
iterating over a dataframe iterates over (colname, column) pairs
shadow ridge
df1[10:20].head()
gets
Date_Time     Latitude     Longitude     Altitude     distance_between
10     2020-08-15 14:24:45     39.730064     -105.539782     2342.7     13.173650
11     2020-08-15 14:24:49     39.729934     -105.540028     2343.3     25.531797
12     2020-08-15 14:24:50     39.729902     -105.540090     2343.4     6.386113
13     2020-08-15 14:24:58     39.729628     -105.540592     2344.7     52.658147
14     2020-08-15 14:25:00     39.729556     -105.540717     2345.0     13.358674
ok. i recommend using iloc for positional slicing
shadow ridge
ah, it looks like you're interpolating between every row
@desert oar Yes
Between a subset of rows
I tried doing this in the for loop but then realized my "i" is not the right index
df1 = pd.concat([df1.iloc[:i], res, df1.iloc[i+5:]]).reset_index(drop=True)
columns = ['Date_Time', 'Latitude', 'Longitude', 'Altitude']
new_dfs = []
for i in range(10, 20):
    curr_row = df1[columns].iloc[i]
    next_row = df1[columns].iloc[i+1]
    curr_arr = [curr_row['Date_Time'].value, *curr_row[['Latitude', 'Longitude', 'Altitude']]]
    next_arr = [next_row['Date_Time'].value, *next_row[['Latitude', 'Longitude', 'Altitude']]]
    new_df = pd.DataFrame(np.linspace(curr_arr, next_arr, 5), columns=columns)
    new_dfs.append(new_df)
df_expanded = pd.concat([df1, *new_dfs], ignore_index=True)
@shadow ridge how about something like this?
the construction of curr_arr and next_arr is obviously kind of hacky but it avoids the risk of accidentally modifying df1 in-place
shadow ridge
Good idea
for i, r in df1[10:20].iterrows():
i gets me the index here.
This helps, thanks @desert oar
desert oar
don't confuse the dataframe index with the positional row number @shadow ridge
shadow ridge
?
desert oar
a dataframe has an "index" and a "columns" attribute
the index is row labels
the columns is column labels
the index might be some arbitrary stuff
in your case it looks like you're using the default index, which is just sequential integers
but there are cases even there where the index might get out of order
this is a design feature, but it can be a trap if you aren't aware of it
data = pd.DataFrame([
    [3.5, 1],
    [3.6, -1]
], columns=['x', 'y'], index=['a', 'b'])

print(list(data.iterrows()))
for example
or, perhaps more insidious (but equally valid in a lot of cases):
data = pd.DataFrame([
    [3.5, 1],
    [3.6, -1]
], columns=['x', 'y'], index=[6, 2])

print(list(data.iterrows()))
.iloc[i]
Is that a position slice or index slice?
position ok, get it
so using range is safer
steady bronze
how to return similar values in column using pandas
velvet thorn
define similar
shadow ridge
@desert oar Here is what I have ended up with. I should write some tests but looks like it is working.
df1['Date_Time'] = df1.Date_Time.astype(np.int64)
columns = ['Date_Time', 'Latitude', 'Longitude', 'Altitude']
start = 10
end = 20
rows = 5
realend = (end-start)*5 + start
for i in range(start, realend, rows):
    curr_row = df1[columns].iloc[i]
    print(curr_row)
    next_row = df1[columns].iloc[i+1]
    new_df = pd.DataFrame(np.linspace(curr_row, next_row, rows), columns=columns)
    print(new_df)
    df1 = pd.concat([df1[:i], new_df, df1[i+rows:]], ignore_index=True)

df1['Date_Time'] = df1.Date_Time.astype('datetime64[ns]')
@velvet thorn because I dont know any better 😉
shadow ridge
@velvet thorn I am tryng to add/interpolate rows into a subset of df1
velvet thorn
just wondering, have you tried .resample?
shadow ridge
for example add 5 rows between each rows between these rows df1[10:20]
velvet thorn
okay, but why?
shadow ridge
I have tried (looked at) .resample but its not what I think I want.
velvet thorn
hm, okay
I mean
if your code works, then go for it!
there might be a quicker way but if it's not a problem right now
no point thinking about it
shadow ridge
I will try with resample. Its not like I am happy with this code, sure seems like there should be a direct way of doing this.
steady bronze
@velvet thorn i mean same
velvet thorn
I will try with resample. Its not like I am happy with this code, sure seems like there should be a direct way of doing this.
@shadow ridge groupby into apply might work too; I'm not so clear what you expect, but you might want to look @ it
@velvet thorn i mean same
@steady bronze.duplicated
steady bronze
@velvet thorn thnx
 polar berry
hey what is a good way to learn python for machine learning if I have absolutely no experience with coding at all
pls ping
 desert parcel
so I have a simple question
maybe the answer is not simple
but is logistic regression unique for when you want to do computer vision?
Because linear regression is for like plotting stuff, but can you use the concepts in linear regression to build model for computer vision?
lapis sequoia
classification task is not unique, but i haven't seen logistic regression being used
maybe because linear models arent practical
desert parcel
hmm
Well the tutorial i'm following
is giving us an intro to computer vision
and he is using logistic regression
or he's using computer vision as a segway into teaching logistic regression
desert parcel
It's the MNIST numbers dataset
lapis sequoia
yeah well, fairly simple problem. the images are binary images so its a decent approach. for an introduction its fine
desert parcel
ah
but why logistic regression though
why not like
idk something else other
like
(something) regression
def accuracy(outputs, labels):
    _, preds = torch.max(outputs, dim=1)
    print(f"Accuracy: {torch.sum(preds == labels).item() / len(preds)}")
Can someone explain the _,
odd yoke
torch.max returns a tuple of values/indices if dim is 1
this binds the values to _ and the indices to preds
_ is a common placeholder variable that you use when you want to indicate the variable won't be used later on
desert parcel
so it's like a variable that may or may not be used?
odd yoke
there's nothing to enforce it, it's just a convention
desert parcel
def evaluate(model, loss_fn, valid_dl, metric=None):
    with torch.no_grad():
        results = [loss_batch(model, loss_fn, xb, yb, metric=metric)for xb, yb in valid_dl]

        losses, nums, metrics = zip(*results)
        total = np.sum(nums)
        avg_loss = np.sum(np.multiply(losses, nums)) / total

        avg_metric = None
        if metric is not None:
            avg_metric = np.sum(np.multiply(metrics, nums)) / total

        print(f"Average loss: {avg_loss}, total: {total}, average metric: {avg_metric}")
at the one with zip()
it says that it must be able to support iterations
There are outputs
but then the error shows up
so I'm not sure what the problem was before
desert parcel
def loss_batch(model, loss_fn, xb, yb, opt=None, metric=None):
    preds = model(xb)
    loss = loss_fn(preds, yb)

    if opt is not None:
        loss.backward()
        opt.step()
        opt.zero_grad()

    metric_result = None
    if metric is not None:
        metric_result = metric(preds, yb)

    print(f"Loss: {loss.item()}, length: {len(xb)}, metric result: {metric_result}")
Here are the outputs
odd yoke
it's not returning anything
desert parcel
Accuracy: 0.14
Loss: 2.291226387023926, length: 100, metric result: None
The one at the bottom is the output for loss_batch
odd yoke
yeah, but it must return something too
odd yoke
def double(x):
  print x * 2

double(3) + double(5)```would you expect this to work ?umm yeah
odd yoke
(let's pretend it's python 2 because i'm too lazy to add parens)
odd yoke
how would it know how to "get" the value out of double(...)
all we're telling the interpreter is to display x * 2 in the terminal
odd yoke
f-strings don't matter, you are still only just printing, not returning
return is how you "get" these values
odd yoke
exactly
desert parcel
but return return is more flexible
odd yoke
return is how you communicate with the outside world
odd yoke
so that you can do ```x = some_function(bla)
oih
oh
So I've changed it
but the problem persists
It's still not iterable
maybe I should add a for loop?
desert parcel
now there is a new error
after changing the things to return
it says there are too many values to unpack
odd yoke
you can't just replace that print with return here
odd yoke
I have to work, you have losses, nums, metrics = zip(*results), so you want to return 3 iterables that would correspond to these in loss_batch
desert parcel
yeah
odd yoke
maybe return loss, preds, metric_result and pass metric=True in loss_batch
desert parcel
no it still didn't work
I think
it's beacuse
because*
metric doesn't accept booleans
but it accepts the accuracy
Because metric is supposed to be used to calculate the average accuracy
desert parcel
i passed in accuracy into metric
it's the same issue which would be the zip() line
wait no it's not the same
this time there are too many values to unpack
def evaluate(model, loss_fn, valid_dl, metric=None):
    with torch.no_grad():
        results = [loss_batch(model, loss_fn, xb, yb, metric=metric)for xb, yb in valid_dl]

        losses, nums, metrics = zip(*results)
        total = np.sum(nums)
        avg_loss = np.sum(np.multiply(losses, nums)) / total

        avg_metric = None
        if metric is not None:
            avg_metric = np.sum(np.multiply(metrics, nums)) / total

        return avg_loss, total, avg_metric
I probably messed up around the results line
 frail locust
When you have a columns with string variables
Is it efficient to use the pd. get_dummies function?
pearl crystal
In test hypothesis, we compare t score and z score with critical value alternatively, p values with alpha values?
P value and alpha value are about area under the t distribution (tailed, from t score value)
and how can I remove redundant features? For example in linear regression
First I should find p values for each feature and then remove the features whose p values are greater than 0.05 for example, then compute VIF and remove dependent features?
If I normalize my features, can I remove small coefficients instead of computing p values and compare them with alpha threshold value?
For computing Z score: Z= (X-mu)/sigma
Where mu and sigma are the population mean and standard deviation but I have seen the formula below as well
Z= (X-mu)/standard_error, standard _error= sigma/sqrt(n)
What is the different between them?
desert oar
@pearl crystal the Z stat is for when the population variance is known
the T stat is when the population variance is unknown and it needs to be estimated from the data
pearl crystal
I know it yes
desert oar
but the T distribution converges to the Gaussian distribution anyway when the degrees of freedom get big
pearl crystal
Z score: Z= (X-mu)/sigma
Z= (X-mu)/standard_error, standard _error= sigma/sqrt(n)
or
X=mu (+-) Z*sigma/sqrt(n) -> interval
desert oar
ah
be careful here
T = (x - sample_mean) / (sample_stddev)
the definition of sample mean and sample stddev depends on what X is
pearl crystal
The denominator
Sometimes, it is only standard deviation and sometimes sd/sqrt(N) for Z score
desert oar
@pearl crystal because that's the standard deviation of the sample mean
vs just the standard deviation
it depends on what you're doing the test for
pearl crystal
got it thanks
What about
1- In test hypothesis, we compare t score and z score with critical value alternatively, p values with alpha values?
P value and alpha value are about area under the t distribution (tailed, from t score value)
2- How can I remove redundant features? For example in linear regression
First I should find p values for each feature and then remove the features whose p values are greater than 0.05 for example, then compute VIF and remove dependent features?
If I normalize my features, can I remove small coefficients instead of computing p values and compare them with alpha threshold value?
desert oar
just regularize your model
dont worry about removing features
unless they are really really blatantly highly correlated
stepwise model building is usually bad
im not sure what your 1st question means
pearl crystal
So for detecting multicollinearity, I can use VIF or event something like PCA?
desert oar
you can use VIF yes
 glacial rune
is anyone here familiar with https://fastavro.readthedocs.io/en/latest/reader.html?
I'm debugging through this and on avro_reader = reader(fo), avro_reader becomes an instance of class reader
The next line is for record in avro_reader:
but when I debug and check the avro_reader instance, there's no iterable object?
so - if I wanted to append the data into a list I can do it with a list comprehension. Does this mean that the file's data hasn't been read, until I call upon it to append/whatever the list?
e.g.
lst = [record for record in avro_reader]```so... if I know the contents of the file, could I skip and only add certain records to my list?
I'm hoping to do a pre-scan of the file, and if it fails the pre-scan checks, I'll read the entire file... it's just that it can take quite long, even with fastavro 😄
or I could I make the list comprehension stop after n records?
maybe it would have to be in a for loop with enumerate?
tidal bough
so - if I wanted to append the data into a list I can do it with a list comprehension. Does this mean that the file's data hasn't been read, until I call upon it to append/whatever the list?
List comprehensions are greedy - they evaluate immediately and result in a perfectly normal list. It's generators that are lazy-evaluating.
I'm hoping to do a pre-scan of the file, and if it fails the pre-scan checks, I'll read the entire file... it's just that it can take quite long, even with fastavro 😄
or I could I make the list comprehension stop after n records?
Best idea would be to use a normal for-loop.
glacial rune
So how does this object work?
How would I know that I can iterate through it, if I didn’t have the docs?
tidal bough
you can check dir(obj) to discover all of its methods and attributes
For example, using it on a normal list:
['__add__', '__class__', '__contains__', '__delattr__', '__delitem__', '__dir__', '__doc__', '__eq__', '__format__', '__ge__', '__getattribute__', '__getitem__', '__gt__'
, '__hash__', '__iadd__', '__imul__', '__init__', '__init_subclass__', '__iter__', '__le__', '__len__', '__lt__', '__mul__', '__ne__', '__new__', '__reduce__', '__reduce_
ex__', '__repr__', '__reversed__', '__rmul__', '__setattr__', '__setitem__', '__sizeof__', '__str__', '__subclasshook__', 'append', 'clear', 'copy', 'count', 'extend', 'i
ndex', 'insert', 'pop', 'remove', 'reverse', 'sort']
__iter__ is there, so it can be iterated upon.
__getitem__ is there, so it can be indexed.
__contains__ is there, so you can do a in obj on it.
And so on.
glacial rune
Cool thanks! I need to read up on evaluation and the lazy stuff you mentioned
Trying to make this run as fast as possible and I only need certain records from the avro file
tidal bough
I need to read up on evaluation and the lazy stuff you mentioned
Basically,range(10**10)does not create a list of10**10big integers in your memory, because it's a generator, not a function returning a list 😛
It only ever keeps track of the current element.
similarly, here's two ways of generating power of 2:
!e
def powtwo_list(i,j):
    cur = 2**i
    res = []
    for _ in range(j-i):
        res.append(cur)
        cur*=2
    return res
def powtwo_gen(i,j):
    cur = 2**i
    for _ in range(j-i):
        yield cur
        cur*=2

print(powtwo_list(2,15))
print(list(powtwo_gen(2,15))) # same thing
#But:
# this does nothing - until you start requesting elements from it, a generator doesn't actually run
print(powtwo_gen(2,3292132132193213))
 arctic wedgeBOT
You are not allowed to use that command here. Please use the #bot-commands channel instead.
tidal bough
If I tried to do print(powtwo_list(2,3292132132193213)), I'd naturally have a timeout.
 pseudo basalt
my mind is blown, there's vagrant for ML models now https://huggingface.co/

but
I have a toaster with no gpu. does cpu-only pytorch run comparably to cpu-only tensorflow?
there are some features their transformers library has that apparently are only supported with pytorch backend
 bitter fiber
Hey guys.. I just found a way to limit ram consumption that was obvious but not very apparent when running natural language models in sklearn
So my work computer did not have enough ram ~295 GB required to run a gradient boosting model; and all you need to do is figure out the highest count of a word. You can actually modify the default np.int64 data type in countvectorizer
preferably uint16 is the lowest likely amount you need
because counts are all positive
it actually reduces the memory consumption from 64 bits in each value to 16 bits or 2 bytes instead of 8
essentially using 1/4th of the memory required
tidal bough
your word counts fit into 16 bits?
bitter fiber
yeah i kinda make a model per country per language per brand i am classifying
so its like from 10k - 300k rows csv each row with ~250 characters
remember uint16 is bigger than int16
tidal bough
uint16 is still only a max of 65535, though
bitter fiber
yeah the only counts i get above that would be stop words i purge anyways..
tidal bough
also, realistically speaking, the really effective way to reduce memory usage in this case would to to do the counting in batches
bitter fiber
I tried to do batching in gradient boosting but it doesnt really support that. You can do something similar by freezing chunks of trees
tidal bough
like, have a database of counts. Process some words until the memory starts getting tight, dump the current counts to the database(adding to the existing ones) and continue counting.
ah, gradient boosting
bitter fiber
once you freeze the previous training you cant improve it; you can only add new trees to the fire.
tidal bough
ooh, I only now really got what you were saying 😄
I thought "wtf, why'd you need gradient boosting to figure out the word with the highest count in a dataset?.." 😅
bitter fiber
nah lol its ok; i didnt say that im doing countvectorization to create an input matrix for the actual algorithm
its a preprocessing step
 warm sinew
Does anyone know hot to plot val categorical accuracy in keras, to make it look like this? I mean I can convert it into percentages, I need something similar that will help me know the accuracy values for each class in my best epoch.
If someone can direct me to a link or something it will be great! thanks a lot! 🙂
tidal bough
that sounds like you'd pretty much do it manually
bitter fiber
 tidal bough
like, divide the validation set into subsets based on the correct category
then calculate accuracy for each subset
bitter fiber
Sure that too; but what measure of accuracy are you trying to measure?
there are many different ways to calculate that
warm sinew
then calculate accuracy for each subset
@tidal bough aha the hard way
bitter fiber
lolz
i wouldn't calculate myself
first
unless i cant find a method for it to do it itself.
warm sinew
unless i cant find a method for it to do it itself.
@bitter fiber I've been trying to find a method for hours now, someone told me that there is a way to do it.. I just need to look harder it seems.. lets see if I can find this method before I go completely bald..
 warm sinew
otherwise they got hair extensions for that problem lol
@bitter fiber 🤣
bitter fiber
i mean i thought keras had this score, acc when running the model.evaluate function
score, acc = model.evaluate(x_test, y_test,
                            batch_size=batch_size)
yeah, but I'm using the data generators here and there aren't separate variables for x_test and y_test
y_pred = model.predict_classes(x_test)
print(classification_report(Y_test, y_pred))```
There's this as well
__iter__is there, so it can be iterated upon.
__getitem__is there, so it can be indexed.
@tidal bough so I'd just like to clarify, the fastavro.reader object has:
['__class__', '__delattr__', '__dict__', '__dir__', '__doc__', '__eq__', '__format__', '__ge__', '__getattribute__', '__gt__', '__hash__', '__init__', '__init_subclass__', '__iter__', '__le__', '__lt__', '__module__', '__ne__', '__new__', '__next__', '__reduce__', '__reduce_ex__', '__repr__', '__setattr__', '__sizeof__', '__str__', '__subclasshook__', '__weakref__', 'next', 'schema']
So if I have an avro file with time and price, and I only want to grab specific records at certain times (e.g. every 10 minutes), would that be possible?
also regarding your power of two example - the yield provides a generator, so is it faster at giving you an element than the powtwo_list? or is it just more memory efficient, as you're not storing all of the values
tidal bough
the latter.
So if I have an avro file with time and price, and I only want to grab specific records at certain times (e.g. every 10 minutes), would that be possible?
well, it looks like it's just iterable, not indexable.
glacial rune
ahh I see
iterable means iterate each element then? I can't just like, jump N elements?
tidal bough
hyperparameters are usually tuned by trying with several different values of them and seeing how that impacts the model quality
bleak fox
Train evaluate and Hyper parameter tuning are cyclic process. Generally noted as modeling part,
bitter fiber
you can automate hyperparameter tuning with grid_search
with a list of numbers/values you can run and the computer will go through all the combinations of the parameters too
polar berry
@bitter fiber so shouldnt u find the best hyperparameter using gridsearchCV/randomsearchCV before you train and evaluate the data?
bitter fiber
I always go through a script I have with 3-5 different models that does a simple train without crossvalidation to choose the model first then i find the best hyperparams inside that model
compare accuracy across models obviously the models that have the same input-> output requirements you need
then gridsearch because im a consultant and i have time
If your training on the fly for an app i would use randomsearch
 regal radish
Hello, I am trying to read data using pandas read_excel from a specific sheet in an excel (xlsm) file, but it takes dreadfully long (the file is about 30KB), is there a more efficient way to do this?
seems like read csv is faster but i'm not sure how to use that to specify that the data I want is on one specific sheet
modest rune
I'm trying to learn about curve fitting. Basically, I want to curve fit the implied volatility curve of an option chain, in such a way that the resulting fit is a conservative estimate of the volatility curve. I don't have very much experience with curve fitting and I know there are a lot of ways to curve fit. Any advice on what would be the best for my situation? I have created a 3rd grader quality mspaint graphic showing the curve fitting problem I am trying to solve to help clarify my question. Ideally, there is a simple way to solve my problem with scipy or numpy. (or maybe another library I am not yet aware of).
desert oar
@modest rune curve fitting is also known as "model building" and there are many ways to do it
(ok there are plenty of curve fitting algorithms that you wouldnt really use as a "model")
it depends on the kind of data
i suggested a few the other day, it really depends on how much data you have and what kind of output you need
for example, that's noisy data in the picture. so you'd want to fit either something smoothed like loess or splines, or you'd want to fit a parametric model like regression
or if we're dealing with data over time you might use exponential smoothing
whereas if you're computing values from points on a grid, it doesn't make much sense to fit a model between those points in a lot of cases, because you can just use a very fine grid and interpolate
or if you can't use a fine grid you can use nonparametric methods or even a gaussian process model
or, yes, a parametric model
so the answer to "how do i fit a curve" is either "get a phd" or "can you provide more information"
your "best" indicates that maybe you need to actually be removing outliers and not just fitting a smooth curve
which is a whole other can of worms
im sure there are people here with more domain specific experience that can help in your particular domain, but im just trying to give you a sense of how broad the topic is
modest rune
whereas if you're computing values from points on a grid, it doesn't make much sense to fit a model between those points in a lot of cases, because you can just use a very fine grid and interpolate
@desert oar
I'm not sure I understand the difference between interpolating and curve fitting, in my mind, they seem to be the same thing.
desert oar
@modest rune interpolation always includes the points you provide. curve fitting and/or modelling doesn't always hit the points you provide.
modest rune
Other than, I think interpolating can be done between just 2 points and curve fitting indicates more?
desert oar
and yes interpolating is inherently pairwise between points
modest rune
@desert oar I don't think your definition is correct.
desert oar
whereas curve fitting is can be but doesnt have to be global
modest rune
I am pretty sure curve fitting doesn't have to hit all of the poitns.
Oh, I misread, my apologies
Ok, yes, that makes sense, it might be fair to say interpolation is a subset of curve fitting.
your "best" indicates that maybe you need to actually be removing outliers and not just fitting a smooth curve
@desert oar
I thought about that. I think in reality, the curve fitting model could have 'removing outliers' builtin to the model, or that could be a preprocessing step, OR, outliers could get removed as an artifact of the model, but happen in a non-explicit manner.
desert oar
smoothing or parametric modeling could take care of that. again, it depends a lot on the actual data you have and the kind of results you want
modest rune
OK, you were helpful, you gave me some keywords I can google and use as seeds to get deeper into the research, thanks!
I remember back to an engineering software package I used to use. And, basically, you could pick from about 10 different curve fitting methodologies, it made things seem pretty straight forward. Basically, if you had knowledge about how the 10 different methodologies worked (pros, cons, behavior), you would simply pick the one that best fits your needs, adjust the parameters used by the method, and then input your 1d, 2d, or Xd array.
I was half hoping an expert in the field would see my 3rd grade drawing as say... You need to use the Blah Blah Blah curve fitting method, and keep the X parameter low, and you will be a happy camper.
@desert oar if you don't mind me asking, what is your background and profession? You seem to always have well thought out answers.
And, I don't mind if my goal is earn a legitimate internet PHD in curve fitting.
I'll just write a crappy medium article as my PHD thesis, and post it to reddit for my dissertation.
desert oar
my background is "scattered bullshit" and my profession is "data scientist" 🙂
before you go on your way... is this the same problem you had the other day? where you have a 2d grid of points, and you are computing the value of some complicated expensive function on that grid?
you mentioned that you stumbled on chebyshev series fitting for that problem, i'd never even heard of that before
is this the same problem?
curve fitting is definitely outside my area of expertise btw, this field looks much more commonly used by engineers and natural scientists
http://www.mathcs.emory.edu/~haber/math315/chap4.pdf interesting resource
not sure what book this is from
 slate plover
I couldn't find a channel about numpy specifically so I'll ask here since it's probably where numpy is the most familiar
When I do np.array(image taken from PIL) and then save it to a file, I get a 3d numpy array/matrix based on the number of the brackets, but the actual size is a 2d list of 13 RGB arrays each grouped into an element
Does anyone know how numpy generates this? As in, in what direction do the pixels get read
Here's a shortened sample:
[[[ 78  78  78]
  [214 214 214]
  [221 221 221]
  [221 221 221]
  [221 221 221]
  [221 221 221]
  [221 221 221]
  [221 221 221]
  [221 221 221]
  [221 221 221]
  [221 221 221]
  [208 208 208]
  [ 69  69  69]]

 [[ 90  90  90]
  [247 247 247]
  [255 255 255]
  [255 255 255]
  [255 255 255]
  [255 255 255]
  [255 255 255]
  [255 255 255]
  [255 255 255]
  [255 255 255]
  [255 255 255]
  [252 252 252]
  [131 131 131]]

 [[ 90  90  90]
  [247 247 247]
  [255 255 255]
  [255 255 255]
  [255 255 255]
  [255 255 255]
  [255 255 255]
  [255 255 255]
  [255 255 255]
  [255 255 255]
  [255 255 255]
  [218 218 218]
  [ 45  45  45]]]
@slate plover yes, this is the numpy channel 🙂 the shape of the array is read from "outside in", if that makes any sense. so if you have data like this
array([[[ 0,  1,  2,  3],
        [ 4,  5,  6,  7],
        [ 8,  9, 10, 11]],

       [[12, 13, 14, 15],
        [16, 17, 18, 19],
        [20, 21, 22, 23]]])
you will have shape (2, 3, 4), i.e. a 2x3x4 array
@desert parcel do you mind posting your code and error as text, instead of a screenshot?
i can't read this easily
slate plover
@desert oar how does that translate exactly for an image like this
sorry the first is kinda small
since you said outside in I thought spiralling (since that's the only way to go outside in perfectly)
the thing is I specifically need to know the exact way that it chops up the image for my application purposes
velvet thorn
mind helping me with an issue
@desert parcel your code doesn't really make sense I think
odd yoke
the 2 most common layout for images are HWC and CHW (H for height, W for width, C for channel) if we assume HWC in your initial message https://discordapp.com/channels/267624335836053506/366673247892275221/745804498978603089, the triplets would represent the pixels in RGB, the arrays wrapping these triplets would be the rows (13 of them) and the arrays wrapping these rows would be the columns (3 of them)
velvet thorn
like the result of loss_batch is a string, not metrics, as your code seems to assume
odd yoke
@slate plover
velvet thorn
I'm thinking what you want to do is use zip(*...) to "transpose" the list of lists that is returned such that each list represents a column...
slate plover
Ah I see thanks a lot to both of you!
velvet thorn
...but if so, then loss_batch should be returning loss.item(), len(xb) and metric_result.
which suggests to me that you don't really understand what the code is doing?
and I've seen quite a few of your questions
that strengthen that impression
I would suggest you spend more time on basic Python and programming in general before doing something like ML?
there are a lot of complex abstractions in this field that can annihilate you
and I've seen way too many data scientists who are great @ statistics but couldn't code their way out of fizzbuzz.
desert oar
@slate plover no, it's "outside in" with respect to the physical structure of the array
the outermost set of []s to the innermost
the image, i have no idea. each "layer" is probably an r,g,b channel. the rows and columns probably correspond to pixels
dont overthink it
the number in the top left of the array is the pixel in the top left of the image
and so on
maybe its flipped vertically, reading from bottom to top. you'd have to consult the docs for that level of detail
slate plover
I see, got it 👍
odd yoke
yeah I should have mentioned that there's nothing enforcing it
for example the mnist dataset uses 0 = white, 255 = black in its visualization tool, which is the opposite of common greyscale images
desert oar
i wonder why that is
well dont they use white for the "drawing" and the black for the "background" anyway?
odd yoke
but yeah you can visualize it either way
but i've seen people get super confused over that when trying to traing models on mnist
because the custom images' pixel values they created were flipped
desert oar
i probably would be too
 short hearth
i want to start python ai with tensorflow
but which point i should start?
or any suggesttion of good yt channel or website
modest rune
is this the same problem?
@desert oar
Yes. Same problem. There are many ways to curve fit and I am trying to avoid going down the entire rabbit hole if a simple solution exists. So, I ask my question hoping for a profound and unexpecred insight, leading me down a productive research path.
When I asked a couple days ago, I was just getting started, today I have a slightly better understanding of how I need to fit my curve for my needs, which cause me to realize I don't want just any curve fit that looks good, I want a curve fit that is weighted towards the curve that most of the datapoints want to create.and less weighted towards the outliers.
All of this discussion is helpful, because I keep finding more material to read which is helping me sort through things.
desert oar
@modest rune nonlinear least squares seems to be one option (example https://kippvs.com/2018/06/non-linear-fitting-with-python/), lowess or loess is another option -- but i've only used it in 1d problems myself (matlab example https://www.mathworks.com/help/curvefit/examples/fit-smooth-surfaces-to-investigate-fuel-efficiency.html)

So you've got some raw data and a complicated model you're absolutely sure describes it. How to go about comparing the two in python? Answer: non-linear, least-squares fitting! It's easy enough in 1D, but how about over two independent dimensions? Or more than 2D?! Let's find ...
lowess and loess are not the same thing btw https://support.bioconductor.org/p/2323/
not sure if there is any implementation of loess or lowess in python for > 1d
https://towardsdatascience.com/loess-373d43b03564 and theres this too, which goes into detail on how lowess works and provides a numpy implementation
 desert parcel
sorry for the late reply
I'm getting the code now brb
google collab isn't opening
give me a moment
@desert oar https://hastebin.com/amibafulog.py I won't ping in future if you don't want me to
The error is that there are too many values, while only 3 were expected
Error output```
<ipython-input-12-85aa4f101ad5> in evaluate(model, loss_fn, valid_dl, metric)
18 results = [loss_batch(model, loss_fn, xb, yb, metric=metric) for xb, yb in valid_dl]
19
---> 20 losses, nums, metrics = zip(*results)
21 total = np.sum(nums)
22 avg_loss = np.sum(np.multiply(losses, nums)) / total`
 primal shuttle
I have a question: 2 vectors, coordinates [36, 2], [23, 3] as np.array stored under a variable. I am trying to simply plot the quiver plot in matplotlib of the two vectors starting from the point of origin and pointing to those coordinates - any help?
 dire pollen
hello hope someone can help me, given a pandas dataframe with multiple rows and columns is there a way after that to just pick one row?
velvet thorn
hello hope someone can help me, given a pandas dataframe with multiple rows and columns is there a way after that to just pick one row?
@dire pollen how do you know which row you want?
The error is that there are too many values, while only 3 were expected
@desert parcel did you read what I said above
dire pollen
the rows are years so i want to pick 1 year
the thing I want to do is a bit more complicated and Im not so much knowledgeable yet with python and pandas
i want to pick specific rows from different dataframes to make one with the rows i wanted
im not even sure if i can do that
velvet thorn
so what you want to do
is filter based on the value of a column
the column that contains the year values
 solemn hull
i dont know pandas but reading the doc https://pandas.pydata.org/pandas-docs/stable/user_guide/indexing.html
says you can do
df.loc[row_indexer,column_indexer]
I'm getting the info from an api so I actually don't know if I need to use specific commands
velvet thorn
you need to show an example of your data
and expected output
before anyone can help you I think
otherwise we can’t get much more specific than “index based on a boolean series”
dire pollen
the ID are the years so I want to take rows from each year from different dataframes and put them together
dire pollen
Yeah my plan is ID 20 get the rows from ID 20 from different players and make one
velvet thorn
actually, hold uo
up
so you want one dataframe per ID?
or just one dataframe for one specific ID
dire pollen
Hmm I want to pick one row from different players and put them together by ID (year)
velvet thorn
not really answering the question
okay, let me rephrase
ultimately, do you want stats for every single year
or just ONE year
dire pollen
Yes one year
velvet thorn
you need to filter
and then join (merge)
on mobile so can’t type code
but try looking @ the docs
dire pollen
But filter and join is after getting the dataframe right?
or I can filter the year I want instead of getting all years?
solemn hull
you can filter the years from each player and build some new object
for just that year
dire pollen
How can I do that? Is it after getting the dataframe or before and get just the row I want?
solemn hull
id have to play with pandas dataframes a minute, since they behave different than other python types
someone here more familiar would know better
dire pollen
Hmm I see thanks anyways
solemn hull
np, try to play with the commands from that documentation page, you might figure it out. try setting a new variable to one of your queries
like when you access a specific year, assign that to something new
then for another player try to append that same year to the new variable
dire pollen
Okay I will take a look to that!
solemn hull
https://www.youtube.com/watch?v=2AFGPdNn4FM try searching youtube too, i bet theres tutorials like this one more specific for what youre doing
Let's say that you only want to display the rows of a DataFrame which have a certain column value. How would you do it? pandas makes it easy, but the notation can be confusing and thus difficult to remember. In this video, I'll work up to the solution step-by-step using regula...
 muted oyster
career.loc[career.ID ==20,:]
Yeah I was doing some search of how to filter row by an specific value
df.loc[df.ID ==20,:]
@muted oyster How do I use that?
muted oyster
replace df by name of your dataframe
dire pollen
This may sound dumb but how do I know the name of my df?
dire pollen
I don't know I have been trying different things but it isn't working or I'm not using it properly
 muted oyster
yes then use
player_df.loc[player_df.ID ==20,:]
if ID is not integers then put 20 as '20'
solemn hull
yeah
 drowsy kite
Hey guys, i'm trying to productionize my model that looks like this (pre-processing):
https://i.imgur.com/M5elvEo.png
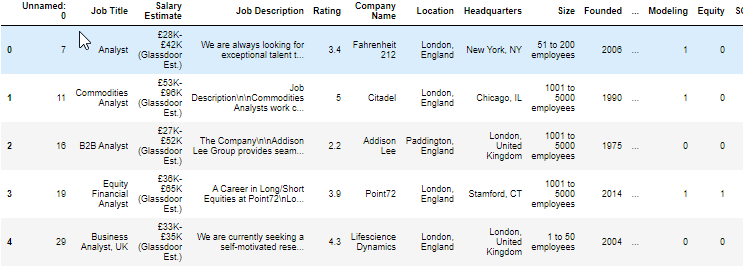


after applying pd.getdummies on the category columns i get the desired training result