#data-science-and-ml
1 messages · Page 243 of 1
 idle otter
ok thanks
it works but looks like i cant have 2 y values

so the line graph produced 2 different lines
is there a way to make it so that my scatter can have 2 different circles?
idle otter
is there a way to make them appear on the same one?
 arctic cliff
They will
arctic cliff
In the same cell
arctic cliff
Hm-
Give colors
For the second plot
add ax=ax1
Oh wait
You didn't define a var for the plots
Define them
arctic cliff
, color ='r/g/b'
idle otter
ValueError: 'c' argument must be a color, a sequence of colors, or a sequence of numbers, not ['r/g/b']
arctic cliff
I just gave examples of different values of a color xD
r = red
g = green
b = blue
You can use hex colors too
arctic cliff
add ax = 'bp' to sp
arctic cliff
No problem
arctic cliff
import matplotlib.pyplot as plt
fig, ax = subplots()
ax.legend(["example1", "example2"]);
ok thank you
but when you plot
do you only use pandas or a mix of matplotlib.pyplot and pandas
arctic cliff
No clue about the techniques experts use
I'm still a beginner
arctic cliff
But it seems like both are working
unless you need to add more features to your figures like styles, legend and etc.
Trust me I don't xD
arctic cliff
Anytime buddy
 oblique belfry
Has anyone used the Pytorch C++ Frontend?
idle otter
im stuck with the legend part now
how would i make it so that it's labelled correctly? @arctic cliff
arctic cliff
How is it labelled for you ?
idle otter
actually
i dont know how to make it show
i tried using plt.show()
but nothing shows up
arctic cliff
In the same cell
idle otter
ight
arctic cliff
And you didn't do the axes thing
fig, ax = subplots()
Before your dataframe plotting
Don't know if that really matters, But just in case
idle otter
wont that make a new plot
arctic cliff
What do you mean ?
idle otter
ok
getting quite busy
but i think i get what u mean
ill be back later
@arctic cliff
i tried setting ax=ax
but legend just doesnt show
o wait
haha
i just needed to add labels
ill try using fig, ax = plt.subplots() in the future
because it looks like it's easier to customize the graphs
 modern canyon
hello y'all, I am shortlisted for an internship and I was given the following task: "Write a function in python that take dataframe as input and drop columns having Pearson correlation more than 0.85"
What kind of dataset should I use for this task?
 fervent bridge
1/Unknown - 0s 23us/step - loss: 2.9841 - accuracy: 0.0000e+00
2/Unknown - 0s 51ms/step - loss: 1.4920 - accuracy: 0.5000
3/Unknown - 0s 65ms/step - loss: 0.9947 - accuracy: 0.6667
4/Unknown - 0s 74ms/step - loss: 0.7460 - accuracy: 0.7500
5/Unknown - 0s 78ms/step - loss: 0.5968 - accuracy: 0.8000
6/Unknown - 0s 81ms/step - loss: 0.4973 - accuracy: 0.8333
7/Unknown - 1s 83ms/step - loss: 0.4263 - accuracy: 0.8571
8/Unknown - 1s 85ms/step - loss: 0.3730 - accuracy: 0.8750
9/Unknown - 1s 86ms/step - loss: 0.3316 - accuracy: 0.8889
10/Unknown - 1s 88ms/step - loss: 0.2984 - accuracy: 0.9000
11/Unknown - 1s 89ms/step - loss: 0.2713 - accuracy: 0.9091
``` Not normal I imagine, what could be the cause? near moss
@modern canyon simple solution here: https://chrisalbon.com/machine_learning/feature_selection/drop_highly_correlated_features/
How to drop highly correlated features for machine learning in Python.
what do you find no normal there @fervent bridge ?
(you should also print out the validation accuracy in order to check that you're not over-fitting)
idle otter
@arctic cliff thank you for your help man, can't be here without you
 dense comet
Out of curiosity, are you following some sort of manual to generate that with sample data?
modern canyon
@near moss will it work for categorical features too?
dense comet
That's neat, thank you for that!
idle otter
my data is from a game's economy
it's more interesting if you are playing with data that you care about
🙂
near moss
for categorical features you have to encode them first
modern canyon
@near moss like one-hot encoding?
near moss
yes
modern canyon
thanks for the info
 serene scaffold
A friend of a friend is asking me for help with overfitting for an audio classification task they're trying to do. My only idea is to see if they're using a feature-based algorithm and remove some of the features but if it's featureless then I'm not sure
decrease the number of epochs?
 tidal bough
I think another general, if not always good, way is to intentionally introduce noise into the input data.
harder to overfit then.
serene scaffold
I assume this affects precision more than recall?
tidal bough
I suppose. I've never used this method in practice - the principle is that the noise hides the properties that are an artifact of your training set while leaving more general relationships intact.
 sudden cedar
I'm trying to make a ml model that reads finger counting, but I don't know the best way to store a large amount of images with their value
Can someone help
nvm
modern canyon
random question: should I drop columns that have strong negative correlation?
 velvet thorn
why do you think so?
modern canyon
to eliminate multi collinearity
velvet thorn
that seems like a non sequitur to me...
fervent bridge
@near moss I mean is it normal? isn't loss dropping to fast and accuracy being near 99% not good?
I shuffled my data before hand
velvet thorn
@near moss I mean is it normal? isn't loss dropping to fast and accuracy being near 99% not good?
@fervent bridge it depends
you can get >99% accuracy on MNIST
fervent bridge
286/Unknown - 259s 904ms/step - loss: 0.0077 - accuracy: 0.9969
286 batch of 32 batch size
I got to 90% without batch after 20 the 20th feature
velvet thorn
where's your validation set
fervent bridge
haven't passed it in yet, just testing I thought working on a 227x227x3 image should take a lot longer then 23ms/step
fervent bridge
I have my validation data in just haven't let it running long enough
data is 28k long I will let it run for a bit longer then and pass in validation just didn't find it worth it as I thought something was going wrong
It could also be because the data set I am using is very simple?
finding cracks in concretes
o.o
Oof weird dropped to 66% accuracy later down the road at around 24k
Guess this is a good thing then?
752/Unknown - 800s 1s/step - loss: 3.5889 - accuracy: 0.5804
752nd batch
near moss
yes... whereas I would rather use an information criteria than a correlation to drop columns
velvet thorn
Guess this is a good thing then?
@fervent bridge no.
that is weird.
did you shuffle your data
?
fervent bridge
yes it was shuffled before hand but only once
should I keep reshuffling per batch?
near moss
this is not necessarily weird, learning rate was too high and the parameters escaped the local minimum previously reached I guess
fervent bridge
875/875 [==============================] - 1095s 1s/step - loss: 3.1066 - accuracy: 0.4988 - val_loss: 3503.7166 - val_accuracy: 0.0000e+00```Isn't the default learning rate 0.001 @near moss ?
This being for adams
sudden cedar
how would I iterate through a folder of images to input into my model
sudden cedar
but how would i do that with batch sizes
velvet thorn
are you using TensorFlow?
sudden cedar
yes
velvet thorn
modern canyon
any one here good with multiprocessing?
I need to divide a pandas DataFrame into chunks and run a function through them and combine it back
velvet thorn
why?
modern canyon
to make it faster, i guess ?
velvet thorn
what makes you think it will be faster
how big is your dataframe
how long is it taking
and what's the function
because...
velvet thorn
pandas is numpy-backed, which means that if you write your calculations right, they generally are already parallelised
modern canyon
I see
def date_difference(df:pd.DataFrame) -> pd.DataFrame:
    """
    Takes an input dataframe and returns a dataframe of differences between all the date columns
    """
    # excludes all columns other than types np.datetime64 and object
    temp_df = df.select_dtypes(include=[np.datetime64,object])

    # converting the columns to datetime timestamp objects
    # if it's not a valid timestamp, fills it with pd.NaT -> (N)ot-(A)-(T)ime, the time equivalent of NaN
    # this also handles different date formats by converting all columns to the format YYYY/MM/DDDD
    temp_df = temp_df.apply(lambda x: pd.to_datetime(x,errors='coerce'))

    # checking if the columns have dates and discarding the ones that don't
    for col_name, col in temp_df.items():
        if len(col[col.notna()]) == 0:
            temp_df.drop(col_name, axis=1, inplace=True)

    # storing obscure columns for dropping it later
    obscure_columns = list(temp_df.columns.values)

    # calculating date difference between all possible combinations
    for i in list(itertools.combinations(temp_df.columns,2)):
        temp_df[i[0]+ ' - ' +i[1]] = [f"{-td.days} days" if td.days < 0 else f"{td.days} days"
                                      if not isinstance(td,type(pd.NaT))
                                      else pd.NaT for td in (temp_df[i[0]] - temp_df[i[1]])]

    # dropping date columns so we only have the difference columns
    temp_df.drop(obscure_columns,axis=1,inplace=True)
    return temp_df
this is precisely the kind of situation comments were not made for
modern canyon
this is the function, basically it finds the columns with dates and finds the difference between them
velvet thorn
in general, it is better not to write comments that say only what a line of code is doing
you can replace your loop
with .dropna(axis=1)
the first loop
the second is parallelisable, and it's not something numpy can help with...
...but I'm not really sure whether it would give a speedup
you want the difference in days, right?
modern canyon
yes
velvet thorn
in general
for two columns of datetime type
no, scratch that
for a column of datetime type
never mind I will illustrate
modern canyon
don't assume all values are datetime stamps
oblique belfry
Depending on the dataset and function, dask might be a drop in replacement
modern canyon
some might have "invalid entries" in them
oblique belfry
Sorry. Little late, I know.
modern canyon
what's a dask?
velvet thorn
it's a library
that parallelises pandas
some might have "invalid entries" in them
@modern canyon don't you intend to drop them
in the previous step
modern canyon
nope, only if all entries are invalid
velvet thorn
okay
you can replace that with .dropna(axis=1, how='all')
and then
NaT values propagate
>>> df
           a          b
0        NaT 2020-03-13
1 2020-04-18 2020-04-23
>>> df['a'] - df['b']
0       NaT
1   -5 days
yeah, IMO it's a good thing
velvet thorn
you don't need the if either
>>> (df['a'] - df['b']).dt.days.abs()
0    NaN
1    5.0
also you don't need to convert to list
so like maybe something like this?
differences = [(df[first] - df[second]).dt.days.abs() for first, second in itertools.combinations(df.columns, 2)]
replace variable names as needed
and then pd.concat
i.e. don't modify your original dataframe
modern canyon
differences = [(df[first] - df[second]).dt.days.abs() for first, second in itertools.combinations(df.columns, 2)]
@velvet thorn pretty neat, thanks for this!
modern canyon
okay
modern canyon
👍
this is precisely the kind of situation comments were not made for
@velvet thorn what's wrong?
velvet thorn
you don't comment to tell people what you're doing
you comment to tell people why you're doing it
you don't comment to tell people what you're doing
@velvet thorn if they're competent they should be able to tell that from the code
if they can't, either they're reading code that's too advanced for them
or the code is written poorly
in general.
on the other hand, why certain operations are being performed may not be obvious
that is what you want to comment
"what" code is doing should, if anywhere, be in docstrings
modern canyon
I see, I normally don't comment this much, but commenting well was stressed again and again in the instructions I received.
that's why
modern canyon
tbh it's for an internship in the industry, but I get what you mean.
 shell swallow
hi! Does anyone have the time to help me out with a class project I've hit a stonewall with?
It's due tuesday and I know I'm overfitting my data but I'm struggling to solve it.
velvet thorn
tbh it's for an internship in the industry, but I get what you mean.
@modern canyon oh yeah, you mentioned that
well...many companies are bad with this kind of thing too IMO
especially @ the entry level
modern canyon
agreed, especially in Asia (where I'm from)
modern canyon
they pay peanuts lol
velvet thorn
I guess one important thing is not taking outside opinions as a given
modern canyon
true that
i.e. don't modify your original dataframe
@velvet thorn any specific reason for this?
velvet thorn
- it's inefficient (adding columns, then dropping the others)
- it's ugly (this is an IMO thing)
modern canyon
bruh do you have speech to text or something
how the hell do you type that fast
it's like you have your answer typed before i enter the question
shell swallow
Can anyone help me with a neural network problem identifying birds?
 hollow silo
i need some help with pytorch
anyone familiar?
Can anyone help me with a neural network problem identifying birds?
@shell swallow look up papers that show results on fine grained image classification o nthe CUBS dataset
shell swallow
unfortunately that's a bit above my level.
hollow silo
fine grained image classification shows stae of the art performance on bird classification
you could give it a go
hollow silo
oh
shell swallow
but unfortunately by the time the class got the point where machine learning stuff was introduced it's a bit late to change the group project in general.
hollow silo
you are trying to do it by sound?
shell swallow
yeap
using the xenu canto data set for 5 birds and trying to get it to tell them apart.
hollow silo
Medium
How group of Polish women used deep learning, acoustics and ornithology to classify birds
nvm
my guess is you’ve already looked this up
shell swallow
yeap
hollow silo
and it was not helpful
shell swallow
struggled to implement it
would be if I could get it to compile into a tflite file that the app side of our project could use
hollow silo
you could try
shell swallow
it's really frustrating because with 1d convolution on the sound files themselves I've got it to .52 accuracy for 5 birds.
and then it plateaus hard.
 jovial thorn
Hey! I have a question, I'm doing np.prod on this matrix [-74 -9 -5 -4 -4 -4 -4 -4 -4 -4 -4 -4 -4 2 3 4 5 32 32 -2] and it returns zero, what could be wrong?
I've debugged it like 4 times but the return is the only place it fails 🤔
can using np.concatenate break np.prod?
 native patrol
what is the dtype of that np array?
In [30]: np.prod(s, dtype=np.int64)
Out[30]: 858134465740800

In [31]: np.prod(s, dtype=np.int32)
Out[31]: 0

In [32]: s
Out[32]: [-74, -9, -5, -4, -4, -4, -4, -4, -4, -4, -4, -4, -4, 2, 3, 4, 5, 32, 32, -2]
@jovial thorn
native patrol
yes ... i've been bitten by it in the past as well
jovial thorn
why is it happening? 
native patrol
well 858134465740800 is well above 32 bit integer limit
jovial thorn
thanks a lot for your help!
oooh
so the moment it goes to high, it just turns to zero?
velvet thorn
integer overflow
jovial thorn
I was reading about Integer Overflow, I knew it happened but never came across it
is there a way to handle values above the 128 bit max?
jovial thorn
I'm trying to get np.prod() for an array that can be user input
so if, for example, someone enters an array of only 1000 values 50 times, the product of that is going to be higher than the 128bit limit, so I won't be able to handle it
velvet thorn
must you use numpy?
jovial thorn
no
velvet thorn
use a normal Python list then
jovial thorn
it's just a familiar way to get the prod of a matrix
jovial thorn
true
velvet thorn
okay, doesn't really matter
velvet thorn
anyway, if it's not a lot of values
I would suggest just using a list
there are more esoteric methods but they seem to be overkill for this situation
velvet thorn
np
jovial thorn
🙂
 ancient forge
Okay, if this question is too specific for this channel, or this isn't the right channel at all, let me know. I've finally reached the end of where I think documentation and stackoverflow can take me. Trying to get a bokeh patches plot of a pandas dataframe with hover tooltips. I can get the tooltips to display, but the actual values just return '???' So far i've tried @column, @$column, and just $column.
hover.tooltips = [ ('Minimum Pressure: ', '@MinPressure'), ('Maximum Pressure: ', '@MaxPressure'), ('Minimum Temperature: ', '@MinTemp'), ('Maximum Temperature: ', '@MaxTemp'), ('Materials: ', '@Materials') ]
ancient forge
using Python 3.8.5 and Bokeh 2.1.1
 halcyon vale
Is using ImageGenerator API of Keras great to use for auto labelling, or can you guys recommend me to try so more powerful API for the same purpose.
I mean can you guys list name of similar APIs , I should checkout
 slate scroll
"great to use for auto labelling", what are you labeling and how is generating random images going to help you label it?
Also, "auto labelling" is in itself a pretty ambiguous term in image processing context. Is this classification or segmentation?
I should really use Keras more, I had never seen this: https://keras.io/api/preprocessing/image/#imagedatagenerator-class
But it definitely does not label anything. It is for augmenting existing data.

 austere swift
so right now I'm mainly using keras for neural networks with their model api, but is there any big differences between keras and pytorch? like does pytorch have some features that keras doesnt or something?
I might try switching to pytorch but I'm not sure that's why I'm asking
 bitter harbor
it seems like it depends on the architecture you need/the size of your data set
keras works better with smaller sets/less complex nn's but it's also slower than pytorch (which is written using a low-level api)
halcyon vale
I prefer to use keras more, But when i feel i can do this with Fastai, i use fastai API which is built on top of PyTorch by Jeremy Howard. The Fastai API seems quite difficult to me but once it is understood it is the most powerful one
anyone who is familiar with Fastai
@karmic dune i am using for binary image classification, i also knew ImageGenerator API today, and I am doing one simple human vs horse image classification project focusing only on ImageGenerator implementation
 copper wolf
what is np.nan?
what value does it hold?
ok cool it's not a number but is it the same as None?
 acoustic halo
No, it still has a value
copper wolf
cool, so what value does it represent
acoustic halo
Could be anything that is not a number, confusingly represented by a float
copper wolf
and wikipedia mentions that it's a member of a numeric data type
but can be interpreted as a value that is undefined
so it could be a character like a letter represented by a floating point? im not getting the gist
acoustic halo
so like root -1
acoustic halo
Or something divided by 0
austere swift
so by keras being slower, do you mean training? preprocessing? like what part of it is slower
 dreamy fractal
Hello guys, I was wondering if there is an equivalent to Tensorflow's flow_from_directory method for other types of data other than images. I would like to train a model on a set of audio files without loading them all to memory at once.
bitter harbor
so by keras being slower, do you mean training? preprocessing? like what part of it is slower
I'm pretty sure the bulk of pytorch is written in c++
austere swift
yeah but what i mean is what part of the code will be slower
i get that it's a lower level api so it would compile faster but would it make like the training take longer or something?
 teal star
How to make a function that finds the difference between each of the elements (of similar data types) in the dataset?
 odd yoke
well, keras is basically just a tensorflow (or whatever other backend) frontend, i wouldn't be surprised to see some operations not as optimized as they could, and some slight overhead, but really if you care about which one is faster, and where the other is slower etc, you should try both, and properly benchmark and profile them
i remember a few months ago, i had a lot of issues with IO and keras
that was the only time i tried it, i stopped using it immediately i admit, it's probably changed, but you won't know until you benchmark it
austere swift
yeah I use the tensorflow backend and I havent had any issues with it
 teal notch
I want to learn python imaging library but i can't find any good sources to do it
 lapis sequoia
hey guys, i am done with the basics of numpy and pandas
should i move to machine learning now or first learn stats?
austere swift
try to learn about some of the math behind it first and don't jump into like neural networks and stuff instantly, understanding the math behind it will make your life a heck of a lot easier
 desert oar
imo neural networks are actually easier to understand when you know the math
less magic, more "oh yeah huh thats clever i get it"
odd yoke
i don't think anyone disagrees with that :p
or if some do, i'd be really interested in understanding their point of view
lapis sequoia
Pandas question: How can I drop rows in a dataframe if a cell can't be found in a dict? This throws an error
some_dict = {hey: 1, there: 2}
df = pd.read_csv(...)
df = df.drop(df[df.foo not in some_dict].index)
But this works: df.drop(df[df.foo != 'Delilah'].index)
arctic cliff
df = df.drop(df[df.foo not in some_dict.values()].index) ?
@lapis sequoia
Forgot the brackets
lapis sequoia
ValueError: The truth value of a Series is ambiguous. Use a.empty, a.bool(), a.item(), a.any() or a.all().
near moss
adding the dimension maybe? df = df.drop(df[df.foo not in some_dict.values()].index, 0)
arctic cliff
I googled that, They say I have to use bitwise or something instead of not in ?
 paper niche
@lapis sequoia you can just do a query to keep the rows that fulfil the boolean condition.
df.query("foo in @some_dict.values()")
Interesting. Though I'm probably doing it wrong cause it removes all rows
oh
nvm
arctic cliff
@paper niche What's the usage of queries ?
paper niche
It's similar to using .loc. For example, if you have a dataframe with columns A and B and you want rows where A>B, you could do: df[df['A'] > df['B']], or just df.query('A > B')
arctic cliff
@lapis sequoia df = df.drop(df[df['a'] != l.values()], axis = 0)
That worked for me too
Oh !
That's handy
lapis sequoia
Thanks Pizza Steve, though the query command is simpler and not so convoluted when I don't use filler names
arctic cliff
I agree
 grave frost
Anyone here every used Google Compute Engine's GPU to train a model??
odd yoke
would be easier if you asked your question 🙃
grave frost
- If we use a VM instance with 4 GPU's (I am planning to use 4x TESLA T4's), are we billed for the time it takes to set up the environment? like if the usage is below 5% or something, it would not charge for the time it takes to install TF and CUDA?
- I am looking to use something called "pre-emptible" instance where the server can take my resources anytime (kinda like Colab) since I use it's excess resources. In that case, If I setup my whole environment there, then would it be lost in case my instance is terminated?
- Lastly, If I setup my env on a 2 GPU machine, but later need to migrate to a different setup, is it one-click, or would it take more hours to get everything ready on a new instance?
lapis sequoia
can anyone help with matplotlib in spyder? the plot isn't showing up (inline or otherwise) when using the plt.show()
odd yoke
- you are billed for the entire time the VM is up, including the time it takes to set up your env, you can lower that by not adding the gpu until the env is ready, you can also test your code with a cheap gpu before getting the big bois
- no idea, sorry
- It is trivial to move from a N-GPU vm to a single GPU, the issue may reside in adapting your code to fit multi gpu, if it does already, you're set
@grave frost
adding/removing gpus is just a matter of shutting down the VM, going to the compute engine interface, clicking modify on your instance, and ticking boxes
grave frost
3> It does it already with a couple of flags in the YAML file. Nice to know that I can upgrade so easily. However, it's the premtible thing that causes me shivers. In colab, the env does die out and you gotta run the cell that installed the packages again. I just hope it's not there in this instance. Would you happen to know where you post such queries, except the Google help Forum??
odd yoke
there's no such thing on compute engine
it's just a good old ssh connection to a remote server, it doesn't shut down after N hours
(not having VMs automatically shut down is how VPS providers make their profit margin)
grave frost
https://cloud.google.com/compute/docs/instances/preemptible --> Preemptible VM's

Google Cloud
Learn about Compute Engine preemptible virtual machine (VM) instances
odd yoke
because ppl forget them, and pass out when they see the $900 bill at the end of the monh
oh, i see, didn't know about these
grave frost
It happened with me just a week ago 😆 had to file a refund for around 400$. Got it back in the end...
odd yoke
so my guess would be that the instance simply gets killed
grave frost
But at that time, I wasn't using Compute Engine. So I am a bit apphresnive about CE since it's too billable
odd yoke
so everything will stay there, but your program may be shut down unexpectedly
grave frost
🥳 🥳 🥳 🥳
odd yoke
If your apps are fault-tolerant and can withstand possible instance preemptions, then preemptible instances can reduce your Compute Engine costs significantly. For example, batch processing jobs can run on preemptible instances. If some of those instances terminate during processing, the job slows but does not completely stop. Preemptible instances complete your batch processing tasks without placing additional workload on your existing instances and without requiring you to pay full price for additional normal instances.
this sounds like a nice description
odd yoke
they list the limitations below, make sure you read about them
like
Compute Engine always terminates preemptible instances after they run for 24 hours. Certain actions reset this 24-hour counter.
grave frost
It doesn't allow live migrations. But still, it handles moves to more resources If I want after terminating the instance. Completely fine by me, since the whole thing is just so cheap. (18$ for 30 hours with 4x T4 GPU's) 🍰
odd yoke
holy shit, that's cheap
grave frost
Not to mention I am using a compute-optimized CPU with 32 gb RAM (along with 64Gb from the GPU's). It's so cheap that I could barely beleive my eyes 👀
odd yoke
oh uh
I'm looking up benchmarks and apparently the T4 is quite mediocre
Oh, it has 16GB
grave frost
It is mediocre in the fact that CUDA cores are only 2500. But it has 320 Tensor cores too, which speed up DL and on top of that 4 of them result in 10,000 cuda cores approx. and 1220 Tensor Cores, enough I hope to train a transformer model..
Though they said that it took them 48 hours for 8x K80's. I hope to do it in 30 hours of GPU time. Let's see how they fare...
grave frost
@odd yoke BTW how did you make that rotating Profile pic? seems pretty cool 😎
 strong trench
@grave frost moving pfps are for nitro users, along with all the moving emojis
tidal bough
@serene scaffold Are you by chance trying to parallelize training/applying a model, and it's serializing it that's the problem?
I had a similar problem. The solution was making the model be grabbed by the function itself (as a global (to the function) variable), rather than passing it as an argument. So instead of doing
Parallel(n_jobs=-1)(delayed(generate_session)(agent,env) for _ in range(n_sessions))
, where agent is the model, I changed the function to have no arguments:
Parallel(n_jobs=-1)(delayed(generate_session)() for _ in range(n_sessions))
@tidal bough I'm only trying to make a large number of predictions. The model doesn't change
tidal bough
doesn't really matter - I had problems with joblib complaining about not being able to serialize the model, until I stopped passing it as an argument.
strong trench
https://repl.it/@FishingFights/VERY-SIMPLE-neural-network#main.py
im studying ML and im trying to really understand the math behind it, could someone walk me through this a little bit?
 near moss
whaz comes to my mind when I think of joblib...
bitter harbor
@strong trench how well versed are you in linear algebra for starters
bitter harbor
Personally I’d suggest 3b1b’s videos on nn’s and linear algebra as sort of a crash course
But even basic neural networks rely on mostly la along with some statistics
strong trench
ah
 dim olive
I was given a problem that I absolutely bombed.
Given a list of temperature readings (one reading for every hour) for x number of days, predict the temperatures for every hour for the following n number of days.
Would this use regression? I am not formally educated in data-analysis so I am curious how anyone here is tipped off to the best method to use.
near moss
you can use many methods for this, from simple moving average, or more sophisticated Fourier decomposition until full scale LSTM...
dim olive
I was given the function
function(startDat, endDate, temperature, n):
  # n is number of days to predict
  # yes it was camel case
  return # the prediction array
I tried using a moving average and my numbers were way too stable
bitter harbor
Ya so call the function with n +/- 1
I think Fourier decomp might be your best bet tho
dim olive
i.e, the previous day had a temps of [31, 33, 36, 35, 28, 24]
but the next day was expected [27, 28, 32, 31, 22, 17]
ok, ty I will look into that
near moss
I tried using a moving average and my numbers were way too stable
That shouldn't be very surprising given the way moving averages are computed... what about applying Fourier decomposition on the difference between the datapoints and their moving average? Or normalizing the values and use sarima?
dim olive
I know very little about data analysis. I got cocky and thought my stats abilities would help, but my results were very off and I ran out of time
oh yeah, this looks about right haha
I'm a noob and literally tried to find such a method by using physics keywords haha
the problem is I do not have the brain power to convert it from physics to the data I was using 😛
bitter harbor
That’s how I get through most of my projects honestly even if they aren’t related 😂
near moss
it's rarely a bad idea to read books 😉
dim olive
haha, it is so hard though 😢
speaking of which: do any of you happen to recommend any on this topic?
near moss
hmm I am not aware of a book that would really stand out the others in the topic of time series analysis
any introduction book about this topic will do I guess
bitter harbor
Maybe something stats/data analysis related?
dim olive
Ok, I'll keep my eye out.
I'm not super into this stuff, but I want to be marketable xD
I'll just slap some ML on it and call it a day
bitter harbor
Ya idk I’ve only ever read 2 data-science books I think it’s easier to find/understand what you need from the interwebs
Imo
dim olive
good to know.
I am mostly here because I struggle with all things data analysis when it comes to my google abilities
Which is odd, but frustrating
did you receive formal education for something related?
if you dont mind me asking
bitter harbor
Ah no i started programming around march
but im starting uni in a couple weeks for cs/physics/math
dim olive
oh dang
desert oar
@dim olive moving average with a smaller window maybe? 🙂
dim olive
I graduated with a BS (technically in engineering) and cant do this stuff xD
yeah, I am interested in a moving average solution as I am familiar with stats like this.
While I think my model using stdev and moving average was technically very accurate given the window I was looking at, it did not respond to change well, therefore it would lead to very high accuracy in the beginning, but quickly fell apart as it was not very responsive to the cycle.
I.e it was VERY accurate at times of the day where the temp was about +- one stdev from the day average, but off by up to 50% for the hottest and coldest parts of the day
using my method it also followed the previous cycle very closely, but many days' expected values had changes much greater than their related values in the given cycle
bitter harbor
Are the temps relative to different seasons or is your data set not that big?
Im not too familiar with moving average but my only other thought is to standardize the data first
dim olive
haha, ty vm
 dim olive
the data set was up to 48 * 24 hours, I do not know if I was meant to take into account season. It did not specify
I was given dates in datetime, but some sets were 1 day, others were up to 48 days
desert oar
Ive heard it said that ETS is probably your best bet for a "default" forecasting model
dim olive
and the data given does not match the data I need to process.
I.e it may give me two days of temperatures and I need to predict the next 36 days
desert oar
Are they the same "time step" between measurements?
dim olive
one hour, yes
desert oar
But you have many such sequences of hourly measurements?
And presumably they all follow similar patterns?
dim olive
I would be given between 1 and ( think) 150 days worth of hourly datasets
And they all follow the pattern expected from daily temps (low, high, low)
desert oar
Ok. Let me see if i can come up with something. Ive encountered problems like this before but i wasnt satisfied with my own solutions
Im thinking to use a bayesian model or some other model that allows you to pool information across all those time series
Maybe even something ad hoc like applying seasonal/cyclical components learned on other data to future data, without having to relearn all of it for every new time series
dim olive
This was a technical assessment so It was done in their editor and had many limitations
ohhhh I didnt think about bayes
desert oar
Actually this one might be good for stats stackexchange
dim olive
I wanted to use sklearn as I have done something similar before in ml, but could only use standard library xD
desert oar
Oh its a job interview? I wouldn't get that job
dim olive
I sure didnt
desert oar
Yeah
desert oar
Time series is probably my weakest area
dim olive
I would really like to learn this, but it is beyond me.
I have forgotten more stats than I learned at this point, LOL
desert oar
Other than image audio video which i know nothing about except CNNs are a thing
This is a great stats stackexchange question
dim olive
I was trying to use std dev and moving average, but with 30 minutes left I realized I couldnt make it work so it was over
desert oar
I'll ask and @ you if i get an answer
desert oar
What programming language were you allowed to use
dim olive
Any
desert oar
Oh
dim olive
Obj I used python haha
desert oar
I probably would have used R
dim olive
there were restrictions, but most.
I do not think it had JS or TS, but it had most mainstsream
I have never used R, but I agree it is probably better equipped
I used excel for problems like this in college (what a waste)
desert oar
Maybe the python lib sktime supports models like this
Or prophet
Otherwise you can get really really hacky and fit a regression on day of week converted to polar coordinates
Which might be the solution they had in mind
dim olive
I think it was maybe meant to be a regression problem.
I am unfamiliar with all of this as I have only ever used sklearn for such analysis xD
other than statistics, but I feel like college was a bit of a joke overall
desert oar
Unfortunately there is a lot less "great statistics educational material" than "great deep learning educational material" out there
And i do think there is a place in the world for both skillsets, ive been trying to be at least competent in both
dim olive
yeah, it was a bit humbling haha. I learned sklearn because it was easy and effective, it really throws me off to essentially be shown these skills are not desirable in this specific field
dim olive
I mean sklearn haha
desert oar
Same with sklearn
ancient forge
statistics has been my everest. next semester is attempt 3 for me
modern canyon
any one here used KALDI toolkit for automatic speech recognition?
 charred blaze
that forecasting book is good
Kaldi's a real pain in the ass to use.
There's a wrapper for it in Python which is PyKaldi and even then you still need to invest quite a bit of time to grok it.
 mellow spruce
Is it possible to generate a new column of a data frame of time stamps keeping the time stamp of the first row similar to the old column and then adding time deltas to that first time stamp to generate more time stamps
i.e:
      1  |2020-03-16 23:18:10|0days 00:43:00
      2  |2020-03-17 00:25:30|0days 00:44:00
      3  |2020-03-17 01:30:14|0days 00:35:00```

To

```Stage|Start|Process time|Theorical Start
      1 |2020-03-16 23:18:10|0days 00:43:00|2020-03-16 23:18:10
      2 |2020-03-17 00:25:30|0days 00:44:00|2020-03-17 00:02:10
3 |2020-03-17 01:30:14|0days 00:35:00|2020-03-17 00:37:10 ```I was thinking on setting the first value manually and then using a lambda function to calculate the new time stamps using the previous time stamp+ processtime but I am not sure how to exclude the first row from this lambda calculation
 opaque stratus
Hello, I have a question:
I trained a classifier to classify watches by brand and a regressor to predict the price of a watch
I exported the models and am currently sitting on 2 .pkl files
Any tips/suggestions for deploying these ML models into production? I don't know where to get started...
I was hoping to make a nice little webpage/app with them 😄
velvet thorn
Hello, I have a question:
I trained a classifier to classify watches by brand and a regressor to predict the price of a watch
I exported the models and am currently sitting on 2 .pkl files
Any tips/suggestions for deploying these ML models into production? I don't know where to get started...
I was hoping to make a nice little webpage/app with them 😄
@opaque stratus what do you mean by "deploy into production"
like what will the UX be like
Is it possible to generate a new column of a data frame of time stamps keeping the time stamp of the first row similar to the old column and then adding time deltas to that first time stamp to generate more time stamps
i.e:
      1  |2020-03-16 23:18:10|0days 00:43:00
      2  |2020-03-17 00:25:30|0days 00:44:00
      3  |2020-03-17 01:30:14|0days 00:35:00```

To

```Stage|Start|Process time|Theorical Start
      1 |2020-03-16 23:18:10|0days 00:43:00|2020-03-16 23:18:10
      2 |2020-03-17 00:25:30|0days 00:44:00|2020-03-17 00:02:10
      3 |2020-03-17 01:30:14|0days 00:35:00|2020-03-17 00:37:10 ```
@mellow spruce create a column of timedeltas with the first entry set to 0
opaque stratus
Hey, thanks for responding: like... perhaps I could make like an image box, where someone can drag and drop a .jpg image of a watch and it could return the brand and price?
opaque stratus
i tried doing something with node.js
velvet thorn
JS in general
velvet thorn
okay, minimally, you're going to need some HTML/CSS
and it's not going to be pretty
so basically
you need 3 components
- some kind of frontend to display to the user and interact with the backend
- some kind of backend to validate user input and pass it to the model, and to pass results back
- your machine learning model
since your idea has very limited dynamism you can probably get by with combining 1 and 2
with...Django, perhaps
or you could build a simple frontend with some framework and just use Flask for 2
since I don't see a need for persistence
desert oar
Serving the model on the backend can also be done with one of those model serving platforms
Someone today posted Cortex which looks good
velvet thorn
yeah, that’s if you don’t wanna build your own stuff
which is defo a viable approach
at the very least it makes things a lot faster
the abstractions available for deployment (not only ML, but in general) have really gotten much better in the past few years
serene scaffold
        for target in ('tags', 'relations'):
            # Normalization
            for key in self.scores[target]['macro'].keys():
                self.scores[target]['macro'][key] = \
                    self.scores[target]['macro'][key] / len(corpora.docs)

            measures = Measures(tp=self.scores[target]['tp'],
                                fp=self.scores[target]['fp'],
                                fn=self.scores[target]['fn'],
                                tn=self.scores[target]['tn'])
            for key in self.scores[target]['micro'].keys():
                fn = getattr(measures, key)
                self.scores[target]['micro'][key] = fn()
what is this person doing and why?
looks like they're dividing the macro precision, recall, and f1 scores by the number of documents in the corpus
velvet thorn
that code hurts my head
velvet thorn
looks like they're dividing the macro precision, recall, and f1 scores by the number of documents in the corpus
@serene scaffold but why?
serene scaffold
not sure
velvet thorn
that doesn't make sense
lapis sequoia
good lord I haven't worked with padnas in a long time and I basically forgot everything there is about it
So I have a dictionary, and I need to scale the values in a column by some amount according to another column
Basically I have a table of pressure readings. One column contains type (bar, psi, etc) and the other the value
I want to normalize the values to bar
and I have a dictionary with the required factors I need to use:
pressure_unit_factors = {
    'bar': 1.,
    'kpa': 0.01,
    'psi': 0.0689475728,
}
I've tried this: df.apply(lambda row: row.pressure * pressure_unit_factors[row.pressure_unit]) but pycharm complains Expected type 'function', got '(row: Any) -> Union[float, Any]
 gaunt shuttle
what do you mean normalize to bar? You want to normalize values to 1? Can you give us an example?
velvet thorn
good lord I haven't worked with padnas in a long time and I basically forgot everything there is about it
@lapis sequoia if I understand you correctly, you wantdf['value'] * df['type'].map(pressure_unit_factors)
lapis sequoia
Ah thanks gm
grave frost
Hmm.. If we 'ssh' into an instance using terminal, how are we supposed to run code onto it? Like would we write program on host computer, upload it via ssh and execute there only?
velvet thorn
you could.
grave frost
seems very cumbersome. Like for a GCP instance, can't we just get a simple Jupyter Notebook where we type the code and run it there only??
acoustic halo
Yes, you can configure a Jupiter server on an instance and connect your notebook to it
Typically I set it all up on a free instance, save it to a new volume and attach that volume to a more expensive instance when ready
But I prefer Aws, you can't use the free credits on GPU or spot instances with google
velvet thorn
that sounds like what you would do for data science
seems very cumbersome. Like for a GCP instance, can't we just get a simple Jupyter Notebook where we type the code and run it there only??
@grave frost yeah, if it's just simple stuff you could do it through SSH
but anything more involved woud dbe a huge pain
grave frost
My setup commends can be done using terminal, but for the coding part I would prefer a Jupyter Notebook. I can connect via ssh into it's GUI, right?
grave frost
Can anyone give me an overview on how to train ML models using ssh connection/ or best ways to run code on the VM instance? Can we connect a Jupyter Notebook via ssh to the vm instance and run it that way? Or is there any other recommended methods to accomplish that? I would be dealing mostly with some python code and shell commands.....
acoustic halo
There are two ways I would personally go about it
Either just write a script on your PC and upload it and run it on the instance
Or set up a Jupiter server on the instance and connect to that via your pc
grave frost
ohh yeah, didn't think if that. Are you sure the link provided is always unique? coz my port number never changes and I can't imagine 1 port being used by so many people....
acoustic halo
What link are you talking about?
grave frost
Also, I want to use "kite" which is an autocomplete software for ipython notebooks. So where would I install it- in the host com. or the VM instance
@acoustic halo The link via which we connect with the Jupyter notebook. Like when you run a command, it gives a URL right? so if I access that same URL from another computer, theoretically it should open it up...
Ohh wait.. the link is a localhost one, so I guess it can't be used like that..
acoustic halo
When you set up jupyter on gc, you use the gc ip/url
grave frost
and port number? token is provided by Jupyter, but port will be 8080 always, right?
acoustic halo
Yeah, but you can change it if you want
Run Project Jupyter Notebooks On Amazon EC2.
grave frost
Alrighty, thanx a lot for your help!! 🌮 🌮
 copper hemlock
hello i am having difficulty understanding loading dataset in pytorch
in tutorials i watched they used MNIST and FashionMNIST datasets which were already ready to use
now i am trying dogs/cats dataset with help of youtube, but i don't understand couple of things
looking at MNIST, batch of single item contains list of [torch.Tensor(image) and torch.Tensor(label)] but in videos people do it x_data, y_data
what do they mean
my_training_set = np.load("my_training_data.npy", allow_pickle=True)

train_set = torchvision.datasets.FashionMNIST(
        root = "./data/FashionMNIST",
        train = True,
        download = False,
        transform = transforms.Compose([
            transforms.ToTensor()
        ])
    )

my_set = torch.Tensor([i[0] for i in my_training_set])

my_training_data = DataLoader(my_set, batch_size=1, shuffle=True)
training_data = DataLoader(train_set, batch_size=1, shuffle=True)

my_batch = next(iter(my_training_data))
batch = next(iter(training_data))

print(len(my_batch))
print(len(batch))
im comparing FashionMNIST with dogs/cats dataset
len(batch) > single item batch of FashionMNIST returns 2 , which are list of [tensor(image) and tensor(label)]
 tepid hornet
Hey,guys!
What are some good resources or courses for a data science begineer?
I have seen the pins but it has mostly ML content tagged on it.
So if anyone is self-taught or has taken a course in DS,kindly let me know.
tidal bough
I took https://www.coursera.org/learn/machine-learning (very nice entry-level course, an overview of most fields with programming assignments) and am now taking https://www.coursera.org/learn/practical-rl/ because I'm interested in RL. The other courses in the https://www.coursera.org/specializations/aml specialization are probably nice too.
tepid hornet
I did check them out @tidal bough.
Last one is advanced.
But thanks for the info and I will keep looking for them!
tidal bough
Practical RL is supposedly the fourth course in the specialization, but I found it neither particularly advanced nor related to the stuff they presumably teach in the previous three courses.
probably because RL is quite different from both supervised and unsupervised learning
lapis sequoia
try to learn about some of the math behind it first and don't jump into like neural networks and stuff instantly, understanding the math behind it will make your life a heck of a lot easier
@austere swift can u suggest a good book or any other learning resource for that ?
strong trench
^
lapis sequoia
hey, how good is the book "Chirag Shah - A Hands-On Introduction to Data Science " for a data science beginnner?
lapis sequoia
results = model.fit_generator(train_image_gen,epochs=20,validation_data=test_image_gen,callbacks=[stop])
what's wrong ?
it gives tuple index out of range
please help
here is my full error::
 arctic wedgeBOT
Hey @lapis sequoia!
Uh-oh! It looks like your message got zapped by our spam filter. We currently don't allow .txt attachments, so here are some tips to help you travel safely:
• If you attempted to send a message longer than 2000 characters, try shortening your message to fit within the character limit or use a pasting service (see below)
• If you tried to show someone your code, you can use codeblocks
(run !code-blocks in #bot-commands for more information) or use a pasting service like:
 copper umbra
Hey Guys, I am reaching a memory error in py 64 bit when merging 2 very large files with pandas. Like 500mb each csv files being merged on a key. I talked to my IT and they can get me more RAM but i dont know how much i need to complete the process, if there error output code i can add to determine this?
tidal bough
Well, there is the memory profilers, like https://pypi.org/project/memory-profiler/ or just memalloc. However, I don't think they can answer questions like "how much memory did it eat before running out". You could test it on progressively larger artificially generated cases...
right, you need to estimate how much you need, not find out how much you used
You can extrapolate it, I guess. Test it on progressively larger input files (or maybe just larger slices of the actual input ones) and use https://pypi.org/project/memory-profiler/ or something to measure memory consumption. Plot the resulting data and see if it can be easily extrapolated to the full size.
copper umbra
oh boy, thank you. I am trying to convince them to give me a virtual machine to run this process.... that might be easier
desert oar
@copper umbra i'd use a database instead of pandas
throw the data into sqlite
how many rows are in each data set? are you doing the wrong kind of join?
copper umbra
1 million
desert oar
do you have duplicate keys? you can end up with massive explosions of data
how much ram do you have?
copper umbra
i have to find difference between a and b in addresses
desert oar
oh god are you trying to do a cross join
copper umbra
yeah it is state voter data and i have to make sure evenone has the right addresses...and i am not a sql developer
copper umbra
left outer
desert oar
what fields are you joining on
copper umbra
a name, middle,last ,dob id key i created (none were provided)
there are 93 dups on my key
desert oar
so the id keys are unique in A and B?
as in, there is no duplicate key across A or B?
what does your code look like?
copper umbra
my code is literally pd.read_excel, a one line create id, a sort, for both files then df.merge(df2,how=left etc etc) I cant copy paste the code because it is on a seperate secure laptop
sorry for the delay got pulled into work
as far as i know very few dups, both original files are between 700k and 1mill and i would expect the new file to end at a similar value. Unfortanute the files are so massive i cant even explore them in excel without my computer freezing
i was hoping py would be more effecient
@desert oar
 brisk trench
How can I increase the x tick spacing in matplotlib? Not the interval size, but how far apart each tick is.
 west lava
I have a question about random sampling of a non-normal distribution dataset. So from a bunch of research papers I have read hockey goals are normally in a Poisson distribution. I put together this code (with some help from another code sample) of simulating NHL games, but this is based on an NBA simulator where NBA scores are normally distributed. What could I change to adapt a different distribution to this?
def game_sim(self):
    # Averages the random sample of a teams points with a random sample of the number of points the opponent allows
    # Randomly samples from the two gaussian distributions to produce a probabilistic outcome

    T1 = (
        rnd.gauss(self.team_1.goals_for_mean(), self.team_1.goals_for_std()) +
        rnd.gauss(self.team_2.goals_against_mean(), self.team_2.goals_against_std())
        / 2)

    T2 = (
        rnd.gauss(self.team_2.goals_for_mean(), self.team_2.goals_for_std()) +
        rnd.gauss(self.team_1.goals_against_mean(), self.team_1.goals_against_std())
        / 2)

    if int(round(T1)) > int(round(T2)):
        return 1
    elif int(round(T1)) < int(round(T2)):
        return -1
    else:
        return 0
@copper umbra it sounds like you aren't doing the join correctly
data1 = pd.read_excel('data1.xlsx')
data2 = pd.read_excel('data2.xlsx')

data = pd.merge(data1, data2, on=['first_name', 'middle_initial', 'last_name'], how='left')
your code looks like this?
tidal bough
@west lava The thing is, many distributions, including Poisson's, approach a normal distribution with the same mean and std as the number of samples increases.
So does it matter that much?
west lava
@tidal bough (apologies this all new to me) - I guess it doesn't really matter if that is the case. I am just trying to build a very basic game simulator (to branch out my Python skills into more of an analytical space) and the results I am getting don't line up exactly to what I would expect, BUT again its probably because goals are not a good deterministic variable of who is actually the better team.
tidal bough
Right. Anyway, if you want poisson's destribution, scipy can sample from it: https://docs.scipy.org/doc/scipy/reference/generated/scipy.stats.poisson.html
west lava
Ah awesome, okay thanks so much. Appreciate it - will try to figure out based on their docs and come back if I get stuck.
tidal bough
About it approaching the normal one:
For sufficiently large values of λ, (say λ>1000), the normal distribution with mean λ and variance λ (standard deviation λ {\displaystyle {\sqrt {\lambda }}} {\sqrt {\lambda }}) is an excellent approximation to the Poisson distribution. If λ is greater than about 10, then the normal distribution is a good approximation if an appropriate continuity correction is performed, i.e., if P(X ≤ x), where x is a non-negative integer, is replaced by P(X ≤ x + 0.5).
https://en.wikipedia.org/wiki/Poisson_distribution#Related_distributions
@west lava
Also see this plot I just made:
https://www.desmos.com/calculator/k3efnlzvpz
west lava
Ah okay that's really helpful, thanks so much.
tidal bough
that's generally the reason you overwhelmingly see the normal distribution being used in statistics - because far too many other distributions end up approximating it 😅
in fact...
yay, my probability course wasn't for naught - I remembered the name right.
The Central Limit theorhem even proves that for any sum of randomly distributed variables with some constraints.
https://en.wikipedia.org/wiki/Central_limit_theorem
In probability theory, the central limit theorem (CLT) establishes that, in some situations, when independent random variables are added, their properly normalized sum tends toward a normal distribution (informally a bell curve) even if the original variables themselves are not normally distributed. The theorem is a key concept in probability theory because it implies that probabilistic and statistical methods that work for normal distributions can be applicable to many problems involving other types of distributions.
west lava
That is extremely helpful - sometimes I post here and I literally fall into the perfect answer.
I found a slight bug in my source data as well so hoping that helps to make these simulations more "expected" than I have been seeing.
 glacial rune
I want to try and improve my OOP and python in general, so I was wondering if this is a suitable application for OOP...
I'm using a GET request for some data from an API and each data point in the response has seller, price1, price2 and time stamp. I ultimately want to work out price 3 = price 1 - price 2, and plot price 3 by seller over time. Would it be sensible to make a class called TickSample for example, and have something like:
class TickSample:
    def __init__(self, price1, price2, seller, timestamp):
        self.price1 = price1
        self.price2 = price2
        self.seller = seller
        self.timestamp = timestamp
        self.price3 = price1 - price2
then in my main code, I would make a list of ticks by looping over the response data
tidal bough
yes, quite
glacial rune
ok, thanks 😄
mellow spruce
Is it possible to generate a new column of a data frame of time stamps keeping the time stamp of the first row similar to the old column and then adding time deltas to that first time stamp to generate more time stamps
i.e:
      1  |2020-03-16 23:18:10|0days 00:43:00
      2  |2020-03-17 00:25:30|0days 00:44:00
      3  |2020-03-17 01:30:14|0days 00:35:00```

To

```Stage|Start|Process time|Theorical Start
      1 |2020-03-16 23:18:10|0days 00:43:00|2020-03-16 23:18:10
      2 |2020-03-17 00:25:30|0days 00:44:00|2020-03-17 00:02:10
3 |2020-03-17 01:30:14|0days 00:35:00|2020-03-17 00:37:10 ```you definitely can do it by iterating. You might also be able to get the second column (of timedeltas), and add it elementwise to the first one to obtain the third one.
jovial thorn
Hi! I'm designing a data analysis pipeline, has any of you used pyjanitor before? Do you have any comments or recommendations about it?
mellow spruce
I will try that! Thank you!
glacial rune
so the prices are actually strings, and sometimes can be None. Would it be better to have a convert to float method in the class init or in the main code? i.e.
class TickSample:
    def __init__(self, price1, price2, seller, timestamp):
        self.price1 = self.try_float(price1)
        self.price2 = self.try_float(price2)
        self.seller = seller
        self.timestamp = timestamp
        self.price3 = price1 - price2

    @staticmethod # is this needed here?
    def try_float(price):
        try:
            price = float(price)
        except TypeError:
            price = 0
        return price
Or use the try_float method in the main code when I'm reading the data?
for record in data:
    price1 = TickSample.try_float(record['price1'])
    ...
    tick_sample = TickSample(price1, price2, seller, timestamp)
@glacial rune there's nothing wrong with what you wrote
i think the 1st option is better
because the data validation is specific to the TickSample class
glacial rune
Thanks salt rock lamp 😄
austere swift
Ight so heres my loss graph, red is training and blue is validation. I'm just gonna leave this here so you guys can have a good laugh
austere swift
no it wasnt 0 it started at like 20
and now its like 20,000
I didnt plot it wrong
I honestly have no idea why its doing that though
lapis sequoia
wait, it was real?
austere swift
yes
odd yoke
we can't really help in any way without the code
austere swift
nah i'm not asking for help lol i just wanted to show that
I'll try to figure it out on my own first lol
odd yoke
good luck with that
desert oar
@glacial rune another option is to make a standalone function with a more descriptive name:
def float_or_zero(x):
    """ Try to convert x to float, returning 0.0 if it fails """
    try:
        return float(x)
    except TypeError:
        return 0.0

class TickSample:
    def __init__(self, price1, price2, seller, timestamp):
        self.price1 = float_or_zero(price1)
        self.price2 = float_or_zero(price2)
        self.seller = seller
        self.timestamp = timestamp

        # make sure to use the casted versions, not the inputs
        self.price3 = self.price1 - self.price2
 lethal geode
Am I allowed to ask questions in this channel?
lapis sequoia
does anyone know how i can see if the means of two distinct with 3 levels each are differnet
i have a group with level 1, level 2, and level 3, and another group with type 1, type 2, and type 3. how can i compare means across each of these groups using a hukey test? anyone know
copper umbra
data1 = pd.read_excel('data1.xlsx')
data2 = pd.read_excel('data2.xlsx')

data = pd.merge(data1, data2, on=['first_name', 'middle_initial', 'last_name'], how='left')
your code looks like this?
@desert oar
yes this is generall how i do merges with the exception of df.merge(df2, on=['first_name', 'middle_initial', 'last_name'], how='left')
i prefer to clean the names before the merge thus adding the unique id, so i can strip the spaces and special characters and set to all caps.
desert oar
yes @lethal geode
@copper umbra that's fine. can you tell me the number of unique IDs across both dataframes?
copper umbra
first middle last DOB become FIRSTMIDDLELAST01012020
i cant not tell you the merge count because i cant merge them. last time i checked (it took a few hours for my laptop to process) i had 900,000+ records in one of the files only 93 total were duplicated for the new id
trying to open the files again now but it takes time
lapis sequoia
guys where can i learn ensembling and stacking models
copper umbra
Saltrock,
first file is 1.04 mil records 28 colunms
100k dups
second file is 955k record 131 columns ( i can reduce that but wont be enough to fix memory)
132 dups
@desert oar
import pandas as pd

df=pd.read_csv("DoT.csv")
#print(df.info(verbose=False))
df['newid']=df["FIRST_NAME"].str.strip()+df["MIDDLE_NAME"].str.strip()+df["LAST_NAME"].str.strip()+df["DOB"].str.strip()
#df[df['newid'].duplicated(keep=False)].info(verbose=False)
df.sort_values(by="newid", inplace=True)

dfc = pd.read_csv("CVF.csv")
#print(dfc.info(verbose=False))
dfc['newid']=dfc["vrNameFirst"].str.strip()+dfc["vrNameMiddle"].str.strip()+dfc["vrNameLast"].str.strip()+dfc["vrDOB"].str.strip()
#dfc[dfc['newid'].duplicated(keep=False)].info(verbose=False)
df3=dfc.merge(df, how="left", on="newid")

df3.to_excel("test.xlsx")
 brave kelp
Hello, I'm considering learning about data analytics in python, and i have a few questions
What exactly is considered data analytics and what information is useful?
arctic cliff
Are you familiar with statistics? Because as I know it already has an answer for that question
brave kelp
Not really
arctic cliff
Just analyze data, Plot the result in a friendly figure so other people can get the idea or the result of your analyzing just by looking at the figure
copper umbra
data analytics is excel on crack, thats my shortest explanation
brave kelp
and python reviews the information?
brave kelp
I know, I've already completed the basics and i'm considering branching into this section
copper umbra
i would suggest basic statistics as a start (outside python) then dive into python pandas and matplotlib if you show a interest in data anlysis
desert oar
@copper umbra len(set(df1['id']) | set(df2['id']))
And you are 100% sure there are no duplicate id's in df1 and no duplicate id's in df2?
Are there any null id's?
Either None or NaN
Or empty string
copper umbra
There are dups for now i provided a count. Very limited in one data set
No empty. Last Name is a required feild
desert oar
How many duplicates
desert oar
100k duplicates??
copper umbra
Yeah
desert oar
In the left or right file
copper umbra
Anytime someone changes address they will have a second row
desert oar
Well idk what output you expect then
copper umbra
132 dups is the primary file (left)
desert oar
So you want a left join
But with a lot of duplicates?
If there's a file on the right with 100 instances of "id=12345" and a file on the left with 10 instances of "id=12345" you will have 1000 rows in the output with that id
This can quickly become a combinatorial explosion of data
 jolly pumice
Is their an library that detects images from in another image?
detecting a single image I got working, but the problem is that I've a list of 6k possible images to detect
austere swift
yeah the issue was the loss algorithm
i was using categorical crossentropy but idk what happened but it did that
mse worked so I'll just use that instead
desert oar
The two are not interchangeable
 limpid cloud
Hey so I'm planning on plotting the time vs activity graph for my server
I want to show the user's how the number of messages per hour has increased over the past x months
What is the best graph to use for achieving this
velvet thorn
...line graph...?
limpid cloud
Can I super impose multiple line graphs in matplot?
velvet thorn
if by "superimpose" you mean having multiple line plots on the same Axes object, yes
near moss
plotly, it's a bit more interactive, better for a client
lapis sequoia
wassup wooskis
i was wondering if anyone knew how to create a dataset with numpy and save as an npy/npz file
i want to store both image information and label information. any idea on how i'd go about it?
slate scroll
!d numpy.save
arctic wedgeBOT
numpy.save(file, arr, allow_pickle=True, fix_imports=True)```
Save an array to a binary file in NumPy `.npy` format.

Parameters  **file**file, str, or pathlib.PathFile or filename to which the data is saved. If file is a file-object, then the filename is unchanged. If file is a string or Path, a `.npy` extension will be appended to the filename if it does not already have one.

**arr**array\_likeArray data to be saved.

**allow\_pickle**bool, optionalAllow saving object arrays using Python pickles. Reasons for disallowing pickles include security (loading pickled data can execute arbitrary code) and portability (pickled objects may not be loadable on different Python installations, for example if the stored objects require libraries that are not available, and not all pickled data is compatible between Python 2 and Python 3). Default: True... [read more](https://docs.scipy.org/doc/numpy/reference/generated/numpy.save.html#numpy.save)i think typically you keep labels in one file and images in another
or keep images in a directory, one file per image
slate scroll
You'll probably need two files.
lapis sequoia
damn, so you think a separate npy file for each category of image i have and another separate file for the labels?
slate scroll
Actually looks like you can do it with np.save("file.npy", labels=labels, images=images)
lapis sequoia
oh sick
slate scroll

Stack Overflow
I working on different shapes of arrays and I want to save them all with numpy.save, so, consider I have
mat1 = numpy.arange(8).reshape(4, 2)
mat2 = numpy.arange(9).reshape(2, 3)
numpy.save('mat...
lapis sequoia
hell yea
cos essentially i wanna load my images using https://www.tensorflow.org/tutorials/load_data/numpy

TensorFlow
so that should work, thanks!
 deep lava
Can anyone suggest some solutions on this one ?
 magic valley
Chi squared
lapis sequoia
Hi, is there n easy way to "split" a pandas column based on the value, For instance if I had the dataframe:
 Foo| Bar | Bar Type
  0 | 123 |    A
  1 | 234 |    A
  2 | 345 |    A
  3 | 456 |    B
  4 | 567 |    B
  5 | 678 |    C
I want to get this out:
 Foo|Bar-A|Bar-B|Bar-C
  0 | 123 | NaN | NaN
  1 | 234 | NaN | NaN
  2 | 345 | NaN | NaN
  3 | NaN | 456 | NaN
  4 | NaN | 567 | NaN
  5 | NaN | NaN | 678
I know it's kinda weird but I need to seperate the column Bar by it's type
lapis sequoia
I'm fine with returning a new df or just adding the series' to the existing df
but it needs to be generic as I won't know exactly how many types there are
 proper jacinth
Well you could just check how many different types there are? And then loop through them?
 molten hamlet
i bet there is method that returns unique values
molten hamlet
aaa, right, my bad, you are right
 drowsy kite
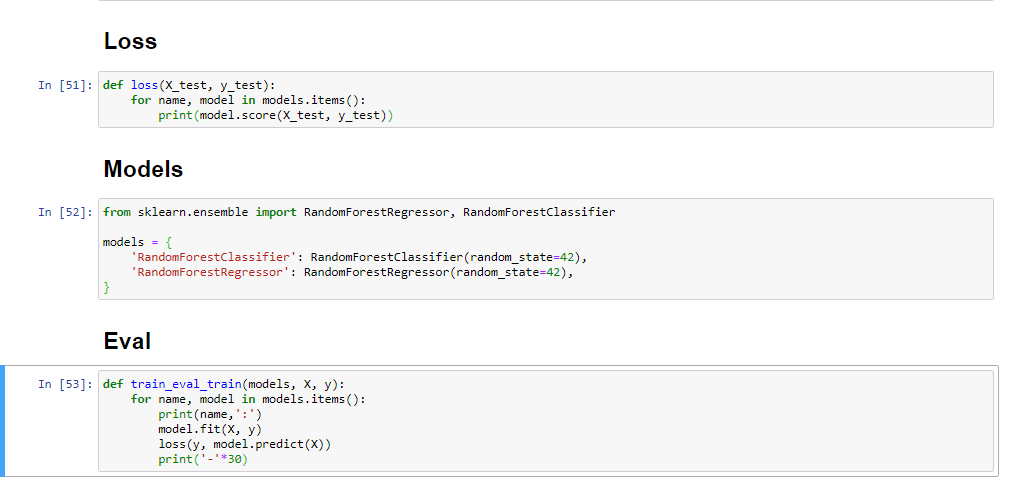
hey, im trying to figure out why i can't loop through this dictionary i built to process sklearn libraries in batch
 drowsy kite
i did but its telling me to reshape my data, not sure why
it works outside of the df still
 desert parcel
so I am working on the basics of computer vision
and right now it's trying to predict if a number from 1 - 9
and these are what i got
it's the MNIST data set btw
So I'm not sure what it means.
Since each of the elements within the first list of the tensor is a probability of each number
Is it like from 1 - 9 in order?
Like the first one 0.1291 is the probability that it's the number 0, then 0.0989 is the probability it is the number 1, etc
proper jacinth
most likely yes, can't tell you 100% without seeing the code
desert parcel
I can send you the link to the notebok
it's a google collab tho
here is the comparison
charred blaze
assuming you're using an NN with a softmax layer at the end, that seems to have th expected output
proper jacinth
Did you train the model for long enough?
charred blaze
the shapes looks right
proper jacinth
Well then the predictions are random
desert parcel
The guy is showing the step by step without training
to let you know how the internals work
proper jacinth
oh i see
desert parcel
Yeah so right now
proper jacinth
thats good
desert parcel
yeah i like it that way
when creating
a linear regression model
he made us initialise the weights, and bias tensors ourselves
to show us how it worked on the inside so debugging it was slightly easier
So right now my model just spat out random values
because all it did was process the images right?
modern canyon
y'all know anything about KALDI (an ASR toolkit)?
proper jacinth
@desert parcel yeah, just random values. about 0.1 (10%) for each digit
desert parcel
ah gotcha thanks
glacial rune
thanks @desert oar :D
So I've amended my TickSample.py to match yours, and in my main, I've populated a list of TickSample from my GET request. I filter for seller in the GET request, so I know which sellers I'll have.
I want to plot price3 over time for each seller... so I was thinking of doing:
seller_prices = collections.defaultdict(list)
seller_timestamps = collections.defaultdict(list)

if sellers is not None: # sellers list contains the sellers I filtered by in the GET request
    for seller in sellers:
        seller_prices[seller] = []
        seller_timestamps[seller] = []

for tick_sample in tick_list:
    for seller in seller_prices:
        if tick_sample.seller == seller:
            seller_prices[seller].append(tick_sample.price3)
            seller_timestamps[seller].append(tick_sample.timestamp)
is this a sensible approach? Or is there an easier way of extracting the data from my tick samples list for plotting?
glacial rune
(Using a defaultdict as if my sellers list is None, it returns all sellers and I would want that to populate itself)
lapis sequoia
what is the difference between one to many and many to one in RNN ?
can some one give an example please ?
glacial rune
No wait, I could use pandas for this 
 carmine whale
Quick question: How do I combine pandas dataframes to create multi-index dataframes?
Out[661]:
   col1  col2
0    12    34
1    56    78

foo = pd.DataFrame([[98,76],[54,32]],columns=['col1','col2'])
Out[663]:
   col1  col2
0    98    76
1    54    32
Desired result:
   bar          foo
   col1  col2   col1  col2
0    12    34   98    76
1    56    78   54    32
I tried googling, couldn't figure it out
desert oar
@carmine whale pd.concat with keys=
pd.concat([bar, foo], axis=1, keys=['bar', 'foo'])
That did the trick, thanks @desert oar !
Is it also possible to slice out both 'col1'?
   bar   foo
   col1  col1
0    12    98
1    56    78
wait, lemme google first, sorry
native patrol
@lapis sequoia use .pivot_table
In [16]: df
Out[16]:
   Foo  Bar Bar Type
0    0  123        A
1    1  234        A
2    2  345        A
3    3  456        B
4    4  567        B
5    5  678        C

In [17]: df.pivot_table(index=['Foo'], columns=['Bar Type'], values=['Bar'])
Out[17]:
            Bar
Bar Type      A      B      C
Foo
0         123.0    NaN    NaN
1         234.0    NaN    NaN
2         345.0    NaN    NaN
3           NaN  456.0    NaN
4           NaN  567.0    NaN
5           NaN    NaN  678.0
Thanks! @native patrol
carmine whale
Found a solution to my second question: df.iloc[:,df.columns.get_level_values(1)=='col1']
Strange that there isn't something simpler, like df[:,'col1']
 bitter fiber
I was wondering if you guys could help look at a line of code i have:
Im trying to remove days less than 16 in june.
df = df[~(df["Date"].dt.month==6 & df["Date"].dt.day<16)]
does this not work?
tidal bough
might, yeah
carmine whale
How about df.loc[~np.logical_and(df.index.day < 16,df.index.month == 6)] @bitter fiber
carmine whale
I'm just grabbing all the rows (the date, or index) that are in June and the day is less than 16
Then I take everything but that
Does it work?
Works for my dataset
 inland wharf
Hello, I wrote a code that made my own password and then made sure it was entered correctly again. code is: şifre = input("password \n")
şifre1 = input("password again \n ")
şifra=şifre
şifra1=şifre1
şifre=şifre1
if şifre==şifra and şifre1==şifra1:
print("welcome")
elif şifre !=şifra or şifre1 !=şifra1:
print("sorry try again.")
carmine whale
Isn't this enough?
şifre = input("password \n")
şifre1 = input("password again \n ")

if şifre==şifre1:
    print("welcome")

else:
    print("sorry try again.")
@inland wharf
carmine whale
Yeah it works for me
lapis sequoia
how can i convert an index with two columns like
yr | month
2019.0 | 4.0
2019.0 | 5.0
2019.0 | 6.0
into a datetime format
velvet thorn
an index?
lapis sequoia
@lapis sequoia if you already had a column that was a timestamp, it would be easy
assuming the dataframe object is "df" and your timestamp column is "timestamp" then:
df.index = pd.to_datetime(df2["timestamp"])
since you have two floats for year and month, you would need to convert them to a datetime object like:
print(datetime.datetime(int(year), int(month), 1, 0, 0, 0))
 modest rune
Pardon my ignorance. But, I am trying to run my own calculations for the volatility of a stock (using daily closing prices). I just want to do the calculation the traditional way, which I believe is:
Close-to-Close Historical Volatility (CCHV)
CCHV = sqrt( (natural log daily return)^2 / number of days in data set )

Where I attained the equation:
http://tech.harbourfronts.com/trading/close-close-historical-volatility-calculation-volatility-analysis-python/
Implementing that equation in python is straight forward. But, I am already using pandas, scipy, and numpy in my code, and I am guessing that one or more of those libraries already have functions that will do this work for me, and do it much faster.
So, in my quest to find a better way to calculate CCHV, I ran across multiple google results that indicated CCHV might be the same thing as calculating standard deviation. However, I am distrustful of that conclusion. I was hoping someone could shed light on this for me.
My background in statistics is weak and my biggest worry is I use the wrong equation to calculate CCHV.
Right now, I have a pandas series that represents the closing prices of a stock over a user selected date range. I am hoping that I can just call std() on that series, but my gut is telling me it is not that simple... for example, wouldn't i need to convert the daily closing prices to natural log gains?
SIDE QUESTION: Why when people are doing stock statistics, do they often refer to natural log as simply log... I find that super confusing, since log without a base specified usually means log base 10. Or, am I confused about something?
lapis sequoia
thank you mikernova
 surreal scroll
The standard deviation is the square root of the average value of x, each value of the population, subtracted by mu, the population mean, squared and the CCHV is the square root of the average value of the logarithmic returns based on closing prices, squared.
I'm not a finance guy but that sounds different to me
modest rune
Thanks @surreal scroll that is how I was interpreting things too. But, you might be surprised by how many people seem to be calculating the volatility of a stock using standard deviation straight up... I think they must be doing it wrong.
Stack Overflow
I would like to calculate the volatiity with python pandas. As indicated by http://pandas.pydata.org/pandas-docs/stable/whatsnew.html#whatsnew-0180-enhancements the syntax might have changed.
Maybe that is a bad example, because that example isn't referring to stocks.
@surreal scroll what are your thoughts on my SIDE QUESTION?
surreal scroll
My thoughts would just be that if you're talking about stock statistics, they must assume that you mean natural log when you say log
modest rune
I think I found an example where someone is doing it the right way...
https://stackoverflow.com/questions/38828622/calculating-the-stock-price-volatility-from-a-3-columns-csv
They take the pandas series, change it to percent change, then convert that to ln return, then calculate the standard deviation.
Stack Overflow
I am looking for a way to make the following code work:
import pandas
path = 'data_prices.csv'
data = pandas.read_csv(path, sep=';')
data = data.sort_values(by=['TICKER', 'DATE'], ascending=[True,
surreal scroll
But I agree it is confusing, natural log and log are not the same thing
nice find, I'll take a look
modest rune
It doesn't help that numpy (a python library for doing math), named their natural log function log().
modest rune
yep
Actually, I think that example I posted above is incorrect too...
From the example
    df['pct_chg'] = df.PRICE.pct_change()
    df['log_rtn'] = np.log(1 + df.pct_chg)
That would produce the log return. That would only produce percent change plus 1. Am I correct?
oh... whooops... I am stupid. I overlooked the whole np.log 🙂
So, would this calculate the volatility then:
df['pct_chg'] = df.PRICE.pct_change()
df['log_rtn'] = np.log(1 + df.pct_chg)
volatility = df['log_rtn'].std()
??? I think so, right?
 rare ice
What is a good PySpark Docker Image I can use as a base image? I plan on using it to execute local unit tests in a CI/CD pipeline.
lapis sequoia
Is anyone firmiliar with SignalR by any chance?
 chilly charm
hello, anyone out there with opencv experience?
 proven moon
i will duplicate question here
yo, what is good cloud compute engine w/ jupyter notebook analogue like google colab?
i need a GPU for training however google colab for several days gives me error about unable to create GPU instance due to high load.
odd yoke
if you're looking for free gpu instances, google colab is the best you'll get
the resources are however still dedicated to people using compute engine, so sometimes you'll end up having a message like this one
proven moon
i can pay some money to it
odd yoke
if you were wondering about jupyter, you can use anything with it, just gotta use proper network rules, there are many tutorials online on how to connect a jupyter notebook to a remote VM
lapis sequoia
Launch a GPU-enabled Jupyter Notebook from your browser in seconds. Notebooks are fully-managed and do not require any setup or management of servers or dependencies.
charred blaze
Not sure if paperspace provides those nowadays
used to keep track of these some years ago
 turbid salmon
Hello, any good recommendations on courses or websites to learn excel manipulation with python? i did a 20 minute video on youtube but need some more knowledge for the project im working on right now
charred blaze
they're completely separate things
you could learn those in parallel imo
not really, but I do know that using it (at least the Python wrapper for it) doesn't have a strict dependence on knowing numpy that well
hence my suggestion on learning those in parallel
Wasn't aware of that. In that case, spend like a day messing around with numpy and reading up on the docs of the package and some tutorials
try to focus on the things that are strictly relevant for the things you intend to do with OpenCV
after you do that for a day, then start getting OpenCV.
lapis sequoia
numpy is fundamental to the python ML/DS ecosystem
So if you want to learn literally anything in the ecosystem learn Numpy
(along with the other stuff ofc)
 bleak fox
https://www.youtube.com/channel/UCChfG4FWN6qSPFqZF_E9XvA/videos
Learn Data Science from Scratch

YouTube
 clear glacier
hi guys, im doing a course and i have come across this question
7.7 Fetch the company name who has got least price and maximum number of sales figures.
i dont understand its meaning, how do i select a company based on 2 parameters?
(this is from a csv file)
tidal bough
good question, it's indeed a rather malformed task. I can only guess they want you to get the companies with the lowest price, and if there's more than one of these, the one with the maximum number of sales figures among them.
clear glacier
alright, thats what i was thinking too, ill just sort the csv by price and put np.argmax to find greatest sales xD
tidal bough
you can use max with a key argument
sorting is O(n*log(n)), so that may be faster even with numpy's speed.
clear glacier
Yes normally i would not bother sorting, but since its unclear what my instructor wants me to do, ill sort it as well
lapis sequoia
While training on TPU ram memory is increasing and after 2 epochs nothing happens it doesn't show any error still running but no output. Can anyone help?
 kindred pike
Hi! I'm new here! I'm not entirely sure where i should post my question but from what I can see Numpy module gets mentioned many times so here I go:
Is it possible to resize single column of numpy.array? What I mean is:
I have an array
my_vertex = numpy.zeros((4, 45, 2))
What i want is to have different size for each column:
my_vertex[0][a][0]
my_vertex[1][b][0]
Where last indexes are:
a = 45
b = 70
Is that possible, or I should just create seprrate arrays?
 ripe forge
Separate, or filled with na or something. Numpy arrays are meant for consistent values at each index.
Which also includes consistency in the number of items in any given axis
kindred pike
What about list filled with 4 different numpy arrays? Would that be possible?
desert parcel
from torch.utils.data.sampler import SubsetRandomSampler when should I use this
I'm too early in the tutorial but
I'm curious when I should and shouldn't use this
also a quick off topic one
is when should I use classes
kindred pike
This seems to work fine:
import numpy as np

one = np.zeros((45, 2))
two = np.zeros((45, 2))
three = np.zeros((45, 2))
four = np.zeros((45, 2))

two.resize((75, two.shape[1]))
three.resize((90, two.shape[1]))
my_vertex = [one, two, three, four]

i = 0
while i < len(my_vertex):
    print(my_vertex[i].shape[0])
    i += 1
Your loop seems very unpythonic
But yes, a list doesn't care what it contains
You should use a for loop instead if youre only interested in checking the shape of each item
desert oar
for dim in my_vertex:
    print(dim.shape[0])
I think you can use a for loop for that
yeah salt rock lamp did that I just didn't read lol
 stark orchid
Good Article on collaboration obsticles within a data team.
https://venturebeat.com/2020/08/09/how-to-get-your-data-scientists-and-data-engineers-rowing-in-the-same-direction/
Please let me know if this isn't the place to post this ^

I’ve seen models take months to get to production because the data scientists and data engineers were working at cross purposes.
lapis sequoia
given the above, how can I easily plot a separate line for each value of "VIOLATED_DIRECTIVE"?
I asked in general help process and no answers for this...I know this is probably very simple to do, but I'm a py scripter not a data scientist 😆
Hi
I am doing with the datetime module
and I got a problem
datetime.datetime.utcnow().strftime('%Y-%m-%d %H:%M:%S')
it returns a string, how to convert it back to datetime.datetime
desert oar
@lapis sequoia can you give me some sample data to work with? i think i can do this for you elegantly but need something to test on
@lapis sequoia you need to parse it again with strptime
lapis sequoia
yep, actually
arctic wedgeBOT
Hey @lapis sequoia!
It looks like you tried to attach file type(s) that we do not allow (.csv). We currently allow the following file types: .3gp, .3g2, .avi, .bmp, .gif, .h264, .jpg, .jpeg, .m4v, .mkv, .mov, .mp4, .mpeg, .mpg, .png, .tiff, .wmv, .svg, .psd, .ai, .aep, .xcf, .mp3, .wav, .ogg, .webm, .webp, .m4a.
Feel free to ask in #community-meta if you think this is a mistake.
Hey @lapis sequoia!
Uh-oh! It looks like your message got zapped by our spam filter. We currently don't allow .txt attachments, so here are some tips to help you travel safely:
• If you attempted to send a message longer than 2000 characters, try shortening your message to fit within the character limit or use a pasting service (see below)
• If you tried to show someone your code, you can use codeblocks
(run !code-blocks in #bot-commands for more information) or use a pasting service like:
lapis sequoia
@desert oar ^^
df[['VIOLATED_DIRECTIVE']].resample('60T').count().plot.line(legend=True,figsize=(30,8))
 frail locust


 thin pecan
Probably there is a module that can do that
Me, being a relatively ok scripter in python with basic knowledge, would say to use the split function to collect the normal value and its power factor
(someone give actual good advice though, lol)
 hot ingot
Has anybody worked with style transfer? I’m using pytorch