#data-science-and-ml
1 messages · Page 239 of 1
 serene oar
So I should first match the parent with the child and then group once only?
This json thing is new to me.
gdf[list_cols] = gdf[list_cols].applymap(json.loads)
Do I need to make it into a dataframe now?
 desert oar
new = df["url"].str.split("/", expand = True)
new = new.rename(columns=lambda c: f'urlpath{c}')
df = df.join(new)
df.to_csv('data.csv')
df = pd.read_csv('data.csv')
df = pd.merge(df, cname, how='left', on='eventId')
do this
no groupby
think about why you get nested lists
you groupby with list twice
both groupbys are unnecessary
later you can group
however if you really do want to group, you need to be careful
do not group multiple times
and if you group, you have the problem of dealing of lists inside columns
which is more difficult and complicated
the only time you want to group is when your data is very big, and joins will be too expensive
json.dumps takes an object and returns a string containing json data
so if your column contains lists, json.dumps converts them to JSON strings
which you can deserialize again later, safely, with json.loads
again, i also recommend using parquet format instead of csv if you want lists inside columns
i have to leave now, @ me if you have questions
serene oar
I assume I still need to group that. As per one parent, there will be tons of URL's.
Wouldn't a list be easier then, if I want to see how many time a certain value appears in a list per parent?
Okay, thank you for the help! I will go from there and see where I get.
desert oar
@serene oar sure, you can do that. or you can just groupby at the end in order to do the count
it doesn't matter which one you do. but you need to be very careful once you have a column of lists
 lapis sequoia
does anyone here have experience with tensorflow? I'm trying to train my own ai with my own images and datasets but every guide out there tells me to use their own datasets for flowers and cars and stuff
desert oar
what's your question exactly? you want to know how to load custom data? how to format it? etc
lapis sequoia
yes, own images
i have images in their own folders
but i dont know how to label them in a dataset
or even how to make one
 tidal bough
Nice. Now you need to, for every single one of them, specify the right labels.
lapis sequoia
How do I do that?
 signal sluice
you should probably follow one of the tutorials first before you attempt it yourself - the point of the tutorials is to learn how to use it
tidal bough
Would probably be best to write a program that shows you pics and asks you to label them.
desert oar
there are plenty of image annotation programs too
tidal bough
^^ that's a good idea, actually
desert oar

Medium
Learn about different types of annotations, annotation formats and annotation tools
lapis sequoia
you should probably follow one of the tutorials first before you attempt it yourself - the point of the tutorials is to learn how to use it
@signal sluice even if I do follow their tutorials, I would still not learn how to make my own datasets
because I used their datasets and not mine
desert oar
this is a pretty thorough writeup
tidal bough
...why do you need to create your own datasets, though? It's not a task ML specialists normally do themselves, because well, it's nothing more than a ton of mindless labor.
lapis sequoia
...why do you need to create your own datasets, though? It's not a task ML specialists normally do themselves, because well, it's nothing more than a ton of mindless labor.
@tidal bough because I use my own images
well, not mine, but still
desert oar
i guess it's not clear if this is a coding question, or a general data question
maybe both
lapis sequoia
both yeah
desert oar
so 1) you need to get a bunch of images and manually label them, then 2) read the docs and figure out how to format and load data into TF
i've never trained an image model w/ TF so i can't help there. very likely TDS has a writeup that can help you
lapis sequoia
what's TDS?
desert oar
towards data science
here, someone wrote an article on this topic literally today https://towardsdatascience.com/image-classifier-using-tensorflow-a8506dc21d04
 lapis sequoia
what a coincidence 😅
desert oar
in general it's not that complicated
don't get overwhelmed by all the code
the process is always: load 1 image per record, collate images and labels, feed them into your model 1 at a time or in batches
desert oar
i highly recommend reading the image annotation article i posted
lapis sequoia
Yes, I am reading it right now :P
desert oar
you might have to train in 2 steps
- find the image on the die, 2) classify it
im not experienced with ML on images, maybe someone else can chime in
lapis sequoia
thanks for your help so far though :P
lapis sequoia
doesn't it depend on the player though 🤔
desert oar
sounds like you need a regression model @signal sluice
signal sluice
oh
desert oar
specifically logistic regression
1 = victory, 0 = defeat
that literally models P(victory | number_of_trophies)
you can fit 1 separate model per brawler
or better yet, fit a bayesian model with partial pooling across brawlers 😉
if you just want to compute the % winrate for each brawler you can do that with pandas
data['victory'] = data['result'] == 'victory'
data.groupby('brawler')['victory'].mean()
oh
awesome, ty
but then to find how that changes with trophies i would need one of those two models
ic - tysm, ill have to look at those as well then
desert oar
Yes precisely
You might also want to consider just modeling win probability vs trophies across all brawlers
The bayesian model is the best of both worlds but it's a whole other layer of new concepts and software to learn
signal sluice
ill definitely have a read on it
lapis sequoia
@desert oar the article is very confusing
 turbid quartz
 mellow spruce
Does anyone have experience in plotly dash? I don’t know why cytoscape doesn’t allow me to box select even after pressing shift and dragging the click
 hoary breach
dash is just going to be buggy, i mean just look at the github issues
 flat quest
odd. looks fine to me.
Only difference I can think of is that generally speaking, the adam optimizer and compiling would occur outside the with block @drifting umbra. Though I can't really see why that would make a difference.
mellow spruce
dash is just going to be buggy, i mean just look at the github issues
@hoary breach it kinda is. Do you know a better library to make interactive dashboards tho?
desert oar
@void anvil like with DataFrame.resample?
what do you mean "for each row"
resample is like groupby but for time series
 severe island
if i have a dataframe, and I have a function that returns True or False based on column value. is there any way I can filter the dataframe on that function for a particular column.
desert oar
ah, no
i thought aggregate gave you a 2-level MultiIndex for columns anyway
you have to fix it yourself
@severe island
data.loc[my_function(data['x'])]
wait
hold on
are you talking about the output names, or the original names
oh
use a dict comprehension
df.resample('D').aggregate({
    **{c: max for c in df.columns if c.startswith('max_')},
    **{c: first for c in df.columns if c.startswith('first_')}
})
!e ```python
print({
**{'a': 1},
**{'b': 2}
})
 arctic wedgeBOT
@desert oar :white_check_mark: Your eval job has completed with return code 0.
{'a': 1, 'b': 2}
same as f(**kwargs), at least conceptually
analogous to [*lst1, *lst2]
we will be getting set operators on dicts in 3.9 i believe
 worthy robin
Hi, I have a question, I don't know if this is the correct place to do it, but I'm learning python for data science, what's the best way to use version control(Git) in python?
 spark cape
I have a pandas issue that I think is bread and butter... moving events from (date, on), (date, off) type events (or on, on, on, off, off) and turning them into events like date, start, end, duration but I haven't used pandas in years so my brain is stalling
desert oar
@worthy robin you don't need to do anything special, just use Git on your files
@spark cape can you clarify how this data is stored? these are column names?
severe island
@desert oar my version works on string, if i do that it says expected string or byte like object
spark cape
date, operation are the original column names. on == 1, off == 2
desert oar
@severe island that's a problem with your function then
severe island
how should I write the function then? It reads text and returns true or false based on sentiment
desert oar
@severe island it's like this? f(str) -> bool?
@spark cape maybe data.sort_values('date').drop_duplicates(subset=['operation'], keep='first') then use .diff somehow
maybe groupby then diff
severe island
@desert oar yes
desert oar
@severe island
data.loc[data['column_with_text'].map(is_positive_sentiment)]
look up the Series.apply and Series.map functions
 tame fractal
Interview prepping need a partner, as long as you know the basics I can teach it helps me to learn gonna do a zero to hero!
 solid spindle
any ideas on why
UserWarning: NumPy 1.14.5 or above is required for this version of SciPy (detected version 1.13.3)
even if i'm 100% sure i got the latest numpy installed 1.19.1
spark cape
@solid spindle pip freeze to see what versions are installed. and whats giving the error? your ide? or the command line
solid spindle
well it's a little bit more complicated
but ill give it a try to explain
there's a software called fme, which does multiple geospatial processing stuff, it has a python caller where you can run python code
this server is hosted on the cloud on an ubuntu machine
i don't have acces to any cli or have any control over python
the way to install libraries is to just upload folders containg the library files from python/site-packages/numpy for example
so what i did is created a docker image, on ubuntu 18.04, installed python3 and after pip install numpy, scipy, sklearn
i upload all folders and run my script
and that's when i get the above error
i'm quite convinced there's a very tight dependency between numpy, scipy, sklearn, and it seems these don't really work together
numpy 1.19.1 scipy 1.5.2
 fiery frost
Hi!
I am new to deep learning, and i want do a project.
It would be helpfull if you can guide me.
so in my project i want to write script, that takes image of comics book or manga.
and delete all alphabet on the pic.
If you can advise me how to start and what should i use, i would be awasome!
(i will upload example soon.)
before:
after:
Any help would be appreciate.
(i have many samples to work on)
desert oar
you can probably do it with an OCR library
 visual violet
i think i am kinda stupid
regression model
i am trying to predict pm25
an air pollutant
can you come up with some variables that can be predictive of pm25?
visual violet
this is my summer project
i have pm25 values 10 years back to present
and temperature
i mean i need to know what data i am looking
i am trying to predict if predicted pm25 value would be any different from the actual pm 25 value without quarantine
@desert oar
desert oar
what data do you have available?
visual violet
pm25 and temperature weather related stuff
desert oar
maybe you can start with some meteorology sources
maybe humidity, temperature, wind speed
you might also want to consider the weather in nearby areas
or the weather on prior days
there is a whole category of techniques for spatiotemporal modeling
you can also try things like using a gaussian process model to interpolate pm25 between measurement points
im sure actual meteorologists can do better
visual violet
i do understand your point
@desert oar sorry for pinging but you know how to find correlation r or r^2 in python jupyter notebook?
desert oar
scikit-learn has r^2 https://scikit-learn.org/stable/modules/generated/sklearn.metrics.r2_score.html
 timid cypress
Hello, how do I get the difference of the two rows and divide it to the total of the sum of all rows in pandas? Thanks for the help
desert oar
@timid cypress is this homework?
timid cypress
yep 🙂
visual violet
i am trying to predict pm25 based on rainfall data sir
@drifting umbra what do you mean by time series
pm25 is an air pollutant
visual violet
yeah
visual violet
yes yes
 drifting umbra
just visually
if you used YESTERDAY pm
as an input
it would improve your model a lot
because visually if you tell me what it was yesterday or last month
that would improve prediction accucracy a lot
visual violet
yea
i trained the data with 2017-2019
and i input 1/2020 to 6/30/2020 as input to predict
i probably should combine temperature and rainfall
since the prediction is quite off
@drifting umbra what do you think sir?
rainfall_test =  pd.read_csv ('C:/Users/dotha/PythonNotebook/File/rainfall (2020) NYC.csv')
rainfall_test.index = pd.to_datetime(rainfall_test['Date'])
rainfall_test = rainfall_test.drop(['Date'], axis =1 )

pm25_actual = pd.read_csv ('C:/Users/dotha/PythonNotebook/File/pm25 (2020) NYC.csv')
pm25_actual.index = pd.to_datetime(pm25_actual['Date Time'])
pm25_actual = pm25_actual.drop (['Date Time'], axis =1)
pm25_actual.fillna(0,inplace = True)
pm25_actual_series = pm25_actual.PM25C.resample('D').mean() # take average daily
pm25_actual_array = pm25_actual_series.values

#temperature_test_list = temperature_test['temperature'].tolist()
pm25_predicted_array = linear_regressor.predict(temperature_test['rainfall'].values.reshape(-1,1))


plt.figure(figsize=(12,12))
plt.plot(temperature_test.index,pm25_actual_array, label ='actual')
plt.plot(temperature_test.index,pm25_predicted_array, color = 'red', label = 'predicted')
plt.legend()
plt.show()
@timid cypress we can't hand out homework answers here. however if you show us your best attempt at an answer we can maybe help if you are confused
timid cypress
@desert oar I know how to compute for the difference - it should be df['a']-df['b']
im stuck with computing for the total sum of ['a'] ,['b'] and ['c'] then dividing the sum to the difference. Hope i make sense
drifting umbra
@visual violet i am saying visually
just looking at graph
it appears rainfall is not the best way to predict
the pm
if you had yesterday's PM that would probably be a more accurate prediction of today's PM
so for example if i had an algo that simply outputted
today_PM_prediction = yesterday_PM
visual violet
but that wont help to show that quarantine affected pm25?
drifting umbra
also another issue
sorry i am just not sure what the research question is
what do you want to see? if pm2.5 is lower this year than previous years?
visual violet
see if quanrantine has affected pm25
 tardy portal
@desert oar I hope you're doing well my friend
visual violet
@drifting umbra thanks dude
i used recent data to predict
and the difference lessened a lot
drifting umbra
🙂
that does not answer your question
about quarentine
for that what you would want to do is maybe
graph Jan to (whenver month you have data to)
for every year
show that 2020 is lower than all other years
or take average of 2010 to 2019 pollution by day
graph that vs pollution 2020 by day
visual violet
@drifting umbra probably this?
drifting umbra
i was thinking line graph
visual violet
lmao i have everything ready
visual violet
trying to save my hypothesis
visual violet
but with the graph, my outcome of my experiementis prob null
drifting umbra
your alternative hypothesis is that lockdown reduced pm2.5
null is no difference
graph would be enough to convince me
imho great visuals are equally or more important than fancy algo
for making business people / non quants understand what you are trying to prove
 solar cargo
I cant understand date and time. I am doing data science with python
pls explain
drifting umbra
i think there is no prediction problem here
just subtract 2020 pollution from 2019 pollution
and graph it
visual violet
but in 2016, the prediction vs actual difference is kinda normal
solar cargo
I cant understand date and time. I am doing data science with python
pls explain
visual violet
are you trying to convert index to datetime?
drifting umbra
basic python type
visual violet
temperature.index = pd.to_datetime(temperature['DATE'])
temperature = temperature.drop (['DATE'], axis =1)
just change the variable names with whatever
solar cargo
I am a beginner I am doing a course from a website but the guy can't explain date and time
@solar cargo what are you trying to do
@drifting umbra thanks
visual violet
lmao did you just thank a question
drifting umbra
Date and time basics in Python.
drifting umbra
lol no offense there is no need to use prediction here
and imho it is a mistake to do so
it makes it harder to affirm your hypothesis
because
rather than saying LOOK pm2.5 WAS lower
you are introducing model error
error term
unnecessarily
not trying to be rude
visual violet
yeah i understand what ya saying
drifting umbra
think you need a new hypothesis
aka
how accurate can i predict TOMORROW's PM
you can use previous year's PM for annual pattern
and yesterday PM
and last week PM
that is a diff problem
i know about pm2.5 ive been to asia

aqicn.org
How polluted is the air today? Check out the real-time air pollution map, for more than 100 countries.
visual violet
you american?
visual violet
hoenstly speaking, i changed the range: i did (2018-2020), (2017-2020), (2017-2019)
did not really improve prediction
 raw vigil
Im sorry to interrupt, but should i learn more python before doing pytorch?
visual violet
yes
raw vigil
Um is there any good online learning resources of python and pytorch?
visual violet
hmm i just read documentation lmao
the 100 something page python document
then i am done learning python
@drifting umbra probably knows better
raw vigil
Alright
drifting umbra

how i imagine @visual violet
@raw vigil depends what you want to do
if learn data science i would start with ensamble based methods
this is good one

This article lists the best machine learning, data science projects for beginners to advanced level with example code to boost your knowledge and skills.
visual violet
wait are you a data scientist?
drifting umbra
no i work in quantitative finance
with alot of data
in python
so idk?
im a cfa
raw vigil
No, I just got into Python
drifting umbra
wow that is sick
visual violet
prob finance will make bank
drifting umbra
i wish i started python hs
 sharp locust
What do you like doing
visual violet
i dont like doing nothing
i do for the money mostly
my motto is "be good and you will enjoy it"
raw vigil
Erm Im a Sophmore but i dont know where to start
raw vigil
I kinda dont know how to start
sharp locust
then maybe blackjack
visual violet

YouTube
Welcome to my Channel. This channel is focused on creating tutorials and walkthroughs for software developers, programmers, and engineers. We cover topics fo...
sharp locust
there are 100s of tutorials on the internet
visual violet
watch this guy
raw vigil
Ok thanks
drifting umbra

edX
An introduction to the intellectual enterprises of computer science and the art of programming.
raw vigil
Is python like java?
visual violet
i got the certification
visual violet
i learned quite a lot
raw vigil
I completed Data and Algorithms for Java
raw vigil
Do I start from basics for python then?
visual violet
xd yw
raw vigil
One last question, do i still need to learn something like pytorch or should the java experience be fine
drifting umbra
prob a lot of cover before jumping into that
easy to get up to speed fast with python tho
 patent ferry
if i make csv file, and the collumns ahve single numbers in them but are contained in a [] (list), whats the best way to make them useable (noobing)
 small reef
Hi, I just started with numpy and I have an array with the shape (1,2) but I need to make it (1,3) by having a 0 at the end
it looks like:
[[0.16145546 0.49691935]]
and I want it to look like:
[[0.16145546 0.49691935 0.0]]
how can I achieve this?
 north plinth
new_array = np.zeros((1,3), dtype=float) + prev_array
I dunno if it works or not, I'm on the phone, n also I'm a newbie
small reef
oh, ok, thanks @north plinth so just insert the old array in a new one of the correct shape, I will try, thanks again!
drifting umbra
@patent ferry what do you mean list
you can load csv to pandas dataframe with
raw_frame = pd.read_csv("my_file.csv")
yeah ive done that, its just that 1's in the collumns are within [], as a created it from a dict in py.
lapis sequoia
Greetings, any good reads/leads about machine language translation using python? where do I start?
small reef
@north plinth no, unfortunately it gives:
Exception has occurred: ValueError
operands could not be broadcast together with shapes (1, 3), (1, 2)
@small reef my_array = np.append(my_array, [0])

Coursera
Learn online and earn valuable credentials from top universities like Yale, Michigan, Stanford, and leading companies like Google and IBM. Join Coursera for free and transform your career with degrees, certificates, Specializations, & MOOCs in data science, computer science, b...
a prediction problem where you can predict words
old way would be like input (English) predict (Spanish)
i think new google translate does something much more clever
north plinth
@lapis sequoia start with seq2seq model
lapis sequoia
👀 wow thanks all!!!
small reef
@drifting umbra Thanks, currently I'm using cupy, for most things is a drop in replacement for numpy, but this specific function is not there, is there any other way or should I switch to use numpy
drifting umbra
north plinth
@small reef bro make ur own function, n iterate over this two arrays to copy elements
small reef
@small reef https://docs.cupy.dev/en/stable/reference/generated/cupy.concatenate.html
@drifting umbra this worked, thanks so much!
@small reef bro make ur own function, n iterate over this two arrays to copy elements
@north plinth I wanted to use a cupy/numpy built in function to have it run as fast as possible, but maybe this could be an alternative
 rose plume
hello guys i'm currently working on a forecasting model but here is the problem...the Mape value is very large any suggestions on how to resolve this one ?
 dull zodiac
Hello! Can anyone suggest any good curse for ML and data science?
tidal bough
For a starting one, I highly recommend https://www.coursera.org/learn/machine-learning. The only disadvantage I suppose is that it uses Octave for programming assignments and not Python.
dull zodiac
thanks!
lapis sequoia
what competitions would you recommend on kaggle for intermediate levels
i mean i have some XP with data so don't say titanic dataset :3
 acoustic halo
The mnist character recognition challenge is probably the next step up
 still delta
I suggest this one

Zindi
Predict airline delays for Tunisian aviation company, Tunisair
prediction of flight Delay
 untold aspen
Hello! Can anyone suggest any good curse for ML and data science?
@dull zodiac curse of dimensionality is a good one
very essential idea in data science and ML you need to keep in mind when creating ML models
tidal bough
😅
solar cargo
lmao did you just thank a question
@visual violet I thanked because he addressed me
Yeh that's lame I know
fiery frost
you can probably do it with an OCR library
@desert oar Thanks.
Is there a way to get the pos of the letters and not just the letters?
spark cape
@desert oar thanks for the tip last night.
north plinth
@desert oar Thanks.
Is there a way to get the pos of the letters and not just the letters?
@fiery frost yaa bro..there is..wait a sec..
h, w, c = img.shape
boxes = pytesseract.image_to_boxes(img)
for b in boxes.split():
b = b.split(' ')
img = cv2.rectangle(img, (int(b[1]), h - int(b[2])), (int(b[3]), h - int(b[4])), (0, 255, 0), 2)
fiery frost
@north plinth That is the code for getting the pos of all letters in image?>
north plinth
ya
I think so..But implemented many days ago..So maybe there can be something wrong
north plinth
wait a sec lemme check if it works well ..There can be some bug
fiery frost
Thx!
 forest plover
i need help
TypeError: 'in <string>' requires string as left operand, not list
cmnquestions1 = [("how old"), ("age"), ("how age")]
cmnanswrs1 = ("i was just made recently haha")

while True:
    textbox = str(input("type something: "))

    if 'hi' in textbox or 'hello' in textbox or 'greeting' in textbox:
        print ("hello")

    elif 'your day' in textbox:
        print ("my day was great!")

    elif 'how are you' in textbox:
        print ("im good!")


    if (cmnquestions1) in textbox:
        print ('i was made renently haha')
i need help
@forest plover dude looks like u r trying to make a chatbot
acoustic halo
this line if (cmnquestions1) in textbox:
forest plover
yes?
acoustic halo
You are checking if there is a list in a string
spark cape
if i have a start date and a duration (which can span multiple days). is there a way to easily resample this to day1: duration1, day2: duration2?
north plinth
that wont work dude
cmnquestions1 = ["how old", "age", "how age"]
cmnanswrs1 = "i was just made recently haha"
while True:
textbox = str(input("type something: "))
if 'hi' in textbox or 'hello' in textbox or 'greeting' in textbox:
    print ("hello")

elif 'your day' in textbox:
    print ("my day was great!")

elif 'how are you' in textbox:
    print ("im good!")


elif cmnquestions1.index != -1:
    print ('i was made renently haha')
also removed unnecessary barrackets
@forest plover learn deep learning for making chatbot..Also ur code is case sensitive
forest plover
I know how to make it case insensitive
I'm doing my try and then I'll do it the traditional way
That's how I like to tackle things lmao
 desert parcel
input = np.array([
                  [[313, 1], #HCL
                   [323, 1],
                   [333, 1],
                   [343, 1]],
                  [[313, 10e-3], #Ortho
                   [323, 10e-3],
                   [333, 10e-3],
                   [343, 10e-3]],
                  [[313, 10e-3], #Para
                   [323, 10e-3],
                   [333, 10e-3],
                   [343, 10e-3]]
                  ], dtype='float32')

target = np.array([
                   [[14.76, 16.42, 18.08, 23.41]],
                    [[5.87, 11.14, 13.20, 25.72]],
                    [[[2.73, 4,42, 8.04, 13.68]]
                     ], dtype='float32')

input = torch.from_numpy(input)
target = torch.from_numpy(target)```There seems to be an issue here I'm getting the error output
  File "<ipython-input-19-057e078c70da>", line 20
    ], dtype='float32')
            ^
SyntaxError: invalid syntax```The one at the top works fine
tidal bough
think you have an extra [
desert parcel
I got rid of it
new error
TypeError                                 Traceback (most recent call last)

TypeError: float() argument must be a string or a number, not 'list'


The above exception was the direct cause of the following exception:

ValueError                                Traceback (most recent call last)

<ipython-input-20-f86df4284464> in <module>()
     18                     [[5.87, 11.14, 13.20, 25.72]],
     19                     [[2.73, 4,42, 8.04, 13.68]]
---> 20                      ], dtype='float32')
     21
     22 input = torch.from_numpy(input)

ValueError: setting an array element with a sequence.```But this isn't a list tho
tidal bough
post new code
desert parcel
input = np.array([
                  [[313, 1], #HCL
                   [323, 1],
                   [333, 1],
                   [343, 1]],
                  [[313, 10e-3], #Ortho
                   [323, 10e-3],
                   [333, 10e-3],
                   [343, 10e-3]],
                  [[313, 10e-3], #Para
                   [323, 10e-3],
                   [333, 10e-3],
                   [343, 10e-3]]
                  ], dtype='float32')

target = np.array([[[14.76, 16.42, 18.08, 23.41]],
                    [[5.87, 11.14, 13.20, 25.72]],
                    [[2.73, 4,42, 8.04, 13.68]]], dtype='float32')

input = torch.from_numpy(input)
target = torch.from_numpy(target)
 pale thunder
4,42 should be 4.42
desert parcel
Oh
tidal bough
probably because of a doubly nested lists
desert parcel
Yeah didn't see that
tidal bough
if you remove the float cast, you get:
array([[list([14.76, 16.42, 18.08, 23.41])],
       [list([5.87, 11.14, 13.2, 25.72])],
       [list([2.73, 4, 42, 8.04, 13.68])]], dtype=object)
actually, nevermind, lakmatiol is right
desert parcel
this works now
input = np.array([
                  [[313, 1], #HCL
                   [323, 1],
                   [333, 1],
                   [343, 1]],
                  [[313, 10e-3], #Ortho
                   [323, 10e-3],
                   [333, 10e-3],
                   [343, 10e-3]],
                  [[313, 10e-3], #Para
                   [323, 10e-3],
                   [333, 10e-3],
                   [343, 10e-3]]
                  ], dtype='float32')

target = np.array([[[14.76, 16.42, 18.08, 23.41]],
                    [[5.87, 11.14, 13.20, 25.72]],
                    [[2.73, 4.42, 8.04, 13.68]]], dtype='float32')

input = torch.from_numpy(input)
target = torch.from_numpy(target)```So I have a follow up
tidal bough
because of uncompatible lengths it considered them lists. Interesting.
pale thunder
ye, numpy is smart like that
desert parcel
def model(x):
return x @ w.t() + b```So in here w and b is the weights and biases
but I don't know what they are
here is the table i'm using
nevermind fixed the issue
I was also wondering if I did my matrices right for the temperature and concentration
lapis sequoia
The mnist character recognition challenge is probably the next step up
@acoustic halo hey thanks but would like something more advanced than this, i did this one a few months back
I think im between this and The kaggle masters who implement crazy architectures
acoustic halo
If you can do that, I would say you should just do what sound sinteresting
desert parcel
---------------------------------------------------------------------------

RuntimeError                              Traceback (most recent call last)

<ipython-input-62-29fc928cb362> in <module>()
----> 1 model(input)

<ipython-input-60-352766d1fd6c> in model(x)
      1 def model(x):
----> 2   return x @ w.t() + b
      3
      4 def mse(t1, t2):
      5   diff = t1 - t2

RuntimeError: The size of tensor a (4) must match the size of tensor b (2) at non-singleton dimension 2
I don't understand the error i'm not sure which tensor it's talking about
def model(x):
  return x @ w.t() + b

def mse(t1, t2):
  diff = t1 - t2
  return torch.sum(diff*diff)/diff.numel()

print(input.shape)
print("-"*20)
print(w.shape)
print("-"*20)
print(b.shape)```Output: ```
torch.Size([3, 4, 2])
torch.Size([4, 2])
torch.Size([4, 2])```
lapis sequoia
cool. was looking into melanoma and pulmonary fibrosis those are still pretty out of my league tbh
desert parcel
Using the same table still btw
I got a more straight forward error
---------------------------------------------------------------------------

RuntimeError                              Traceback (most recent call last)

<ipython-input-74-29fc928cb362> in <module>()
----> 1 model(input)

<ipython-input-65-352766d1fd6c> in model(x)
      1 def model(x):
----> 2   return x @ w.t() + b
      3
      4 def mse(t1, t2):
      5   diff = t1 - t2

RuntimeError: size mismatch, m1: [12 x 2], m2: [4 x 4] at /pytorch/aten/src/TH/generic/THTensorMath.cpp:41
@lapis sequoia I would go for them, I know people who did similar things for their CS degree thesis when it wa sthe first time they had done neural nets
desert parcel
#Biases
w = torch.randn(4, 4, requires_grad=True)
b = torch.randn(4, 4, requires_grad=True)```
The code that lead to itnevermind I figured it out
fiery frost
@north plinth i did this and getting this error.
import cv2
import pytesseract
from PIL import Image


def search_letters(img):
    h, w, c = img.shape
    boxes = pytesseract.image_to_boxes(img)
    for b in boxes.split():
        b = b.split(' ')
        img = cv2.rectangle(img,
         (int(b[1]), h - int(b[2])), (int(b[3]), h - int(b[4])), (0, 255, 0),
         2)


if __name__ == "__main__":
    im = Image.open('***')
    search_letters(im)
and i get this error:
Traceback (most recent call last):
  File "main.py", line 18, in <module>
    search_letters(im)
  File "main.py", line 7, in search_letters
    h, w, c = img.shape
AttributeError: 'JpegImageFile' object has no attribute 'shape'
@fiery frost it looks like the "JpegImageFile" needs to be extracted to a numpy array somehow
or something else with a "shape"
i dont use cv2 but hopefully that helps you search the docs for what you need
fiery frost
i dont use cv2 but hopefully that helps you search the docs for what you need
@desert oar i got it.
i used pillow to read the image instead of using cv2.😅
desert parcel
target = np.array([[[14.76, 16.42, 18.08, 23.41]],
                    [[5.87, 11.14, 13.20, 25.72]],
                    [[2.73, 4.42, 8.04, 13.68]]], dtype='float32')
loss = msc(preds, target.t())```
Output:
RuntimeError Traceback (most recent call last)
<ipython-input-133-1f7a5efd8923> in <module>()
1 preds = model(input)
2 print("-"*20)
----> 3 loss = msc(preds, target.t())
RuntimeError: t() expects a tensor with <= 2 dimensions, but self is 3D```
I'm not sure what to do here
I don't know how to make a matrix into a 4x1
 balmy grotto
I am working on a indoor localization based on magnetometer.
I have 9 separate time-series datasets of sensor readings taken from coordinates 00, 01, 02, 10, 11, and so on until 22. Basically I am using my own coordinate system and gathered data. The coordinate system looks like this:
0,0 | 0,1 | 0,2
1,0 | 1,1 | 1,2
2,0 | 2,1 | 2,2
The dataset has columns X, Y, Z and Magnitude. I don't know how/where to start?
I was thinking about creating my own label column and then use different classifier algorithms to predict the location. There are plenty resources out there, but I just want to know how to start.
I plan on using RandomForest classifier but I would appreciate any suggestions on what kind of classifier algorithms should be used?
Please help!
spark cape
What does the data represent and what are you trying to predict?
lapis sequoia
share colab link maybe, or a picture of what the dataset looks like. and what your target variable is
untold aspen
target = np.array([[[14.76, 16.42, 18.08, 23.41]],
                    [[5.87, 11.14, 13.20, 25.72]],
                    [[2.73, 4.42, 8.04, 13.68]]], dtype='float32')
loss = msc(preds, target.t())```
Output:
RuntimeError Traceback (most recent call last)
<ipython-input-133-1f7a5efd8923> in <module>()
1 preds = model(input)
2 print("-"*20)
----> 3 loss = msc(preds, target.t())RuntimeError: t() expects a tensor with <= 2 dimensions, but self is 3D```
@desert parcel the error made it quite clear so make target a 2D tensor, not a 3D array like what you got there
combination of torch.tensor() (if u use Pytorch) and .view()
balmy grotto
@spark cape I am trying to predict the coordinates.
@lapis sequoia
@lapis sequoia here's what the dataset looks like. It doesnt have any target variables. So i was thinking that i would just create a column called labels and the add what readings belong to/were taken from which coordinates
spark cape
You have 9 sensors and they give coordinates. And you want to predict the future sensor values? Or given sensor input, predict the coordinate (remove noise. Use kalman filter)
balmy grotto
I want to build a classifier very simple. It should just predict that by sensor readings what coordinate it might belong to. Its noiseless data i have already made sure of it.
Hope you got what i am trying to say. @spark cape
Since there is no target variable so i though of adding a column labels to all 9 seperate datasets then combining the dataframe and then may be use random forest or some classifier algorithm.
Please let me know if i am on right track here.
spark cape
Sounds like you want to triangulate the position. If the data is clean (it's not if it's coming from real world sensors) then you could calculate distance from each sensor and triangulate based on that. No need to overcomplicate it.
balmy grotto
Well as much as i agree with you. i have been given a task so i have to create a classifier.
spark cape
Fwiw @balmy grotto the way to begin is by describing your problem and what you want to find very explicitly and clearly. So you're on the right path of you can be patient with me. 😅
So it's a homework assignment?
balmy grotto
Yeah.
spark cape
Ok. Well you have supervised and unsupervised learning. Supervised learning has two data sets: training and testing. Training has samples from sensors and the answers you want. (Tagged data). You train your model using this.
Test data has the same but you hide it from the model at first so you can check the validity of your model.
Do you have sensor data and associates 'answers'?
Unsupervised learning goes through the data and says "I found this weird thing. Do you think it's important?". It doesn't sound like you're doing this since your outputs seem well defined.
Last is your outputs a float, a vector of floats, or an enumerated class of things?
balmy grotto
associates 'answers'?
Sorry what do you mean by that?
Yes i have sensor data. I have sensor data from each coordinates (refer grid in my very first message)
And yes my output is an enumerated class of things.
@spark cape
spark cape
But does some of the sensor data have tags? I.e. at 2020/07/27T16:29:00.000Z the thing was in quadrant 1,1
balmy grotto
No tags. Only <timestamp> <x> <y> <z> <magnitude> columns.
spark cape
Well you will need the results with some of your training data to determine the result of you want to classify it. Otherwise the model can't be trained.
balmy grotto
Can i add tags manually? Because i have collected data at coor 00 then coor 01 and so on.

Sent you the link just so you know how my data and datasets look like. Anyways thank you!
mellow spruce
I want to check my approach with this. I have large set of data that looks like this
   A000005|A00032|0.7
   A000005|A00142|0.3
   A000005|O00534|0.7
    A00032|B00064|0.4
   A00142|C0000765|0.6
   F78541|H098866|0.4```

I want split this data frame into different groups of sources and target that are chained. for example the output would be something like
``` Group 1=['A000005','A00032','A00142','O00534','B00064','C0000765']
group 2=['F78541','H098866']```

I was thinking on using something like
```if df['source'] isin group1:
        group1.append(df['target'])
elif df['source' isnot in group 1:
        group2=[df['source'],df['target']]```
I am sure this is completely wrong besides I think that this will create a lot of overlapping groups. What is a good way of doing this?not really
 velvet thorn
you're effectively looking for the components of the supergraph
pandas is meant to deal with tabular data
you can do it, but it's not really what it's meant for
how are you with graphs
fiery frost
@desert oar After some research i used this code:
def better_search_letters(img):
    d = pytesseract.image_to_data(img, output_type=Output.DICT)
    n_boxes = len(d['level'])
    for i in range(n_boxes):
        (x, y, w, h) = (d['left'][i], d['top'][i], d['width'][i], d['height'][i])
        cv2.rectangle(img, (x, y), (x + w, y + h), (0, 255, 0), 2)

    cv2.imshow('img', img)
    cv2.waitKey(0)
but it only gets parts of the image.
what can i do to make the algo better?
mellow spruce
ideally I would like pandas because I want to put this on a dashboard using plotly dash but it doesn't necessarely have to be in pandas
how are you with graphs
@velvet thorn just plotly
mellow spruce
never used it
mellow spruce
ohhhh
velvet thorn
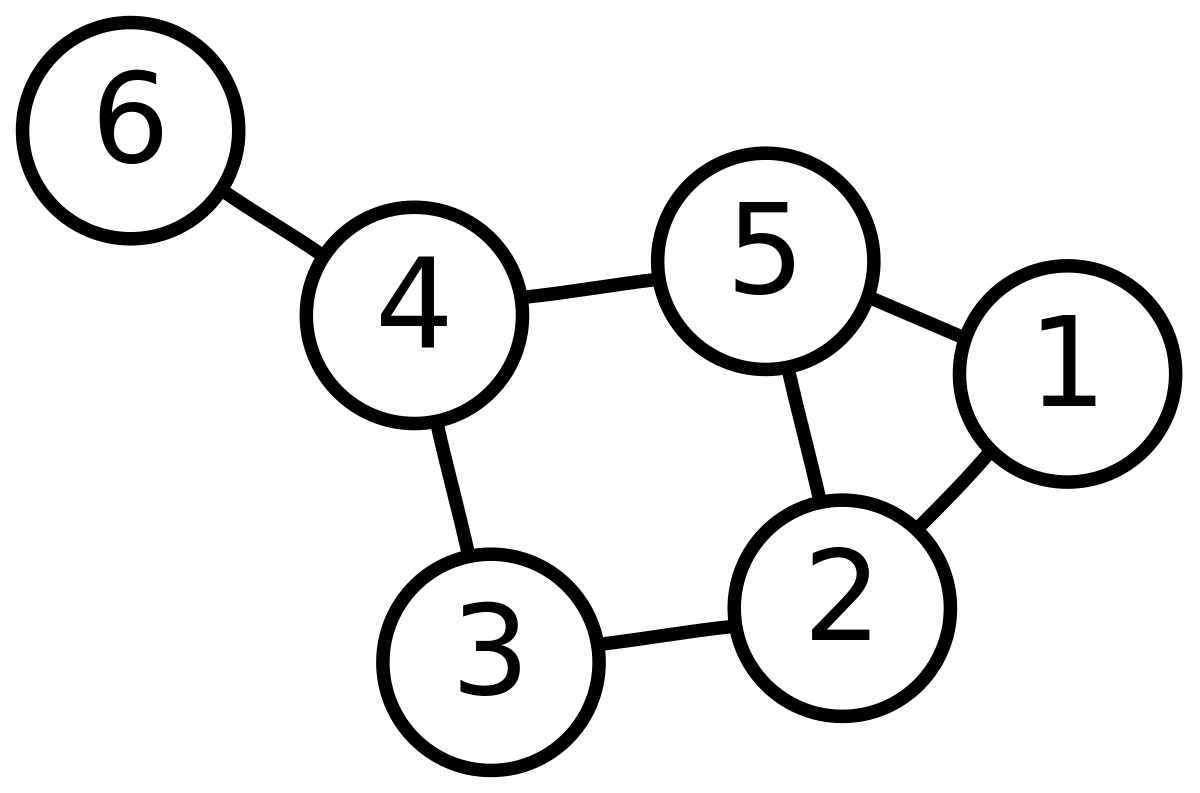
In mathematics, and more specifically in graph theory, a graph is a structure amounting to a set of objects in which some pairs of the objects are in some sense "related". The objects correspond to mathematical abstractions called vertices (also called nodes or points) and eac...
mellow spruce
not familiar
velvet thorn
well
what you have is a graph problem and would be best solved with a graph library
if you're good with mathematics
fiery frost
@desert oar After some research i used this code:
def better_search_letters(img):
    d = pytesseract.image_to_data(img, output_type=Output.DICT)
    n_boxes = len(d['level'])
    for i in range(n_boxes):
        (x, y, w, h) = (d['left'][i], d['top'][i], d['width'][i], d['height'][i])
        cv2.rectangle(img, (x, y), (x + w, y + h), (0, 255, 0), 2)

    cv2.imshow('img', img)
    cv2.waitKey(0)
but it only gets parts of the image.
what can i do to make the algo better?
Do someone had an idea?
velvet thorn
it shouldn't be too much trouble
to learn how they work and implement a solution like that
mellow spruce
to learn how they work and implement a solution like that
@velvet thorn cool, will take a look at it. Thanks!
velvet thorn
if you're not good with math
then, basically...
well
I mean you would effectively be reimplementing the graph algorithm anyway
so
LOL
yeah I think that's your best bet
what you're looking for is this
mellow spruce
hm hahaha
velvet thorn

In graph theory, a component, sometimes called a connected component, of an undirected graph is a subgraph in which any two vertices are connected to each other by paths, and which is connected to no additional vertices in the supergraph. For example, the graph shown in the il...
all the components
mellow spruce
okay Thanks for the article. will start reading this!
velvet thorn
and your dataframe is basically an edge list (this is a term you may need to Google)
no problem
good luck
mellow spruce
hm, doesn't plotly do exactly that?
velvet thorn
what is "that"
mellow spruce
Grab a list of edges and nodes and constructs a network graph from them
velvet thorn
it does?
I don't use plotly so I don't know
like
based on what I know, plotly is just for visualisation...?
like you can visualise a graph but if you want to find the connected components in it (which seems like your task) you need an actual graph library
(I suggest networkx)
mellow spruce
Dash Cytoscape is our new network visualization
component. It offers a declarative and pythonic
interface to create beautiful, customizable,
interactive and reactiv...
velvet thorn
yeah, that looks like just visualisation...?
mellow spruce
hm okay, I will take a look at networkx. Thanks for the guidance
 cyan matrix
Hey guys, unsure if this is the right place to ask but data-science seemed an appropriate place to ask - super new to python and coding in general, and am just learning for data analysis. I'm using pandas to clean up a large dataset (approx 8m rows). I'm trying to pull out all the unique strings in a column, and am having trouble doing so
using this line, and it's not printing anything whatsoever
print(pd.unique(df['Description']))```df['Description'].unique()
mellow spruce
is there an easy way to add the key values to the dictionary elements corresponding with that key? like:
          'Mammal': ['Bear','Tiger', 'Dolphin']```
to

```new_d={'Bird':[('Bird','Penguin'),('Bird','Falcon'),('Bird','Hawk')],
'Mammal': [('Mammal','Bear'),('Mammal','Tiger'), ('Mammal','Dolphin')]```I remembered, thank you @desert oar
 junior quest
PermissionError: [Errno 13] Permission denied: 'C:\\Users\......\data\\json'
why is pandas doing this?
 uncut shadow

Stack Overflow
Just starting to learn some python and I'm having an issue as stated below:
a_file = open('E:\Python Win7-64-AMD 3.3\Test', encoding='utf-8')
Traceback (most recent call last):
File "<pyshel...
maybe check this
cuz looks like json is a dir
desert oar
does anyone remember how to un-pivot just one level of multiindex columns?
  elapsed
     4000    6000    8000    10000      inf
0  3919.0  6282.0  9441.0   4873.0  12467.0
1  3922.0  6216.0  7628.0   9244.0  11409.0
2  3938.0  6219.0  6435.0   9462.0   7963.0
3  3986.0  5908.0  8063.0   9298.0   8815.0
4  4032.0  6154.0  7567.0  10988.0  12487.0
...
i want to turn the lower layer of columns (4000, 6000, 8000, 10000, inf) into a separate column, converting the data from "wide" to "long" format
for all the pandas incantations i remember, this is not one of them
aha, .stack(level=1)
rather, .stack(level=1).reset_index(level=-1)
my index was unnamed so i also had to rename the resulting new column to something sensible
mellow spruce
okay I did it. and my dictionary looks like this:
          'Mammal': [('Mammal','Bear'),('Mammal','Tiger'), ('Mammal','Dolphin')]```

I am trying to get connected components from a network graph with the following algorithm
```def get_all_connected_groups(d):

    already_seen=set()

    result=[]

    for node in d:

        if node not in already_seen:

            connected_group,already_seen=get_connected_group(node,already_seen)

            result.append(connected_group)

    return result

def get_connected_group(node,already_seen):

    result=[]

    nodes=set([node])

    while nodes:

        node=nodes.pop()

        already_seen.add(node)

        nodes.update(n for n in d[node] if n not in already_seen)

        result.append(node)

    return result,already_seen

components=get_all_connected_groups(d) ```
However it stops with the second element of the dictionary ```('Bird','Falcon')``` and gives me an error  highlighting this line ```nodes.update(n for n in d[node] if n not in already_seen)```
I think is because the example uses numbers as the nodes and I am using strings but I am not sure, any help works!Good day everyone! I have a question for you all! What do you think, how much time it would take to learn ML so that one could apply for a job? Do any of you have some real life examples?
desert oar
depends on your background. not a quick process though
ML engineering has less need to "know" machine learning but has a greater emphasis on programming and still requires a solid foundation in math
if im involved in hiring i tend to be skeptical of people who came "from nothing" too recently, it makes me think they only got a cursory education and won't be able to run a project on their own
at a bigger org with more infrastructure and mentorship opportunities id be more willing to hire someone like that
a lot of companies still have very small data science teams consisting only of highly-educated and/or highly-experienced members
dull zodiac
i see
@desert oar so if one has like 5 months experience in python and math skills are not that great at this moment, would it be possible to get somewhere in one year?
i lost my jobe do to Covid
so i have at least one year free time
to learn new skills
flat quest
what kind of math and python skills
different people can have widely different experiences in the same amount of time
@dull zodiac
dull zodiac
@flat quest i agree with you, so i think i do understand basics of python, and i'm not complete stupid in math, it just that i didn't use math 5 years
flat quest
i mean what subjects have you touched on in math
desert oar
it depends. you can probably use your skills to help out a local business automating stuff. that can definitely earn you some side cash
desert oar
you probably won't get a job as a junior data scientist with that kind of resume unless you really really hit the books and self-study material hard. and even then you're looking at a couple of months before you're hireable
dull zodiac
@desert oar i have one year time to learn ML
🙂
i'm realist, i do realize that it will take time, and a lots of it
desert oar
you can do a lot in a year if you're motivated
i can't guarantee it will get you a job but you can definitely learn a lot
enough to be competent
flat quest
one year isn't that long of a time tbh, but if you work hard you can still learn a lot. ML's a very vast field, and even if you don't get much into the theoretical aspect (which requires higher level mathematics).
You'll still need familiarity manipulating data, gathering data, and knowing which architecture to utilize in different scenarios.
But to get started you're going to need a stronger fundamental.
desert oar
@flat quest a year of full time study is different though
and there is a lot of learning material out there that there wasnt a few years ago
i agree you wont be a wizard
but you can cover linear algebra, calculus, and python in the first few months
then move into basic stats, probability, etc
then machine learning
4 months each
tight schedule but you can at least touch on the fundamentals
dull zodiac
looks like that i a have lots of learning to do
dull zodiac
@desert oar thank you for your advice!
flat quest
there is, it depends on how hard you work as an individual.
But its more likely you'll get burnt out if you work way too hard.
And even at the end, there's a good chance you won't be that useful to a company if you can only do basic ML. Lots of ML products coming out that get rid of the need for lower level engineers.
Its definitely possible to land a job, I wouldn't bet on it though.
dull zodiac
@flat quest so let me ask you this way. If you would have the same amount of time as I have, and your end goal is to get a junior dev position, what would you learn: ML, python scripting, one of the webframeforks like django or flask or something else?
i like python, but i do need to understand what path to take with it, at this moment i'm bit lost, so for that reason i was thinking about ML, it sounds intresting but it also looks very challenging
flat quest
honestly if you're aim is to get a job within a single year. I would go into something like web dev, or server side development.
They have a lower bar to entry.
You should really only do ML if its something that interests you because of the possibilities it opens in terms of computer ability, rather than solely due to the job. The journey of a data scientist is more likely to be a marathon.
If you'd like to continue doing ML (its something you find fascinating, you frequently seek articles on the topic, etc), by all means try to get that job in a year. You'll learn a lot in the workplace.
dull zodiac
@flat quest thank you for the tip, and your time :)!
flat quest
yeah np
desert oar
really good point about burnout
and yeah i would agree, aim for software dev or data analyst
narrower skillset
i think data analyst -> data scientist is a very valid career trajectory
as is software dev -> data scientist
also you can consider taking a detour into MS Excel
 charred blaze
nowadays a more popular trajectory is data scientist -> SW dev
lapis sequoia
NLP question.
ውሻህን እወዳለሁ -> your dog I like-> I like your dog
ውሻዬን እወዳለሁ -> my dog I like ->I like my dog
This is Amharic ^^ As you can see the word dog changes depending on who is talking unlike English. word dog stays same in English. How can I deal with this issue?
charred blaze
career wise, you're better served heading to frontend dev or backend dev.
(sorry for the off-topic)
desert oar
@charred blaze why do you say that
charred blaze
there's an higher ROI on those fields (that is, you don't need to know so much stuff compared to data science), there are more jobs, the wages are higher, the career paths are better, etc.
desert oar
thats valid
 deft solstice
is anyone familiar with is anyone familiar with pandas, specifically df.groupby behavior?
charred blaze
yes, what about it?
deft solstice
Im a little confused by the following scenario - lemme get some code examples
>>> p_asmnhah
       AS      M     NH     AH  prob
0    True   True   True   True  0.99
1    True   True   True  False  0.01
2   False  False  False   True  0.00
3   False  False  False  False  1.00
4    True  False  False   True  0.50
5    True  False  False  False  0.50
6    True  False   True   True  0.75
7    True  False   True  False  0.25
8    True   True  False   True  0.90
9    True   True  False  False  0.10
10  False   True   True   True  0.65
11  False   True   True  False  0.35
12  False   True  False   True  0.40
13  False   True  False  False  0.60
14  False  False   True   True  0.20
15  False  False   True  False  0.80
>>> p_asmnhah.groupby(["M", "NH", "AH"], as_index = False).sum()
       M     NH     AH    AS  prob
0  False  False  False  True  1.50
1  False  False   True  True  0.50
2  False   True  False  True  1.05
3  False   True   True  True  0.95
4   True  False  False  True  0.70
5   True  False   True  True  1.30
6   True   True  False  True  0.36
7   True   True   True  True  1.64
In here, i do a groupby on M, NH, AH and i end up with a dataframe with AS as well
here when i do group by "Animal", i don't get the "Max Speed" column
crud bad example
charred blaze
hmm
arctic wedgeBOT
Hey @deft solstice!
Uh-oh! It looks like your message got zapped by our spam filter. We currently don't allow .txt attachments, so here are some tips to help you travel safely:
• If you attempted to send a message longer than 2000 characters, try shortening your message to fit within the character limit or use a pasting service (see below)
• If you tried to show someone your code, you can use codeblocks
(run !code-blocks in #bot-commands for more information) or use a pasting service like:
deft solstice
   first_choice car_door host_choice second_choice      prob
0            d1       d1     smaller          stay  0.166667
1            d1       d1     smaller        switch  0.000000
2            d1       d1      bigger          stay  0.166667
3            d1       d1      bigger        switch  0.000000
4            d1       d2     smaller          stay  0.000000
5            d1       d2     smaller        switch  0.000000
6            d1       d2      bigger          stay  0.000000
if i were to run groupby*( [first_choice ,host_choice ,second_choice], as_index = False) on this df, I don't end up with a df with car door
I suspect its because the first DF had boolean values, but I'm not exactly sure why
desert oar
@deft solstice btw in pretty much any chatroom it's recommended that you don't "ask to ask" - it's almost always better to just ask your question outright, so that someone can answer if they see it and know the answer
charred blaze
well
deft solstice
ah sorry i will do that next time @desert oar
charred blaze
when you use a groupby().mean(), you don't really have columns that disappear
desert oar
is 'first' a valid string in GroupBy.agg?
charred blaze
but it's possible that the bools inside the dataframe might have had an effect on your first example. Some times I transform these directly into their correspondent integer values in order to attempt a kludge around this kind of shenanigans
desert oar
i dont think the bools are the problem, however you might end up with missing combinations of rows, i.e. your data might not have an exhaustive set of permuations
deft solstice
hmmm okay
desert oar
(data
 .groupby(['first_choice', 'host_choice', 'second_choice'])
 .agg({'prob': 'mean', 'car_door': 'first'})
should work for example
deft solstice
whats the behavior of a bool series applied with sum? so like [True, False, True, False, True].sum()
desert oar
sum of bools = # of true's
deft solstice
ah okay
hmm okay thanks for the help @desert oar @charred blaze
just wanted to clarify when you mean
" it's recommended that you don't "ask to ask" - it's almost always better to just ask your question outright, so that someone can answer if they see it and know the answer"
You mean just ask directly instead of asking a question around the actual question right?
desert oar
yep
deft solstice
👌
uncut shadow
@deft solstice True can be considered as 1 and False as 0. Try print(int(True)) and you will see (do the same for False too)
deft solstice
oh i didn't know that
uncut shadow
👍
 ripe vine
Just out of curiosity, has anyone watched this tutorial? https://www.youtube.com/watch?v=ua-CiDNNj30
How much of data science does it cover?

Learn Data Science is this full tutorial course for absolute beginners. Data science is considered the "sexiest job of the 21st century." You'll learn the important elements of data science. You'll be introduced to the principles, practices, and tools that make data science th...
desert oar
No tutorial can cover all of data science
lapis sequoia
this one was good for me for beginners.

Welcome to Zero to Hero for Natural Language Processing using TensorFlow! If you’re not an expert on AI or ML, don’t worry -- we’re taking the concepts of NLP and teaching them from first principles with our host Laurence Moroney (@lmoroney).
In the last video you learned abo...
still delta
@ripe vine Usually CodeCamp make very good work, I didn't watch this for data science but for others I highly recommend it
 jolly briar
you can cover linear algebra, calculus, and python in the first few months
fwiw I think this is a hugely optimistic estimate
@desert oar ☝️
desert oar
@jolly briar that's fair. it sounded like they already had some math experience
if you're starting from scratch then i agree it will take a lot longer
and someone will probably take it out of context as general advice...
so good point
jolly briar
They said algebra and geometry - to you that might mean group theory and stuff, to them it probably means they saw a quadratic equation
Just going on averages there, not anything against anyone or whatever, it's just that's more often the case
desert oar
yeah good point
jolly briar
it's hard there's so much to learn 😦
desert oar
it will take a lot longer to come up from a math background that stops at ~9th grade
jolly briar
that's not 9th grade for many 🙂
jolly briar
9th grade - is that year 9 UK ?
desert oar
i assume usa math education is on the low end among wealthy nations
jolly briar
🤔
desert oar
14-15 yrs old in the US usually
jolly briar
yeah - i thought you meant ~12 years old
desert oar
yeah no haha
jolly briar
i self taught maths and went via uni
so i'm probably more sensitive to this than many
self taught later on, then went into uni i mean... idk if the first sentence made sense
 serene scaffold
Is there ever a time when you have a slice of a given string, and you take the substring before that slice
That the len of the starting substring is not equal to the starting index of the slice?
Over the years I keep having issues with string manipulation and there being rules unknown to me about character indices might be the confounding variable.
jolly briar
what would a concrete example of that look like?
serene scaffold
Let me think
sharp locust
the substring before string[a:b] is string[:a] which has length a
so yep its always equal
serene scaffold
        output_txt = ""
        output_offset = 0

        for pseudsent in pseudofy_file(bf):
            output_txt += pseudsent.sent  # this is a str
            new_rel = pseudsent.rel
            new_rel.arg1.spans = [(new_rel.arg1.spans[0][0] + output_offset, new_rel.arg1.spans[0][1] + output_offset)]
            new_rel.arg2.spans = [(new_rel.arg2.spans[0][0] + output_offset, new_rel.arg2.spans[0][1] + output_offset)]
            output_offset += len(pseudsent.sent)
            new_relations.append(new_rel)
            new_entities += [new_rel.arg1, new_rel.arg2]
let me look at the output again
output_txt gets written to a file and the file, when read as a string, has len 12621
and all references to output_txt with character spans less than that are accurate
but then the spans continue until 47128
Actually I have an idea. Ignore me.
jolly briar
😄
 zenith salmon
Has anyone here used JMP Pro before? Strengths/weaknesses compared to running models in python?
tame fractal
Don’t use that out of the box data science software its pure rubbish
The python libs out there nowadays make it simple enough already but there is no getting around not learning the concepts
Looking for someone to interview prep with, its okay if you’re not super strong we are doing a zero to hero but please understand the basics, I can teach if necessary(it helps me learn)
 quasi zenith
Folks! Any examples on classifier models build on Word2Vec for NLP?
untold aspen
Folks! Any examples on classifier models build on Word2Vec for NLP?
@quasi zenith well Word2Vec is a group of models that generate embedding layers
so i think to extend the architecture into an NN for classification is doable
so your architecture should be like Word2Vec -> embedding -> (some deep layers e.g dense) -> softmax
 deft harbor
👍
quasi zenith
@untold aspen Thanks mate. Can you point me to any git repo or kaggle
deft harbor
Bert
 glad jay
hey guys im making a neural network but need some help implementing a few methods
does anyone think they could help/
it has to be with layers
flat quest
just say what you need help with @glad jay
glad jay
theres alot of code
but i have to implement this method
def add_hidden_layer(self, num_nodes: int, position=0)
This public method will use the methods we have already coded in LayerList to add a hidden layer with the given number of nodes. By default this new layer will come directly after the input layer. If position is greater than zero, advance that many layers before inserting the hidden layer. For example, if position is 2, the new hidden layer will become the third hidden layer in the network (or the fourth layer, including the input layer
i have 2 other classes that i inherited data from too
 random arch
Hi guys
I've a small data transformation problem I'm having difficulty solving.
#help-peanut - please see here for the description of the problem
flat quest
which part of the add_hidden_layer are u having a problem with @glad jay
 weak roost
I wanted to get started on analysing restaurants in the local area but having trouble finding really what to analyze if anyone could give some pointers
 brittle edge
Hey question, is there anyway to make a relationship between average and the standard deviation?
How can I get an objective number or score of some kind to get the standard deviation to lean closer to the mean
idk if that makes sense
or if anyone has tried this or knows what I mean
tidal bough
huh?
brittle edge
@weak roost You could compare ratings across the restaurants. And I would look into Google APIs to see if you can get insights for traffic and how busy those places are.
@tidal bough I'm trying to figure out what I'm trying to ask hold on :/
okay
so I want to have a way to create a number or ratio that compares the standard deviation to the average
so for example
if the average is 8, the standard deviation is better the lower it is
if the std is less than the average that is good
and it gets worse the larger it is from the average
so a standard deviation of 11 to the average of 8 is not good
how do I quantify that concept
 lavish wigeon
Umm.
Either subtract std from avg, if it’s positive, than its good, if its negative than bad.
tame fractal

Dynamic programming is both a mathematical optimization method and a computer programming method. The method was developed by Richard Bellman in the 1950s and has found applications in numerous fields, from aerospace engineering to economics.
In both contexts it refers to simp...
brittle edge
Thanks I don't why I overcomplicated in my mind,
is there a way to create an objective comparison? Like if it's such and such and negative compared to the average it's 40/100 idk if that makes sense
Because I want to compare multiple stds to averages and have an objective number or percentage to see how those ratios compare to each other so I need some sort of measure to how bad or good it is
@tame fractal I'm noob what is this
okay I think I figured it out
AVG / STD = PERCENTAGE
And the higher the percentage the better it is
tidal bough
honestly, you're doing something really weird
like, what if the average is 0? Plenty of distributions are centered on zero. What's strange about that?
acoustic halo
I'm doing a classification task on a bunch of c++ source codes. I'm wondering if anyone has any ideas of what features I could use for classification
tidal bough
Classification into what groups? Or are you just doing clustering?
acoustic halo
Sorry, it's authorship attribution, of which there are 1000
I wan't some features that are really out there, I've tried all the typical stuff like ngrams, words, stylometry
tidal bough
ah, I see. Maybe count the number of usages of every function from the standard library as a feature - that might be a pretty important input, since presumably some authors use builins less and others more.
acoustic halo
I'm already have standard and user defined methods as a features, plus these /should/ be caught as word-level features
 woeful shore
!pip install PyBERT is not working in Colab or Python notebook, I want to implement multiclass BERT for sentiment analysis
acoustic halo
What error do you get? Transformers installs fine on collab though which has a bunch of bert models
Both pytorch and keras versions
woeful shore
What error do you get? Transformers installs fine on collab though which has a bunch of bert models
@acoustic halo
Both pytorch and keras versions
@acoustic halo please send some to me
error on Python notebook
!pip install PyBERT
has anyone a working implementation of a multiclass sentiment analysis for tweets?
acoustic halo
Looking at PyBERT, it's not acutally even for BERT models if you read the description, are you sure you want this?
It's for testing serial comms
woeful shore
Looking at PyBERT, it's not acutally even for BERT models if you read the description, are you sure you want this?
@acoustic halo seems that there are two types of PyBERT. I want the one for BERT model
woeful shore
I actually was trying to implement this https://github.com/lonePatient/Bert-Multi-Label-Text-Classification/blob/master/run_bert.py and when I run run_bert.py I have ModuleNotFoundError: No module named 'pybert.train'

GitHub
This repo contains a PyTorch implementation of a pretrained BERT model for multi-label text classification. - lonePatient/Bert-Multi-Label-Text-Classification
Which is the one you want?
@acoustic halo for BERT model
acoustic halo
It's because your trying to pip install a module that only exists in that repo
WHich is something they have made themselves by the looks of it
Use the transformers library, it's a lot less complicated
And infact event that requires transformers anyway
desert parcel
@desert parcel the error made it quite clear so make target a 2D tensor, not a 3D array like what you got there
@untold aspen
combination of torch.tensor() (if u use Pytorch) and .view()
@untold aspen Could you explain this?
I know the error but I have no idea what to do
untold aspen
@desert parcel assuming you got a 3D Numpy array with shape (1, smth, smth). I'm using TF for this
dummy_tensor = tf.Variable(your_array)
dummy_tensor_reshaped = tf.reshape(dummy_tensor, [your_array.shape[1], your_array.shape[2])
I have a question regarding NLP: What is the best approach to mine emotions from a text, if i use EmoLex? https://saifmohammad.com/WebPages/NRC-Emotion-Lexicon.htm
What is the best way to determine a score for a text? and what is the best way to make different texts comparable? By now i have just been counting the words with certain emotions, but i do not take into consideration how many words a text has or booster words or negation words
is there some standard way to do this?
lapis sequoia
I actually was trying to implement this https://github.com/lonePatient/Bert-Multi-Label-Text-Classification/blob/master/run_bert.py and when I run run_bert.py I have ModuleNotFoundError: No module named 'pybert.train'
@woeful shore use the bert-for-tf2 module
!pip install bert-for-tf2
!pip install sentencepiece
fiery frost
I want to train nerual network to recognize speech bubles, i have data.
what do i do now?
(i am very new at this)
untold aspen
I want to train nerual network to recognize speech bubles, i have data.
what do i do now?
@fiery frost recognize what from text? emotions? topic? NEs?
untold aspen
oh ok
fiery frost
I tried to write it with contours.
but it require many adjustments.
and is not perferct as you see.
untold aspen
do you have data on the label of the bubbles on these images?
 wind plume
Having a hell of a time in pandas right now. I have a dataframe that is just displaying NaN values after applying mathematical operations and stuff.
A dataframe called df_new exists, but as soon as I try to do some mathematical operation like get a quantile using Q1 = df.quantile(0.25) I get an empty series
Could anyone guess why that is giving me huge problems?
Print df gives me valid numbers. It's just a 1 column by 20 rows. So getting a quantile I would think shouldn't be terribly hard.
fiery frost
do you have data on the label of the bubbles on these images?
@untold aspen You mean data of pages like this?
i have bfore and after images.
I just dont know how to start
I am very new to this staff.
if i have before and after,
could it be help for recognize this?
@untold aspen can you help me?
?
PLS?
 earnest wadi
model = keras.models.load_model("Number Recogniser.h5")
curImg = cv2.imread("test.png")

prediction = model.predict(img)

print (prediction[0])
ValueError: Input 0 of layer sequential is incompatible with the layer: : expected min_ndim=4, found ndim=3. Full shape received: [32, 32, 3]
I understand whats its saying, I just dont understand how to fix it, my prediction image is the exact same as my training data
velvet thorn
@earnest wadi img[np.newaxis, ...]
untold aspen
@untold aspen can you help me?
@fiery frost sorry man not my expertise but i recommend you check out some articles on object detection
some models i know are about attention models and the transformer
fiery frost
Thx anyway.
untold aspen
those allows NNs to focus on certain objects in an image say
model = keras.models.load_model("Number Recogniser.h5")
curImg = cv2.imread("test.png")

prediction = model.predict(img)

print (prediction[0])
ValueError: Input 0 of layer sequential is incompatible with the layer: : expected min_ndim=4, found ndim=3. Full shape received: [32, 32, 3]I understand whats its saying, I just dont understand how to fix it, my prediction image is the exact same as my training data
@earnest wadi what is your model's architecture
velvet thorn
it doesn't matter
that error occurs because the model expects 4D input of shape (samples, x, y, channels)
velvet thorn
but imread returns a single image of shape (x, y, channels)
which is why I said
img[np.newaxis, ...]
which will add an additional dimension of size 1
reflecting the fact that the batch contains a single sample (image).
earnest wadi
ok, so what shall I change
earnest wadi
oh there are mssages above
sorry
that just did this @velvet thorn
ValueError: Input 0 of layer sequential is incompatible with the layer: expected axis -1 of input shape to have value 1 but received input with shape [None, 32, 32, 3]
velvet thorn
hm
it expects greyscale?
because what that is saying is that it expects a 1-channel image but your input has 3 channels.
earnest wadi
yeah /255 isnt fixing it, and reading it as grayscale makes the shape (None, 32, 32)
velvet thorn
no
earnest wadi
it needs to be (None, 32, 32, 1)
velvet thorn
neither of those would work
the simplest way would be to do the same thing we did with the samples dimension
earnest wadi
oh
earnest wadi
awesome
thanks
ive just got my cnn to work, is there any tutorials on how to run the network backwards? as in, i give it outputs and it generates inputs?
earnest wadi
my cnn can identify numbers and letters with a categorical output,
is there a function where I give it [0, 0, 1, 0, 0, 0, 0, 0, 0, 0] to create its own number 2?
acoustic halo
You can't run a neural net in reverse
velvet thorn
my cnn can identify numbers and letters with a categorical output,
is there a function where I give it [0, 0, 1, 0, 0, 0, 0, 0, 0, 0] to create its own number 2?
@earnest wadi yes
earnest wadi
oh
velvet thorn
but it's quite a bit more complex than that
earnest wadi
is there tutorials or anything
acoustic halo
Well, you can but not with simple dense networks
earnest wadi
I didnt know what to search for
velvet thorn
it's more difficult because in the classification case you're basically performing information distillation
it's easier to take information away than to add it
acoustic halo
also look up variational autoencoders
 carmine iron
How can I take the index position of a Column of List, and do something
For example x[1] / x[0]
lapis sequoia
you want to divide the indices or values
carmine iron
The column of list is derived from ```pd.groupby('A')['B').apply(lambda x :x.tolist()).reset_index()
I want to divide the values from the last two index position of the series
I dont just want to separate the column into two separate columns
then divide by the new columns
<pre> fips cases case_avg case_avg_7 First Last Growth_7_day_avg_cases
0 1001.0 [857, 865, 886, 905, 921, 932, 942, 965, 974, ... 923.4 [932.1428571428571, 946.5714285714286] 932.142857 946.571429 0.015479
1 1003.0 [2013, 2102, 2196, 2461, 2513, 2662, 2708, 277... 2516.8 [2592.1428571428573, 2693.8571428571427] 2592.142857 2693.857143 0.039239
2 1005.0 [503, 514, 518, 534, 539, 552, 562, 569, 575, ... 545.0 [549.8571428571429, 559.2857142857143] 549.857143 559.285714 0.017147
3 1007.0 [279, 283, 287, 289, 303, 318, 324, 334, 338, ... 309.9 [313.2857142857143, 321.42857142857144] 313.285714 321.428571 0.025992
4 1009.0 [507, 524, 547, 585, 615, 637, 646, 669, 675, ... 609.9 [624.8571428571429, 645.8571428571429] 624.857143 645.857143 0.033608 </pre>
lapis sequoia
x[-2]/x[-1] to divide the last two values of list
carmine iron
i keep getting IndexError: index -2 is out of bounds for axis 0 with size 1
I thought would be the answer also
within cases Im taking the 7 day moving average first with python group['case_avg_7'] = [moving_average(x,7)[-2:] for x in group['cases']]
group['case_avg_7'] = [moving_average(x,7)[-2:] for x in group['cases']]```def moving_average(x, w):
return np.convolve(x, np.ones(w), 'valid') / w```your list prolly has one column and the rest as row elements
print length of list
if thats the case you can try x[0][-2]/x[0][-1]
carmine iron
group = current_data_df.groupby('fips')['cases'].apply(lambda group_series: group_series.tolist()).reset_index()```len of 3188
num of rows in df
let me try
TypeError: 'int' object is not subscriptable``` arctic cliff
woeful shore
arctic cliff
woeful shore
@woeful shore use the bert-for-tf2 module
@lapis sequoia
which is that?
acoustic halo
@woeful shore are you familiar with keras or pytorch?
carmine iron
not sure why but this solved my issue
group['case_avg_xxx'] =[ x[-1] / x[0] -1 for x in group['case_avg_7']]```Thanks @lapis sequoia
 jade walrus
Jupyter seems like a good tool to write data-science web app in python. It is easier to write in python than using frontend js frameworks like angular or react. Is jupyter a viable front-end tool?
lapis sequoia
https://github.com/kpe/bert-for-tf2 @woeful shore

GitHub
A Keras TensorFlow 2.0 implementation of BERT, ALBERT and adapter-BERT. - kpe/bert-for-tf2
its for keras though
are there any data scientists or researchers in this group
just wanted to know what your professional experience is like
desert oar
my experience is somewhat atypical, but
50% writing python libraries
25% cleaning data
15% meetings with management and making reports
5% teaching people how to do stuff
5% analyzing data and building models
flat quest
Actually u can run neural networks in reverse using auto encoders. @acoustic halo
What kind of python libraries? For ml or cleaning / utility functions, or something else?
acoustic halo
@flat quest, i did mention autoencoders, I was more talking about the CNN that was being used
desert oar
a whole 10%? wow im jealous
flat quest
Ah gotcha @acoustic halo
desert oar
i guess i treat "cleaning" and "processing data / feature engineering" as different things
so maybe more like 10% cleaning data and 15% processing/engineering feature
woeful shore
https://github.com/kpe/bert-for-tf2 @woeful shore
@lapis sequoia thanks
GitHub
A Keras TensorFlow 2.0 implementation of BERT, ALBERT and adapter-BERT. - kpe/bert-for-tf2
 uncut latch
desert oar
uncut latch
desert oar
@void anvil that i think depends on your field
in my case i tend to only have whatever data i have
finding new/creative data sources is a nontrivial part of my job. but typically once i get the data it's usually pretty clean
probably the messiest thing ive had to do is differentiate between human names and business names
and between business names and business addresses
the former we think we have figured out pretty good
the latter we've got a hacky solution for
i suspect that a character-level ngram model could do a very good job at distinguishing names and addresses but that's an "after hours" project i havent had the time or motivation to do
really i just need to pull a few million of each from our databases and throw it into fasttext
im just lazy and sometimes id rather help people on discord 😆
oh no
did you have to collate his travel records with his data entry?
lmao
thats insane
3/4/2019 vs 4/3/2019
🙃
was he entering them into excel and excel was auto-formatting based on locale?
desert oar
Is it possible to assign (or remove from the pool) a specific core to a task in python?
this is possible at the OS level, right? not sure about python
that is horribly annoying w/ the dates
this is the real "unsung hero" shit that data scientists (and sometimes programmers) never get credit for
 marsh berry
Hey all, I have this dataframe and need to do some subtraction. Every fourth row should be subtracted from the previous three rows. For example: Row 3's values should be subtracted from rows 0,1,2 and then row 7's values should be subtracted from rows 4,5,6 and so forth. How can I accomplish this via something like df.diff()?
 fast pelican
tame fractal
fast pelican
tame fractal
@marsh berry use numpy and treat each row as a series
 south quest
@tame fractal ?
spark cape
pandas.concat(a, b) doesn't seem to include a way to keep all of b's columns if it happens to be empty.
marsh berry
@tame fractal I'm not sure how to go about that
tame fractal
@spark cape pass the columns you want to keep as a parameter
marsh berry
This actually subtracts every 4th row from the last 3 rows but it looks like they're all separate dataframes now 😭
 frank bone
just concatenate them
pandas.concat()
however probably not the smartest idea 🙂
computationally
if it just happens once in your program then it wont matter though
spark cape
@tame fractal thanks. concat worked; but apparently groupby and resample remove cols with all na fields i guess.
marsh berry
concatenate did the trick
spark cape
all hail concatenate!
visual violet
how to Search for exact String in Pandas Dataframe
frank bone
how would I go about matching pairs in a list with a certain percentage above&below for the pairs to be considered pairs?
mellow spruce
Hey guys. I am wondering if there is a quick way to generate a column with the aggregate value of another column ie:
   0.5
   0.6
   0.6```

to
```Time|Agg_time
   0.5|0.5
   0.6|1.1
   0.6|1.7```

and such. I tried
```df[Agg_time]=df.apply(lamda row:row.Time+row.Time.shift(),axis=1)```


but it's giving me as an error
```Attribute Error: 'float' object has no attribute 'shift'```
any help is welcomed! 🙂say Id want to apply a 3% tolerance
doubles = []
for k, v in Counter(list).items():
    doubles.extend([k] * (v//2))
print(doubles)```Hey guys. I am wondering if there is a quick way to generate a column with the aggregate value of another column ie:
   0.5
   0.6
   0.6```

to
```Time|Agg_time
   0.5|0.5
   0.6|1.1
   0.6|1.7```

and such. I tried
```df[Agg_time]=df.apply(lamda row:row.Time+row.Time.shift(),axis=1)```


but it's giving me as an error
```Attribute Error: 'float' object has no attribute 'shift'```
any help is welcomed! 🙂
@mellow spruce df[Agg_time]=df['Time'].cumsum()
drifting umbra
@visual violet could not convert string to float
you hav a string
in some of the data
visual violet
so like "6,705"
drifting umbra
yeah or
visual violet
that is the string
drifting umbra
"dog"