#data-science-and-ml
1 messages · Page 238 of 1
 desert parcel
 bitter harbor

In mathematics, matrix calculus is a specialized notation for doing multivariable calculus, especially over spaces of matrices. It collects the various partial derivatives of a single function with respect to many variables, and/or of a multivariate function with respect to a...
desert parcel
hmmm
 flat quest
Just sum c into a scalar vale
bitter harbor
^
bitter harbor
numpy() isn't a thing
bitter harbor
this si why I don't like nn libraries
flat quest
I mean nn libs make our life a lot easier. But they’re useless if you don’t understand how they drive calculations.
bitter harbor
I haven't really looked into them although I know they're optimized
usually just because I want to do the math
math being like building it with numpy
flat quest
You should try making a 5 layer dense model without it 😉
I mean there’s really not too much to it. Just gradients
desert parcel
even though c is now one equation I can't do anything with it
because it's not a scalar
bitter harbor
I actually used to have one with 5 hidden
desert parcel
You mean with keras or something?
bitter harbor
no
desert parcel
Wait is it related with my problem?
bitter harbor
partically
you should be learning about__at least__ linear algebra and how nn's work
stats too but you can __kind of __ get away without intensively studying it
bitter harbor
no
desert parcel
then maybe just tell me what to do
I'm trying out different things
how do i make a matrix into a scalar anyways
bitter harbor
linear algebra's a lot different from Euclidean algebra (so mostly what you've been doing)
 tidal bough
matrixes are, uhhm, not scalars.
bitter harbor
what you've learnt with scalars
desert parcel
This is some exercise from the video I'm using as a resource
bitter harbor
matrices can contain scalars?
desert parcel
I mean can't they?
Matrices are just a list of scalars?
I'm very confused
and have no idea what i'm saying
tidal bough
2d array, sure.
desert parcel
What
tidal bough
a matrix is a 2d array of scalars.
bitter harbor
this is why the oxford comma is needed
desert parcel
what's an oxford comma
is it any different from a normal comma
nvm that's english but what can I do
bitter harbor
first, second, and last
bitter harbor
because idk if they want a combination of (x,w) and b, or x,w, and b
desert parcel
and I got this
desert parcel
I want to make an equation in this case c = a *b
and then differientiate it
with respect to either a or b
I am curious about finding the differentials of matrices
bitter harbor
what's the above example?
desert parcel
wdym
desert parcel
Let me link you the notebook

Share Juptyer notebooks instantly. Jovian makes Jupyter notebooks shareable, commentable and reproducible.
These are the important parts, which are the examples mentioned in the questions/exercises
these are just the questions
tidal bough
What makes PyTorch special is that we can automatically compute the derivative of y w.r.t. the tensors that have requires_grad set to True i.e. w and b. To compute the derivatives, we can call the .backward method on our result y.
bitter harbor
^^
desert parcel
I understand this part
tidal bough
I don't see you doing that on a or b 😛
desert parcel
I did that at the top
tidal bough
🤔
tidal bough
...on the matrix for which you don't set requires_grad? :/
bitter harbor
f
desert parcel
bitter harbor
...on the matrix for which you don't set
requires_grad? :/
desert parcel
what
bitter harbor
c
desert parcel
what
tidal bough
not sure about that
tidal bough
you might notice that it's a different error
desert parcel
setting everything with requires_grad=True
and then making c equal the vars with that condition
can do .backward() just fine
tidal bough
in fact, it's an error you have not shown us before 😛
bitter harbor
My thought is this guide is either outdated or wrong
tidal bough
There's no reason to assume that, considering that the guide doesn't have an example using backward with anything but scalars
desert parcel
The exercise says
making an equation with matrices then finding the differentials
He didn't say it will work but the wikipedia link he added at the bottom to say you can makes me wanna make it work since it is possible
tidal bough

PyTorch Forums
Hi, loss.backward() do not go through while training and throws an error when on multiple GPUs using torch.nn.DataParallel grad can be implicitly created only for scalar outputs But, the same thing trains fine when I give only deviced_ids=[0] to torch.nn.DataParallel. Is t...
bitter harbor
how hard is it to send nn's through the gpu?
flat quest
well you have to reduce c into a single value. Sum over it and it's a one value @desert parcel
Ah nice. Did you implement the backprop yourself? @bitter harbor
flat quest
yeah i know
its just it can get horrible memory inefficient when you're working with a million params
and some of the gradients aren't as easily defined. For example you can get the gradient of an if function with tf through graph defs
bitter harbor
its just it can get horrible memory inefficient when you're working with a million params
It wasn’t even that, my input was just too big
 silk axle
@ebon plinth probably best to stick to your help channel (#help-peanut)
Someone's already answered too
 ebon plinth
Oooh, sorry. :<
 digital juniper
so i have a linear regression model and i'm getting very similar mean_absolute_error for my training and test data of roughly 10%, and the R^2 of my predictions vs test data is about 0.6-0.7
any ideas on the next steps i can take to improve the model? i think it's underfitting and I don't have an easy way (yet) to get more features
also i haven't done any kind of preprocessing other than removing null values, don't think feature scaling would help here?
 shadow quiver
Hey guys, I think I have a fun topic to discuss here.
In "social media languages", there are different types of "laughs" in different languages. E.g. English has "lol, rofl" etc. In Turkish, there is a laugh called "random laugh". You just type randomly on keyboard to remark that you lol'd. Like "aslkjhfsalkjg".
I want to detect these "laughs" for NLP purposes in twitter data. Do you have any idea where to start? What do you think? Thanks.
 marble jasper
hmm... interesting question
there's always manual data collection
but to automate it, I think one way would be to find a twitter bot account that's tweeting out non-language-specific humourous content, that has a wide audience who might reply with laughs; discard any tweets that contain real words or just emojis, and the rest send to human labellers
but I think on the balance, it might actually be easier to get humans to provide examples
probably easier to find a group of people and say "how would you express a laugh in response to a funny tweet?". probably much faster and more reliable than to scrape data off twitter and label it
shadow quiver
@marble jasper I see. These are good points. Thanks. But you know, just like labeling named entities on the text and training a model for NER, how can I do this to catch these laughs?
Can I train a character-level network to catch these words? I can find a formal written data and use it for normal words, because I'm sure there won't be any random laughs. And I can collect random laughs from my coworkers, then train a character-level model or something.
There are grammar rules for formal words like in Turkish. E.g. there can't be any successive vowels in a word (of course there are exceptions). Can such model learn these and detect random laughs as "this word doesn't seem to be ensure grammar rules" or something? At least a model that can decide "there are random laughs in this text" would be good, because these laughs can be very important for sentiment analysis problems.
marble jasper
I was thinking just using a dictionary of valid words
and if they aren't in there, then the chance of that word being a laugh is higher
if you're looking at responses to humour, the chance of that word being a laugh is higher
so for both those reasons you should have a bias of leftover words that are laughs, that a human can then label; BUT the human would also need to be knowledgeable about laughs in different languages, at which point you'd have to ask...why don't you just ask that same human to write them out?
this is one of those datasets where labelling might take longer and provide no more information than having a human generate the data in the first place
shadow quiver
@marble jasper Yeah. But you know as this is social media, people don't pay much attention to grammar rules. So any word that doesn't follow grammar rules there is a high chance that it's a normal word just written informal.
Maybe I can calculate the "formality" of each tweet and use them in training. So if a tweet is seem to be negative, but written in an informal way, may be just a chit-chat and may not be that negative. But if it seem to be negatie and is formal, it's probably really in a negative mood. I don't know, it's hard to guess without trying but it may improve the model accuracy.
marble jasper
I feel like you're ignoring all the bits of my reply that is telling you to get a human to provide the dataset directly rather than attempt to work it out
because whatever you do, whatever rules you put in place, you will spend a lot of effort to reduce the number of false positives, but ultimately you will still need a human to make a final judgement about whether these are correct or not. And I am saying that this seems to me that you would get more and better results just asking the human to provide you with a bunch of examples of laughs
go into a discord server, or go on twitter, and ask people to provide examples. immediately you have generated a far higher quality dataset than if you had tried to scrape twitter and reduce the dataset down to something a human can look at and five a final yes/no label to
shadow quiver
Okay I see now. Thank you again for discussion.
 ebon nebula
Hello all. Can someone suggest me a good book teaching mathematics trough Python?
 lapis sequoia
Hi, im very new to Python and got a lot of help making this 3D graph so please don't over estimate my knowledge (~10hrs). I was able to get this 3D scatter plot to work, but i want to add a color bar, same as the colormap, stuck to the side of the interactive figure when viewed. What coding would I have to pass to make that work along side my 'terrain' cmap?
import numpy as np
import matplotlib.pyplot as plt

f = open('wsands_lidar2003_topex_sample100.txt', 'r')

print(f.name)

lat, lon, elev = np.loadtxt('wsands_lidar2003_topex_sample100.txt', unpack=True, usecols=(1, 2, 3))

xlims = [253.55, 253.59]
ylims = [32.885, 33.01]
zlims = [1166, 1169]


def threeaxisgraph(xdata, ydata, zdata, xlabel, ylabel, zlabel):
  fig = plt.figure(figsize=(20, 2.5))
  ax = fig.add_subplot(projection='3d')
  ax.scatter(xdata, ydata, zdata, alpha=0.1, marker='o', c=zdata, cmap='YlOrBr', vmin=1165., vmax=1169., s=1)
  ax.set_xlabel(xlabel, size=20)
  ax.set_ylabel(ylabel, size=20)
  ax.set_zlabel(zlabel, size=20)
  ax.set_xlim(xlims)
  ax.set_ylim(ylims)
  ax.set_zlim(zlims)
  plt.show(threeaxisgraph)


threeaxisgraph(lon, lat, elev, "Longitude", "Latitude", "Elevation")

f.close()
 arctic cliff
Should I always get rid of rows with nan? even if only one column has Nan in it ?
 lone nebula
hey guys uh
im doing datacamp
doing this project
can someone help me with this error
cant figure it out
import numpy as np
# Clean the special case columns
# Changing kB to MB by dividing by 1000
apps['Size'] = apps['Size'].apply(lambda x: str(float(x.replace('k', '')) / 1000) \
                                  if 'k' in x else x)
apps['Size'] = apps['Size'].replace('Varies with device', np.nan)

chars_to_remove = ['+', ',', 'M', '$']
cols_to_clean = ['Installs', 'Size', 'Price']
for col in cols_to_clean:
    # Remove the characters preventing us from converting to numeric
    for char in chars_to_remove:
        apps[col] = apps[col].str.replace(char, '')
    # Convert the column to numeric
apps[col] = pd.to_numeric(apps[col])```the error is this
TypeError                                 Traceback (most recent call last)
<ipython-input-44-341eaa82adae> in <module>
      2 # Clean the special case columns
      3 # Changing kB to MB by dividing by 1000
----> 4 apps['Size'] = apps['Size'].apply(lambda x: str(float(x.replace('k', '')) / 1000) \
      5                                   if 'k' in x else x)
      6 apps['Size'] = apps['Size'].replace('Varies with device', np.nan)

/usr/local/lib/python3.6/dist-packages/pandas/core/series.py in apply(self, func, convert_dtype, args, **kwds)
   3192             else:
   3193                 values = self.astype(object).values
-> 3194                 mapped = lib.map_infer(values, f, convert=convert_dtype)
   3195
   3196         if len(mapped) and isinstance(mapped[0], Series):

pandas/_libs/src/inference.pyx in pandas._libs.lib.map_infer()

<ipython-input-44-341eaa82adae> in <lambda>(x)
      3 # Changing kB to MB by dividing by 1000
      4 apps['Size'] = apps['Size'].apply(lambda x: str(float(x.replace('k', '')) / 1000) \
----> 5                                   if 'k' in x else x)
      6 apps['Size'] = apps['Size'].replace('Varies with device', np.nan)
      7

TypeError: argument of type 'float' is not iterable```nvm fixed
arctic cliff
Doesn't look to be looping
 limpid oak
@arctic cliff try apply method on df
 ocean horizon
Hi everyone. I'm looking for free resources to learn AI programming with Python. I would really appreciate it if you could help me out.
limpid oak
!resources
 arctic wedgeBOT
Resources
The Resources page on our website contains a list of hand-selected learning resources that we regularly recommend to both beginners and experts.
https://pythondiscord.com/pages/resources
ocean horizon
Thank Spidy!
lapis sequoia
anyone know how i could update a subset of rows in my dataframe?
i'd like to update the top section to the bottom section
df.loc[df['APPLICATION_ID']=='AP000156'] = df.loc[df['APPLICATION_ID']=='AP000156'].reindex(idx, fill_value=0)``` doesn't workanyone know
 signal sluice
man data science is hard when ur trying get as much useful data as possible but also store as little data as possible for space but you dont KNOW what data is useful
 uncut shadow
data science is about data, ya know
flat quest
yup thats the dillemma. Though you could figure out which one's are strong predictive features by statistical analysis or empirical observation @signal sluice
 modern canyon
Is there any better way to do this?
alpha_list = []
numeric_list = []
for i in sorted(imdb['primaryTitle'].tolist()):
    if i[0] in string.ascii_letters:
        alpha_list.append(i)
    else:
        numeric_list.append(i)

sorted_list = alpha_list + numeric_list
well you need to reindex the entire df if you want the original one but modified. You're reindexing a subset of it @lapis sequoia
lapis sequoia
i did it in an extremely inefficient way but i'd be curious how to efficiently do it lol
flat quest
you could directly sort the dataframe itself
then select the ones with ascii chacarters and convert that into a alpha list
get the ones without ascii and convert that into a list for the numeric list.
You check for ascii by doing a regex match or just first character match if its guarenteed that a string will either be entirely ascii or it won't. @modern canyon
modern canyon
I read your answer three times, but I still couldn't figure out how your approach is different than mine.
flat quest
well to do it more efficiently, you could just copy the top values into a temporary variable.
Then do
tmp = df.loc[bottom section]

df.loc[bottomsection] = df.loc[uppersection]
df.loc[uppersection] = tmp
@lapis sequoia
it gets rid of the for loops since ur using vectorized pandas methods
pandas has a built in sorting function for df's
lapis sequoia
oh ok, the problem is i had to do that inside a for loop which is what i had trouble with
but yeah i see how i could apply this in a for loop
thank you
flat quest
you wouldnt necesarrily have to do it in a for loop.
just get the indices or boolean array that match the upper section. Just get the app_ids that equal AP000156.
If its the case that you're trying to move specific values dispersed all throughout the df into the upper region you could just do
upper = df.loc[bool array]
lower = df.loc[~bool ar]

joined = upper.append(lower).reset_index()
then select the ones with ascii chacarters and convert that into a alpha list
@flat quest how do I "select"? .apply, .filter, .where?
i'm asking because idk how they work internally
does all of these use vectorized operations?
lapis sequoia
i am trying to use numba in my code, can anyone help me out a bit?
code works for a few lines
and shows output
but it shows no output when i use more than 1000 lines
flat quest
any one of those will work
There's also a number of str operations available. if you df[col].str that you could possibly use.
Well they're much more vectorized than python for loops, as they're all coded in C++. Apply and filter will be slower than any boolean condition
Such as df[col].str.contains([chars]) @modern canyon
signal sluice
oh yeah drag
most of my data is categorical
which im not altogether too familiar with tbh
should probably look at some stats resources for categorical data
uncut shadow
@lapis sequoia provide some code or errors
flat quest
yeah
look into one hot encoding and label encoding @signal sluice
And brush up on terms like cardinality, ordinal data, and so forth. A basic statistics knowledge won't hurt 😉
 desert oar
does anyone know if pandas has any plans to add native list/array type columns in upcoming versions?
 last agate
Any body know of any good recourses on pathfinding algorithms?
 wanton anchor
Anyone know of any good Tensorflow tutorials?
 silk knot
!paste
alright
this piece of code
results in
but I need the ''rows'' array to be the vertical ones to the left
actually, just realised it's irrelevant for the end result
desert oar
@silk knot in general you can make a column the "index" (the stuff on the left) with DataFrame.set_index()
silk knot
where should I put that? line 48?
silk knot
pd.DataFrame.set_index(rows) doesn't really work for me right now
TypeError: set_index() missing 1 required positional argument: 'keys'
 frank bone
How would you go about grouping similar values (say +- 10% within a pandas df columns, mostly in dfs with 50ish entries and 2-3 such similar value pairs?
 hoary flint
frank bone
hoary flint
frank bone
Thanks! Looking into it 😄
desert oar
@silk knot i still don't know what your code does, does rows represent a single Series?
lapis sequoia
do i need to transform my data into a normal distribution if i want to calculate the +/- 1 standard deviation from the mean if my mean is 0.40, standard deviation is 1.25, and min value is 0?
it's heavily skewed right
desert oar
standard deviation is always valid to compute
whether it's useful or relevant to your problem is another story
lapis sequoia
median is 0 btw*
i see
so if i want to label something as low frequency or high frequency, given those values above, you think it'd be best to transform the skewed data and then label low/high frequency based on transformed values?
silk knot
rows are mass, like g/mol values
But I got alot of help with writing the code but as I understand it, those values are saved in 'rows'
desert oar
@lapis sequoia maybe. another option would be to use above/below median
since then 50% of the data is "high" and 50% is "low"
so "rows" is a list/array/series of numbers? @silk knot
silk knot
Yes
desert oar
ok, i recommend using a more descriptive name like mass
lapis sequoia
thanks
desert oar
then you can assign it as a column to your dataframe data['mass'] = mass
and then you can do data.set_index('mass') once you've created the 'mass' column as per above
silk knot
yea you are right, that would be better
im gonna give it a go
Didn't really workout, but Im gonna have to go to bed now, really appreciate your help tho!
the mass doesn't affect the PCA, or so I think, so its fine really.
ty very much tho
 waxen inlet
What do you guys reccomend for getting into data science?
 marsh berry
Anyone know how I can skip every 4th row in pandas?
@waxen inlet I recommend learning the Scipy libraries
 velvet thorn
@marsh berry
you can do this:
subset = s[s.index % 4 != 3]
subset.groupby(subset.index // 4).mean()
@velvet thorn Thank you so much! What I am trying to achieve is this: How can I get the mean of every 3 rows skipping the 4th row in pandas? So like get the mean of rows 1,2,3 then skip row 4 and then get the mean of 5,6,7 and skip 8 and so forth
velvet thorn
where s is the Series that you want to apply that transformation to
>>> s = pd.Series(range(12))                                                                      >>> subset = s[s.index % 4 != 3]                                                                  >>> subset.groupby(subset.index // 4).mean()                                                      0    1
1    5
2    9
...because (0 + 1 + 2) / 3 is 1, (4 + 5 + 6) / 3 is 5 and (8 + 9 + 10) / 3 is 9
yes
marsh berry
Thank you so much! And is this also possible to apply to a dataframe? Like its basically similar data just with multiple columns. And technically each column is considered a series right?
desert oar
@marsh berry are these dates or something?
but yes this subset groupby thing is probably best in the absence of additional information
marsh berry
@desert oar Nah they're UV absorbance values
The entire dataset looks like this
I was trying to figure out how to skip every fourth row and get the mean of the first three
@velvet thorn Thank you btw!
desert oar
note that if your index isn't integers it won't work
marsh berry
Yeah my indices are ints like this
desert oar
ok
in general you can do something like np.arange(data.shape[0]) instead of data.index
if for example you are using strings or something else as index values
velvet thorn
if your index isn't an integer you can use an iterable of the same shape
desert oar
i think there's some double subsetting going on
marsh berry
Did I do something wrong in this
desert oar
your index starts at 1 not 0
so make that (df.index - 1) % 4
oh
and they arent sequential integers
or are they?
either way if they start at 1 you will be off by 1
velvet thorn
incidentally, you can check if it's a sequential index
desert oar
@velvet thorn is there some magic pandas method for this? or do you have some math trick in mind
you can check if it's a RangeIndex of course
but that doesn't necessarily cover all cases
velvet thorn
ye, that's what I meant
like
that is the case in which you can be sure it's sequential
but if it's like an Int64Index or something
then I think you need the manual approach
 slate scroll
Couldn't you just do something like df.index.values() == list(range(df.shape[0]))? Or are there performance concerns with dataset size/etc.
velvet thorn
in general you can do something like
np.arange(data.shape[0])instead ofdata.index
@desert oar basically this?
like
the thing is
if you're not sure whether the index is sequential
you might as well just groupby a separate array
desert oar
yeah i would just do the arange thing in most cases
velvet thorn
because you would have to do that anyway if the index wasn't sequential
desert oar
im very frequently subsetting and slicing such that the index is non sequential
right
i lean heavily on indexes in pandas
slate scroll
I also use this heavily: https://pandas.pydata.org/pandas-docs/stable/reference/api/pandas.DataFrame.reset_index.html
desert oar
i try to avoid it tbh
feels like an anti pattern sometimes
i wish groupby didnt automatically create an index for example
slate scroll
Really, how so?
desert oar
its just inelegant i guess
as for groupby, sometimes i want the group value as the index and sometimes i dont
slate scroll
I find it's the clearest way to switch back to a range index
slate scroll
I typically find myself say, joining so I need to set a column as an index, then I need a range index for sorting etc so I reset it
desert oar
again, i tend to depend heavily on indexes so i dont like to reset them
slate scroll
I use it when I want to switch from a manual index back to a range index.
desert oar
yeah but how often do you need range index
slate scroll
Pretty often, they're useful for sorting and ordering things which I do lots of.
slate scroll
Business logic might be, "I want a TV show with x category in slots 3-6, and 7-11. If one isn't in those spots, move the next one up"
desert oar
so the index represents TV show ordering
slate scroll
Yep.
slate scroll
Might be a bit of a niche problem I can see that but I do find myself using it.
desert oar
im almost always carrying around things like 'customer_id'
which as you can imagine i do not want to lose track of
especially when i have customer_id, account_id, agent_id, et multa alia
slate scroll
Right so that's where I'll set my id to the index for joining, but then reset it to do reordering
 hollow oyster
Hey may I ask a question if I m not interrupting
desert oar
go ahead
hollow oyster
I wanted to ask my X_train, X_test have 181 cols while training the model so does that mean if I have to deploy it on flask I need to take 181 inputs from the user?
desert oar
flask is for handling HTTP requests
velvet thorn
uh.
desert oar
so if you want them to do it via a website or web API, then yes flask is one way to do it
velvet thorn
that would depend on what those columns are...
desert oar
if the "user" is a machine that seems easy enough
i have built apps like this for example where the input is a json array of dicts
slate scroll
In case anyone else is unaware, I 💟 this for adding an API on top of models https://www.tensorflow.org/tfx/serving/api_rest

TensorFlow
desert oar
that array of dicts becomes a pandas data frame
we do data processing on said data frame
then pass that along to the ML stuff
but yeah there are lots of tools to build APIs automatically
however i will generally take umbrage at most uses of the term "REST" w/ respect to a deployed model..
hollow oyster
👍🏻
slate scroll
Right, but I agree most are not. But that one is beautiful. Gives you a built in gRPC server as well.
desert oar
yeah this is very complete
slate scroll
All written in C too, very performant
desert oar
its slick enough to make me want to use TF at work just for the convenience of having this
although its likely we are switching to MLFlow for "deployment" anyway
slate scroll
We evaluated MLFlow and decided against it in favor or Kubeflow + KFServing (which includes the above). What about MLFlow made your $job wannt to use it?
desert oar
Databricks integration
slate scroll
Ahh luckily a need we don't share.
desert oar
fwiw i think databricks has saved us a huge amount of overhead in maintaining a hadoop cluster just for spark
nobody was using hadoop for anything else
slate scroll
we use dataproc on google cloud for the same thing
desert oar
that said, there are definitely people here who just love throwing money at microsoft
it doesnt affect me either way, i stay far far away from those databricks notebooks
databricks-connect is at least as good as livy if not better
and there is a nice suite of CLI utilities for interacting with databricks and DBFS, which acts more or less the same as HDFS
plus it also has lots of integration w/ other azure things like ADLS
which we depend on heavily
slate scroll
Yeah I like how EMR and GCP dataproc get native HDFS access to S3/GCS respectively.
desert oar
not to mention spark itself
yep basically the same idea
we are an azure shop more or less
slate scroll
Interesting, I've done a few years in AWS and am now in GCP but never touched Azure (aside from their Klingon translation API)
desert oar
i think the killer feature for azure (for enterprise) is that everything integrates with active directory
so you can e.g. link your databricks account to your active directory account
SSO everywhere
very easy for the user
more secure for the org
slate scroll
Yeah similarly we have G-Suite which integrates with GCP
desert oar
yep makes sense
do your people manage k8s in house?
ive heard that can be quite involved
for context, i try to stay away from IT and devops/MLops
slate scroll
Yes we do. It's really not bad. I do most of the management for my team of 8 devs. It has a learning curve.
desert oar
(but it matters to me quite a bit when it comes to the team's workflow, reproducibility, sharing/collaboration ability, etc)
good to know
i'll keep it in mind for if/when i move to a smaller org again
slate scroll
Yeah I love process improvement so I like doing CI/CD, devops, etc.
desert oar
yeah i like process improvement but on the data science side
i really dont want to care about deployment
and i try to avoid caring as much as i can 😛
slate scroll
Ahhh yeah so my group is applied ML, so most of our process is around building (and deploying) applications.
desert oar
i see. yeah im much more concerned with making sure i can use my colleagues' code
than i am with making sure Joe in underwriting has a web interface for getting model predictions
slate scroll
Yeah our products are 95% APIs which are integrated into products to provide inference for users
desert oar
yeah i wish we had a team like yours
i've built dashboards etc before i just really dont want to support it in production
so much extra work that isn't getting my work done
slate scroll
Yeah our group split out of a group like that
desert oar
"Dear VP, please find attached a discussion I had with a guy on the internet, who supports my idea that we need to hire more qualified ML dev people. Best, salt rock."
sounds good right?
slate scroll
Getting our group formed was not clean. It took a sr. exec threatening to leave since their work wasn't being integrated into products. They were given a mandate to start a group to prove we could do it. Now 2 years later we're growing.
slate scroll
I do, It's definitely rewarding.
 fleet moth
Hello Everybody. I try to get a grouped BarChart with Matplotlib and pandas as annoted here: https://matplotlib.org/3.3.0/gallery/lines_bars_and_markers/barchart.html#sphx-glr-gallery-lines-bars-and-markers-barchart-py
my code: ```py
class StatisticDialog:
def init(self):
self.labels = []
self.score = []
self.x = 0
self.width = 0.38
self.db = OctopusDB()
def create_graph(self):
    datas = self.db.select().to_numpy()
    x = np.arange(len(self.labels))
    fig, ax = plt.subplots()

    for data in datas:
        self.labels.append(f"{data[0]}: {data[1]}")
        self.labels = list(dict.fromkeys(self.labels))
        self.score = list(dict.fromkeys(self.score))

    for i in self.labels:
        for s in self.score:
            ax.bar(x - self.width / 2, s, self.width, label=i)


    ax.set_ylabel("Temps d'interruption")
    ax.set_title("Interruption en temps et priorité")
    ax.set_xticklabels(self.labels)
    ax.legend()

    fig.tight_layout()
    plt.show()
my error: No handles with labels found to put in legend. QCoreApplication::exec: The event loop is already running
and the visual result:
can you help me to find the error why my code doesn't build bar chart ?
 south wedge
can some one help to build my own model in machine learning without using sklearn or tensorflow?
 winter barn
Whats the fastest way to jump into ML/AI
 untold aspen
can some one help to build my own model in machine learning without using sklearn or tensorflow?
@south wedge that's feasible using standard libs such as numpy and such but why would you do that?TF is used so much for ML because it leverages the use of tensors which is the perfect data type for dealing with n-dim data which ML models encounter all the time. You can build your own model in TF by using tensor placeholders, variables, and such.
south wedge
but i need to learn how to program my own programs without using any others.
untold aspen
You can even pick apart pre-existing models in TF libs and change it in your way by overwriting some functions in the models (due to them being Python classes at the very low level)
If you want to try to implement it without TF then perhaps audit some courses by Andrew Ng on Coursera
He's got notebooks that teaches you to build those ML models from just Numpy
and some other standard libs
south wedge
Thanks
tidal bough
some simple ML algorithms can be implemented yourself indeed; check out gradient descent, linear regression by directly solving the matrix equation, and NN backpropagation.
untold aspen
i can help later if you struggle but just check those out cus Andrew Ng's courses are pretty nuanced
oh about implementing them with raw python codecademy premium course on ML is perfect
south wedge
is cousera free or paid?
untold aspen
free for audit
paid for if you want to get that certif
Codeacademy's course on ML is interactive
and it's basically you program the ML algos yourself (guided by instructions)
south wedge
im trying to build my own AI system better if you can join my project.
untold aspen
and then after that you use the API
I'm happy to help
Tell me more about it via PM
south wedge
PM?
untold aspen
nah don't need a serv if only 2 ppl chatting
click on my profile and copy my name+tag
then go to your home and go add friend
copy and paste to find me
frank bone
does anyone have experience with isolation forest and streaming data? my question is on performance let's say I want a sliding window (30 days) and i want to omit the last and add the newst but dont want to retrain all 30 days...since ill have hundreds of thousands if not millions of trainings
is it possible? is there reference code for this? couldnt find anything usable so far. It concerns time series data
untold aspen
Whats the fastest way to jump into ML/AI
@winter barn I highly rec Codecademy courses. They're great for starters who need interactive learning.
 vivid idol
Hello everyone, is the right place to ask questions for python coding related to data science?
tidal bough
Presumably 🙂
last agate
Any body know of any good recourses for pathfinding algorithms?
frank bone
How do I avoid list within list when using csv module & csv.reader?
tried to make an empty list first and then use list.extend(csv.reader(file)) but it ends up putting a list into my list when I just want the elements
untold aspen
Hello everyone, is the right place to ask questions for python coding related to data science?
@vivid idol well it's #data-science-and-ml so you're in the right place buddy
How do I avoid list within list when using csv module & csv.reader?
@frank bone what does the csv file contain? if it's something to make into a dataframe then pandas.csv_reader(file) is perfect
otherwise csv_reader is still good
frank bone
i just want 1 row with data as follows: 1,2,3,4,5,6,7,8,9 in a simple array
untold aspen
for row in that csv.reader object: list.append(row)
it's inspired from the first example on the csv doc
frank bone
worked thank you 🙂
untold aspen
np
frank bone
@untold aspen is it possible to get a specific subset of such an array without calling it with elements number like [0:5] but with ["string1":"string2"] doesnt work
untold aspen
oh so you don't wanna use indices? smth like that?
frank bone
yeah call by elements, list is filled with dates
and then i want to get a list of dates from date1 to date2
untold aspen
use datetime lib
frank bone
currently my dates are strings and not datetimes
does such a thing work with strings?
untold aspen
what format is it in
frank bone
"yyyy-mm-dd"
untold aspen
strptime() from datetime is how to convert it to datetime obj
basically pass in a placeholder kind of string indicating your datetime format, and the string itself
frank bone
list_dates.extend(datetime.strptime(str(row), '%Y-%m-%d'))
.......,'2019-02-22']" does not match format '%Y-%m-%d'
what did i do wrong? 😄
untold aspen
what's the error raised?
frank bone
raise ValueError ("time data %r does not match format %r
row is like this
row = ['yyyy-mm-dd', 'yyyy-mm-dd', 'yyyy-mm-dd', etc]
frank bone
figured it out works like this list_dates.extend(datetime.strptime(str(row), '%Y-%m-%d').date() for row in row)
untold aspen
nice
silk knot
ValueError: The number of observations cannot be determined on an empty distance matrix. I can't figure out why this ValueError comes up.
from pyteomics import mzxml, auxiliary
from os import listdir
import matplotlib.pyplot as plt
import pandas as pd
import numpy as np
from sklearn.decomposition import PCA
from sklearn import preprocessing
from scipy.cluster import hierarchy
import scipy
from scipy.cluster.hierarchy import dendrogram, linkage
from scipy.cluster.hierarchy import fcluster
from scipy.cluster.hierarchy import cophenet

import plotly.figure_factory as ff


vert = {}
columns_1 = []

fileNum = 1
for file in listdir("./mzxml_files"):
  columns_1.append(file)
  lijst = []
  with mzxml.read(f"./mzxml_files/{file}/1/1SLin/analysis.mzxml") as reader:
    lijst.append(next(reader))
  # print(list[0]["intensity array"])
  i = 0
  for number in lijst[0]["m/z array"]:
    if number not in vert:
      vert[number] = []
    vert[number].append(lijst[0]["intensity array"][i])
    i+=1
  for item in vert:
    if len(vert[item]) != fileNum:
      vert[item].append(0)
  fileNum+=1

rows = []
data = []


for item in vert:
  rows.append(item)
  data.append(vert[item])

f = open("output.txt", "w")

f.write("\t\t   " + " ".join(columns_1) + "\n")

for i in range(0, len(rows)):
    f.write(f"{rows[i]} : {data[i]} \n")

data = pd.DataFrame.from_dict(dict(zip(columns_1, data)))
print(data.head())

X = data.loc[:'0:36']

fig = ff.create_dendrogram(X)
fig.update_layout(width=800, height=500)
fig.show()
nice
@untold aspen now that i have a datetime array, how do i go about specifying a range to print?
ie. date1 to (and including) date2
as easy as list[datetime1:datetime2]?
untold aspen
i think you should make them into timestamps and then order it from there
frank bone
so in the end the timestamps will work when trying to call a range within list?
list[timestamp1:timestamp2]?
untold aspen
no im just suggesting that you use timestamps to try ordering the dates
by convention lists uses indices
frank bone
im trying to avoid calling by index like [0:5]
untold aspen
probably make a dictionary?
frank bone
since the indices are dynamically changing all the time
untold aspen
make the key = datetime string that has keys values = index
that way if you call dict["DATETIME STRING"] = index
so i guess we can do list[dict["datetime_string_1"]:dict["datetime_string_2"]]
frank bone
ill try that
untold aspen
what do you mean by dynamically changing indices? you're gonna add more dates on?
untold aspen
well i thought if you append then indices don't change?
frank bone
and im using the datetime range to train a sliding window for isolation forest
untold aspen
indices shouldn't change if you append more to list
unless you're adding something inbetween existing ones
in that case use .index('datetime_string')
on your list of streaming data
that will search through your list for that datetime and return the index
so you don't have to worry about indices changing
 acoustic halo
Whats the best way to ensemble neural nets? Concatenate them at the last hidden layer before softmax or taking their individual softmax outputs and weighting them?
frank bone
in that case use .index('datetime_string')
@untold aspen we still talking about dict here? having difficulty getting a range within dict printed
untold aspen
.index() is applied on your list of datetime strings
frank bone
yes but what the data type? pd np array, dict list?
untold aspen
list
frank bone
so your idea is to create just a list with my data as index then print index range?
to get range
sorry if i got it completely wrong, im new 🙂
still trying with dict rn
so i guess we can do list[dict["datetime_string_1"]:dict["datetime_string_2"]]
@untold aspen i got a dict with key=dates and im doingprint(list_dates['dates'["yyyy-mm-dd"]:'dates'["yyyy-mm-dd"]])but that doesnt work
untold aspen
ok so basically the dictionary has keys = string of datetimes and the corresponding values = index of that datetime string on the list_dates
 silk forge
i need help with sklearn.compose.ColumnTransformer()
encoder = make_column_transformer(
    (LabelEncoder(),["Embarked"])
    #(LabelEncoder(),["Sex"])

,remainder="passthrough")

newtrainx = pd.DataFrame(imputer.fit_transform(trainx),columns=train_data.drop("Survived",axis=1).columns)
print(encoder.fit_transform(newtrainx))
to get that index you use list_dates.index("string you wanted to find")
@frank bone
silk forge
my LabelEncoder() isn't working when i put it inside the column transformer
TypeError: fit_transform() takes 2 positional arguments but 3 were given
@untold aspen i got a dict with key=dates and im doing
print(list_dates['dates'["yyyy-mm-dd"]:'dates'["yyyy-mm-dd"]])but that doesnt work
@frank bone 'dates' is interpreted as a string and not a dict
frank bone
when i write dates it days name dates is not defined
 elder vault
I'm trying to send a simple search request to ES but I'm getting all these errors: https://bpa.st/Z52Q
and each block of errors ends with ssl.SSLError: [SSL: WRONG_VERSION_NUMBER] wrong version number (_ssl.c:1123) what am i doing wrong?
untold aspen
@frank bone you create a defaultdict() that allows you to add more key value pairs
dict_date_index = defaultdict()
for datetime_string in list_dates:
    dict_date_index[datetime_string] = list_dates.index(datetime_string)
ill just do it with pandas dataframe, setting dates as index and column 0 at same time, then using tolist() into a variable
untold aspen
yea or that
frank bone
seems easier rn 😄
untold aspen
ok then that's good
frank bone
thanks for the help
untold aspen
np
encoder = make_column_transformer(
    (LabelEncoder(),["Embarked"])
    #(LabelEncoder(),["Sex"])

,remainder="passthrough")

newtrainx = pd.DataFrame(imputer.fit_transform(trainx),columns=train_data.drop("Survived",axis=1).columns)
print(encoder.fit_transform(newtrainx))
@silk forge shouldn't newtrainx be an np array?
silk forge
it should work with dataframe too
untold aspen
that's what it is in the ColumnTransformers doc
try making it an np array
it prob got interpreted as two args in the dataframe
elder vault
I'm trying to send a simple search request to ES but I'm getting all these errors: https://bpa.st/Z52Q
and each block of errors ends with ssl.SSLError: [SSL: WRONG_VERSION_NUMBER] wrong version number (_ssl.c:1123) what am i doing wrong?
@elder vault anyone?
arctic cliff
I'm trying to get the name of the city that has the most population
untold aspen
I'm trying to get the name of the city that has the most population
@arctic cliff try a simple for loop for if population = max then return the name
arctic cliff
Oh
Thanks !
df['city'][df['population_total'].argmax()]
What if I wanna get the whole row ?
@arctic cliff try a simple for loop for if population = max then return the name
@untold aspen Oh
This helps too !
untold aspen
df['city'][df['population_total'].argmax()]
@arctic cliff that's more succinct
arctic cliff
Can't I specify the whole row instead of city ?
I tried to type : but It didn't work :/
Oh
Got it
iloc
 broken sparrow
Can somebody please help me with this? I don't understand the error I'm making.
marble jasper
your error is in the line above
possibly unmatched brackets
I can't see the rest of that line however, but check your brackets are corret at the end of the line
broken sparrow
Yup it was the brackets 😅
Thank you so much @marble jasper
broken sparrow
@lapis sequoia I have zero background in CS and I'm learning online😅
Do I just omit pd.index or give some other command instead?
lapis sequoia
Just omit and pass the list as argument
broken sparrow
Thank you!
 visual violet
are you guys data scientist?
lapis sequoia
I'm a second year undergrad lmao
visual violet
wow nice
lapis sequoia
I'm trying to print out the cute_name for the profile
And here is the error:
Exception has occurred: TypeError
list indices must be integers or slices, not str
And here is the code:
@skyblock.command()
    async def profiles(self, ctx, *, uuid: str):
        await ctx.message.delete()
        url = f"https://api.hypixel.net/skyblock/profiles?key={config['hypixelapi']}&uuid={uuid}"
        async with request("GET", url) as response:
            if response.status == 200:
                data = await response.json()
                profiles = data["profiles"]
                cute_name = profiles["cute_name"]

                for profile in cute_name:
                    print(profile)

            elif response.status == 400:
                print(f"API Returned {response.status}\nBad Request 400")
            else:
                print(f"API Returned {response.status} status.")
I feel like an example is needed for this but I'm not sure so I will show you the date I'm trying to get my hands on:
DESCRIPTION: under success you see profiles and that is actually a list not a dict.
https://imgur.com/a/GqlKc9E
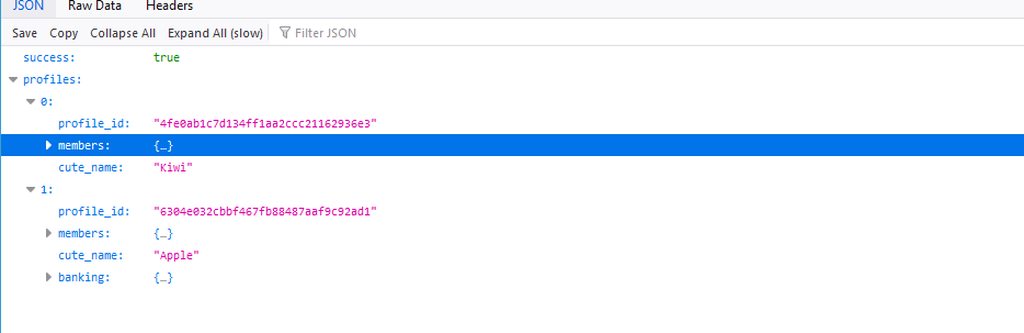
profiles is a list i guess, you're indexing it with a string
it's not clear what you're aiming for here but you can try type conversion of profile if you expect it to be a dictionary
frank bone
anyone familiar with isolation forest? i cant figure out how to get an anomaly score for a single row/colum value instead of the whole dataframe
trying to save some computations..
on streaming data i only want the score for the current day, not the whole data frame in the past
uncut shadow
@lapis sequoia like a user above said, profiles is probably a list. Also, you'd probably get better answer if u asked your question in #discord-bots or #networks (both can technically be good, but not data science lol)
 earnest wadi
         [[node sequential/embedding/embedding_lookup (defined at c:/Users/Silv3/OneDrive/Desktop/datasetup/datasetup/hillbilly.py:71) ]] [Op:__inference_train_function_995]

Errors may have originated from an input operation.
Input Source operations connected to node sequential/embedding/embedding_lookup:
 sequential/embedding/embedding_lookup/691 (defined at C:\Python38\lib\contextlib.py:113)

Function call stack:
train_function```

not sure whats going on here@earnest wadi you probably specified your embedding layer to have not enough input dim to cover the actual input
i read that from here
earnest wadi
alright that what i read online
but thats jiberish to me
can you simplify it?
becuase i dont really ujderstand
earnest wadi
model = keras.Sequential()
model.add(keras.layers.Embedding(vocab_size, 16))
model.add(keras.layers.GlobalAveragePooling1D())
model.add(keras.layers.Dense(32, activation=tf.nn.relu))
model.add(keras.layers.Dense(64, activation=tf.nn.relu))
model.add(keras.layers.Dense(32, activation=tf.nn.relu))
model.add(keras.layers.Dense(33, activation=tf.nn.sigmoid))
thats my model
do I need to change any order or values @untold aspen
untold aspen
right so embedding layer takes on 3 non-default values
input dim, output dim, and input length
earnest wadi
okay
untold aspen
wait no sry
untold aspen
input length is None by default
earnest wadi
okay
earnest wadi
835
as it says in the error
the dims are
(100, 33) for train data, labels and test data, labels
untold aspen
so 100 training samples and 33 testing samples?
untold aspen
then what's that 33
untold aspen
(100, 33) for train data, labels and test data, labels
@earnest wadi
earnest wadi
yeah i know
acoustic halo
You didn't specify input dimension in the first layer
acoustic halo
Fir example this is my first layer in an old model
model.add(Embedding(2000, 24, input_length=1000))
Where the input is a sequence of 1000 words
untold aspen
doesn't python ignore the input length if you don't specify names?
earnest wadi
letters
earnest wadi
so what do I need to do / change
acoustic halo
Embedding needs it if you plan on using dense layers on top
acoustic halo
yeah
acoustic halo
Have you already converted the text to numerical values?
earnest wadi
yes
acoustic halo
You probably have a value that is higher than 835
earnest wadi
yes i do
acoustic halo
somewhere in the data
untold aspen
try that value in the error
untold aspen
972
acoustic halo
It is trying to look up 972 but there are only 835 possible values
untold aspen
ok try that then
arctic wedgeBOT
Hey @earnest wadi!
Uh-oh! It looks like your message got zapped by our spam filter. We currently don't allow .txt attachments, so here are some tips to help you travel safely:
• If you attempted to send a message longer than 2000 characters, try shortening your message to fit within the character limit or use a pasting service (see below)
• If you tried to show someone your code, you can use codeblocks
(run !code-blocks in #bot-commands for more information) or use a pasting service like:
untold aspen
how many unique vocabs are in your sentences?
untold aspen
what did you do
untold aspen
ok prob vocabs then
earnest wadi
why is my loss so frikin low -6956908.0000
i havent optimized the dataset yet, so I know why the rest isnt finished
but thats really low
untold aspen
what loss are you using
earnest wadi
binary cross
acoustic halo
How many different labels do you have? It is usually when you have more than 2 labels by mistake
untold aspen
oh it's probably cuz of the 1-y term
so if it's y=2 it goes neg
@earnest wadi you should also do 0 and 1 for next time
untold aspen
ok now that's weird
earnest wadi
sike nvm, my net just pranked me
uh
i got this...
[[   4.    5.    6. ...    0.    0.    0.]
 [   4.    5.   14. ...    0.    0.    0.]
 [  22.   23.    5. ...    0.    0.    0.]
 ...
 [1080.   32.    5. ...    0.    0.    0.]
 [  89.    5.   25. ...    0.    0.    0.]
[ 448. 59. 76. ... 0. 0. 0.]]```it shouldnt be that
uh
what
untold aspen
yea i saw ppl said they got big negative loss using BCE
it's something with not labelling your target as 0 or 1 for binary classif problem
depends on your task
earnest wadi
my labels are = data
have I done this right:
train_data, train_labels, test_data, test_labels = ds.import_data("Pickup Lines - Insults")
return train_data, train_labels, test_data, test_labels
is that correct? because before I return the data, they all work
 autumn veldt
Excuse me sir, do u know this problem? im tryin to train some dataset with method GLCM + SVM using colab. why i keep getting the same accuracy when i try to run on 5 epoch?
earnest wadi
0 errors now, but this, clearly isnt normal
4/4 [==============================] - 0s 1ms/step - loss: 0.6922 - acc: 0.0000e+00
Epoch 2/10
4/4 [==============================] - 0s 1ms/step - loss: 0.6893 - acc: 0.0000e+00
Epoch 3/10
4/4 [==============================] - 0s 1000us/step - loss: 0.6860 - acc: 0.0000e+00
Epoch 4/10
4/4 [==============================] - 0s 2ms/step - loss: 0.6822 - acc: 0.0000e+00
Epoch 5/10
4/4 [==============================] - 0s 1ms/step - loss: 0.6777 - acc: 0.0000e+00
Epoch 6/10
4/4 [==============================] - 0s 1ms/step - loss: 0.6724 - acc: 0.0000e+00
Epoch 7/10
4/4 [==============================] - 0s 1ms/step - loss: 0.6662 - acc: 0.0000e+00
Epoch 8/10
4/4 [==============================] - 0s 750us/step - loss: 0.6589 - acc: 0.0000e+00
Epoch 9/10
4/4 [==============================] - 0s 1ms/step - loss: 0.6504 - acc: 0.0000e+00
Epoch 10/10
4/4 [==============================] - 0s 750us/step - loss: 0.6405 - acc: 0.0000e+00
4/4 [==============================] - 0s 750us/step - loss: 0.6326 - acc: 0.0000e+00```is it because of the super small dataset?
untold aspen
100 samples
untold aspen
with a fairly deep net
untold aspen
i think it should be in the thousands
acoustic halo
@autumn veldt You call .fit() every epoch which resets the model
untold aspen
im more concerned with the 0% accuracy
earnest wadi
yeah
acoustic halo
Plus you don't need to run it multiple times in a loop like tha
autumn veldt
@acoustic halo so what should i do? should i put fit() on top before def run_test?, im just tryin to get some accuracy with 5 epoch
untold aspen
@earnest wadi try using a bigger dataset for this or remove some dense layers
earnest wadi
there is only on dl now
still 0%
ill find a bigger one
i really wanted to do a dad joke generate
whats the best way to find a huge set od dad jokes
untold aspen
reddit is nice
untold aspen
source of dankness
earnest wadi
haha
untold aspen
but yea web scrape for them
acoustic halo
@autumn veldt You don't use epochs at all, the model will iterate until it is finished, the most you can do is specify the max iterations, but that would likely get you a worse accuracy
acoustic halo
it's an sklearn model so no
autumn veldt
yea, im using sklrean not TF
autumn veldt
@acoustic halo sorry sir, but where and how can i put that 'max iterations'?
when i want to get more than 1 accuracy
acoustic halo
YOu can't get more than 1 accuracy
1 is 100%
but its svm.SVC(maxiter=n) I think
Also you will get worse accuracy if you use it because it won't run as many, by default it rins infinite times until convergance
autumn veldt
uhm... do u have any link that i can learn about this one sir?
acoustic halo
Which bit?
autumn veldt
im kinda dont understand
desert oar
Read the scikit learn user guide
autumn veldt
about testing running on dataset until i can get the most accurate of accuracy score
acoustic halo
Okay, here's the simple low-down on sklearn models: You don't use epochs like neural nets, they will run as many as needed to get the the best results with the given parameters, so you only need to use fit once
untold aspen
SVM stops when it gets the best result
autumn veldt
okay
untold aspen
so yea in your code remove that for loop
 still delta
Hello guys I am junior in AI and I am seek for a group of people to work with them
earnest wadi
@untold aspen how can I print a vlue in a for loop every 10 iters?
desert oar
Dont tag random people who happen to seem knowledgeable. It's intrusive to the person
desert oar
Ok i missed that
desert oar
My apologies
desert oar
To answer your question, use the enumerate function
Then you can get the iteration number
untold aspen
print a value for every 10 iteration?
earnest wadi
yes
untold aspen
say in a range of 100
earnest wadi
got that
for submission in ye:
    text = submission.title.rstrip('\n') + " " + submission.selftext.rstrip('\n')
    if "\n" not in text:
        f.write(text+"\n")
f.close()
but i have an int
untold aspen
for i in range(100):
(something here)
if i % 10 == 0:
(print smth)
untold aspen
yea use the divisibility of index
actually it should be range(1,101)
this will make a list of [1,2,...,99,100]
untold aspen
nice
desert oar
for i, submission in enumerate(ye):
    # do things
    if i % 10 == 0:
        print(i)
snokpok, you think 10 000 samples will be enough?
untold aspen
that's pretty good
earnest wadi
ill try that
untold aspen
make sure they're individually fine tho
earnest wadi
yes I know
i have a package for text cleanup
that i made spciffially for datasets
so i can use that
untold aspen
but yea that's really enough for training
frank bone
is it possible to pass variables between 2 functions multiple times?
like FunctionA > FunctionB > FunctionA
at the end of FunctionB im doing "return variable" but how do i take that up in the 3rd step?
acoustic halo
value = FunctionB(parameter)
frank bone
and its a new variable, that gets created in FunctionB, not defined as a FunctionA argument
marsh berry
Without me having to manually enter it for each line that is
frank bone
value = FunctionB(parameter)
@acoustic halo thanks a ton, worked like a charm, sory for noob questions 😄
untold aspen
it only returned 1000 samples
@earnest wadi i think 1000 is manageable if you scale your architecture down
acoustic halo
@marsh berry Some kind of iterable? You would still have to define a bunch of colours, but you would only have to do it one time and just call the iterable in the future
earnest wadi
@untold aspen nah jnust gonna leave it running for 24 hours to collect all the new ones as they release
marsh berry
@acoustic halo Should I just throw it in a list and iterate over it?
Is that the best way to do it?
acoustic halo
I would, I remember doing something similar in the past
marsh berry
@acoustic halo Ok I will definitely do that then. Seems the easiest. Do you know if its possible to create a gradient of colors?
acoustic halo
As in the line is a gradient or to select the colours for your list?
acoustic halo
I would assume so but no idea how
 quasi pivot
Hi I'm new to this discord, I was wondering if this was the appropriate area to ask about my code and how I can make variables that one function returns get called by another function that will use those called variables. I can move elsewhere or show my code if that helps. Thanks!
marsh berry
@quasi pivot Maybe try general
quasi pivot
Ok, thanks!
frank bone
what am i doing wrong? It triggers 1 day after the actual trigger day
model.fit(data[[ticker]].loc[start_date:trade_date_minus])
data.loc[start_date:trade_date, 'Scores']=model.decision_function(data[[ticker]].loc[start_date:trade_date])
data.loc[start_date:trade_date, 'Anomaly']=model.predict(data[[ticker]].loc[start_date:trade_date])
anomalyscore = data['Anomaly].loc[trade_date]
scorevalue = data['Scores'].loc[trade_date]
if anomalyscore == -1 and scorevalue < -0.1:
print("Triggered on", trade_date)```when I change trade_date_minus to trade_date, it triggers on correct day but I don't understand it. Why would the model fitting function influence it? I purposely don't want to model the actual trigger date, as to not increase "scorevalue"
 solemn atlas
Hello I wnt to get started with Machine learning
Do I need to have solid grasp on calculus 😅
acoustic halo
Not really, there are plenty of libraries like sklearn and keras where you just chuck data into a model and watch it work
solemn atlas
Ooo I wnt to build my career as ai programmer
acoustic halo
You should probably understand how it works though if you want a career in it though
untold aspen
@solemn atlas well you need to understand calculus yea
solemn atlas
Of which lvl
untold aspen
AI researchers are much about math
solemn atlas
What all maths area I need to focus on
untold aspen
for beginning u needs to get to basic multivariate
multivariate calc is most of the basic concepts like backprop, loss min
solemn atlas
Ok I will search these things on yt and try to get solid grasp on these
untold aspen
gl
solemn atlas
Ty buddy
frank bone
when I change trade_date_minus to trade_date, it triggers on correct day but I don't understand it. Why would the model fitting function influence it? I purposely don't want to model the actual trigger date, as to not increase "scorevalue"
@frank bone any clue anyone?
lapis sequoia
Guys I'm trying to make a data science discord community for things like kaggle kernel discussions and research paper reading
If youre interested DM me for link
 spark stag
!rule 6 @lapis sequoia please don't advertise your own server
arctic wedgeBOT
6. No spamming or unapproved advertising, including requests for paid work. Open-source projects can be showcased in #show-your-projects.
lapis sequoia
okay
frank bone
when I call FunctionB from FunctionA and FunctionB calls FunctionC, and then FunctionC should return a variable but in extreme cases it can't, how would I go about continuing in FunctionA where I left off?
is there something like a goto in python?
marble jasper
look into exceptions
 pale thunder
ye, either an exception or return some special value
frank bone
maybe its worth noting that all functions are involved in one big iteration
right now im doing if .... = False -> break in FunctionC, which leads me back to FunctionB where it throws an error
because of missing variable
looking into exception
frank bone
alright got it working by returning some 0 values
marble jasper
the purpose of an exception is to provide another route back out, letting you exit all the middle functions without having to explicitly handle a return value
so in FunctionC, you would:
if ... == False:
  raise SomeException("uh oh")
in FunctionB you don't need to put anything, it'll just skip right through, until it hits FunctionA where you have a try/except block:
try:
  FunctionB(...) # run function B here
except SomeException as err:
  print("you did a naughty")
where SomeException is either a valid built-in exception, or one that you made yourself
@frank bone
the whole point of exceptions is to avoid having to deal with special return values indicating errors
frank bone
oh i see! thanks for the explanation. never used this before so i wasnt sure how to do this
marble jasper
it solves exactly your problem, which is why I suggested it
modern canyon
@void anvil https://stackoverflow.com/a/31257931/13993951

Stack Overflow
I'm new to Pandas. I downloaded and installed Anaconda. Then I tried running the following code via the Spyder app:
import pandas as pd
import numpy as np
train = pd.read_csv('/Users/Ben/Documents/
marble jasper
my nan was nice to me, I'm sorry you don't have any
 drifting umbra
wondering if anyone can help decipher this Tensorflow error?
I am trying to use TPUs on Google Colab
RuntimeError: apply_gradients() cannot be called in cross-replica context. Use tf.distribute.Strategy.experimental_run_v2` to enter replica context.
i tried basing my code on this tutorial-
https://colab.research.google.com/github/tensorflow/tpu/blob/master/tools/colab/classification_iris_data_with_keras.ipynb#scrollTo=0tcdTWw1KLiF

but i am doing a regression problem, not classification
desert oar
@void anvil over/under flow
untold aspen
ill just do it with pandas dataframe, setting dates as index and column 0 at same time, then using tolist() into a variable
@frank bone btw i just rmb that .loc on pandas dataframe does what you're trying to do lol
datetimes_df.loc["2017-05-20":"2017-05-30"] works exactly like how you want it, assuming the dates are the rows' names
flat quest
run mdoel.fit outside the with_strategy block @drifting umbra
You only need it to create the model
 severe island
anyone here who has worked on twitter data stream dataset by the archive team?
I have a tar file packed with lots of jsons in many folders
how do i read it
slate scroll
!d tarfile.open
arctic wedgeBOT
tarfile.open(name=None, mode='r', fileobj=None, bufsize=10240, **kwargs)```
Return a [`TarFile`](#tarfile.TarFile "tarfile.TarFile") object for the pathname *name*. For detailed information on [`TarFile`](#tarfile.TarFile "tarfile.TarFile") objects and the keyword arguments that are allowed, see [TarFile Objects](#tarfile-objects).

*mode* has to be a string of the form `'filemode[:compression]'`, it defaults to `'r'`. Here is a full list of mode combinations:

mode

action

`'r' or 'r:*'`

Open for reading with transparent compression (recommended).

`'r:'`

Open for reading exclusively without compression.

`'r:gz'`

Open for reading with gzip compression.

`'r:bz2'`

Open for reading with bzip2 compression.

`'r:xz'`

Open for reading with lzma compression.

`'x'` or `'x:'`

Create a tarfile exclusively without compression. Raise an [`FileExistsError`](exceptions.html#FileExistsError "FileExistsError") exception if it already exists.

`'x:gz'`... [read more](https://docs.python.org/3/library/tarfile.html#tarfile.open)!d json.load
arctic wedgeBOT
json.load(fp, *, cls=None, object_hook=None, parse_float=None, parse_int=None, parse_constant=None, object_pairs_hook=None, **kw)```
Deserialize *fp* (a `.read()`-supporting [text file](../glossary.html#term-text-file) or [binary file](../glossary.html#term-binary-file) containing a JSON document) to a Python object using this [conversion table](#json-to-py-table).

*object\_hook* is an optional function that will be called with the result of any object literal decoded (a [`dict`](stdtypes.html#dict "dict")). The return value of *object\_hook* will be used instead of the [`dict`](stdtypes.html#dict "dict"). This feature can be used to implement custom decoders (e.g. [JSON-RPC](http://www.jsonrpc.org) class hinting).

*object\_pairs\_hook* is an optional function that will be called with the result of any object literal decoded with an ordered list of pairs. The return value of *object\_pairs\_hook* will be used instead of the [`dict`](stdtypes.html#dict "dict"). This feature can be used to implement custom decoders. If *object\_hook* is also defined, the *object\_pairs\_hook* takes priority.... [read more](https://docs.python.org/3/library/json.html#json.load)Those two should get you started in the right direction, although I've never worked with that exact data set.
severe island
the structure looks like ```
| - 01
| | x.json.bz2
| | y.json.bz2
..
..
| - 02
| |x2.json.bz2
| ...
..
..
in the .tar
slate scroll
Ahh so you'll need bz2 also https://docs.python.org/3/library/bz2.html
hard to provide anything more concrete without some example data
drifting umbra
@flat quest thank you!
when I run model fit I now get error stating
Trying to create optimizer slot variable under the scope for tf.distribute.Strategy (<tensorflow.python.distribute.distribute_lib._DefaultDistributionStrategy object at 0x7f9da99775c0>), which is different from the scope used for the original variable (TPUMirroredVariable:{
"Make sure the slot variables are created under the same strategy scope. This may happen if you're restoring from a checkpoint outside the scope"
i am not restoring a checkpoint
just defined this model and loaded csv file from scratch
flat quest
is build model a keras model subclass? @drifting umbra
drifting umbra
@flat quest sorry, am noob
"Make sure the slot variables are created under the same strategy scope. This may happen if you're restoring from a checkpoint outside the scope"
"ValueError: Trying to create optimizer slot variable under the scope for tf.distribute.Strategy (<tensorflow.python.distribute.distribute_lib._DefaultDistributionStrategy object at 0x7f77f87d4438>), which is different from the scope used for the original variable "
drifting umbra
strategy = tf.distribute.experimental.TPUStrategy(resolver)

with strategy.scope():
  model = Sequential()
  model.add(Dense((input_length+1), input_dim=input_length, kernel_initializer='normal', activation='relu'))
  model.add(Dense(hidden_layer_neurons, activation='relu'))
  model.add(Dense(hidden_layer_neurons, activation='relu'))
  model.add(Dense(1, activation='linear'))

  adam = tf.keras.optimizers.Adam(
      learning_rate=0.001,
      beta_1=0.9,
      beta_2=0.999,
      epsilon=1e-07,
      amsgrad=False,
      name="Adam"
      )


  model.compile(loss='mse',
                optimizer=adam,
                metrics=['mse'])
  #['mae', 'mse']
  model.summary()
"Make sure the slot variables are created under the same strategy scope. This may happen if you're restoring from a checkpoint outside the scope"
?
any ideas welcome im dying here
lapis sequoia
Anyone know how to manipulate code to create AI
I mean I know how to retrieve data
But how do I make code which can learn from it
tidal bough
@lapis sequoia Here's a list of recommended reading I just shamelessly copied from the Artificial Intelligence discord server:
MACHINE LEARNING
Before you start specialising in any particular field, it's important to learn the core theory of Machine Learning for a broad exposure to ideas and techniques that you can likely apply to any field.Core
• Bishop - Pattern Recognition and Machine Learning
- Also check out Model-Based Machine Learning by the same author
• Tibshirani, Friedman, Hastie - The Elements of Statistical Learning
• ColumbiaX on edX - Machine LearningSPECIALISATIONS
Computer Vision
• Stanford - CS231n: Convolutional Neural Networks for Visual RecognitionNatural Language Processing
• Stanford - CS224n: Natural Language Processing with Deep LearningReinforcement Learning
• Sutton, Barto - Reinforcement Learning: An Introduction
• Berkeley - CS285: Deep Reinforcement Learning
this course is also awesome as an introduction: https://www.coursera.org/learn/machine-learning
lapis sequoia
I C thenks
 outer fulcrum
Hey guys, I don't understand how operators are working here
This line drops any 'Iris-setosa' rows with a separal width less than 2.5 cm
iris_data = iris_data.loc[(iris_data['class'] != 'Iris-setosa') | (iris_data['sepal_width_cm'] >= 2.5)]
Someone can explain me ?
tidal bough
When you use a logical operator with a Series, you get a series of True/Falses, one for each element.
You can then supply it as the index to get the elements at those locations.
So you can do, say: data = data[data>5] to drop all values that are <=5
In this case, you retain the values that fullfill either of two conditions:
(iris_data['class'] != 'Iris-setosa')
or
(iris_data['sepal_width_cm'] >= 2.5)
(| is the bitwise OR operator, which for Series works elementwise instead).
 serene oar
Hi! I had some trouble with this yesterday, but I didn't get an effective answer.
I'm splitting strings (urls) in a dataframe and then assign each part of the URL path to a different column. Thing is, some urls are shorter, so it produces a lot of "None" values.
How can I avoid that?
new = df["url"].str.split("/", expand = True)

 if str(new[3]):
        df['terto'] = new[3]

```py
Results in:
Name: terto, dtype: object
0 None
1 None
3 modal
4 index
5 edit-modal?id=2713697
I would just like the None to not be there at all, so when I export to csv I can have clean cells.well, wdym?
tidal bough
pandas has a function to drop rows with NaN values, if that's what you want.
uncut shadow
I don't think you can delete those Nones
tidal bough
dropna or something.
serene oar
I don't want to drop the whole row though
uncut shadow
you can only replace them to become NaNs
tidal bough
what do you want to do with them, then?
serene oar
Just so that they are blank.
tidal bough
I mean, a CSV must have a constant number of columns.
serene oar
Because previous columns for that row have values
tidal bough
Just so that they are blank.
replace them with""'s, I suppose
serene oar
And that's a post assignment thing then?
So I do df['blabla'] = new[3] first
and then change the None values to "" afterward?
Because I can imagine cases where maybe it finds a "none" from the url that I wouldn't want to delete.
tidal bough
If that's the case, your only solution is to change the code that puts those Nones in the first place.
serene oar
I haven't had any luck finding solutions online yet.
serene oar
if new[1].empty:
        df['primo'] = ""
    else:
        df['primo'] = new[1]
    if str(new[2]):
        df['secundo'] = new[2]
    if not str(new[3]):
        df['terto'] = new[3]
All of these versions still put None.
 patent ferry
whats the best way to use a multi-pronged approach to machine-learning, i.e using multiple csvs?
tidal bough
CSVs?
anyway, both PyTorch and Tensorflow support parallelizing the computations.
Like with other things, TF allows fine control over what exactly is done where, whereas PyTorch is far easier 🙂
patent ferry
sorry im noob, i use csvs being used as im googling around
ah ok thanks, i will have to do some more googling
tidal bough
still don't know what you mean by "csvs"
patent ferry
csv files
tidal bough
ah, so feeding it data from many sources at the same time? yeah, probably possible in both.
patent ferry
yeah i just feel like my data is too complicated to put in one csv file, so trying to figure out how to deal with that
 thin terrace
Anyone can recommend a simple and "fun" tabular dataset for binary classification.
I'm intending to use it to illustrate how KNN works for complete AI/ML noobs. So it needs at least 2 easy-to-understand features.
 thin terrace
I believe that is too complicated. The datapoints should be easy to plot in a graph with pen and paper
They should do something like drawing a graph with one feature on the X-axis and one on the Y-axis. Then plot some given datapoints, and then predict a new datapoint given K
acoustic halo
You probably won't find a dataset with only two features, unless you do something like the titanic survival dataset and just select two of the features yourself
like class and age or something
thin terrace
@acoustic halo yeah I want to select two features just like you said.
signal sluice
what abt the iris dataset?
acoustic halo
@thin terrace SHould be fairly easy to do, iirc when I was first starting out age and sex were the best survival predictors
thin terrace
I feel like sex will be a little boring as it's binary
wont give a nice spread in the graph
uncut shadow
I feel like sex will be a little boring as it's binary
@thin terrace I had to stop for a minute and think what u have said, but then I saw u r talking bout dataset 😂
thin terrace
😁
serene oar
Hi again.
Is there a way to get a count of each unique string in a series object?
I have an issue where a dataset is so big that the series breaks the cell of csv. So I want to get the amount of occurrences of each unique string in the column.
I can't figure how. Is group by the way I should be leaning towards?
Sample of the column df['terto'], there are more columns as such.
Index          "terto"
0               [['1231', '12312', '32123', '31231'...
1               [['123', '554543', '463', '2342'...
@serene oar it looks like the valeues of 'terto' are nested lists, or numpy arrays, containing strings. si that right?
anyway you can use .value_counts() for that
df['terto'].value_counts()
That seems to be correct.
If I do
for a in df['terto']:
  print(a)
I get every print starting with
["['14142',...
I guess it's the result of my group by actions
Ah, but I think here I need to do something like
for a in df['terto']:
  print(a.value_counts())
Because I want it per row, as each row has a lot of different values in it.
But I get an error:
AttributeError: 'list' object has no attribute 'value_counts'
desert oar
you did something very weird
each element of df['terto'] is one row
you must have done some operation that led to having a list of lists in each row
instead of data
can you show the code you used to produce this data
serene oar
I have a column of URL's
new = df["url"].str.split("/", expand = True)
then
    function_dict = {"primo": list, "secundo": list, "terto": list, "doce": list, "cinco": list, "seis": list, "siete": list}
    gdf = df.groupby('eventId').aggregate(function_dict)
then I write it to CSV and re read it from another place. Then merge two csv's as one has additional details
df = pd.merge(left=df, right=cname, how='left', left_on='eventId', right_on='eventId')
and I regroup them based on the new values I added to the dataframe in the merge
function_dict = {"primo": list, "secundo": list, "terto": list, "doce": list, "cinco": list, "seis": list, "siete": list, "eventId": list}
gdf = df.groupby('name').aggregate(function_dict)
Forgot this, after the first time I create the "new":
    df['primo'] = new[1]
    df['secundo'] = new[2]
    df['terto'] = new[3]
    df['doce'] = new[4]
    df['cinco'] = new[5]
    df['seis'] = new[6]
    df['siete'] = new[7]
why would you do this? gdf = df.groupby('name').aggregate(function_dict)
what is the purpose?
serene oar
I had a list of url's that correspond to an "event" and this event has a parent that isn't mentioned in the first dataframe. So after I had grouped the url paths to each event, I wanted to add the parent to these events and group them per parent.
The end goal is to group per parent
parent is 'name'
desert oar
before you write to csv you should use json.dumps on the columns that contain list data
where do you use new?
function_dict = {"primo": list, "secundo": list, "terto": list, "doce": list, "cinco": list, "seis": list, "siete": list}
gdf = df.groupby('eventId').aggregate(function_dict)

# Convert lists -> JSON
list_cols = list(function_dict.keys())
gdf[list_cols] = gdf[list_cols].applymap(json.dumps)

# Use tab as delimiter to avoid confusion with JSON data
gdf.to_csv('gdata.tsv', sep='\t')
gdf = pd.read_csv('gdata.tsv', sep='\t')
gdf[list_cols] = gdf[list_cols].applymap(json.loads)
new is made by splitting the url path's by "/"
And is used for assigning values to other columns.