#data-science-and-ml
1 messages · Page 234 of 1
 serene scaffold
serene scaffold
serene scaffold
I want to see if we can find a way to do what you're doing that doesn't use Python for loops, like how numpy has certain methods that do what could be done in a for loop in pure Python.
 frank bone
sec
simple 2 liner csv_files = glob.glob(os.path.join(path, "*.csv")) df_from_each_file = (pd.read_csv(f, usecols=[5, 6]) for f in csv_files)
what im doing here is concatenating multiple csv files into one pandas dataframe
dont think anything can be changed about this 😄
serene scaffold
well, that's a lot of disk reads
frank bone
alrdy using NVMe
serene scaffold
idk what that is
serene scaffold
I don't know how to make the process of opening all those files any faster
serene scaffold
makes sense to me
serene scaffold
!e
import numpy as np

mat_1 = np.random.rand(5)
mat_2 = np.random.rand(5)

print(mat_1 == mat_2)
 arctic wedgeBOT
@serene scaffold :white_check_mark: Your eval job has completed with return code 0.
[False False False False False]
the idea being that for numpy arrays, __eq__ doesn't actually return True or False but tells you which elements of the two arrays are equal
which you could do with a for loop, but doing it using the numpy API causes those operations to happen in C
so I was just going to see if we could find similar approaches to optimization in the pandas API, but I don't have experience with pandas.
you can multiprocess with python though. Let me look up the name of that library
 sterile zenith
does anybody have experience with interpreting dates from unstructured text? Given the example:
it's going well thanks, how are you?

say, what are you doing tomorrow night at 9pm? want to grab drinks? That's July 9, 2020 at 9pm.

Best,
Name
could you pull out the dates? I tried playing around with spaCy, but it looks like that's like use a chainsaw for hammering a nail. I'm wondering if there's anything between that sort of advanced NLP and regexes
frank bone
i read pandas uses numpy arrays. Thanks for link!
serene scaffold
Sorry I wasn't more helpful. I should read more about pandas.
frank bone
all good 😄 i definitely have some more reading to do as well
but i didnt expect to get this far, having started on Sunday with python/coding lol
gotta love the beginner learning curves, inverse exponential
 pseudo sonnet
@frank bone Look into multiprocessing with dask dataframes
serene scaffold
huh, you don't have any prior programming experience?
pseudo sonnet
or just adding multiprocessing pools where appropriate
frank bone
@frank bone Look into multiprocessing with dask dataframes
@pseudo sonnet noted, thanks 🙂
serene scaffold
@sterile zenith I think one of my coworkers has worked on that. I asked in our slack channel.
frank bone
huh, you don't have any prior programming experience?
@serene scaffold well i did some bash script a while ago, nothing complicated tho
sterile zenith
thanks 👍
 mighty escarp
I have this exercise. If anyone has the time and energy to spare I'd really appreciate some help. I've made some progress independently already
I'll detail my progress if anyone is genuinely willing to offer assistance
serene scaffold
@sterile zenith this looks like one solution but I don't like how it reformats the matches: https://github.com/akoumjian/datefinder

GitHub
Find dates inside text using Python and get back datetime objects - akoumjian/datefinder
sterile zenith
👀
looks pretty good:
In [1]: import datefinder

In [2]: email="""it's going well thanks, how are you?
   ...:
   ...: say, what are you doing tomorrow night at 9pm? want to grab drinks? That's July 9, 2020 at 9pm.
   ...:
   ...: Best,
   ...: Name"""

In [3]: matches = datefinder.find_dates(email)

In [4]: matches
Out[4]: <generator object DateFinder.find_dates at 0x1048fd890>

In [5]: list(matches)
Out[5]: [datetime.datetime(2020, 7, 14, 21, 0), datetime.datetime(2020, 7, 9, 21, 0)]
unfortunately it literally interpreted "9pm" to mean "9pm tonight"
frank bone
anyone know how to get a n-th element from a path?
for example "cpu" from /sys/bus/cpu/devices/cpu0/, sort of like basename but with a reverse level?
pseudo sonnet
I'm thinking you could just extract the date + context (like 3 extra words either side or something) and search context for words like tomorrow
serene scaffold
@sterile zenith huh, I didn't think it was going to be datetime objects. I like that.
pseudo sonnet
Not foolproof, but it would catch the majority of cases
sterile zenith
might end up forking this and expanding it to include more "natural" text
thanks!
frank bone
>>> print(path)
cpu0```
goal would be to do something like: os.path.basename('/sys/bus/cpu/devices/cpu0').depth=3to return "bus"
pseudo sonnet
what's the context?
frank bone
u asking me?
 marble jasper
recursive dirname?
frank bone
my goal is to get the Date from path instead from csv, to save time
pseudo sonnet
Was bout to say what meseta said
marble jasper
pathlib has a .parts property
it returns the folders as a tuple, you could just index that
frank bone
stackexchange solution: def nth_parent(path, n): return path if n <= 0 else os.path.dirname(nth_parent(path, n-1))
would this be ok?
pseudo sonnet
also remember to write in windows compatibility tee hee
marble jasper
from pathlib import PurePath

path = PurePath('/sys/bus/blah')
path.parts[2] # this would be "bus"
oh thats simple
marble jasper
windows version:```python
from pathlib import PureWindowsPath
path = PureWindowsPath('C:\sys\bus\blah')
path.parts[2] # this would be "bus"
can it take a path object?
that would make it cross compatible
wait I'm dumb
actually forget I said anything
frank bone
love it, thanks @marble jasper 😄
pseudo sonnet
I'm confused why they made a separate object for windows paths
marble jasper
no idea, I haven't played around with pathlib that much
although docs seem to indicate that it's automatic:
so maybe you don't have to specify PureWindowsPath after all
 zenith nova
That's the case, yes
Path() is for paths in general. PurePath is for "virtual" paths that you don't want to match against the filesystem
Path().resolve() turns a path that looks like C:\Windows\..\..\Data into C:\Data
However, if you've symlinked C:\Data somewhere, it will also follow the symlink
if you just want to manipulate the path as a path, use PurePath
If you want to manipulate a path as if you were on a windows machine, PureWindowsPath
frank bone
anyone here has some experience with hierarchical indexing in pandas? im not sure about the syntax when i want to stream(append) new elements into a pandas MultiIndex on the fly
i start with no index and with each iteration in my for loop i want to add new entries
 flat quest
@frank bone are u only using for loops to read the df's?
 lapis sequoia
Is it necessary to have a data science course certificate in order for me to get a data science job?
 granite steppe
@mighty escarp jsut wondering where u got those problems from ?
mighty escarp
@granite steppe school exercise. Already solved it
granite steppe
@mighty escarp bro was it hard ? Im just getting into data science and was just curious about it
mighty escarp
This particular exercise wasnt that hard
lapis sequoia
Is it necessary to have a data science course certificate in order for me to get a data science job?
@lapis sequoia from personal experience i can tell you that it is not necessary if you can prove that you are qualified, but it also depends on the market where you are competing. i had a social science degree, had years of experience with coding and i had read a lot on various related topics (graph theory, learning theory, common machine learning algorithms) before i applied for a job as a data scientist. the particular market where i am competing is also short on data scientists, data engineers, etc. therefore i had a better chance, but this might not be true in the us or in sweden for example.
the company where i work also recently hired somebody without any university degree and he is also another fine example. he worked as a data analyst previously, thus knew a fair share of python prior and had gained experience in building data science solutions while competing on kaggle which came quiet handy for him during the interview.
granite steppe
@mighty escarp r u like undergrad??
lapis sequoia
@lapis sequoia i m from india
So i can do some internships
And then get a certificate of that internship rather than that of data science course
lapis sequoia
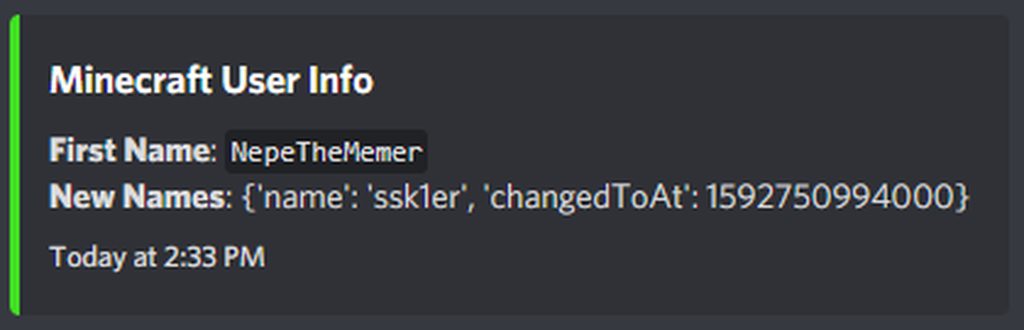
Output:
{'name': 'NepeTheMemer'}
{'name': 'Ostbollarna', 'changedToAt': 1565706666000}
{'name': 'SmallGorilla', 'changedToAt': 1568300830000}
{'name': 'Bigboyneo', 'changedToAt': 1572086948000}
{'name': 'DadMan123', 'changedToAt': 1574685201000}
{'name': 'hypcroite', 'changedToAt': 1578509385000}
{'name': 'baqnica', 'changedToAt': 1581196208000}
{'name': 'fappingbird123', 'changedToAt': 1584375177000}
{'name': 'walkingmonkey123', 'changedToAt': 1587207096000}
{'name': 'ssk1er', 'changedToAt': 1592750994000}
Code:
for names in data:
                        print(names)

                    name = data[0]["name"]

                    embed = discord.Embed(title="Minecraft User Info",
                                          description=f"**First Name**: `{name}`\n**New Names**: {names}",
                                          color=discord.Color.from_rgb(65, 224, 34),
                                          timestamp=datetime.utcnow())
                    await ctx.send(embed=embed)
It only sends this:
https://imgur.com/a/B5yyrAt
 stone terrace
hello people , somebody can help me about how to install tersorflow-gpu in ubuntu non-nvidia gpu ?
 hot parcel
Hello?
Anyone could have something like API
And grab something from the website?
IDK how to describe what I am going to do 🤭
Anyone help me
 silk axle
## Create the model's architecture
model = Sequential()

# Add the first layer
model.add(Conv2D(32, (5, 5), activation='relu', input_shape=(28, 28, 3)))  # 28x28x3 - 3=rgb
...  # have a load of adding layers below

## Compile the model
model.compile(loss='categorical_crossentropy',
              optimizer='adam',
              metrics=['accuracy'])

## Train the model
hist = model.fit(x_train, y_train_one_hot,
                 batch_size=256,
                 epochs=10,
                 validation_split=0.2)
The model.fit(...) is raising the following error: ValueError: Input 0 of layer sequential_2 is incompatible with the layer: expected ndim=4, found ndim=3. Full shape received: [None, 28, 28]How can I specify what ndim should be expected for the model.fit()? I thought I did this when I added the first layer by doing input_shape=(28, 28, 3)?
@me upon response please
silk axle
Edit: found out I needed to .reshape my data, seems to be working now 🙂
 limpid raft
I'm trying to transform a Convolutional model to CSV. My attempt has been to make it a dataframe then CSV, but I can't even get it dataframe.
this is what I've tried:
hist=model.fit(training_input,training_output,epochs = n_epochs, verbose = 1, callbacks = es_callback)
that gives:
<tensorflow.python.keras.callbacks.History at 0x7f1e475be7b8>
and that to dataframe with:
pd.DataFrame(hist).to_csv("predictions_final.csv", header=["Expected"], index_label="Id")
Anyone know what I'm doing wrong?
lapis sequoia
I'm trying to transform a Convolutional model to CSV. My attempt has been to make it a dataframe then CSV, but I can't even get it dataframe.
@limpid raft do you mean like literally exporting your model weights as a csv file? or saving your training metrics into a csv file? for the latter you could just use https://www.tensorflow.org/api_docs/python/tf/keras/callbacks/CSVLogger
 hardy shale
@hot parcel You might try grabbing a help channel, response time will be a bit quicker there
 uncut shadow
ummm
wdym
I don't think that's a good way of doing this. You can ofc just use .strip() and do it this way
oh
hmmm
so you have a json in csv or csv in json?
frank bone
@frank bone are u only using for loops to read the df's?
@flat quest reading csvs within a for loop yes
does anyone know how to properly use dask? trying to use 8 cores instead of 1...
concatenated_df = pd.concat(df_from_each_file, ignore_index=True)
print(concatenated_df)```this is pandas
i thought dask (as dd) was the same syntax and usage, but multi core
concatenated_df = dd.concat(df_from_each_file, ignore_index=True)
print(concatenated_df)```just throws an error though
TypeError: dfs must be a list of DataFrames/Series objects
lapis sequoia
@frank bone it says list and you are making a generator, so i would try changing that first
you could also just initialize concatenated_df first as an empty dask dataframe and append any newly read dataframe to that. for that you would need a for loop of course
frank bone
ill try to figure out..im a complete noob :/ started 3 days ago..googling my way through 😄
i just thought pd and dd were the same, one single core and one multi core, guess theres more behind it
lapis sequoia
so i think the general idea here might be that since you are making a generator (which is lazy by nature) you can't parallelize processing it
frank bone
the current single core implementation takes 70minutes to run...so im trying to get it under 10min with 8 cores if thats possible
just going through csv files, doing some calculations and putting the results in tuples
its a time series
lapis sequoia
are you going to run this script multiple times in the future? if so i would abandon the separate csv idea and put everything into a single dataframe and save it as parquet. it will read faster on the next run
parquet format is supported both by pandas and dask
 upbeat pagoda
hey team I'm working with splitting a string into mutiple columns, I'm not sure why str is used so much in:
df['dateTime'].str.split('-').str[1]
I kinda understand the first .str is an attribute of the df['dateTime'] series object, but the second one baffles me, thanks!
lapis sequoia
@frank bone nah, its a tabular fileformat designed specifically for cases when you might not need everything from the table. it is going to be a directory of separate files on your disk (just like what you would have with the separate csv files)
frank bone
oh i see, ive noted it and will look into that. thanks 🙂
but just in case my parameters change a lot and that solution wouldnt suit my needs, do you see a way to make my code above multi processed?
the part that searches through directories, reads csv into a frame and calculatues new values?
 mellow spruce
Hello guys, what is the best way or library to construct a table GUI where the user inputs values on the table and I it outputs calculations based on those input values in another table?
frank bone
maybe something like this? http://www.racketracer.com/2016/07/06/pandas-in-parallel/ or dask...
Some quick hacks on running pandas in parallel would be nice. By adding Pools to the multiprocessing package in Python, we can spin up multiple threads.
lapis sequoia
the part that searches through directories, reads csv into a frame and calculatues new values?
@frank bone the code you posted above i think should run if you change one thing:
df_from_each_file = [pd.read_csv(f, usecols=[5, 6]) for f in csv_files]
this will make it a list comprehension (hence reading everything into memory) and not a generator which should suit dask. now if you to want parallelize reading the files you could use joblib for that
frank bone
oh that seems to work and with variable.compute() i put it back into pandas format
lapis sequoia
oh it seems like dask's read_csv method accepts patterns, so if you have a large number of files in the same directory starting with the same pattern (like data for example) and then you have a changing pattern (like a continously increasing number) then you could pass this pattern to the read_csv method like so: data*.csv
oh that seems to work and with variable.compute() i put it back into pandas format
@frank bone ok great 🙂
frank bone
thanks 😄 ill tinker some more but now im wondering if this truly increased speed
 chrome barn
string = '10-09-2019'
print(string.split('-')[0])
print(string.split('-')[1])
print(string.split('-')[2])
because .str is a function of pandas to handle strings above example is the same in normal python and will give the outputs 10, 09 and 2019 respectively
lapis sequoia
thanks 😄 ill tinker some more but now im wondering if this truly increased speed
@frank bone well the first solution i proposed did not. it just read everything sequentially. however any computation you would do afterwards is handled by dask in parallel
frank bone
so i can only increase the speed with joblib?
lapis sequoia
i think the second solution would increase speed as well (providing a file pattern for the read_csv method of dask) or you could convert to parquet after reading it first, saving the parquet then using only that afterwards
lapis sequoia
Hi, i don't know how ot reformat the data to split it by 'column' pf my dataframe.
Hi, i don't know how to reformat the data to split it by 'column' in my dataframe.
 desert oar
@lapis sequoia can you provide some sample data and an example of the desired output?
@frank bone anything using parallization has a lot of overhead in moving data/information between processes
what are you doing exactly?
lapis sequoia
@desert oar
frank bone
what are you doing exactly?
@desert oar iterating through directories, retrieving csv files, loading them into Pandas dataframes, then doing basic calculation and saving results in tuples, in pairs of 3
 pale marsh
Hey does anyone know altair? I'm trying to figure out why its not plotting my chart 😭
desert oar
@lapis sequoia what do you want to do with this data?
@frank bone write a function that loads 1 file, then use joblib or processpoolexecutor or multiprocessing.pool to parallelize
maybe us a queue to save the data or something
depends on how you want to store that
@lapis sequoia use .loc
df_cardio1 = df.loc[df['cardio'] == 1]
df_cardio0 = df.loc[df['cardio'] == 0]
@desert oar thanks
upbeat pagoda
@chrome barn hey again, I see so this
df['dateTime'].str.split('-')
outputs another series object, in order to index it using the [0], we have to call .str to make it a string again
desert oar
Did you try it at all
Is this homework/coursework?
We do not give out homework answers here
lapis sequoia
i try i use with catplot but doesn't work
frank bone
@desert oar im using this code ```def main():
ticker_filter = []
thistuple = []
for root, dirs, files in min_depth(os.walk('/home/computer/Documents/Stocks/'), depth=4):
    if not dirs:
        path = root
    ticker = os.path.basename(path)
    date = PurePath(path).parts[6]
    if (len(ticker_filter) > 0) and ((ticker in ticker_filter) == False):
        continue
    csv_files = glob.glob(os.path.join(path, "*.csv"))
    df_from_each_file = (pd.read_csv(f, usecols=[5, 6]) for f in csv_files)
    concatenated_df = pd.concat(df_from_each_file, ignore_index=True)
    dollar_volume = (concatenated_df['Price'] * concatenated_df['Volume']).sum()
    thistuple.append(tuple((str(ticker), str(date), int(dollar_volume))))

return(thistuple)
main()```
for what i described before. See any improvement potentials? 1 day of data takes around 11s and that's approximately 9432 files (.csv) with an average file size of 7kB
this is the output (example): ```[('AAPL', '20120103', 3835538), ('AAPL', '20120104', 4176408), ('AAPL', '20120105', 5468868), ('AAPL', '20120106', 5520247), ('AAPL', '20120109', 5698068), ('AAPL', '20120110', 2714942), ('AAPL', '20120111', 2038918), ('AAPL', '20120112', 3203726), ('AAPL', '20120113', 2376274), ('AAPL', '20120117', 3423089), ('AAPL', '20120118', 4850734), ('AAPL', '20120119', 4446490), ('AAPL', '20120120', 6234720), ('AAPL', '20120123', 3805538), ('AAPL', '20120124', 7197666), ('AAPL', '20120125', 13312566), ('AAPL', '20120126', 3968039), ('AAPL', '20120127', 3818511), ('AAPL', '20120130', 6087196), ('AAPL', '20120131', 5992732), ('AAPL', '20120201', 3058387), ('AAPL', '20120202', 2930134), ('AAPL', '20120203', 4154695), ('AAPL', '20120206', 3953637), ('AAPL', '20120207', 5685242), ('AAPL', '20120208', 7271777), ('AAPL', '20120209', 18847913), ('AAPL', '20120210', 8719465)]
Having a problem with plotly dash I want to use a dropdown with multi option to update the rows for a dash table. however it looks like this
my update code looks something lke this `@app.callback(
dash.dependencies.Output('output', 'children'),

[dash.dependencies.Input('select-prd', 'value')])
def update_output(value):
value_list=[]

value_list.append(value)

return [


    dash_table.DataTable(

        id='prd-mix',

        columns=[{'id':'product-group', 'name':'Product Group'},

                 {'id':'mix','name':'Product Mix'}],

        data=[{'product-group':value for value in value_list} for j in range(len(value)) ],

        editable=True


        )`
@upbeat pagoda exactly see the screenshot of how python is handling the dataframe based on how you call it
desert oar
@frank bone where does path come from if dirs is not empty?
frank bone
not sure what you mean, depth=4 folders are never empty
frank bone
its from walkdir module
skips unnecessary walking from os.walk when you want a specific depth
you have
if not dirs:
    path = root
@desert oar just something i took from stackexchange that provides me with pathnames of the folders that contain files
which are all exclusively at depth=4
thats not where im losing time
that part takes 0.085s per day (out of the 11s)
upbeat pagoda
@chrome barn 🙏 thanks again man. btw I meant to let you know I'm implementing what you told me about the scraper, it's just going to take me a few days
 weary dune
Can ayone help me figure out why I have a syntax error?
frank bone
@desert oar this one line uses 99% of those 11s
concatenated_df = pd.concat(df_from_each_file, ignore_index=True)
creating 1 dataframe from x amount of csv within a folder
is there a way to multi process this one liner?
the reason I merge them is because let's say i have 6 csv files per folder and i want to sum a column
so i can sum 1 dataframe
maybe there's another faster way?
desert oar
ah
you can sum each df separately
then sum the sums
sum((df['Price'] * df['Volume']).sum() for df in df_from_each_file)
@frank bone
frank bone
@desert oar tried it, worked
frank bone
but its actually 0.7s slower
frank bone
yup concat is faster 😄 didnt expect that
desert oar
maybe concat is smart in that it leaves all the memory in place
desert oar
no i think you should just parallelize over os.walk
desert oar
- chunk the output of
os.walkinto N chunks (where N = number of parallel workers) - write a function that loops over its inputs and processes them one at a time
- make N workers, each worker handles one chunk from (1)
- use sqlite to save the output because sqlite can handle concurrent connections
frank bone
- chunk the output of
os.walkinto N chunks (where N = number of parallel workers)- write a function that loops over its inputs and processes them one at a time
- make N workers, each worker handles one chunk from (1)
- use sqlite to save the output because sqlite can handle concurrent connections
@desert oar that's kinda over my head damnit lol im a noob i just started
but maybe coffee + google, might give it a try
you think making a separate function where i do this one liner might work too?
desert oar
dont think about one liners
frank bone
or is there no implementation for that
desert oar
but yes separate functions are good
frank bone
was looking at this
Some quick hacks on running pandas in parallel would be nice. By adding Pools to the multiprocessing package in Python, we can spin up multiple threads.
desert oar
you arent parallelizing pandas
remember
each dataframe is small
the problem is you have a lot of files to process
at least, that's the problem as i understand it
how many files are we talking about anyway?
frank bone
yes, around 9000 in those 11s with average size of 7kB
9432 files average file size of 7kB
to be exact
for that folder im talking about, that's taking 11s
in total millions, probably
marble jasper
why not concat the files first. then read into pandas
desert oar
concatenate 9000 files?
marble jasper
they're only 7kb
desert oar
true i guess its what, 63 MB total?
frank bone
no, im only mergin 5-10 files at a time, per iteration
desert oar
it looks like they're doing a bunch of more complicated processing
not just reading csvs 1 at a time
like read from one file, then fetch a bunch of specific corresponding csvs
frank bone
im reading all csv files in a folder, then concatenating them
which is usually 5-10 files or so
at avg size of 7kB
and i have thousands of folders so that adds up to those 11
2800 folders to be exact
for that specific day
its a time series
why not concat the files first. then read into pandas
@marble jasper you have to do it on a ticker basis, cant just merge all, we're talking about AAPL, TSLA, IBM, BA etc...
marble jasper
so why not concat the data first then create a data frame from the whole lot?
marble jasper
yes, you're doing what, hourly or minute stock data? I'm familiar with the format
how many symbols do you have?
marble jasper
and you're calculating total volume movement per minute?
and what is your output format?
frank bone
no, total dollar volume per day
marble jasper
ok
frank bone
right now its tuples in a list with 3 values
Ticker, Date, Volume
not sure if i want it like that though, but the idea is to store these 3 values
and then apply moving averages, standard deviations and whatnot on a per ticker-stream basis
desert oar
from concurrent.futures import wait, ProcessPoolExecutor
from itertools import islice
from math import ceil
dbconn = sqlite3.connect('output.db')
dbconn.execute('create table ticker_output (ticker text, date text, dollar_volume integer)')
def worker(walkdata):
dbconn = sqlite3.connect('output.db')
for path, dirs, files in walkdata:
# do stuff
dbconn.execute('insert into ticker_output values (?, ?, ?)', (ticker, date, dollar_volume))
dbconn.commit
def iter_batches(data, batchsize):
data = iter(data)
while True:
batch = list(islice(data, batchsize))
if not batch:
break
yield batch
n_proc = 8
walkdata = list(os.walk('data-dir'))
batches = list(iter_batches(walkdata, ceil(len(walkdata) / n_proc))))
with ProcessPoolExecutor(n_proc) as executor:
futures = [executor.submit(worker, batch) for batch in batches]
wait(futures)
I suggest concatenating the csv files for each symbol first, then converting the whole time series to dataframe
and yes, parallel process each symbol
desert oar
the usual caveats about untested code apply
marble jasper
definitely trust code from people on the internet 100%
frank bone
I suggest concatenating the csv files for each symbol first, then converting the whole time series to dataframe
@marble jasper 1 dataframe per ticker or the whole ticker universe in 1 dataframe?
marble jasper
1 dataframe per symbol, though perhaps do the benchmarks to find where your bottlenecks are. I suspect they're in the overhead of dataframe conversion, but I may be wrong
desert oar
i feel like its not worth it tbh
frank bone
btw is it possible in python to use a variable output to create a new variable? Let's say $variable = [], where AAPL is behind "variable"
desert oar
you have to write a shell script and test it and shit to do the concatenation
or just... dont bother
@frank bone no. use a dict
symbols = {
'AAPL': (1, 2, 3)
}
symbols = {}
for symbol in ['AAPL', 'TSLA']:
symbols[symbol] = # stuff
also, does my parallelization code make sense @frank bone ?
frank bone
symbols = {}
for symbol in ['AAPL', 'TSLA']:
symbols[symbol] = # stuff
@desert oar my hello world was on Sunday, so my head is starting to hurt 😄 but its noted...
desert oar
hah alright
frank bone
ill try to understand, for now I'd just like to try to multi process the one concat
and see if it actually helps speed
marble jasper
try snakeviz, it's not as complex to use as you might think
frank bone
never even heard of that 😄 ill take a look
lapis sequoia
quick one, how to get a value for ram usage?
marble jasper
it'll give you a breakdown of your execution time and you'll be able to see what needs improving
marble jasper
can't optimize if you don't know where to optimize!
frank bone
i.e like 10.85s = concat, 0.15s all the rest
marble jasper
so...concat the csv files first and then convert to pandas, which is still my one and only suggestion
frank bone
how would you do it the concat? call a bash script from within python? or do it in python directly?
mellow spruce
Hello all, I have a table that loos like this:
` Name| Quantity
gardeners| 25
janitors|30
clerks | 25`
and for each name I have another table that looks like:
` Activity|time
Cleaning|0.5
Sweeping|0.4
Organizing| 0.7`
and so on for 500 or so activities. I would like to after selecting the names go through each name table and multiply the activity * quantity to be output in a different table. However many names may share some activities so for those shared activities, I would like to output something like 25*(time the gardener spends cleaning)+30*(time janitor spent cleaning). So the output table should look like this:
`Activity|% of time needed
Cleaning|27
Sweeping|30
Organizing|15 and so on `
The libraries I am using are plotly dash because it has to be a web app and datascience tables to calculate the time per activity. The output table is not going to be interacted with beyond exporting the table but it has to be output on the dash environment. Thanks for your help
lapis sequoia
Exception has occurred: TypeError
'str' object does not support item deletion
Code:
for _friends in data["records"]:
friends = _friends["uuidSender"]
if friends == uuid:
del friends["uuidSender"]
print(friends)
I'm trying to remove something that looks like this:
38f67f4aa0c74dd99792aaf6cc401424
I'm using a minecraft API that returns the friends from that specific server (hypixel api) so i just want it to remove the duplicates that match the excact username as the self username or uuid passed so basically I just wanna remove everything from this list that has the exact same uuid as the person type in when invoking the command
Example:
pls hypixel friends 38f67f4aa0c74dd99792aaf6cc401424
I want this command to return all friends but just remove all friends that match this uuid because hypixel does this sometimes
 modest rune
I wrote a stock options backtesting tool using pandas. The tool works, but the tool is slow. 30 seconds per option chain. I have been reading as much as I can about optimizing my code. So much, that my head hurts. I decided to write out my data structures on pencil and paper and draw out a solution. I have some questions.
My main approach to solving my speed issues is that I am going to manipulate my multidimensional data with vectorization.
The rough layout of my data is...
Stock History: [days X (price.high, price.low)]
Options Data: 4d array for stock option data [expiration date X [Call/Put Type X [Strike Price X Option Price]]].
Question: my current thinking is that I would concat that 4d array into a 2d array (dataframe). But, I am just not sure what is the best approach when using pandas and numpy.
Approach A: 1 Big 2D array that will need some binning, sorting, and indexing and a dataset that has lots of repetition in its data (ex. the PUT/CALL column would consist of only PUT or CALL, or the Strike Price column would be have duplicate strike prices for every option under that strike price).
Approach B: 20 medium sized dataframes part of a 4D array, that are nicely organized but will need to be iterated over.
**Approach C: ** A better way that I am not thinking about.
Footnote: I will be doing vector math between the 2D Stock History dataframe and the Stock Options data.
I am just looking for high level advice on what datastructures tend to work more efficiently with pandas and numpy. A or B? I don't want to head down a design path for doing my math that I will have to redo 4 days from now because I wasn't able to realize significant time savings
desert oar
@frank bone there's no point in multiprocessing the concat imo
better to parallelize the whole thing like i showed you
frank bone
@frank bone there's no point in multiprocessing the concat imo
@desert oar the only problem is the concat though, but im still trying to understand the code and how to implement it
ill try both cause why not 😄
silk axle
How can I resize an image to be of shape (28, 28, 1)? When I try and do resize(image, (28,28,1)) I get an error saying that depth of 3 can't be converted to depth of 1. Not really sure what to do as my model can only accept images with a depth of 1
(I get my (28, 28, 1) training images from mnist)
 pale thunder
I think you are supposed to flatten it to get depth 1
pale thunder
Reshape into a shape of length 1
uncut shadow
u want to turn it to 1D?
silk axle
Yea
.flatten() doesn't seem to work either
Actually might've fixed it, need to wait for it to load
uncut shadow
maybe try, idk resize(img, (784, 1)) or resize(img, 784) but am not sure if it's gonna work
lapis sequoia
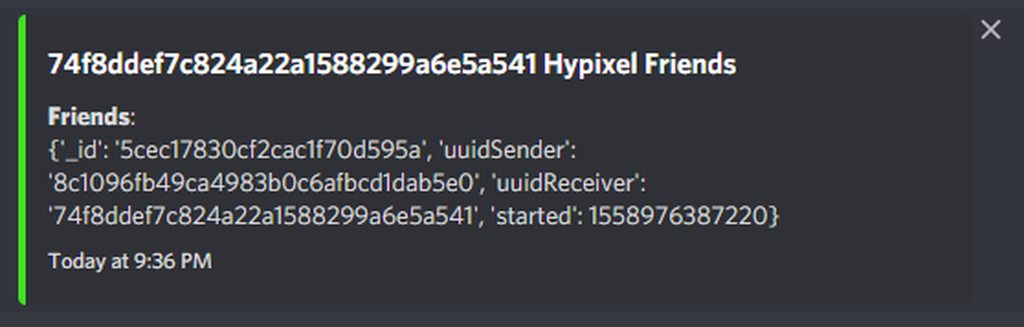
Output:
74f8ddef7c824a22a1588299a6e5a541
74f8ddef7c824a22a1588299a6e5a541
74f8ddef7c824a22a1588299a6e5a541
998ef1292aa94d208353ff513d6e86cd
1f0a16cb035a47f9b715067888d4cb3e
b020a8f479304c5cb6a58f9ef471743d
d62e5b06e0cc4e3f8febdebf85f92522
92f13295be604a2988251b5dc665f91b
30b49a5292b146a080e94ae9fb6f8b92
9b07317430074750874d151c98628d47
8c1096fb49ca4983b0c6afbcd1dab5e0
Code:
for _friends in data["records"]:
friends = _friends["uuidSender"]
print(friends)
embed = discord.Embed(title=f"{uuid} Hypixel Friends",
description=f"**Friends**:\n{friends}",
color=discord.Color.from_rgb(65, 224, 34),
timestamp=datetime.utcnow())
await ctx.send(embed=embed)
So my command doesn't really show everything it only shows one uuid
Discord:
https://imgur.com/a/xl8yhKe
 desert oar
@modest rune the first step to optimizing code is to figure out where the slow part is
but yes vectorizing is usually good
pandas is pretty easy to use, it's often faster to use pure-numpy vectorized ops as opposed to pandas groupby (for example), but pure-numpy vectorized code can be really hard to read and write
silk axle
## Resize image to 28x28x1
from skimage.transform import resize
new_image = new_image.flatten()
print("flattened")
resized_image = resize(new_image, (28, 28, 1))
print("resized")
img = plt.imshow(resized_image)```this seems to be freezing on the resize, not quite sure whywell, it's in 3 dimensions technically
silk axle
Think it might just be because the image is so massive, just realised
It's like 1250x1600 o-o
uncut shadow
oh, this might be the problem too lol
silk axle
Gonna try with a smaller image (256x256), brb
modest rune
@desert oar The past few days I have been using pyinstrument to identify the slow parts of my code. That has helped a lot. I have been able to reduce the time from 30 seconds per run down to 20. But, 12 seconds of the remaining 20 seconds is due to a custom equation I created that runs at the end of a 4 level nested for loop. I am pretty sure if I were to restructure my data into two dataframes and be smart about using vectorization, that I could get rid of most if not all of the looping.
My high level concern is: It seems silly to make a big dataframe from 20 medium sized dataframes, because there would be so much duplication in the data found in the columns. Should I throw that kind of thinking out the window?
And... the more I read about numpy, the more I think I start to understand... Numpy wants people to send as big of chunks of math as possible to it at a time, that way it can do as much math in C as possible before having to interact with python. And vectorization is a fancy way of saying, "Creative ways to do math problems with as many datapoints at a time as possible, so we don't have to go back to python to ask for more data as often."
silk axle
well, it's in 3 dimensions technically
@uncut shadow Can I officially make it 1d? Since my model can only take 1d images, or does the reshape do this?
uncut shadow
well, I don't know, but if your model takes 1d inputs then you should try to turn it to 1d I think
 rare ice
Our development team is using Databricks and Databricks Notebooks (and using python in them). Any recommendations/suggestions on how to unit test the python code that is in the notebooks?
 balmy kraken
hello
could anyone explain exactly what i should look for to run updatable databases in the cloud?
thanks a lot
uncut shadow
That's not a right channel to ask DB questions. You should probably ask it in #databases
balmy kraken
thanks a lot
what do people here usually talk about? data engineering like pandas etc?
desert oar
@modest rune yes that's exactly what numpy wants
balmy kraken
lol
desert oar
See the einsum function for an extreme example
Data duplication is a problem in 2 instances: 1) it makes your data too big for memory, or 2) it makes your computations slower
Note also that using pandas multiindex it doesn't actually "duplicate" individual data points in the index
modest rune
@desert oar I assume since my data has a mix of datetime, float64 and ints, I would likely be happier with pandas, due to its flexibility, and also because i would like to be able to store other datatypes in my 2d arrays (like enums and maybe strings). I am leaning towards a mostly pandas implementation and only moving to pure numpy in specific situations where the time savings make it worth my time? thoughts?
the einsum function looked interesting. Not being a data scientist and with a weak background in math, it sounds like it allows someone to do complex math on matrices and arrays through the use of some type of subscript. Like... regex for matrix math.
modest rune
Data duplication is a problem in 2 instances: 1) it makes your data too big for memory, or 2) it makes your computations slower
@desert oar
I already figured that much. But... that is not where my confusion lies... I am 95% sure (1) won't be a problem. Not sure about (2), I guess that depends on pandas and numpy. Is it safe to say that nested looping is USUALLY worse than large 2D arrays with data duplication when dealing with Pandas and Numpy? Or, phrased differently, if I take my 20 medium sized dataframes and make them one big dataframe, does that sound like a reasonable approach to my problem? Most of the time, I would not doing something stupid if I do this? Is there something I missed, that I should research first before implementing?
desert oar
Can you give an example of an operation you want to do
modest rune
Umm, I'll try in pseudocode...
 last agate
How much math will I use if I want to do machine learning?
modest rune
@desert oar
# this is what I do today
for expire_dates_df in options_df:
for put_call_df in expire_dates_df:
for strike_price_tuple in put_call_df:
analysis = backTest(strike_price_tuple, stock_history_df)
# this is what I have in mind
big_options_df = flattenNestedDF(options_df)
analysis = backTest(big_options_df, stock_history_df)
The flattenNestedDF hopefully leverage some fancy dataFrame constructor, if they have something that fits well. The data starts out as bunch of nested dicts and lists.
The backtest function, would be full of vectorization, fancy indexing, and whatever else I would need.
I don't know if that is enough info for you to be able to provide advice.
frank bone
can someone help me fix this syntax?
calling = os.system('awk 'NR==1; FNR==1{next} 1 '' +flattened_csv'')
SyntaxError: invalid syntax
desert oar
- don't use os.system
frank bone
i tried subprocess it just doesnt work
os.system does what i want, tested it
just need to escape this 1 liner properly
desert oar
subprocess.run(['awk', 'NR==1; FNR==1 {next} 1', flattened_csv])
the reason you should not use os.system is precisely because escaping is ass
frank bone
ill try that
it runs but i dont get the feedback
awk: fatal: cannot open file
with os it ran and printed back the echo
desert oar
import subprocess
flattened_csv = 'TICKER.DATE.csv'
subprocess.run(['awk', 'NR==1 FNR==1 {next} 1', flattened_csv])
this doesn't work?
also you might just want to use a shell script for tihs
why exactly are you using awk?
to concatenate the files but remove the header?
thats actually a nice usage
wait... do you need the semicolons between patterns? i forget
silk axle
Before Resizing:
frank bone
import subprocess flattened_csv = 'TICKER.DATE.csv' subprocess.run(['awk', 'NR==1 FNR==1 {next} 1', flattened_csv])this doesn't work?
@desert oar trying
silk axle
After Resizing:
How can I make it so you don't entirely lose the number through the resize?
frank bone
@desert oar getting this awk: cmd. line:1: NR==1 FNR==1 {next} 1 awk: cmd. line:1: ^ syntax error
desert oar
probably my bad awk then
awk_script = '''
NR == 1
FNR == 1 { next }
1
'''
flattened_csv = 'TICKER.DATE.csv'
subprocess.run(['awk', awk_script, flattened_csv])
idk something like that
i used to be an awk wizard
i havent touched it in years
frank bone
os.system('awk \'NR==1; FNR==1{next} 1 \'' +flattened_csv'') this actually worked if i passed path directly, but i cant seem to get it to work when i want to pass path from variable like this
idk something like that
@desert oar awk: fatal: cannot open file
frank bone
somebody please help me escape this 😦 os.system('awk \'NR==1; FNR==1{next} 1 \'' +flattened_csv'')
yes it does, well im actually passing an absolute path
desert oar
os.system("""awk 'NR == 1; FNR == 1 {next} 1' """ + flattened_csv)
but i really really really cannot imagine why this would work and the subprocess version wouldn't
you can even just use " instead of """
and i really really do not recommend "use something known to be broken and unreliable" instead of "figure out the minor issue with the better tool"
frank bone
going crazy nothing works yet
desert oar
it really just sounds like the file isn't where you think it is
hold on
wait
hold on
are you trying to emit this filename?
FNR suggests you're concatenating multiple files
frank bone
im trying to concatenate multiple csv into a variable
desert oar
what do you mean "into a variable"
frank bone
but i cant escape the above
desert oar
and you intend to read that with pandas?
frank bone
yes
wanna compare if theres a speed difference this way
this works: calling = os.system('awk \'NR==1; FNR==1{next} 1\' /PATH/TO/CSV/file1.csv /PATH/TO/CSV/file2.csv') print(calling)
but obviously i wanted to provide the multiple paths with my variable flattened_csv
desert oar
import io
import subprocess
filenames = ['file1.csv', 'file2.csv']
awk_script = """
NR == 1 && FNR > 1 {next}
1
"""
proc = subprocess.run(['awk', awk_script, *filenames], stdout=subprocess.PIPE, encoding='utf-8')
data = pd.read_csv(io.StringIO(proc.stdout))
this should work
frank bone
thanks 😄 ill try
frank bone
pandas.errors.EmptyDataError: No columns to parse from file
desert oar
make sure my awk code isn't broken
oh yeah it is
awk_script = """
NR == 1
FNR == 1 {next}
1
"""
use your old awk
its correct
frank bone
same error i hate escape chars 😦
desert oar
what error
this isnt a matter of escaping
you need to see what awk is outputting
maybe its NR != 1 && FNR == 1 {next}
modest rune
@desert oar options_df is a large data structure that contains all of the stocks underlying options data. I don't think I accurately represented it in my pseudocode because I was focusing on getting the idea of the nested loops across. IF you think it would be helpful, I could do a better a job of showing the structure of the data (correct data types and exact nesting order), but it will take me some time.
frank bone
awk: warning: command line argument /' is a directory: skipped awk: fatal: cannot open file h' for reading (No such file or directory)
it splits the path with /
every single character
desert oar
filenames is a list
if you passed a string it will fail
the * unpacks list arguments
so you probably passed a string
frank bone
ohhh damn
true
hell yeah
finally
thanks man 😄
would you know how to to exactly this but only certain columns?
say columns 5 and 6
with the awk script
ah nvm not necessary
ill just do that in read_csv
lol its way slower when i separately concat files first and then makes df
but it was worth a try 😄 @marble jasper unless i did it completely wrong
marble jasper
have you tried concatenating the strings in python
just open() and read(), and concat strings
frank bone
what strings?
frank bone
but how would i keep only 1x header?
did it with 1 liner awk command called from python
awk 'NR==1; FNR==1{next} 1' *.csv
marble jasper
is awk faster (bearing in mind subprocess overhead) or file read in python?
I don't know the answer to that
you can have pandas strip out the header also after the fact
frank bone
is awk faster (bearing in mind subprocess overhead) or file read in python?
@marble jasper dont know, but pandas concat vs awk concat for 9400 files was 11s vs 23s
marble jasper
maybe try python reading the file rather than piping stuff around?
frank bone
idk why python would be faster than pandas though, but ill try
marble jasper
because you're incurring multiple csv-dataframe conversions, and multiple dataframe concat operations
dataframe concat is slower than string concat, and doing csv-dataframe conversion once is less overhead than n times
it's just inconcievable that doing n csv-dataframe conversions is faster than doing one conversion of data n times the size
and that's the basis for my original suggestion, which remains my only suggestion
I might be wrong, but it hasn't been tested yet, and until then, saying "I don't know why it would be faster" to me sounds like an opportunity you're missing
frank bone
ill try for sure just trying to find syntax 😄 all im finding on google is pandas lol
marble jasper
the most compact version, which might be slower than the alternative is simply:
all_data = []
for file in files:
all_data.extend(open(file).readlines()[1:])
this does no checks and is generally not clean. I don't recommend for production code, but for the purpose of testing an idea, try it
desert oar
i still feel like this is optimizing the wrong thing
i/o is i/o
text processing is text processing
marble jasper
it saves on the dataframe concat
desert oar
you're trying to optimize the inside of the loop to gain what, 1-2 seconds?
just parallelize the whole thing
fuck it
marble jasper
oh, you should do that as well
desert oar
save yourself literally 2-4x
frank bone
the most compact version, which might be slower than the alternative is simply:
all_data = [] for file in files: all_data.extend(open(file).readlines()[1:])
@marble jasper found one, would this be better? ```import csv
allColumns = []
for dataFileName in [ 'a.csv', 'b.csv', 'c.csv' ]:
with open(dataFileName) as dataFile:
fileColumns = zip(*list(csv.reader(dataFile, delimiter=' ')))
allColumns += fileColumns
allRows = zip(*allColumns)
with open('combined.csv', 'w') as resultFile:
writer = csv.writer(resultFile, delimiter=' ')
for row in allRows:
writer.writerow(row)```
marble jasper
no, why are you reading the csv?
desert oar
spending the most effort on the smallest gains
the python csv library will be much much much slower than pandas
marble jasper
csv is just a text file with each row on its own line
desert oar
@lapis sequoia show your code
marble jasper
you can concatenate these together as text
why would you need to parse the CSV data to do the concatenation?
frank bone
alright ill test ur code
marble jasper
you can do that as strings, saving you all the pandas dataframe concatenation time, which your tests previously showed is longest
also the code above doesn't preserve the first row heading
desert oar
string concatenation is slow too
FYI
did you see that looping over DFs wasn't any faster?
although i now suspect that they made a mistake
marble jasper
it's possible
lapis sequoia
@desert oar result = df_cat.groupby('variable')
#df1 = [df_cat.get_group(x) for x in df_cat.groups]
cities = [variable for variable, df in df_cat.groupby('variable')]
sns.catplot(x = 'variable', y = result[value], col= 'cardio', data = df_cat, kind = 'bar')
desert oar
@marble jasper
sum((df['a'] * df['b']).sum() for df in df_list)
i was very very very surprised to find that this was slower than pd.concat
to the point where i suspect they just did something wrong
marble jasper
I'm not suggesting doing any concatenation in pandas
marble jasper
he's literally stacking a bunch of data together
marble jasper
I agree with you on the parallelization, which he should do as well for each symbol
desert oar
their current code is something like
df_cat = pd.concat(df_list)
(df_cat['a'] * df_cat['b']).sum()
so im saying dont bother w/ the concat
just add up the individual sums
marble jasper
but you can't get around having to concat the data together at some point, because each set of n files needs to become a single dataframe for the time series
desert oar
in general yes
in this case no
because they're just computing a sum and returning
and they said the sum code was slower than concatenating
marble jasper
what
desert oar
but i find that extremely hard to believe
marble jasper
he doesn't need the time series?
desert oar
thats what he told me
marble jasper
well this was a waste of time
desert oar
def main():
ticker_filter = []
thistuple = []
for root, dirs, files in min_depth(os.walk('/home/computer/Documents/Stocks/'), depth=4):
if not dirs:
    path = root
ticker = os.path.basename(path)
date = PurePath(path).parts[6]
if (len(ticker_filter) > 0) and ((ticker in ticker_filter) == False):
continue
csv_files = glob.glob(os.path.join(path, "*.csv"))
df_from_each_file = (pd.read_csv(f, usecols=[5, 6]) for f in csv_files)
concatenated_df = pd.concat(df_from_each_file, ignore_index=True)
dollar_volume = (concatenated_df['Price'] * concatenated_df['Volume']).sum()
thistuple.append(tuple((str(ticker), str(date), int(dollar_volume))))
return(thistuple)
main()
whether i do summing first or after doesnt matter?
marble jasper
ok then, so you need to concat, and I suggest concat either the string contents of CSV, or as a list
desert oar
you literally only use concatenated_df to compute dollar_volume
by the time you read a file and concat strings
you can pandas csv read it
i seriously doubt that will be faster
i mean try it
but i would be surprised if that beats read_csv then concat
marble jasper
all_data = []
for idx, file in enumerate(csv_files):
  all_data.extend(open(file).readlines()[(1 if idx > 0 else 0):])

data = StringIO("\n".join(all_data))
concatenated_df = pd.read_csv(data, usecols=[5,6])
something like that. I'm not happy with the use of readlines, but at least this'll tell you directionally whether this is any good
these lines replace the following in your existing code:
df_from_each_file = (pd.read_csv(f, usecols=[5, 6]) for f in csv_files)
concatenated_df = pd.concat(df_from_each_file, ignore_index=True)
it does have an additional StringIO, which I'm not a fan of, but I don't see a way for pandas to import from string
desert oar
im very very curious if thats faster than the concat
frank bone
trying
marble jasper
me too. I don't know for sure, but this hasn't been tried yet
frank bone
stringio is not defined? not from io lib?
marble jasper
from io import StringIO
marble jasper
mm hm, now parallelize all the symbols
pandas concat is slow because of all the extra memory allocation and copying that it does, it's basically a deep copy every time
while concatenating lists also allocates memory, it's still much faster
the method is less robust though - you're making certain assumptions about the CSV structure. and that csv reading code can fail under a lot of different circumstances when the CSV structure isn't what you expect, while doing a read_csv on each file is probably more reliable
frank bone
quality of this dataset is incredibly high
so i hope there wont be hiccups
mm hm, now parallelize all the symbols
@marble jasper is this a difficult process? im repeating myself here but my hello world was 3 days ago 😄 for everything you do in 5 minutes ill need 1 hour or more 😄
@desert oar linked some code earlier, still figuring out 😄
marble jasper
python is one of the easier languages to do multiprocessing in
frank bone
@marble jasper what processing module would you recommend?
i think salt recommended "concurrent.futures"?
marble jasper
yes that's good
the other option, and this may be slightly easier to understand is the lower-level multiprocessing library, since there are some relatively easy to understand examples out there using queue-based multiprocessing
but concurrent.futures is higher level. also has good examples
frank bone
so the thing to multiprocess here is the concat
just trying to figure out how
ill watch a youtube vid or two
marble jasper
I was suggesting multiprocessing the stock symbols
so each stock symbol was being processed in parallel, but within each, it was reading the files as it is now
frank bone
ahhh i see
btw for further manipulation of the data how would you store it? think pandas multiindex is fine?
marble jasper
not sure, I haven't had to store pandas dataframes much
frank bone
right now im saving them within tuples in lists, just wondering how easily accessible and processable especially in a time series this is
putting them in multiindex takes some time as well but oh well cant have everything
know why this "NaN" appears?
 modest blaze
Hey all, I'm looking for someone familiar in GIS, and Matplotlib to help me solve a problem I'm working on, this is a paid 1 time gig...
marble jasper
90% of the time the answer is: convert to UTM and do the calculation in meters
 modern canyon
Hello y'all, I'm trying to calculate cosine similarity of a sparse matrix
<63671x30 sparse matrix of type '<class 'numpy.uint8'>'
with 131941 stored elements in Compressed Sparse Row format>
I got a memory error, so I tried messing with the paging file and now it just crashes my whole PC when I try to calculate
any idea as to how to overcome this?
mellow spruce
hello all, I have a table with two columns and I want to append values of columns to a list of dictionaries. I am trying to do it by [{'key1':i} for i in table['column1}, {'key2':j} for j in table['column2']] but its giving me a sysntax error, any ideas?
serene scaffold
@mellow spruce look at table['column1}
there's a quote that isn't closed and a curly brace that isn't opened.
 queen barn
Hey I'm trying to use PyCharm with Anaconda, and for whatever reason, the two don't seem to be communicating with each other. PyCharm isn't showing up in the Anaconda dashboard like it should, and the Pycharm interpreter isn't benefiting from the packages I've installed through the Anaconda Navigator. Am I missing a setting or something?
mellow spruce
@mellow spruce look at
table['column1}
@serene scaffold That was a typo when writing the question. The actual code doesn't have that typo
serene scaffold
okay, what is the real code?
also, it would be good to see which part of the line it was pointing to for the syntax error in the message.
mellow spruce
okay, what is the real code?
@serene scaffold This is a function that takes as an input when the user clicks and a list of dictionaries like[{'key':'value'}]this is the code `def table_output(nclicks, data):
if nclicks:

    table=Table().with_columns([

        'col1',[],

        'col2',[]])

    for dat in data:

        value=int(dat['key2'])

        tt=Table.read_table('routing_'+dat['key1']+'.csv')

        pt=tt.select('col1')

        pt=pt.with_column('col2',np.random.rand(pt.num_rows))

        pt['col2']=pt['col 2']*value

        table.append(pt)

    table.group('col1', collect=sum)

    return [{'key1':i} for i in table['column1}, {'key2':j} for j in table['column2']]`                                                                                                  key 1 and key 2 are used to construct  table rows in plotly dash data tables  I tried
'column1}
@serene scaffold haha I copied from my question again sorry. I am sure it is not like that in the code, I am just using two computrs
serene scaffold
Okay, well let me know what it looks like in the code that's giving you the syntax error.
mellow spruce
I tried list1=[]
    list2=[]

    for i in table['col1']:

        list1.append({'key1':i})

    for j in table['col2']:

       time_list.append({'key 2':j})`
so one of these has the syntax error?
this looks fine to me, syntactically.
assuming that time_list is defined somewhere
mellow spruce
` if nclicks:
    table=Table().with_columns([

        'col1',[],

        'col2',[]])

    for dat in data:

        value=int(dat['key2'])

        tt=Table.read_table('routing_'+dat['key1']+'.csv')

        pt=tt.select('col1')

        pt=pt.with_column('col2',np.random.rand(pt.num_rows))

        pt['col2']=pt['col 2']*value

        table.append(pt)

    table.group('col1', collect=sum)

    return [{'key1':i} for i in table['column1], {'key2':j} for j in table['column2']]  `
in this line return [{'key1':i} for i in table['column1], {'key2':j} for j in table['column2']]
assuming that
time_listis defined somewhere
@serene scaffold it is, just changing a lot of names is hard
serene scaffold
table['column1] there's no close quote
if you're using a code-oriented text editor, it might have a feature to automatically rename your variables.
mellow spruce
Still throws the error, I am using spyder I don't think it edits the code
serene scaffold
I assume spider would have that feature
what did you change the line to be, and what error message?
mellow spruce
return [{'key1':i} for i in table['column1'], {'key2':j} for j in table['column2']] it gives me a syntax error near the coma table['column1'], {'key2':j} here
serene scaffold
aha
looks like you're trying to make two lists, basically
see how {'key1':i} for i in table['column1'] and {'key2':j} for j in table['column2'] pretty much stand on their own?
you could make them both separately and use the plus operator to join them
so return [{'key1':i} for i in table['column1']] + [{'key2':j} for j in table['column2']]
mellow spruce
Thank youuu! I will try that
serene scaffold
No problem.
mellow spruce
No problem.
@serene scaffold It works however, since it's two lists it does not append on the same row
serene scaffold
append on the same row?
mellow spruce
yeas like when I return that to the data for the table it displays the table like this Col 1 | Col 2 val | val | | val
fuck sorry for the formatting
serene scaffold
you can use three backticks on either side to get more consistent formatting.
also works for Python code
!code
arctic wedgeBOT
Discord has support for Markdown, which allows you to post code with full syntax highlighting. Please use these whenever you paste code, as this helps improve the legibility and makes it easier for us to help you.
To do this, use the following method:
```python
print('Hello world!')
```
Note:
• These are backticks, not quotes. Backticks can usually be found on the tilde key.
• You can also use py as the language instead of python
• The language must be on the first line next to the backticks with no space between them
This will result in the following:
print('Hello world!')
     val |
      val|
| val ``` like it append all the list 1 and then all the list 2 instead of putting them on the same rowSorry, I'm not sure that I'm following
one moment
@mellow spruce so list1 and list2 are columns or rows in the table you want to make?
mellow spruce
list 1 and list 2 are rows. What I have right now is the table and the what I want to return from the function is somethin that fills this description data (list of dicts; optional): The contents of the table. The keys of each item in data should match the column IDs. Each item can also have an 'id' key, whose value is its row ID. If there is a column with ID='id' this will display the row ID, otherwise it is just used to reference the row for selections, filtering, etc. Example: [ {'column-1': 4.5, 'column-2': 'montreal', 'column-3': 'canada'}, {'column-1': 8, 'column-2': 'boston', 'column-3': 'america'} ]
So "key" is the column name and the for loop is the values I wan to use as the rows of those columns
furthe reference https://dash.plotly.com/datatable/reference
A comprehensive list of all of the
DataTable properties.
serene scaffold
huh interesting
so if list 1 and 2 are rows, wouldn't you need to transform them into dicts where each element of the lists are mapped to the right key?
mellow spruce
I mean it does not have to be two lists. The table I have from the function has the columns togethere. wouldn't that be easier
?
        table=Table().with_columns([

            'col1',[],

            'col2',[]])

        for dat in data:

            value=int(dat['key2'])

            tt=Table.read_table('routing_'+dat['key1']+'.csv')

            pt=tt.select('col1')

            pt=pt.with_column('col2',np.random.rand(pt.num_rows))

            pt['col2']=pt['col 2']*value

            table.append(pt)

table.group('col1', collect=sum)```up to here is solid I just don't know what to return or how
serene scaffold
return [{'key1':i} for i in table['column1']] + [{'key2':j} for j in table['column2']]
this is what I suggested before. It returns one list
So what about that one list isn't what you wanted?
mellow spruce
let me take a screenshot
mellow spruce
It does not throw me an error so it's not the code it's how it is rendered
Like all the elemnts of one list first and then all the elements of the second list
serene scaffold
I can't really tell what I'm looking at
return [{'key1': i, 'key2': j} for i, j in zip(table['column1'], table['column2'])]
tell me if that works.
I'm just guessing.
mellow spruce
That did the trick. Thank youu for helping me through my mess
You are the python master @serene scaffold
serene scaffold
@mellow spruce I don't know that that's true, but I appreciate you saying so
I figured that you were actually trying to create one list with dictionaries that had two entries, rather than two list of dicts with one entry
so zip gives you items from two iterables at the same time. Can you see how that works?
mellow spruce
so
zipgives you items from two iterables at the same time. Can you see how that works?
@serene scaffold it worked perfectly
serene scaffold
Yay! But do you understand why it worked?
modest rune
I need to do something very simple in pandas... but I think due to my ignorance of linear algebra, I have no idea what type of math is this called which is making even googling for the answer hard. I wrote a mockup of what I want to do. Any help would be greatly appreciated.
import pandas as pd

gain_scenarios = pd.Series({'a':0.34, 'b':0.21, 'c':0.56, 'e':0.11})

stock_data=pd.DataFrame(columns= ['Ticker', 'Shares', 'Cost_Per_Share'],
                           data=[['NFLX'  , 100     , 0.10            ],
                                 ['AAPL'  , 150     , 0.20            ],
                                 ['GOOG'  , 500     , 5.10            ],
                                 ['F'     , 70      , 7.10            ],
                                 ['BKSR'  , 130     , 0.90            ],
                                 ['AMZN'  , 90      , 5.10            ]])

# Run some code that calculates:
# stock_data['Shares'] * (1 + gain_percent) - stock_data['Shares'] * stock_data['Cost_Per_Share']

Desired_Output_df=pd.DataFrame(columns= ['NFLX', 'AAPL', 'GOOG',    'F',  'BKSR',  'AMZN'],
                                  axis=[[   124,    171,  -1880, -403.2,  -995.8,  -338.4],  #a
                                        [   111,  151.5,  -1945, -412.3, -1012.7,  -350.1],  #b
                                        [   146,    204,  -1770, -387.8,  -967.2,  -318.6],  #c
                                        [   101,  136.5,  -1995, -419.3, -1025.7,  -359.1]]) #e
 turbid oyster
not sure why you need linear algebra for that
modest rune
Is it not a matrix multiplication?
turbid oyster
you could set it up as one , but that's probably more clever than useful
you've got the equation you need, just write the function and map across
modest rune
I think map across is maybe what I need to google to learn about?
turbid oyster
a for loop
modest rune
I am trying very very hard not to use any for loops... for performance sake. I already solved this problem using for loops and my code was too slow.
turbid oyster
did you try using pandas .apply() method ?
modest rune
This is the last part... so far, my code has gone from taking 30 seconds to run down to 0.1 seconds
I did... it didn't help speed things up, because I was essentially looping inside the apply function I wrote. Also, I found a document explaining that apply is sometimes better, but if you can implement a vectorized solution the speedup is usually an order of magnitude greater.
I do think the proper matrix multiplication is the correct vectorized approach... I just am clueless about all of that.
I'd even hazard a guess that it is the .dot() function that I need.
turbid oyster
this is completely linear though ?
mellow spruce
Yay! But do you understand why it worked?
@serene scaffold i did. I had never used zip before tho so I’m not sure what that does
turbid oyster
def output(df,gain):
  df_out = df['shares'] * (1 +gain) - df['shares'] * df[costs]
  return df_out
^ this is a vectorized pandas function
its all you need
you just loop over the gain_percentages
serene scaffold
!e
latin = ['a', 'b', 'c']
greek = ['alpha', 'beta', 'gamma']
for l, g in zip(latin, greek):
    print(l, g)
@serene scaffold :white_check_mark: Your eval job has completed with return code 0.
001 | a alpha
002 | b beta
003 | c gamma
If I am looping over the gain_percentages, that is not as vectorized as it can be.
serene scaffold
it iterates over two or more iterables at the same time.
mellow spruce
Ohhh okayy i get it now! Thankss
modest rune
My actual dataset is much larger, so, avoiding the loop is important
turbid oyster
just run it in parallel ?
modest rune
and my actual equation has a lot more going on.
I really think there is a matrix multiplication solution that will be more elegant and more efficient.
I am reading something akin to 'Matrix Math for Dummies' right now... hoping to figure something out.
turbid oyster
look at linear systems for matrices
modest rune
@turbid oyster
figured it out. Pretty sure there is a cleaner way to write this though.
numpy_matrix = np.dot((gain_scenarios.values +
                      1).reshape(-1,1),stock_data['Shares'].values.reshape(1, -1))
matrix_df = pd.DataFrame(numpy_matrix)
matrix_df = matrix_df - stock_data['Shares']*stock_data['Cost_Per_Share']
 fleet moth
Hi people,
I have a problem to create multiple line of chart with pyqt, pandas and plot. ```py
def select(self):
return pd.read_sql_query("SELECT DISTINCT date, interruption_type, priority, SUM(interventiontime) from interruptions GROUP BY interruption_type, priority;", self.conn, index_col="date")
class MplCanvas(FigureCanvasQTAgg):
def init(self, parent=None, width=5, height=4, dpi=100):
fig = Figure(figsize=(width, height), dpi=dpi)
self.axes = fig.add_subplot(111)
super().init(fig)
self.draw()
class StatisticDialog(QMainWindow):
def init(self, *args, **kwargs):
datas = self.db.select()
sc = MplCanvas(self, width=5, height=4, dpi=100)
datas.plot(ax=sc.axes)
 whole rampart
Is anyone here familiar with boto3 in Python 3.8? I am trying to access some AWS data, though when I use sqs.receive_message() (where sqs = a boto3.client()), I get "NoCredentialsError Unable to locate credentials". (Sorry if this is not the right place for asking about AWS stuff)
lapis sequoia
Make sure you've set up authentication correctly
hi, i don't undestand this message error: AttributeError: 'DataFrameGroupBy' object has no attribute 'get'
 leaden snow
can anyone help me understand nlp? or say word embeddings?
turbid oyster
@modest rune - awesome. This is a bit different than what i thought you were going for but i'm glad you found a solution. I thought you were looking for a single matrix operation that would solve your problem which is why i was getting so confused last night i think.
lapis sequoia
Error:
Exception has occurred: TypeError
list indices must be integers or slices, not str
Code:
records = data["records"]

for friends in records["uuidSender"]:
  print(friends)
records is a list
turbid oyster
you would loop over and just check it
lapis sequoia
How it looks like what im working with:
{
  "success": true,
  "records": [
    {
      "_id": "5d19b5140cf260dfc30b711e",
      "uuidSender": "38f67f4aa0c74dd99792aaf6cc401424",
      "uuidReceiver": "a02053c510584e4fb4563ab4d7d72c04",
      "started": 1561965844302
    },
@turbid oyster I am trying to clean up that code I sent you last night, but am running into an issue. Originally I wanted to dot multiply the 4x1 gain_scenarios series by the 1x6 'Shares' column of Stock_Data. That wouldn't work because I kept getting the error ValueError: matrices are not aligned. I could only get it to work by multiplying the two matrices after converting them to numpy arrays.
turbid oyster
when you're doing matrix multiplication number of columns from the first matrix must equal the number of rows in the second matrix
lapis sequoia
I get the results but my embed messes up:
Image:
https://imgur.com/a/4d60WgL
 turbid oyster
so i'm not sure how converting to np array helped you there
modest rune
I am 95% sure the reason it failed is because when I print the gain_scenarios.size and Stock_Data['Shares'].size, they show (4,) and (6,). They are missing the info about the second dimension, which should be 1.
lapis sequoia
for f in records:
  friends = f["uuidSender"]
i tried printing it and it worked fine
but it's just the embed now for some reason
turbid oyster
@leaden snow - i've done a few implementations, but your question is really vague
@modest rune , we're saying the same thing. Try adding 2 gain scenarios see if it fixes the error
 regal flax
ay
modest rune
Two more weird things: (a) The idea of transposing a series to go from 6x1 to 1x6, seems wonky to me... I mean, it is a series, it doesn't have a second dimension. But... the pandas documentation talks about a dot() function for series. (b) The dot() documentation says my 1 dimension must share the same name between the two matrices... Can you even give a series a column name?
modest rune
I believe you are incorrect. Only the two inner dimensions need to be the same for matrix multiplication. 4x1 dot 1x50 will work. But 1x4 dot 1x50 will not.
modest rune
Well, no. I can't get to (4,1)(6,1)... only (4,)(6,). The second dimension is missing.
Which make sense... because they are series, they don't have a second dimension.
turbid oyster
^
modest rune
There is something super simple I am missing here. I need to do something to tell pandas that the 2nd dimension is 1.
modest rune
Yeah... ok, that is what I did and it works. The code looks less pretty AND I hate not knowing how to do it 🙂
turbid oyster
lol i'm glad you figured it out still
modest rune
Especially since there is a pandas.series.dot() function. Just laughing at me!
Staring at me in the face, confirming that you can indeed dot multiply two series.
turbid oyster
🤣
 misty cargo
@leaden snow need help?
leaden snow
@turbid oyster oh i m stuck with word2vec and having confusions
turbid oyster
confusions with ?
leaden snow
how the wordembegging actually works
misty cargo
hmmm
leaden snow
ive red couple of articles but stil couldnot grasp it
turbid oyster
@leaden snow -do you understand PCA or NMF ?
(At least at a high level, you don't need all of the math - just what they're for and how they're useful)

When I started playing with word2vec four years ago I needed (and luckily had) tons of supercomputer time. But because of advances in our understanding of w...
read this - it presents word2vec as matrix decomposition excercise
it will help you understand what's actually being learned from the shallow embedding
leaden snow
@turbid oyster thanks
turbid oyster
np
 proper fable
Hi guys, can I ask something bout data science related problem?
lapis sequoia
Hi everyone,I want to learn about data science
Where should I start?
frank bone
what's the best way to store data in this exact structure? To do time series calculation on a per ticker basis?
so I could say from Date x to y for values in Column "IBM", calculate the following...
Right now I have code that outputs all 3 values in a variable as a str or int
but not sure what method to use to structure it like in pic?
turbid oyster
@proper fable - probably better to just ask instead of for permission
@frank bone , that should work as is. Just do the time series on the column
frank bone
now i have wildly mixed tuples (with correct value pairs though)
i need to have structured columns
maybe i can skip the whole tuple stuff, I just have those 3 values and i need to generate the data like in pic. What's the method for this? SQL? Array?
turbid oyster
pandas
frank bone
the 3 variables get printed on a daily basis like this (it iterates day to day for a year): AMZN 20120103 245661.0966 AAPL 20120103 3835538.1934 IBM 20120103 417207.9702 TSLA 20120103 3198.2502 AMZN 20120104 240235.78290000002 AAPL 20120104 4176408.2924999995 IBM 20120104 64570.466499999995 TSLA 20120104 1983.86 AMZN 20120105 218486.7536 AAPL 20120105 5468868.8049 IBM 20120105 160427.1448 TSLA 20120105 1208.819 AMZN 20120106 445663.6416 AAPL 20120106 5520247.9946 IBM 20120106 107711.8426 TSLA 20120106 17823.2025
what to use? simple panda df or does it need to be multiindex?
would numpy work too?
turbid oyster
what are you using for your time series analysis?
i'd just make a simple df with column names as stock and dates for rows.
you should be able to slice and dice that to your hearts content
frank bone
the goal is to have a sliding window in the end...i.e. watch each stock for example 30 days on continuous basis
then apply moving averages and standard devations
turbid oyster
yeah a pandas dataframe is all you should need then
frank bone
and other stuff i probly dotn know yet
turbid oyster
then just write a windowing function you can apply to the columns
turbid oyster
also google fbprophet for some predictive methods that are fun and easy
frank bone
like when i want to append AAPL volume to the next day
turbid oyster
look at the pandas concat method
frank bone
df = pd.DataFrame([[1, 2], [3, 4]], columns=list('AB'))
But this assumes a fixed column length, no?
turbid oyster
df.concat(df2) <-
you can add stuff to it
thats just an initialization with data
frank bone
@turbid oyster hmm whats wrong about this? df_volume = pd.DataFrame([[]], columns=list()) df2 = pd.DataFrame([[int(volume)]], columns=list(str(ticker))) df_volume.concat(df2)
turbid oyster
whats the error you're getting
frank bone
ValueError: 4 columns passed, passed data had 1 columns
turbid oyster
so what do you think the problem is
turbid oyster
check the append method
modern canyon
hello y'all, I have this dataframe
frank bone
throws this whole thing
modern canyon
I want to pass 'genres' and 'averageRating' columns to a k-nearest neighbors classifier to find similar movies
turbid oyster
oh i see set up the df_volume with column names
df = pd.DataFrame([[1, 2], [3, 4]], columns=list('AB'))
df
   A  B
0  1  2
1  3  4
df2 = pd.DataFrame([[5, 6], [7, 8]], columns=list('AB'))
df.append(df2)
   A  B
0  1  2
1  3  4
0  5  6
1  7  8
how do I encode numerical and non-numerical data into a single array?
turbid oyster
google "categorical encodings"
modern canyon
I already vectorized 'genres' column and ran cosine similarity on it
frank bone
oh i see set up the df_volume with column names
@turbid oyster but i want to create the on them go?
modern canyon
now I just need a way to weight averageRating equally
turbid oyster
@turbid oyster but i want to create the on them go?
you'll need to know your stock tickers symbols at some point right ?
turbid oyster
sure - just put that list in
frank bone
so its not possible to create that column name on the go?
i dont want to put a list together first
turbid oyster
you don't need to type them df=pd.Datafram([x],columns=list_of_symbols)
you kind of have to
frank bone
i iterate through them day to day and one day it might be different than the other
so i have to scan the whole year first just to provide a list?
turbid oyster
probably ? if i understand what you're doing you'll need that information no matter what. You can always do it once and just save that initial list
leaden snow
@misty cargo a word
turbid oyster
that or create your own data structure where each stock ticker get's a dataframe and do the appends at that level
misty cargo
then why the need for str.split()?
leaden snow
word2vec is having trouble distinguishing car and cycle
frank bone
hmmm or SQL would work too right?
turbid oyster
but then you might as well go back to something like :{ ticker_name : [(date,value) ...]}
even with SQL you have to have column names defined
leaden snow
its the same things , str.split change a str to a list of strings @misty cargo
frank bone
cant define them on the go?
turbid oyster
it's not going to alleviate you from structuring your data in a table
SQL is a language for querying tables - so .... you still have to define the schema for your data.
sounds like you want this to be unstructured
i'd take a step back and just figure out what types of question / operations it is you need to do on the data first and let the tell you how to structure it
frank bone
sounds fair enough, i just thought pandas would be more flexible in that regard
turbid oyster
it is
turbid oyster
you can add new columns on the go
turbid oyster
thats the same thing
df = pd.DataFrame(data)
new_column = ['Delhi', 'Bangalore', 'Chennai', 'Patna']
df['City'] = new_column
you just have to provide all the values - its not going to magically know how to fill in blank spots
(or will default them to something that may or may not be useful)
frank bone
oh ill try that then
turbid oyster
seriously though - its probably not a bad excercise for you to take that step back and just ask yourself. What information do i need to get from this data set to accomplish my goals. might make it easier to compose.
modern canyon
now I just need a way to weight averageRating equally
@modern canyon ?
frank bone
seriously though - its probably not a bad excercise for you to take that step back and just ask yourself. What information do i need to get from this data set to accomplish my goals. might make it easier to compose.
@turbid oyster yeah ill probably just make csvs first with the new values, shouldnt be too big
turbid oyster
👍 i have found that dumb solutions are often perfectly functional in the real world 😄
frank bone
however if anyone knows any simple solution to this, let me know 🙂
that doesnt require precompiling anything, just providing the data (including dates and column names) on the go
silk axle
I have a ML model which predicts what number the given image is, with a training accuracy of about 98% over 1,875 samples, which seems pretty good, but when I test the model with images from my PC it seems to nearly always get it wrong? Have tried 13 different images and only 1 was guessed correctly.
turbid oyster
Are you familiar with the concept of over fitting ?
silk axle
Not really; I'm really new to ML (as in this is my second day)
turbid oyster
some reading topics for you : bias/variance tradeoff , overfitting in deep learning models, and sampling
i'm going to guess your 1875 images were the NIST data set ?
turbid oyster
yeah its not your code its your data
the model doesn't generalize for a reason
sampling bias
silk axle
So the sample data has say more 1s than 7s?
So guessing 1s would be more accurate than 7s
So accuracy for 1s might be like 98% but 7s could be much lower, because the model has seen less of them?
@turbid oyster
turbid oyster
that but also the images you learned on probably don't resemble what you're showing the algorithm
silk axle
this is example of what the model learns on
turbid oyster
yes i'm aware
silk axle
this is example of what I'm giving
Do I like need to invert the colours of the bottom one?
Since the colour of the background and actual number is swapped
turbid oyster
its 0-1 encoded ?
silk axle
Yes
Ig just do like val = 1 - val to invert?
I should probs also say I've never really used numpy before so don't really know how to actually do that calculation to each item
silk axle
Wdym?
modest rune
I intentionally want to construct a nested series... a series with a series in each element. I can easily make a dataframe, but I can figure out how to make a nested series. With 1 caveat... I need to do it without any looping.
pale thunder
inverted_image = 1 - original_image
turbid oyster
^
silk axle
Ah, I see
modest rune
My guess is, pandas doesn't want me too, because it is usually a bad idea.
silk axle
Forgot that's a thing you can do in numpy
turbid oyster
@modest rune - probably time to go with a dictionary
silk axle
That made the actual answer closer but still wrong
I'm not really sure how to improve this
turbid oyster
it could be something as simple as the line thicknesses are difference causing the activation functions to not work as well
silk axle
But then I can't really control that?
turbid oyster
sure you can
you provide more training data with a greater variety of representing the data
silk axle
How would I do that?
turbid oyster
make a bunch of number drawings, label them, and feed them into your training set
silk axle
So I'd have likepy images = [(image, label), ...]?
turbid oyster
something like that yeah
turbid oyster
start with maybe 10 of each number ?
silk axle
And presumably I do this instead of the mnist stuff? Or do I do both?
turbid oyster
do both
silk axle
Right, yea that makes sense because then more variety
turbid oyster
^
FYI this conversation is core to the "ethics in AI" the community is dealing with right now
silk axle
I'm just thinking
I'm drawing these, but all the ones I'm drawing would be the same line-width
Ig there's not really anything I can do about that, other than deliberately making different
turbid oyster
look into image manipulations for increasing data size and variety, but a common thing is to do some transformations to skew images a bit to provide some more variety
weary dune
Can someone help me figure out why I got a syntax error?
pale thunder
Missing a closing paren the line above
 reef rain
i want to learn data-science, can someone suggest some online courses (free) that are good?
weary dune
@pale thunder It worked, thanks
 vagrant fiber
hey
I'm still new to python and wanna learn data science, do you guys have any projects to recommend?
frank bone
any idea how to merge same indexes into same row?
just used append for this to print
df2.columns=[ticker]
df = df.append(df2)``` kindred peak
@vagrant fiber check out the courses by https://fast.ai
vagrant fiber
Thanks
frank bone
got it df = pd.concat([df, df2], axis=1)
silk axle
@turbid oyster ```py
for image_file in os.listdir(_dir):
number_in_image = int(image_file[0])
image = plt.imread(f"{_dir}/{image_file}")
## Resize image to 28x28x1 and invert
resized_image =  1 - resize(new_image, (28, 28, 1))
# print(resized_image)

## Show image
image = np.array(resized_image, dtype='float')
image, int(image_file[0])
pixels = image.reshape((28, 28))
plt.imshow(pixels)
plt.show()
break  # only do for one file as test
```how would I now add the image to an array alongside the number_in_image and in a format I can use to add to the x_train of mnist.load_data()
Now that I think about it, wouldn't I be adding the image to x_train and the number_in_image to y_train?
Either way, not sure how to do
Also not sure what datatypes I'm meant to be using (what datatypes are returned from mnist.load_data())
(@me upon response please)
proper fable
Hi guys sorry to interrupt, I wanna ask a little problem. So there is a dataset about cars. And I have to find what is the variables that influence the price column. What technique should I use for this task and why. Thanks in advance.
Here is the columns of the data set
And here is the shape of it
lapis sequoia
Well you could calculate the correlation of the pairs of features and see how they are correlated with Price
If you want to use this for ML, I suggest you just calculate a correlation matrix and remove features that are highly correlated. Otherwise you could also use Principal Component Analysis (PCA) which is often used for dimensionality reduction
modest rune
Pounding my head against the wall again. I wrote a simplified version of my problem. Basically, I can do what I want if I type in the nested 1D array, but if I save it to a variable first, it doesn't work. I think I understand the difference between the two approaches, but I need to use a variable and I need to find a way to get this to work.
import pandas as pd
import numpy as np

stock_data=pd.DataFrame(columns=['Ticker','Shares','Cost_Per_Share'],
                        data=  [[  'NFLX',   100.0,            0.10],
                                [  'AAPL',   150.0,            0.20],
                                [  'GOOG',   500.0,            5.10],
                                [     'F',    70.0,            7.10],
                                [  'BKSR',   130.0,            0.90],
                                [  'AMZN',    90.0,            5.10]])

# Works! AND Does what I want, but I need to use a variable like below
stock_data['Nested_Array_Works'] =     [[1,2,3],
                                        [4,2,3],
                                        [1,2,3],
                                        [1,7,3],
                                        [1,2,3],
                                        [1,2,3]]

print(stock_data)

# Exact same array, but saved to a numpy_array variable first
numpy_array =                 np.array([[1,2,3],
                                        [4,2,3],
                                        [1,2,3],
                                        [1,7,3],
                                        [1,2,3],
                                        [1,2,3]])

# Doesn't Work, Exception: Wrong number of items passed 3, placement implies 1
stock_data['Nested_Array_No_Worky'] = numpy_array
Output:
  Ticker  Shares  Cost_Per_Share Nested_Array_Works
0   NFLX   100.0             0.1          [1, 2, 3]
1   AAPL   150.0             0.2          [4, 2, 3]
2   GOOG   500.0             5.1          [1, 2, 3]
3      F    70.0             7.1          [1, 7, 3]
4   BKSR   130.0             0.9          [1, 2, 3]
5   AMZN    90.0             5.1          [1, 2, 3]

...
...
File "C:\Users\HomeLaptop\AppData\Local\Programs\Python\Python38\lib\site-packages\pandas\core\internals\blocks.py", line 124, in __init__
    raise ValueError(
ValueError: Wrong number of items passed 3, placement implies 1
 worldly kindle
@modest rune can you cast np.array() as a list?
numpy_array = list(np.array([[1,2,3], [4,2,3], [1,2,3], [1,7,3], [1,2,3], [1,2,3]]))
modest rune
Not having a computer science background, I have heard that casting is bad. I think it will fix the problem though. I'll give it a try.
worldly kindle
it did for me
i don't have a CS background either. haven't heard that though. good to know(?)
do you know in what context?
i defer to others though and their expertise
modest rune
well... I don't think calling list() is actually casting
I think that is a conversion
which is safe
Hopefully someone more knowledgable can chime in
proper fable
If you want to use this for ML, I suggest you just calculate a correlation matrix and remove features that are highly correlated. Otherwise you could also use Principal Component Analysis (PCA) which is often used for dimensionality reduction
@lapis sequoia thanks for the solution, how can I decides which are the best correlation methods to use? is it enough to just calculate the correlation or should I fit it into a model then compare to each variable importance to find the best features ?
modest rune
@worldly kindle I appreciate the solution. The only concern I have now is... will there be a major performance hit by converting the numpy array to a list? Because, with my actual code I will be doing that conversion much more frequently on much larger nested arrays.
Yeah... I think I am going to need a solution in which I don't spend time converting to a list first. I was half hoping there was a way to add a column to a dataframe without pandas assuming it knows what I want it to do.
balmy kraken
hey guys
so i’ve been working on a dataset that has columns for date and then columns for fund names. Anyone knows how i could “merge” the dates into an index so that for every date i get the funds names in the column and the other infos as well?
worldly kindle
@modest rune no prob bob. also, calling list() is casting/converting. separately, why not assign the list to the variable?
like so, numpy_array = [[1,2,3], [4,2,3], [1,2,3], [1,7,3], [1,2,3], [1,2,3]]
it has to be np.array()
?
modest rune
I think that converting means, going through a proper process to go from one datatype to another. And casting is leaving the data untouched in memory and simply telling the compiler to pretend it is something else (I could be wrong)
balmy kraken
Something like
Date Fund
19/03. X
20/03. X
21/03. X
19/03. Y
20/03. Y
21/03. Y
Would turn into
Date. Fund
19/03. X
Y
20/03. X
Y
21/03. X
Y
modest rune
Yes, the data I will be consuming is already an np.array()
balmy kraken
anyone could help me on this? it’d be greatly appreciated
uncut shadow
@modest rune where are you trying to put this np.array? I mean, what are you actually trying to do cuz u didn't show what should be in this stock_data[here]
modest rune
@uncut shadow the Output I posted shows how I want it to show up in the dataframe
uncut shadow
@balmy kraken maybe this will answer your question https://stackoverflow.com/questions/36292959/pandas-merge-data-frames-on-datetime-index

Stack Overflow
I have the following two dataframes that I have set date to DateTime Index df.set_index(pd.to_datetime(df['date']), inplace=True) and would like to merge or join on date:
df.head(5)
catcod...
oh ok
modest rune
@worldly kindle some good discussion on Casting versus Converting in this Stackoverflow question.
https://stackoverflow.com/questions/3166840/what-is-the-difference-between-casting-and-conversion
I guess my definition is a common one, but often times casting IS converting. As one commenter put it "I would guess that the term "cast" has a bit of a muddy definition and usage."
Stack Overflow
Eric Lippert's comments in this question have left me thoroughly confused. What is the difference between casting and conversion in C#?
uncut shadow
@modest rune check this https://stackoverflow.com/questions/18646076/add-numpy-array-as-column-to-pandas-data-frame
Stack Overflow
I have a Pandas data frame object of shape (X,Y) that looks like this:
[[1, 2, 3],
[4, 5, 6],
[7, 8, 9]]
and a numpy sparse matrix (CSC) of shape (X,Z) that looks something like this
[[0, 1, 0],...
worldly kindle
so essentially passing a nested array into a dataframe is your problem that you're trying to solve?
@worldly kindle some good discussion on Casting versus Converting in this Stackoverflow question.
https://stackoverflow.com/questions/3166840/what-is-the-difference-between-casting-and-conversionI guess my definition is a common one, but often times casting IS converting. As one commenter put it "I would guess that the term "cast" has a bit of a muddy definition and usage."
@modest rune gotcha
Stack Overflow
Eric Lippert's comments in this question have left me thoroughly confused. What is the difference between casting and conversion in C#?
modest rune
@uncut shadow your googling skills are impressive. I hope I can fix it now.
uncut shadow
👍
modest rune
@worldly kindleso essentially passing a nested array into a dataframe is your problem that you're trying to solve?
Pretty much.
@uncut shadow what google keywords did you use to find that stackoverflow question? Teach me to fish... cuz I have been googling like crazy for that for hours.
uncut shadow
just how to create a new column with numpy array in pandas
modest rune
Well... I am sure I googled something very similar to that... thanks for doing the legwork for me!
uncut shadow
👍
modest rune
@uncut shadow turns out the stackoverflow solution is the same as @worldly kindle's solution... Convert the data to a list then append to a column. BUT, the stackoverflow answers helped me decide there are no better solutions and most of the experts said nested arrays inside a dataframe are a bad idea, one person suggested looking into Panels (depreciated) and multi indexing as a way to avoid the nested arrays.
uncut shadow
yeah, nested arrays aren't the best thing you could do in dataframe
worldly kindle
i'm not sure it is necessary to call np.array() or call list(). maybe try to simply assign the multi-dimensional array.
modest rune
Yeah, I just haven't come up with a way to cleanly associate the array with the dataframe's row. I am totally ok with managing two different dataframes if I can find a clean way to reference once from the other.
worldly kindle
(i am not sure how simplified code compares to the actual code)
modest rune
i'm not sure it is necessary to call np.array() or call list(). maybe try to simply assign the multi-dimensional array.
@worldly kindle
I am 99% sure I tried that and ran into a similar error.
I guess if I have two dataframes, that both have the same height, but differing widthss, all I need to do is have them share an index and that will link them together.
@void anvil for the past 3 days I have been dealing with similar problems. Yes, there are ways you can make substantial improvements.
A quick change to your code that should achieve decent improvement, don't use append. Instead, create an array of series that you build. Then, at the very end, use concat on that array, and generate the dataframe in one fell swoop.
Is there something better than append? Should I keep all the queries in memory then merge all the dataframes?
@void anvil
That would be even better than what I suggested.
Do zero conversions on your data as you read it in. Then, once it is all in memory, use one of Pandas builtin functions to convert the data directly into a dataframe. That will be somewhere between 50x and 500x faster than your current approach.
Do you mind sharing the format of the data you are querying? Is it json? xml?
from a requests call?
Here is something to burn into your brain and it will help you find the best ways to improve your performance. Iterating and data manipulation in python is SLOW. So, numpy and pandas get around this by asking the user to send them as large of chunks of memory as possible along with instructions on how to manipulate that data. Then pandas and numpy do all of their work in C, get the desired result, and send it back to python. So, anytime you can find a way to send larger chunks of data at a time to pandas or numpy, you will be rewarded with speed improvements.
If you are doing some sort of streaming, you will have to find a balance between chunking your data and keeping your app responsive.
worldly kindle
@worldly kindle
I am 99% sure I tried that and ran into a similar error.
@modest rune gotcha. I must have coded it before thinking i was assigning a 2D array to the new col but I must have been converted it with list().