#data-science-and-ml
1 messages · Page 233 of 1
 desert oar
 tardy portal
alright so since running the contains method, can't I just assign values to the column that if its either true or false?
 arctic wedgeBOT
6. No spamming or unapproved advertising, including requests for paid work. Open-source projects can be showcased in #show-your-projects.
desert oar
@lapis sequoia
tardy portal
i'm running into an issue, but something along the lines of this: df_churn[(df_churn['AutoPayment'] == 'False'), 'AutoPayment'] = 0
tardy portal
df_churn[(df_churn['AutoPayment'] == 'False'), 'AutoPayment'] = 0
df_churn[(df_churn['AutoPayment'] == 'True'), 'AutoPayment'] = 1```hahaha
desert oar
df_churn['AutoPayment'].str.contains('automatic') returns a new series
tardy portal
yikes department?
desert oar
almost nothing in pandas operates "in place" like that
at least without specifically requesting it
in fact almost nothing in python operates like that
well ok some methods on collections do
like list.append et al
tardy portal
alrighty, let me see if I can figure this out, but there has to be a way to write it where the false and true values return 1 and 0
desert oar
use .loc
remember
.loc allows you to select rows w/ a boolean series
right?
.str.contains returns... a boolean series
i'll give you a hint because i don't want you to spend all day on this: make a column of 0s and then assign 1s to the rows that meet your desired condition
tardy portal
so then I should use the .str.find('automatic')
tardy portal
should I convert the new column to numeric?
desert oar
no
again
more simple
make a new column of 0s
subset the rows that meet your desired condition
assign 1 to those rows
that's it
tardy portal
am I able to do that without creating a new column?
desert oar
make a new column of 0s
tardy portal
the question only requests only 1 column to be added thats why I ask
desert oar
?
make a new columns of 0s, and replace the data with 1s where you need it to be 1
yes you are creating exactly 1 new column in the dataframe
tardy portal
which I already did which contains the values of True or False
desert oar
you don't need to do that
you know how to use .loc with a series of True and False values right?
desert oar
you're doing too much still
back up
and follow the steps i provided for you
you just have df_churn and the 'PaymentMethod' column
make me a new column called 'AutoPayement' that contains only 0s
just show me how to do that
desert oar
yes
this shouldn't be difficult, again don't think so hard
literally just make a new column in a dataframe
with any name
full of 0s
show me how to do that, 1 line
tardy portal
df_churn['AutoPayment'] = 0
desert oar
great
so
now
some of those values need to be 1s
right now they are all 0s
how do you do that, with .loc
tardy portal
df_churn.loc[df_churn['AutoPayment'] == 0]
tardy portal
its locating all the values of 0 within that column?
desert oar
sure
but we already know that's literally every value
so df_churn['AutoPayment'] == 0 is just a Series containing only True
which isn't helpful
tardy portal
Okay
desert oar
df_churn['AutoPayment'] = 0
df_churn.loc[a_series_containing_boolean_values, 'AutoPayment'] = 1
does this make sense to you
again, way simpler than you're trying to make it out to be
tardy portal
so df_churn.loc[df_churn['PaymentMethod'].str.contains('automatic'0, 'AutoPayment'] = 1?
desert oar
fix your typo 🙂
tardy portal
df_churn.loc[df_churn['PaymentMethod'].str.contains('automatic'), 'AutoPayment'] = 1
tardy portal
yes, but I didn't know you could utilize the .loc method that way
desert oar
ah
yeah
i have no idea how your instructor expected you to do this without knowing anything useful about pandas
hopefully that helps with your other assignments..
tardy portal
the thing is everything is online, so she uploads videos per module, but does not go into depth
tardy portal
which is annoying because i'm paying over 1k for this class
 slim fox
drawbacks of online classes
desert oar
yeah :/
tardy portal
3 hecking credits
desert oar
that said a lot of instructors would just do the same in lecture
so at least you get to do it at home in your pajamas or w/e
slim fox

tardy portal
you should change your name to 'salt rock champ'
desert oar
sorry that took so long but hopefully it was educational
slim fox
we had few professors just reading their slides in monotonous voice
slim fox
it is. we literally slept few lectures
and just went to the park few times
cause.... you miss nothing
as he gives .ppts
well. gave back then
considering his age he might no longer teach
tardy portal
soo...I have one more question and ill be out of your guys' head for today
@desert oar if that's okay?
its in relation to the previous question
desert oar
what would you want such a method to do
tardy portal
df_churn.loc[df_churn['Churn'] != 'Yes', 'AutoPayment'].agg()```am I on the right track here?
 lapis sequoia
hi
Im making a bar graph in matplotlib, but my xaxis it too squished, how could i fix this?
tardy portal
so should I find the sum and then find the percentage?
desert oar
sure
or you can do .mean(), that's a nice shortcut
but stop and think for a sec about why .mean works
before you just do it
tardy portal
but the thing is its asking for a percentage of two values within a column
tardy portal
mean is just the average I don't think that helps, from my understanding atleast
desert oar
yeah
it works, trust me
but don't use it
it's just a math trick
use .sum() and divide
go with what make sense to you
you'll learn tricks later
tardy portal
i'm trying to figure it out why you would use mean
I guess its one step less to take?
desert oar
yeah. again not important
just a shortcut
and the point of homework isn't to practice shortcuts
i shouldn't have even mentioned it
tardy portal
let me see if I can figure this out on my own and return the code and see if its correct
is there a way to combine both arguments and divide two times?
one with yes and one with no?
df_churn.loc[(df_churn['Churn'] == 'Yes') & (df_churn['Churn'] 1= 'Yes'), 'AutoPayment'].sum()
so that would be the total
for some reason that returns 0
desert oar
pandas and python aren't magic
what does (df_churn['Churn'] == 'Yes') & (df_churn['Churn'] != 'Yes') evaluate to?
tardy portal
0 technically because its combining rows with both values?
desert oar
df_churn['Churn'] == 'Yes' evaluates to a Series
containing True and False values
i.e. dtype bool
df_churn['Churn'] != 'Yes' also evaluates to a bool Series
& does elementwise logical operations on 2 Series objects
so (df_churn['Churn'] == 'Yes') & (df_churn['Churn'] != 'Yes') will be a series containing all False
tardy portal
but within the dataframe under that column it only shows 'yes' and 'no' values
desert oar
huh?
df_churn['Churn'] contains whatever
df_churn['Churn'] == 'Yes' evaluates to a new Series
containing only True and False
that is how == works in pandas
tardy portal
desert oar
df_churn['Churn'] == 'Yes' is not the same as df_churn['Churn']
tardy portal
ahh okay so it should just be '='
desert oar
no
no no no
= is assigment
python, like most programming languages, consists largely of evaluating sections of code called expressions
df_churn['Churn'] == 'Yes' is an expression
it's like 3 + 4
that's a math expression, which evaluates to some result according to how 3, 4, and + are defined
in this case we know + is addition and that 3+4 should evaluate to 7
tardy portal
so how am I suppose to use the .loc method for both yes and no values for the churn column?
desert oar
do it separately like you did the first time?
do one for yes and one for no
or use what you know mathematically about how percentages work
either one is valid
desert oar
yeah it's the same reason i regretted using the .mean trick
don't look for a clever elegant solution while you're still learning the basics
desert oar
that doesn't even make sense, so fortunately you don't have to do it
compute the thing you want, in this case a sum
plop it into a new variable
and go from there
tardy portal
is there a total method I could pass? similar to .sum?
desert oar
what do you mean?
something that computes "the number of True values in this Series"?
tardy portal
I want to be able to combine both True and False values to get a total
desert oar
im still not sure i understand what you're asking
tardy portal
in order to find the percentage
desert oar
look at the question you're being asked
q 12
it's asking something very straightforward and you already posted the answer
tardy portal
I did not post the answer, I wish I did
desert oar
state, in plain words, how you'd solve q 12
tardy portal
yeah take both sums and separately divide by the total
tardy portal
df_churn.loc[df_churn['Churn'] == 'Yes', 'AutoPayment'] / df_churn['Churn']
desert oar
explain to me what that code does
tardy portal
dividing the sum by the total, but that does not work
desert oar
that's because that isn't what the code does 🙂
df_churn.loc[df_churn['Churn'] == 'Yes', 'AutoPayment'] what does this evaluate to?
tardy portal
all of the 'yes' values in the churn column that also has autopayment?
desert oar
more specifically
a Series, containing values from the 'AutoPayment' column such that df_churn == 'Yes'
so a Series of 1s and 0s
tardy portal
shouldn't it be df_churn.loc[df_churn['AutoPayment'] == 0, 'Churn'].sum()
tardy portal
nvm the last code I posted, so df_churn.loc[df_churn['Churn'] == 'Yes', 'AutoPayment'].sum() should locate the 'Yes' values from the 'Churn' column in which also includes the 0 values from the 'AutoPayment' column?
desert oar
the code is right but your explanation doesn't make sense
the first argument to .loc selects rows
the 2nd argument selects columns
so this is values from the 'AutoPayment' column, from rows where df_churn['Churn'] == 'Yes' contains True
tardy portal
I think i'm conducting the answer incorrectly
desert oar
i think you need to think a bit more "methodically" about code
less MS Word more MS Paint, if that makes any sense
it looks like you're kind of just guessing at how to put these lines of code together
rather than being careful to write code that specifically corresponds to the logic you want
i don't mean to be insulting by saying that. it's a common thing that novices try to do
tardy portal
no offense taken
desert oar
coding is a continuous process of 1) writing step by step logic, aka an "algorithm", 2) figuring out how to express that logic with the tools provided to you by the programming language
sometimes it's iterative: you think you've expressed your logic correctly, then you realize there's no way to implement it in the way that you wanted
so you have to go back and revise your logic
etc
and always always remember that a computer, and by extension a programming language like python, is stupid
it cannot know what you mean
it can only follow the exact instructions you provide to it
tardy portal
no i understand that
desert oar
so you have to be very clear about what you want to do
in order to provide the correct instructions
good
hopefully that helps you adjust your thinking for the rest of these problems
tardy portal
i'm just trying to figure out the total so I can divide and find the percentages, but i'm not sure how to do that correctly
desert oar
df_churn.loc[df_churn['Churn'] == 'Yes', 'AutoPayment'].sum()
what do you think this code does?
tardy portal
so its taking all of the 'yes' values from the rows of 'Churn'
is that correct/
?*
desert oar
not quite
it's taking all the rows from df_churn
where ``Churn'is'Yes'`
see the difference?
tardy portal
yes
desert oar
good, continue
tardy portal
with that said, it then applies that to the 'AutoPayment' column
desert oar
yes
hint: it's correct
i just want to make sure you understand why
and that it isn't a guess
tardy portal
alright so going back to finding the percentage, I simply cannot divide in order to find the percentage
desert oar
what do you mean
you know the sum, i.e. the # of elements that meet the criterion you want
just divide that sum by the total, no?
tardy portal
so I have the sum total of both groups that have/don't have autopayments
 urban quarry
could anyone here help me choose a bayesian nonparametric clustering technique?
Or rather, if anyone is an expert in cluster analysis, please let me know, cuz i have a very specific question
 vale tundra
Hey guys^ Any idea on how i can resize images to like say 128x128 pixels?
 plush mango
I got a dict inside another dict I need to access the second dict
how do i do that pls help
 inland rivet
dic={'key':{'key2':'value'}}
print(dic['key']['key2'])

output: value
 plucky harness
How to collect the language data and create our own custom or artificial dataset? Any suggestions?
 ripe forge
The dataset depends on the task. So, what kind of task are you thinking of doing
And what does language data mean
plucky harness
@ripe forge Suppose if i have to collect an ancient language data and the images of that language is very few and data augmentation is not an option here. So what strategies we can apply to get more images data of that language?
ripe forge
Oh so images. Well the augmentation is the way, why would that not be an option?
lapis sequoia
Hi, who can suggest me a project that can be done with libraries (PANDA, MATPLOTLIB), it's to practice in data science with python
 umbral aspen
Hi guys
Do you know of any pretrained models which are able to determine hair color?
I find a few examples of being able to identify hair for the purpose of replacing it or changing the color but nothing around just identifying the hair color
Preferably an example using tensorflow/keras
lapis sequoia
@lapis sequoia I use Matplotlib which also supports beautiful LaTex fonts for publishing.
@lapis sequoia How
@lapis sequoia Such as plt.xlabel(r'$t*U/C$',fontsize=12), label=r'U'
@lapis sequoia ok, can you suggest me a project or online project that can be done with libraries (PANDA, MATPLOTLIB), it's to practice in data science with python
lapis sequoia
@lapis sequoia You should listen someone who knows things. e.g. @uncut shadow 🙂
@lapis sequoia thanks
 uncut shadow
well, kaggle is an answer https://www.kaggle.com/datasets You can find there many datasets and use them for your own purposes. you can also do some googling and there is a huge chance you are going to find something intersting there. I have also found some on datacamp which might also look intersting https://www.datacamp.com/projects/topic:data_visualization
Download Open Datasets on 1000s of Projects + Share Projects on One Platform. Explore Popular Topics Like Government, Sports, Medicine, Fintech, Food, More. Flexible Data Ingestion.
 lapis sequoia
@uncut shadow thanks
 haughty narwhal
Hey guys! Really simple question with Sympy 1.6 and python 3.7.7. I'm following along with the book "Numerical Python" by Robert Johannson, and this simple code returns a different result
g = sympy.Function("g")
g(x, y, z)
print(g.free_symbols)```

The author gets {x, y, z}, as he was successful in applying the domain variables to g. I get the empty set, however:
```set()```Did the library's behavior change recently, or am I missing a simple concept?
 chilly geyser
I think you have the wrong code
It's not
g = sympy.Function("g")
It is
g = sympy.Function("g")(x, y, z)
@chilly geyser Thanks a lot! The book seemed to imply that you can define a function and assign a domain afterward, but after rereading a few times, it seems that I made an incorrect assumption. Thanks again.
umbral aspen
@mellow saffron You should be able to detect leaves of certain plants...But without more info it is hard to know how well it will work
What you will need is a lot of test images with the correct leaves labelled...The images should be similar to what you plan to feed to your model as well
If the leaves are easy to identify (say bay leave vs maple leaf) then it could work well
umbral aspen
well it can detect objects and where they are in the image
So then you should be able to calculate the pixels between at least
Then based on your camera etc you could approximate the distance
I would also search around...maybe someone has already created a leaf classifying model
 idle otter
a3 = np.array([[
[1, 2, 3], [4, 5, 6], [7, 8, 9],
[1, 2, 3], [4, 5, 6], [7, 8, 9]
]])
the shape of the array is (1, 6, 3) what does the 1, 6, and the 3 represent?
 chilly gust
the length of the nested arrays
you have 1 array containing 6 arrays of 3 scalars each
idle otter
ah thanks
 flat quest
well it depends do you just want a classifier, and then u control where the robot moves?
Or a reinforcement model where the robot learns where to move on his own. For that you'll need more than a leaf classification model @mellow saffron
well yeah
But you have to options. Code in the instructions for what the robot should do if it detects a leaf. Or let the model learn how to do it by itself using a reinforcement model
inland rivet
I'm taking the "Introduction to Data Science with Python" course by the University of Chicago on Coursera.
flat quest
well reinforcement learning is based on three concepts
agent, environment, and reward. The learning would be based on the reward (now this can be an immediate reward or a long term reward - which is more difficult to interpret)
Anyways, it would probably be best to take a look into RL, and try some basic models with it. That should help to give you an intuition of how RL works
@mellow saffron
lapis sequoia
I'm working with this and I can't get this to work:
{
"Country": "Albania",
"CountryCode": "AL",
"Slug": "albania",
"NewConfirmed": 93,
"TotalConfirmed": 3371,
"NewDeaths": 4,
"TotalDeaths": 89,
"NewRecovered": 6,
"TotalRecovered": 1881,
"Date": "2020-07-12T14:23:45Z",
"Premium": {}
},
Code:
https://paste.pythondiscord.com/hasotizuga.py
flat quest
which part isn't working
lapis sequoia
I have a .dat file consists of floating numbers which is ~1 GB. I use regex search via:
for line in lines:
match=re.search(self.forceRegex,line)
if match:
self.time.append(float(match.group(1)))
But since it's too huge, I'm at the "speed border" of Python I think. I can't open it. My laptop freezes. What do you think?
lapis sequoia
@flat quest im trying to make a search function like they choose what country but i cant figure out how to do it
flat quest
its a dict not a csv?
so the fetch returns a list of dicts? then you can just iterate over the dict to get the ones that have dict.country==country
 unkempt stone
hii! i’m very new to Matplotlib so I want to ask if it is possible to use a script and a csv file (with datas) to generate many different graphs (same kind of graph, but different data) at the same time?
 coarse spire
Hi, given an array of timestamps (or seconds) what would be the best way of finding large clusters? Sometimes they happen in the same minute but some other times they may be split out over the course of 15-30 minute of (semi) continuous activity.
I made histograms with 5 minute intervals but I would like some programmatic way so that I can feed it into some other analysis.
@unkempt stone You might want to look at pandas, you can use that to read in a csv file and it has some plotting functions built on top of matplotlib like histograms, bar charts, etc.
https://pandas.pydata.org/pandas-docs/stable/reference/api/pandas.DataFrame.plot.html
if you check the sidebar it has bar, box, hist, pie, etc.
 agile anvil
I have a 200 row, 51 column pandas dataframe of floats, and I want to delete all the columns which don't have one of the top ten values in the last row. Any ideas? My google/stackoverflow-fu is weak on this one.
looking at https://stackoverflow.com/questions/58758098/how-can-i-remove-columns-of-pandas-dataframe-conditional-on-last-row-values and just feeling dazed, knowing it's close....

Stack Overflow
Given a data-frame like:
A B C
2019-11-02 120 25 11
2019-11-03 119 28 15
2019-11-04 115 23 18
2019-11-05 119 30 20
2019-11-06 121 32 25
2019-11-07 117 24 30
I would like to r...
 sonic haven
DEVICE_PLACEMENT_EXPLICIT = pywrap_tensorflow.TFE_DEVICE_PLACEMENT_EXPLICIT
AttributeError: module 'tensorflow.python.pywrap_tensorflow' has no attribute 'TFE_DEVICE_PLACEMENT_EXPLICIT'
is there a way to fix?
 worn stratus
I'm trying to figure out the right way to store some data. First I just want to get it in a dataframe though. The data is essentially a name as a string, then a long series of timsetamp/value pairs. E.g
('name 2', [(timestamp, value), (timestamp2, value), (timestamp3,value)...]),
('name 3', [(timestamp, value), (timestamp2, value), (timestamp3,value)...])]```
What I can't figure out is how to jam the timestamp pairs into a dataframe sensibly, any suggestions would be appreciated glacial rune
If I have a folder containing multiple text files containing an hour's worth of data (names include timestamps), is there a way I can read all of them in?
e.g. data files called
data-2020-07-01-00-00-00.txt
data-2020-07-01-01-00-00.txt
data-2020-07-01-02-00-00.txt
and then can I automate writing them out to a slightly different file name? e.g. just add _02 at the end i.e
data-2020-07-01-00-00-00_02.txt
data-2020-07-01-01-00-00_02.txt
data-2020-07-01-02-00-00_02.txt
could I make a list of the imported files and add the _02 to the end and use that list to create the text files I want?
 chrome barn
for f in os.listdir('folder/'):
    if f.endswith('.txt'):
        file_name = f.replace(".txt", "")
        os.rename{f'{f}',f'{file_name}_02.txt'}
you could use something like this or if you want to read them into something like a dataframe replace the inner part of the loop with pd.read_csv for the file and then output with pd.to_csv with the desired filenam
 acoustic halo
If i save a keras model with model.save(), will it save the training history dict as well?
 small ermine
Guys, where can i start learning some basic stuff about data sciences..?..before i enroll in a major course or something.
 worldly elk
Hi All,
What is the best Javascript method to crawl links, without sending 2 request each time.
I use Request and Selenium today, so i can get the http status code, because it doesn't exist in Selenium.
What is a better way of doing this? anybody 🙂
inland rivet
What's the difference between skiprows and header in read_excel()?
 spiral peak
Header will take the first row (or the row you specify) as the column labels for the dataframe. Skiprows won't import the rows at the beginning that you specify.
sonic haven
DEVICE_PLACEMENT_EXPLICIT = pywrap_tensorflow.TFE_DEVICE_PLACEMENT_EXPLICIT
AttributeError: module 'tensorflow.python.pywrap_tensorflow' has no attribute 'TFE_DEVICE_PLACEMENT_EXPLICIT'
any1 know how to fix
sonic haven
class GNMTAttentionMultiCell(tf.nn.rnn_cell.MultiRNNCell):
AttributeError: module 'tensorflow._api.v2.nn' has no attribute 'rnn_cell'
desert oar
https://towardsdatascience.com/sktime-a-unified-python-library-for-time-series-machine-learning-3c103c139a55 from another discord, seems interesting

Medium
The “sklearn” for time series forecasting, classification, and regression
lapis sequoia
its a dict not a csv?
@flat quest Yes it's a dict
so the fetch returns a list of dicts? then you can just iterate over the dict to get the ones that have dict.country==country
@flat quest See that's the problem I'm having and I can't figure out how to do that and I tried checking out some videos on how to work with json in Python .
I also get this error
Exception has occurred: TypeError
string indices must be integers
I just checked and the Countries im looking for to get a name on is a list
"Countries": [
{
"Country": "Afghanistan",
"CountryCode": "AF",
"Slug": "afghanistan",
"NewConfirmed": 85,
"TotalConfirmed": 34451,
"NewDeaths": 16,
"TotalDeaths": 1010,
"NewRecovered": 81,
"TotalRecovered": 21216,
"Date": "2020-07-13T16:12:18Z",
"Premium": {}
},
This is an example after alphabetical order
Anyone have experience with computer vision? I'm trying to develop a way to effectively detect and crop images of rivets from pictures of airplane panels to be run through a CNN to determine if they are damaged or not. If anyone has any input on a good way to do this I would appreciate it! I've tried to use feature mapping in opencv but not having much luck or consistency
flat quest
so object detection? @lapis sequoia there's a whole field of research on that
The most successful algorithms have been rcnn's, yolo, ssd, and more recently something like facebook's detr.
i think this part's your problem @lapis sequoia
countryname = country["Country"][country]
If its a list, you can't access it by name
lapis sequoia
countryname = data["Countries"][0]["Country"]
This would work but it wouldn't take what im searching for this would the take the first
Which is:
"Countries": [
{
"Country": "Afghanistan",
"CountryCode": "AF",
"Slug": "afghanistan",
"NewConfirmed": 85,
"TotalConfirmed": 34451,
"NewDeaths": 16,
"TotalDeaths": 1010,
"NewRecovered": 81,
"TotalRecovered": 21216,
"Date": "2020-07-13T16:12:18Z",
"Premium": {}
},
flat quest
so what you could do is simply loop over each country in countries
for data_country in data["countries"]:

print(data_country[country])
yeah np
lapis sequoia
@flat quest So we actually have a resnet CNN trained to detect if a rivet is damaged or not, the goal now is to be able to fly a drone around a plane and extract the rivets from photos to send through that trained CNN. Do you think yolo would be a good tool to actually detect the rivets to be extracted?
this is pretty weird:
for data_country in data["Countries"]:
  countryname = data_country[country]
  print(countryname)
I realized this may all be really basic stuff, but to be honest I was hired as an intern to a start up that I'm pretty underqualified for. I'm basically the only person in the datascience department of this project and im only a junior in a CS degree so im pretty clueless with a lot of this stuff.
flat quest
yeah @lapis sequoia yolo should do pretty well, it won't have as high of an accuracy as something like rcnn, but its a lot faster
lapis sequoia
so i get this error:
Exception has occurred: KeyError
'Sweden'
but it's correct
{
      "Country": "Sweden",
      "CountryCode": "SE",
      "Slug": "sweden",
      "NewConfirmed": 0,
      "TotalConfirmed": 74898,
      "NewDeaths": 0,
      "TotalDeaths": 5526,
      "NewRecovered": 0,
      "TotalRecovered": 0,
      "Date": "2020-07-13T16:12:18Z",
      "Premium": {}
    },
Awesome thanks, I'll give that a try
flat quest
yeah thats pretty common nowadays. A lot of companies are hiring anyone for DS.
ah i see the issue. The country name is sweden inside another dict.
We can do the inefficient way i guess.
for country in countries:

if(country.name == country_name):
print(country)
Really? Thats surprising to me, but also kinda good news, especially if I do decently well in this internship and get some good experience in the field before I even graduate
This is a good example:
{
  "Global": {
    "NewConfirmed": 132420,
    "TotalConfirmed": 12849441,
    "NewDeaths": 3537,
    "TotalDeaths": 568652,
    "NewRecovered": 111741,
    "TotalRecovered": 7116071
  },
  "Countries": [
    {
      "Country": "Afghanistan",
      "CountryCode": "AF",
      "Slug": "afghanistan",
      "NewConfirmed": 85,
      "TotalConfirmed": 34451,
      "NewDeaths": 16,
      "TotalDeaths": 1010,
      "NewRecovered": 81,
      "TotalRecovered": 21216,
      "Date": "2020-07-13T16:12:18Z",
      "Premium": {}
    },
    {
      "Country": "Albania",
      "CountryCode": "AL",
      "Slug": "albania",
      "NewConfirmed": 83,
      "TotalConfirmed": 3454,
      "NewDeaths": 4,
      "TotalDeaths": 93,
      "NewRecovered": 65,
      "TotalRecovered": 1946,
      "Date": "2020-07-13T16:12:18Z",
      "Premium": {}
    },
But the thing is that it gives me this error:
Exception has occurred: AttributeError
'dict' object has no attribute 'Country'
Code:
for data_country in data["Countries"]:
                        country_name = country
                        if (data_country == country_name):
                            print(country)
I changed some names here because of this:
@commands.command()
    async def corona(self, ctx, *, country = None):
This above me is apart of the discord.py library so it's correct it's just that it's named country and by default it's None
Maybe that's the problem?
desert oar
dict elements can't be accessed with .
lapis sequoia
it's a list
desert oar
@commands.command()
async def corona(self, ctx, *, country = None):
    for data_country in data['Countries']:
        if data_country['Country'] == country:
            print(country)
is this what you want?
lapis sequoia
It works
but I need to type it in this way
!corona Sweden
Can I convert every single word in the begging with a capital letter?
desert oar
eh?
isn't that what commands.command does?
you can do whatever string manipulation you want inside corona()
@commands.command()
async def corona(self, ctx, *, country = None):
    country = country.title().strip()
    for data_country in data['Countries']:
        if data_country['Country'] == country:
            print(country)
for example
lapis sequoia
Thank you so much 🙂
Okay one more question, I am using labelimg to label rivets in a bunch of photos to train yolo, some of the rivets are cut off half way in the image that I'm labeling. Should I still label the rivets if only half of it is showing or should I only be labeling totally visible rivets?
desert oar
i would label the half rivets too, no?
can you mark them as "half" so you can leave them out later if needed
idk if you're using a labeling tool or doing it w/ excel or something
lapis sequoia
oh no:
for data_country in data["Countries"]:
                        if data_country["Country"] == country.title():
                            country = country.title()
                            country_code = data_country[""]
Now I gotta access the country code and all the other details and that is hard
I gotta do an if statement for every single one of them?
chrome barn
country = 'Japan'
for data_country in data["Countries"]:
                        if data_country["Country"] == country:
                            country_name = data_country['Country']
                            country_code = data_country['CountryCode']
just assign them this way
desert oar
why would it be that hard?
once you have the correct data_country element
you can do whatever you want with it
lapis sequoia
How can I print each item in a list into an evenly spaced column on a single line?
>>> x = [3.4, 8.1, 9, 1.54, 12.8]
>>> f'items {[i for i in x]}'
'items [3.4, 8.1, 9, 1.54, 12.8]'
# I want to print something like this:
'items    3.4    8.1    9    1.54    12.8
@uncut shadow Great suggestion. This seems to work for me:
''.join(f'{i:10.2}' for i in x)
I like to define the spacing in the f-string.
uncut shadow
oh Ok
desert oar
!e ```python
x = [3.4, 8.1, 9, 1.54, 12.8]
print( f'items {"".join(format(i, "10.2f") for i in x)}' )
@desert oar :white_check_mark: Your eval job has completed with return code 0.
items 3.40 8.10 9.00 1.54 12.80
not necessarily recommended for readability, but have fun anyway
!e ```python
x = [3.4, 8.1, 9, 1.54, 12.8]
print( 'items ' + ''.join(format(i, '10.2f') for i in x) )
@desert oar :white_check_mark: Your eval job has completed with return code 0.
items 3.40 8.10 9.00 1.54 12.80
much easier to read imo
 limber cove
Simulate your own pandemic:

GitHub
Contribute to pvcraven/pandemic_simulator development by creating an account on GitHub.
 eager heath
flat quest
eager heath
flat quest
@chrome barn yeah that python code.
You can just reference the other parts by doing dict[key]
 frank bone
Does anyone know if there's a possibility to have an associative array like in PHP?
    AAPL:([DATE1, DATE2, DATE3, etc],
          [PRICE1, PRICE2, PRICE3, etc],
          [VOLUME1, VOLUME2, VOLUME3, etc])

    AMZN:([DATE1, DATE2, DATE3, etc],
          [PRICE1, PRICE2, PRICE3, etc],
          [VOLUME1, VOLUME2, VOLUME3, etc])

    TSLA:([DATE1, DATE2, DATE3, etc],
          [PRICE1, PRICE2, PRICE3, etc],
          [VOLUME1, VOLUME2, VOLUME3, etc])
        ]

so I could query a value like this:
request = master_array[AAPL, 1]
print(request)
output: [PRICE1, PRICE2, PRICE3, etc]```
Reason: be able to iterate variables like so master_array[VARIABLE, int]
Alternatively how would you go about organising this neatly? The goal is to create new values from csv files on the fly, then saving them in arrays like above to be able to further manipulate themsomehow naming arrays...planning to use numpy
but if there are better solutions lmk! sorry still quite a noobie in coding, learning every day 🙂
 serene scaffold
What you have right now is very close to what you want. Your don't need to wrap each list in parentheses though.
frank bone
thats going to be insanely memory hungry no? the dicts
i have around 100GB of csv files
 pale thunder
You cannot load all of those into ram regardless
frank bone
well...the csv...the derivative values are just around 2GB
just read about numpy performance advantages, so i was wondering if theres a solution to this
pale thunder
I would suggest handling it as lazily as possible, as that will be a better solution in case you ever need to work on larger datasets
Pandas may be what you want though
It is pretty much a csv-like data structure with fast random access and some other things
frank bone
What you have right now is very close to what you want. Your don't need to wrap each list in parentheses though.
@serene scaffold how though? how would i call a sub array in numpy? then a value in a sub array (x,y)?
Pandas may be what you want though
@pale thunder ill look into it thanks, any quick links?
for this purpose
serene scaffold
my_dict = {'hi': ['a', 'b']}
That's a perfectly fine list.
If you put the list in parentheses, it doesn't change anything, so it just makes your code less readable.
frank bone
oh you can have key:array/list pairs? didnt know that
srry just started coding/python yesterday 😆
serene scaffold
No problem.
A lot of programming languages have arrays, which are ordered strictures of a finite length
Python lists are different
frank bone
so i can just append or extend them infinitely?
serene scaffold
They grow and shrink to contain any number of items.
frank bone
the lists
serene scaffold
Yes, until you run out of memory.
For that reason they usually aren't called arrays. When you talk about arrays in python, it's assumed you're talking about math.
serene scaffold
I know you can concatenate any number of numpy arrays
pale thunder
Numpy arrays are pretty much entirely mutable, so you can extend them even in place afaik
frank bone
just wondering about numpy because of speed/efficiency...when going through i.e. 5 years or backtesting i wouldnt want to wait a day or however long if it could be 15min 😄
not sure if it makes that much of a difference though?
serene scaffold
Numpy uses C underneath. Its internal operations should be pretty fast.
pale thunder
First get it to work, then see performance
Pandas will probably be faster than plain python though
frank bone
true, getting ahead of myself here 😉
my_dict = {'hi': ['a', 'b']}
@serene scaffold could you make an example how to append 'c' to the list?
serene scaffold
my_dict['hi'].append('c')
serene scaffold
Generate a new key?
frank bone
key:list pair
serene scaffold
my_dict['bob'] = 8
frank bone
could 'bob' be a variable?
serene scaffold
Now bob is a key with that value.
Yes, you could use a variable as long as it points to a hashable object
frank bone
nice thanks 🙂 noted
pale thunder
Pretty much everywhere that you can put a literal in python you can put a variable
frank bone
is it as straight forward in numpy and pandas?
pale thunder
In pandas not quite, as it uses a csv like structure
Though i think it just sticks nulls everywhere
frank bone
is it possible to have 2 different datatypes per key?
in the dict method
id want date + price "streams" and ticker symbol as key
serene scaffold
I'm not sure what you mean
There's no rule that all the keys in a given dict have to have the same type
Or for the values.
serene scaffold
If you're trying to make a data structure for storing prices of something over time, I would not do it like this.
serene scaffold
If you wanted to do this on a large scale, you probably want to look into data bases.
You could also make a data class that stores a date and a price
frank bone
want to try it with lists or arrays
serene scaffold
Why
 mellow spruce
Hello all, I am trying to think what is the best approach to solve this problem. I need to create a table that upon selecting some items will refer to other tables of those specific items to generate some calculations to be displayed on the main table. Furtheremore, if wanted these other tables used to calculate the main table should be accessible and show calculations performed on a data base or the lower heriarchy table. so It should be something like main table->table 1-> table2-> table 3. each table + some other data will be used to calculate the table above. I did some research and using the datatable library seems to do it but if there are other ways I am happy to hear. also let me know if this makes sense.
serene scaffold
Inodes?
frank bone
yeah my hard drive ran out of inodes before it ran out of space
had way too many folders and files
serene scaffold
I apparently don't know what that is.
frank bone
each reserves a couple bytes in space
well not too important, i could make a database now
idk about complexity vs arrays/lists
?
serene scaffold
Complexity?
frank bone
ext4 has a limited amount of inodes, when you install the fs
if you have too many files or symlinks or folders youll run out of memory, even though you have 20% used
serene scaffold
I don't know about details that are that low.
frank bone
anyways, yeah i was wondering about DB complexity for a noob vs arrays
serene scaffold
You can also look into options where only data you're currently using is in memory
frank bone
id love to create the code in 3-4 weeks time
serene scaffold
Python has generators for this.
frank bone
well im kind of like going through a "moving window" when backtesting
around 30-45 day windows
serene scaffold
I'm not sure what you mean.
frank bone
ill pm u if its ok, dont want to spam the whole channel 😄
serene scaffold
Well, I probably don't know how to solve what you're doing
And this channel is specifically for data science
So writing about it here leaves the door open for others to chime in.
frank bone
alright ill keep asking my questions here then, i think i might just try dict for now and see if it works out for me
serene scaffold
Well, don't load all 100gb at once
Load the data you need, compute stuff, write it to disk, and repeat.
frank bone
yup 😄
how would you read from a specific index within the list in a dict?
print(my_dict['hi']) print the list
what about access 2nd index in the list?
mellow spruce
Hello all, I am trying to think what is the best approach to solve this problem. I need to create a table that upon selecting some items will refer to other tables of those specific items to generate some calculations to be displayed on the main table. Furtheremore, if wanted these other tables used to calculate the main table should be accessible and show calculations performed on a data base or the lower heriarchy table. so It should be something like main table->table 1-> table2-> table 3. each table + some other data will be used to calculate the table above. I did some research and using the datatable library seems to do it but if there are other ways I am happy to hear. also let me know if this makes sense.
frank bone
alrdy fell in love with pandas, as easy as excel basically 😄
 hearty cloud
Hello all, I am trying to think what is the best approach to solve this problem. I need to create a table that upon selecting some items will refer to other tables of those specific items to generate some calculations to be displayed on the main table. Furtheremore, if wanted these other tables used to calculate the main table should be accessible and show calculations performed on a data base or the lower heriarchy table. so It should be something like main table->table 1-> table2-> table 3. each table + some other data will be used to calculate the table above. I did some research and using the datatable library seems to do it but if there are other ways I am happy to hear. also let me know if this makes sense.
@mellow spruce It looks like a SQL type calculation, but I'm not sure if a temporary database or so could be built
mellow spruce
@mellow spruce It looks like a SQL type calculation, but I'm not sure if a temporary database or so could be built
@hearty cloud The thing with doing it through sql is that it has to be interactive and updated every time you make different selections in the different tables. Thank you for the input!
lapis sequoia
Hi, i need help with this message error : AttributeError: 'list' object has no attribute 'reshape'
frank bone
Anyone know how I can have more depth in pandas dataframes?
cars = {'Brand': ['Honda Civic','Toyota Corolla','Ford Focus','Audi A4'],
        'Price': [22000,25000,27000,35000]
        }

df = pd.DataFrame(cars, columns = ['Brand', 'Price'])

print (df)```
instead of cars as "master", I want "Transport" as "master"
Then:
Cars -> Brand, Price
Planes -> Brand, Price
Boats -> Brand, Price
etchope you understand what i mean 🙂
 zealous kayak
@lapis sequoia
Because reshape is not for python list . It's a numpy function for arrays.
Eg:
L = [1,2,3,4]
Arr = numpy.array(L)
Arr = Are.reshape(2,2)
desert oar
@mellow spruce you can do that with pandas, although i dont think i entirely understand what youre asking for
frank bone
how would you do it in excel?
@desert oar i would use different sheets
lapis sequoia
@zealous kayak thanks
zealous kayak
@frank bone how about using classes
desert oar
ok, nothing wrong with using multiple data frames
frank bone
it will be thousands tho
desert oar
alternatively you can have a column vehicle_type with values like 'Plane', 'Car', etc.
frank bone
will there be performance issues if i use lets say 1 huge dataframe, or 4000 smaller dataframes?
one better over the other?
all in RAM
zealous kayak
What do you actually want?
Can you explain a bit more
frank bone
ill try
so i have a dataset for stocks (csv files) with around 20 datafields, i want to multiply 2 data columns, sum them, then store the result as Symbol -> Date -> Volume, and this for around 1000 symbols per day
and i want to have 1 consistent stream for each symbol...vol1, vol2, vol3, vol4...etc
but theres also price1, price2, price3 etc...and date1, date2, date3 et..
so several "streams" per ticker per date
so n amount of arrays within array?
idk how to most efficiently solve this
Example: AAPL -> 20180601 -> 1000(vol), 356(price)
20180602 -> 1060, 374
20180603 -> 1400, 333
20180604 -> 1100, 353
but a thounsand symbols in same array/df
so now im wondering if i should just go easy and make 1000 dataframes instead of 1 big
mellow spruce
@mellow spruce you can do that with pandas, although i dont think i entirely understand what youre asking for
@desert oar let me try to explain it better. We have different parts of a group and different groups that are part of the system. I want to display a main graphs that displays some calculations on the whole system. Upon selecting a group I want to display some data of the parts that are part of that group and calculations in a different table. Upon selecting a part I want to further drill down and again show some data and some calculations. Now on the Hughes llevel (system) upon selecting some groups. This table is going to access some calculations of the groups and part’s tables and show some calculations. Does that explain it better?
desert oar
@frank bone it depends on how you're using the data
frank bone
@frank bone it depends on how you're using the data
@desert oar im using it to do very simple manipulations and comparisons, for example comparing avg daily volume of last 3 days vs avg daily volume of last 30 days etc
nothing too math intensive i guess?
desert oar
i mean how you're using it in code, if that makes any sense
you can put 1000 data frames in a dict in a for-loop for example
frank bone
well im a noob 😄
not sure i even know yet lol
i have a big problem with the 1000 data frames example
i need to create dataframe variable names dynamically
very easy thing to do in PHP or bash
seems almost impossible in python...or do you know a way 😄 ?
like i would need to create the data frame like so:
volume_$TICKER
i dont want to type 1000 freaking variables in main function, just let the program do it
and keep in ram
so how do i accomplish to make something like: volume_$TICKER = pd.read_csv(etc...)
it iterates day to day...so each day TICKER reappears, and then ill append my value to the dict
desert oar
Use a dict
haughty narwhal
Really basic question on integration in Sympy. This code returns, embarrassingly enough:
0.707106781186547 * sqrt(2) * A
... which clearly should = A
# Import
import sympy
sympy.init_printing()

# Define symbols
t, RT, A= sympy.symbols("t RT A", real = True)
sigma = sympy.Symbol("sigma", real = True, positive = True)

# Define Gaussian function
f = (A / (sigma * sympy.sqrt(2 * sympy.pi))) * sympy.exp(-(1/2) * ((t - RT)/sigma)**2)

# Integrate
f.integrate((t, -1 * sympy.oo, sympy.oo))
I don't know if this reflects poorly on me or Sympy, but I was wondering if somebody could steer me in the right direction to get the real output (A)
 plush crescent
Any mathematicians that can help me out with a python/pandas formula? I'm trying to calculate the STC(Schaff Trend Cycle) using data I got from tradingview. The data I have includes their STC results so I can compare but the formula I've found for STC from different python libs out there is giving me bad results.
STC formula:
Schaff Trend Cycle - Three input values are used with the STC:
– Sh: shorter-term Exponential Moving Average with a default period of 23
– Lg: longer-term Exponential Moving Average with a default period of 50
– Cycle, set at half the cycle length with a default value of 10.
The STC is calculated in the following order:
First, the 23-period and the 50-period EMA and the MACD values are calculated:
EMA1 = EMA (Close, Short Length);
EMA2 = EMA (Close, Long Length);
MACD = EMA1 – EMA2.
Second, the 10-period Stochastic from the MACD values is calculated:
%K (MACD) = %KV (MACD, 10);
%D (MACD) = %DV (MACD, 10);
Schaff = 100 x (MACD – %K (MACD)) / (%D (MACD) – %K (MACD)).
Python version:
EMA_fast = pd.Series(
                df['Close'].ewm(ignore_na=False, span=23, adjust=True).mean(),
                name='EMA_fast',
            )
EMA_slow = pd.Series(
                df['Close'].ewm(ignore_na=False, span=50, adjust=True).mean(),
                name="EMA_slow",
            )


MACD = pd.Series((EMA_fast - EMA_slow), name="MACD")
STOK = (
                (MACD - MACD.rolling(window=10).min()) / (
                MACD.rolling(window=10).max() - MACD.rolling(window=10).min())) * 100

STOD = STOK.rolling(window=10).mean()

df['STC'] = 100 * (MACD - (STOK * MACD)) / ((STOD * MACD) - (STOK * MACD))
The python version isn't giving me the same results as tradingviews STC. I've looked at the pine script used to calculate STC via tradingview but having a hard time understanding it
 dull turtle
how i can get a prediction accuracy of CNN model with categorical data? i have folders or classes like "driving_licence images", "passport images"or say if i pass "passport image" then it should let us know that to which class or folder it is matching? e.g. say "passport" - 85 %, "driving_licence" - 70 % this way how i can get this ?
 woeful plover
Anyone reading the deep learning book by Ian Goodfellow? Let's form a study group. DM please
 heavy crow
I am following this tutorial trying to get object detection working. https://github.com/tensorflow/models/blob/master/research/object_detection/colab_tutorials/eager_few_shot_od_training_tf2_colab.ipynb
It works great but I want to detect multiple classes (3). The tutorial states
for simplicity, we assume a single class in this colab; though it should be straightforward to extend this to handle multiple classes
but I can find a "straightforward" way to extend it for multiple classes. Could someone explain what the process would be to get multiple classes?

GitHub
Models and examples built with TensorFlow. Contribute to tensorflow/models development by creating an account on GitHub.
dull turtle
@heavy crow what u want to do exactly?
heavy crow
@dull turtle detect 3 differnet objects using tf 2
dull turtle
what is tf2? @heavy crow
heavy crow
tensorflow 2.0
lapis sequoia
skimming the notebook it seems like you need to pass a different model configuration for the model_builder.build method
i am not familiar /w the object detection api but from what i understood the config is a model.proto object - which i assume is just some abstractation for describing a tensorflow model
dull turtle
!pastebin
arctic wedgeBOT
Pasting large amounts of code
If your code is too long to fit in a codeblock in discord, you can paste your code here:
https://paste.pydis.com/
After pasting your code, save it by clicking the floppy disk icon in the top right, or by typing ctrl + S. After doing that, the URL should change. Copy the URL and post it here so others can see it.
 sullen kiln
hi guys, any R users here?
 silk axle
How would I make an AI that can recognise hand-written numbers, such as the ones in the image below?
What libraries/specific aspects of a library should I be looking into?
silk axle
@me upon response please
ripe forge
@silk axle so, images of digits yes? You first need a dataset. Individual image of digits with their corresponding number that they're supposed to be displaying. Then, you need a model that works on images. That means any deep learning library, for example tensor flow keras.
Fortunately for you, this kind of problem is the de facto introduction to CNNs (which are a type of neural network architecture that excel at image tasks). Check out tutorials on CNN on the "mnist" dataset. (it's a dataset of handwritten images.)
Now, these kinds of models might not always carry over nicely to real tasks. Because images are expected to be resized and have only one digit in them at a time and so on.
So what ocrs usually do is first break the combination of digits into smaller boxes around individual digits
So that is something outside the model that you'd have to do. One of the ones I recall that can try doing this kind of box creation for you automatically is jtessboxeditor
But I feel like you'd be going very far down the rabbit hole at that point. I'd worry about just trying to understand one digit at a time first.
 marble jasper
recognising digits is a pretty standard exercise for ML, you don't have to go into neural networks at all. In fact many course on ML will start with adaptive boosting haar wavelets for this problem
there's a lot of tutorials on it as well
anyway, to help you, there is an MNIST database of a lot of handwriten digits training data you should grab: https://en.wikipedia.org/wiki/MNIST_database
I believe sklearn has this available in sklearn.datasets.load_digits
a good place to start
ripe forge
Ooh. I've never tried non neural nets on these kinds of tasks before.
marble jasper
I guess they're the "old world" of ML
ripe forge
Call it a part of self learning I suppose, my first interaction with mnist came paired with cnns
silk axle
I've never really done any ML/AI stuff before so I guess start with just one number and progress from there. The main things I'm not sure on with this are:
- how do I tell Python that "this sample imagine is a 1/2/3..."?
- how do I get Python to read in the input image in a format that I can use for this
- how do I then extract the number from the input image
- how do I then compare the extracted number to the sample images to tell which number it is
marble jasper
but digit recognition as well as face detection are common examples used for them
ripe forge
All those 4 questions are great. Fortunately (or unfortunately) all those 4 questions have the same answer: they are all abstracted away by the apis of the model libraries that you use.
So it's as simple as putting things in the correct folder, or calling some library function.
Everything else just.. Happens. Magic.
silk axle
So all that stuff is handled behind-the-scenes?
ripe forge
Mhm. Pretty much
silk axle
Well that makes it a lot easier I guess lmao
I'm guessing I want to use sklearn for this? Since that has the sample set?
ripe forge
Depends on what model you're going to build
Deep neural networks I would use tensor flow personally. Sklearn is amazing for most other models.
marble jasper
here's a blog page on AdaBoost on that MNIST dataset by the way: https://towardsdatascience.com/boosting-and-adaboost-clearly-explained-856e21152d3e worth knowing just for background information. but a CNN is going to outperform this. but I think it's worth knowing anyway
silk axle
What exactly do you mean by a "model"? I'm new to this ml/ai stuff lol
ripe forge
Good. I think those are the kind of questions you'd actually want to ask at this stage.
So, here's the question to you then
What is ml?
What do you understand by the phrase so far, if anything
(and it's perfectly fine if you say, no clue yet either.)
silk axle
All I really know is like, "getting a computer to identify patterns so that it can identify what an object is"
So say for the number "8" it's essentially looking for two circles ontop of each other kinda thing
ripe forge
Good. Now, let's get one specific detail that should make it easier
"how" do we get it to identify what the object is
Because we aren't in the ml territory till we answer this one. Because we have a choice
silk axle
I kinda know the theory behind it, in that you feed it samples and say, "these are all '8's, figure out the patterns", and then in future if it sees that pattern it knows it's an '8', but I don’t know like how you actually do that and how the computer actually identifies the patterns
ripe forge
Bingo. Solid question
There's two ways: one is, we define the rules. Say, as you said yourself, maybe 8 is 2 circles touching at some point. Or say, sky is pixels that are blue in colour.
So we program the logic for it
We say, a circle is pixels of black that follow an equation. Or we say, blue is pixel 0,0,x
But then, we code those rules up. And those rules start to break on different inputs
So, we start predicting water as sky for example.
marble jasper
(I think this is why courses start with haar wavelets, because they're easy to understand and reason for. And then you move onto NN and then you're like 🤷♂️ I don't know what's going on in there, but it works)
ripe forge
So then we add more rules. It must be above some kind of horizon line. Etc etc
This is traditional programming. we control the rules
We look at input. We set the rules. We get the output.
The second way, the ml way is this: we look at input. We let a machine look at output. We let it figure out *any rule whatsoever * it can.
And we give it a task: get as many input output pairs correct as you can.
marble jasper
can I just add to this explanation:
https://qph.fs.quoracdn.net/main-qimg-6d4739d376cc968727a97f99994dc64a
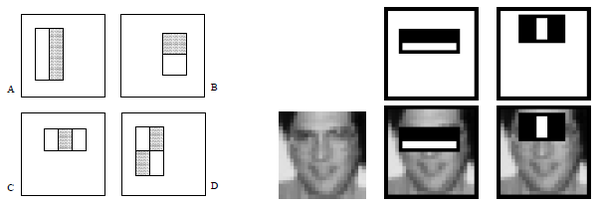
these black and white squares are example of 2D haar wavelets. This example isn't for finding numbers, but detecting faces
these are some examples of simple "rules"
ripe forge
That's finally where ml comes in. The machine is given freedom to make its own rules, but it's given an instruction to get the best score
The real truth is, we have no idea what rules it will end up defining to achieve that goal
marble jasper
"is the bottom half of this rectangle lighter than the top half?" that's a rule you can come up with. That rule matches most people's eyes and nose because your eyes and eyebrows tend to be darker pixels in an image than your cheeks
but this rule matches a lot of other things too. so you combine this rule with another rule "is the middle third of this rectangle lighter than the ones aside?" that rule matches the middle of the nose quite well in photos
again, these two rules together can match a lot of other things, but it's slightly better than each of them on their own
so you can see that if you string together a hundred, or maybe a thousand of these simple rules, you might end up with a single strong rule that detects faces more than it detects anything else
silk axle
Yea, I get what you're saying @marble jasper. More rules means more precision, although I guess with ML it can make errors in the rules which would snowball
marble jasper
but this is very tedious work to do manually. so you give this problem to a computer and say: "come up with a few hundred random sets of rules, and try them out on this dataset of known faces and dataset of unknown faces, and give me the best rules"
and then you say "ok, take these best rules and change them a bit - adjust them slightly, and then run another test to see if the change made them any better"
so what you end up doing is you tell a computer to adjust the rules automatically, gradually improving on them until you have a model that is as good as it can be on the dataset that you have. That automatic self-improvement is machine learning
ripe forge
This is where the magic of ml comes in. When it comes with the rules, it's evaluated against its overall task. That is, get the best score.
silk axle
But what's to stop, for example, the ML at some point determining that water is the sky, and then adding rules that are actually looking for water instead of the sky?
marble jasper
Neural Nets are like this, but you don't need to use haar wavelets (the squares shown above)...although actually nothing stops you from using them. you can use the raw pixel data directly
ripe forge
When it invariably fails the first time, it makes changes so that it improves. As for how the machine itself comes up with rules, that's a very specific concept of "optimization."or in case of neural networks, it's called"backpropogation"
Because we have the input output pair.
marble jasper
no. you're not looking for water or sky. you are looking at raw pixel values. the computer doesn't understand concepts like "water" or "sky", only "this is dark", "this is light"
ripe forge
We show it this is what you should have done
And it sees but this is what I did
And then it optimizes to do a better job
That's the rule creation/improvement step
silk axle
I'm kinda confused with that. We say it got it wrong, but how does it know where it went wrong?
When we only see the end output, not the process of how it got there
ripe forge
Yes and no. See, rules, when we humans think of them, have meaning
For machines, it's as mindless as a math equation
marble jasper
that's the thing that makes neural networks hard to reason about. There are a lot of rules in there, and some of them are wrong or suboptimal. But we don't actually care (or rather, we can't care)
we only care that it gets a certain percentage of results right or wrong
silk axle
But say it's not getting enough accuracy, how do we improve it?
marble jasper
we can't go in there and figure out which rules are wrong and correct them. that would take impossibly long
ripe forge
They just solve the equation. The equation ends up making our inputs and outputs coincide. At that point, it doesn't matter that we can't explain every rule, just that this combination of rules or math equations understood the input output pairs.
All this marketing hype around ai being smart? All lies.
marble jasper
this is where traditional non-neural network ML differs from neural networks. In the example I gave above, adaboost/haar uses an evolutionary algorithm for improvement
that's quite easy to understand
ripe forge
It's literally a bunch of equations.
marble jasper
it takes a bunch of rules, and then makes random changes to them, and sees if it does any better
we don't actually care that these rules have errors or inefficiencies in them. we just care that this random mutation of rules performs better than this other random mutation of rules
we don't care why
or we can't care why
(it's too complex to actually go in and look at them)
ripe forge
But say it's not getting enough accuracy, how do we improve it?
@silk axle we don't. Not In the traditional sense. You gave up control over the rules.
marble jasper
think about dog breeders
ripe forge
we care about getting the most input output pairs right
marble jasper
dog breeders try to breed certain traits in dogs - size, temperament, coat pattern, stamina for racing, etc. etc.
dog breeders aren't geneticists, they can't go into the genetic material and figure out what's "wrong"
pale thunder
You essentially have an algorithm that guesses what changes would improve, and if they do, you go on from there. Improve enough times and you get an actually useful model
ripe forge
Ooh this is a good example
marble jasper
yet they can still breed dogs with certain traits
(again, still using adaboost as an example, NN slightly different as Lakmatiol suggests)
 stray ivy
the core of data science and ML is statistics, so you're never really going to get anything 100%. good enough is pretty much the best case scenario
marble jasper
it's like saying "I don't know what you did, but whatever it is, keep doing it/do more of that"
silk axle
Yea, that makes more sense, thanks
ripe forge
That's the magic. For neural networks specifically, It's like, you took an multiple choice question example for some kid. without teaching him anything. The kid took random guesses. but then you told him, this was right, this was wrong.
Then the kid is made to resit the same exam
silk axle
It's just making guesses and if it guesses right it'll keep going down that path, if it guesses wrong, it backtracks and tries something else?
ripe forge
Eventually this kid is gonna ace this exam
Without knowing a single thing about this subject
pale thunder
Yeah, though it is a bit smarter about it than random in most cases
stray ivy
also the "learning" bit isn't as nebulous as you would think. it's really just using legit metrics for statistics/regression/w.e. to "learn" what's better
like, "better" could mean CVRMSE goes down
as an example
ripe forge
Aye, the real learning is simply some kind of optimization or back propagation
Just like solving some equation
For the machine it makes sense. And for us, we don't really care.
marble jasper
I've learned to never trust anyone who says "it's just basic calculus"
stray ivy
for real
ripe forge
I've learned to never trust anyone. 😉
stray ivy
calculus as a theory is pretty easy for humans to understand, but it's pretty difficult to get a computer to "understand" calculus
that's why there exist numerical methods for approximating such things
pale thunder
Numerical approximations of calc are quite simple. Algebraically solving it is not.
silk axle
So I know more behind the theory of how it all works now, but how would I proceed with my actual task? @ripe forge
stray ivy
for sure, numerical approximations are pretty simple. i was more referring to the algebraic portion
ripe forge
You need. Your dataset. Input output pairs. Fortunately they exist. Mnist. Then you need, a model. Fortunately they also exist. Then you just need a tutorial that shows both. For that, give me one sec if you want a CNN. Alternatively meseta linked one
silk axle
What do you mean by a "CNN"?
pale thunder
Yeah, though in its basic form in NNs, it is the chain rule. Which is not horrible to do on paper
Convolutional neural network
They are generally better than most other NNs at dealing with images
silk axle
Right, okay
ripe forge

How to Develop a Convolutional Neural Network From Scratch for MNIST Handwritten Digit Classification. The MNIST handwritten digit classification problem is a standard dataset used in computer vision and deep learning. Although the dataset is effectively solved, it can be used...
In the code, change the keras imports to tensorflow.keras
It's a great site so I trust their tutorials but the code might be old now
dull turtle
app.logger.info("result2 : %s", result2)
            search_index = (result2)
            mlb = MultiLabelBinarizer()
            mlb.fit([label_map])
            predictions = model.predict(samples_to_predict)[0]
            idxs = np.argsort(predictions)[::-1][:2]
            for (i, j) in enumerate(idxs):
                #build the label and draw the label on the image
                label = "{}: {:.2f}%".format(mlb.classes_[label_map], predictions[j] * 100)
                cv2.putText(test_img, label, (10, (i * 30) + 25),
                            cv2.FONT_HERSHEY_SIMPLEX, 0.7, (0, 255, 0), 2)
                # show the probabilities for each of the individual labels
            for (label, predictions) in (mlb.classes_, predictions):
                print("{}: {:.2f}%".format(label, predictions * 100))
```Thanks @ripe forge
dull turtle
Traceback (most recent call last):
  File "C:\Users\Admin\anaconda3\lib\site-packages\flask\app.py", line 1949, in full_dispatch_request
    rv = self.dispatch_request()
  File "C:\Users\Admin\anaconda3\lib\site-packages\flask\app.py", line 1935, in dispatch_request
    return self.view_functions[rule.endpoint](**req.view_args)
  File "C:\Users\Admin\anaconda3\lib\site-packages\flask_restful\__init__.py", line 468, in wrapper
    resp = resource(*args, **kwargs)
  File "C:\Users\Admin\anaconda3\lib\site-packages\flask\views.py", line 89, in view
    return self.dispatch_request(*args, **kwargs)
  File "C:\Users\Admin\anaconda3\lib\site-packages\flask_restful\__init__.py", line 583, in dispatch_request
    resp = meth(*args, **kwargs)
  File "E:\paymentz\dynamic_testing.py", line 123, in post
    label = "{}: {:.2f}%".format(mlb.classes_[label_map], predictions[j] * 100)
IndexError: only integers, slices (`:`), ellipsis (`...`), numpy.newaxis (`None`) and integer or boolean arrays are valid indices```@TizzySaurus If you'd like a bit of a deeper dive (but still a high level one) behind the theory for this task from a NN perspective, take a look at this. http://neuralnetworksanddeeplearning.com/
arctic wedgeBOT
Pasting large amounts of code
If your code is too long to fit in a codeblock in discord, you can paste your code here:
https://paste.pydis.com/
After pasting your code, save it by clicking the floppy disk icon in the top right, or by typing ctrl + S. After doing that, the URL should change. Copy the URL and post it here so others can see it.
silk axle
@ripe forge I get this error whenever trying to use tensorflow module (importing) -- even just import tensorflow gives this https://paste.pythondiscord.com/ujamukigas.sql
dull turtle
https://paste.pythondiscord.com/ecomuvoveq.py see code here @ripe forge
ripe forge
Sorry @dull turtle i personally was never great at debugging actual model code, and I wouldn't be able to spare the time to take a look.
Weird @silk axle , do you use anaconda or python directly
silk axle
Python 3.6.8 directly, on Windows 64-bit if that matters
dull turtle
Traceback (most recent call last):
  File "C:\Users\Admin\anaconda3\lib\site-packages\flask\app.py", line 1949, in full_dispatch_request
    rv = self.dispatch_request()
  File "C:\Users\Admin\anaconda3\lib\site-packages\flask\app.py", line 1935, in dispatch_request
    return self.view_functions[rule.endpoint](**req.view_args)
  File "C:\Users\Admin\anaconda3\lib\site-packages\flask_restful\__init__.py", line 468, in wrapper
    resp = resource(*args, **kwargs)
  File "C:\Users\Admin\anaconda3\lib\site-packages\flask\views.py", line 89, in view
    return self.dispatch_request(*args, **kwargs)
  File "C:\Users\Admin\anaconda3\lib\site-packages\flask_restful\__init__.py", line 583, in dispatch_request
    resp = meth(*args, **kwargs)
  File "E:\paymentz\dynamic_testing.py", line 123, in post
    label = "{}: {:.2f}%".format(mlb.classes_[label_map], predictions[j] * 100)
IndexError: only integers, slices (`:`), ellipsis (`...`), numpy.newaxis (`None`) and integer or boolean arrays are valid indices```
@ripe forge see error here
ripe forge
If I had to guess, one of j or label_map is wrong. But I'm not sure what's being passed where
dull turtle
https://www.pyimagesearch.com/2018/05/07/multi-label-classification-with-keras/ see this i am following look at their
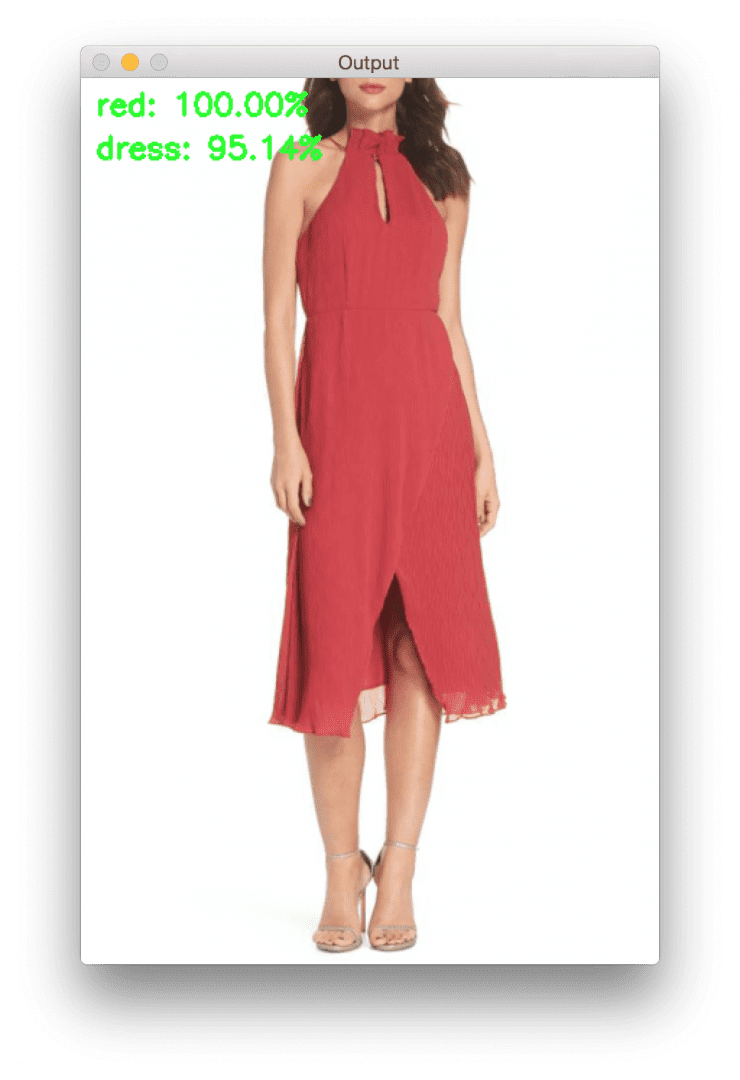
In this tutorial you will learn how to perform multi-label classification using Keras, Python, and deep learning.
ripe forge
@TizzySaurus perhaps try to make a new virtual env and see if you can get a clean setup to work. Not too familiar with using python directly since I rely on conda commands. But basically installing tf correctly with its dependencies is a painful experience at times. I suspect it's simply your library is not setup correctly
It's just a guess though, sorry.
silk axle
tbh I've never used venvs before and have no clue how to
dull turtle
see here @ripe forge
ripe forge
😅 Me neither, I let conda commands handle environment creation
But you won't have conda.
silk axle
I guess I'll try and figure it out, thanks
dull turtle
i am trying to print the prediction with percentage @ripe forge
can u have a looke there bro it take only less than 5 mins bro?
ripe forge
Sorry, I personally can't right now. Code debugging is rarely a 5 minute thing, and I wouldn't be able nor willing to spare the time right now.
If you'd like to, perhaps take up a help channel though. Hopefully someone can get back to you
ripe forge
As always, don't try to single out people for help, we might not always have the time to spare.
dull turtle
yeah i can understand
uncut shadow
Hey. What's variance (rather in statistics, than ML)? I understand it's definition and I know the formula, but I don't get what does it tell e.g. what does it tell me that variance of some numbers is e.g. 21.1324?
ripe forge
In simple terms, it's just a number that indicates the spread from the mean value
uncut shadow
Yeah, but what does it actually tell me? Like, when you measure height, and you get that building you measured is 10 m tall then it means that there is 10 m from the ground to the highest point of that building. What about the variance? How could I "show" it or sth?
ripe forge
That means, it's more useful when you talk about it relatively.
ripe forge
Well, meters is a unit of height. Sadly varience was never quantified into well defined units. Not in the sense you'd like it to
However, standard deviation and variance still talks about something very fundamentally important about a group of data points.
Two groups with the same mean, can have different variances. So if I tell you one group has variance 10 and another 100, relatively you can infer which one has points more close together yes?
ripe forge
Cool. So yep, hope that helps
ripe forge
Other way around. Deviation came first. Edit: wrong. Ignore this
uncut shadow
oh
ripe forge
We squared because we didn't want positives and negatives to cancel out
Hm.
Now that I think of it, I'm not sure if that's a 100% correct. But that's how I understood it at the time
lapis sequoia
Think of it this way. You have two datasets: [-10, 0, 10, 20, 30], and [8, 9, 10, 11, 12]. They both have a mean of 10 which gives some indication about which value they are clustered around, but they're obviously quite different.
That's where variance (or more commonly standard deviation) comes in.
I'm assuming you know how to calculate the variance. And for the first dataset it's 200, and for the second is 2
So if by knowing the mean and variance only you have some sense of how these two datasets are distributed
They are both around 10, but one is much more clustered than the other
uncut shadow
oh, Ok, thanks
lapis sequoia
Using the std.dev you get 10√2 and √2
ripe forge
Apparently it can get really involved too. For the square root question

Cross Validated
Sorry if this is has been answered elsewhere, I haven't been able to find it.
I am wondering why we take the square root, in particular, of variance to create the standard deviation? What is it ab...
lapis sequoia
And there you can see that the standard deviation of one set is 10 times greater than the other. Which makes perfectly sense.
uncut shadow
oh Ok
lapis sequoia
Variance is just std.dev squared, so I suggest you find a tool online or use a graphing calculator and just plot various normal-distributions and see how the standard deviation (and thus variance) changes the distribution of the data
ripe forge
Aye, std dev gets back on the same scale as all the values were.
lapis sequoia
yea
ripe forge
Which has a certain elegance to it
lapis sequoia
And also, units (unless that's what you meant)
ripe forge
Mhm, yep
mellow spruce
Hello all, I am trying to think what is the best approach to solve this problem. I need to create a table that upon selecting some items will refer to other tables of those specific items to generate some calculations to be displayed on the main table. Furtheremore, if wanted these other tables used to calculate the main table should be accessible and show calculations performed on a data base or the lower heriarchy table. so It should be something like main table->table 1-> table2-> table 3. each table + some other data will be used to calculate the table above. I did some research and using the datatable library seems to do it but if there are other ways I am happy to hear. also let me know if this makes sense.
 limpid raft
When building a 2D convolutional model, how do you determine the filter size and the order you place the layers in. For example when could filter size 64 then 32 be better than 32 then 64?
ripe forge
General guidance go big to small. It's mostly a trial and error. However, one intuition I can suggest is thinking in terms of "more simple" and "more complex"
So a model with bigger layers, more layers, more neurons, etc is capable of overfit ting more. It's a more complex model
That kind of deal.
As for why big to small, the intuition is this: sparse to dense compacts information. Dense to sparse expands the space in which information lies
So the latter can teach the model to pick up on noises in the data, which is usually bad.
Disclaimer, these are the intuitions I've formed to understand how things work, and I cannot vouch for their technical rigour. Just, they've served me well so far.
limpid raft
That's useful. Thank you!
ripe forge
@mellow spruce sounds fine, though it just feels like an unnecessary complicated structure. Perhaps normalize (join and merge) some tables to make it easier. Otherwise sure, seems like a common table join approach
mellow spruce
@mellow spruce sounds fine, though it just feels like an unnecessary complicated structure. Perhaps normalize (join and merge) some tables to make it easier. Otherwise sure, seems like a common table join approach
@ripe forge thanks!
 drowsy kite
is there a more efficient way to get dummy values for data with a lot of dates? I went from having 27 columns to 600 columns mostly based on the fact that it created a new column for each date instance.
dates play a good role predictability in this case so i don't want to take it out completely
flat quest
Well one way might be to just not use one hot encoding?
@drowsy kite
drowsy kite
that's a good point but i've stemmed away from using it in the past because models usually interoperate the non binary input as an increase when its not necessarily the case
 pastel compass
I'm trying to understand the code behind a simple encoder-decoder network example, but I had a small question. Is "input" in green because it corresponds with the input() function, or does it mean something else in this context?
flat quest
Yeah it’s green because the editor just sees it as the input function
stray ivy
if there's a function defined as input(), then you should rename your variables
pastel compass
Cool, I noticed the same thing for iter as well, so I'll change them to inp and iterable or something like that. Thanks!
flat quest
Np
@drowsy kite that’s true. But dates do have an inherently numerical structure, and if you use dL nns rather than a default sklearn models, it should be able to deal with the non linearity better.
drowsy kite
interesting, i didn't know that
do you know if its possible to transform some categorical data via one hot encoder and the other by label encoding ?
@flat quest
flat quest
yeah you can pick and choose. Generally its done by selecting the specific columns you want to either one hot or label encode
@drowsy kite
 real hollow
Hello good evening guys
could someone help me with using more than one core to calculate a for loop with a nested for loop inside?
i cannot wrap my head around how to actually force python to use more than one core
its 2 for loops iterating through a pandas dataframe
the same dataframe
operations are made on strings not numbers which appears to be an additional obstacle
im using a server with 12 cores and the code runs only on one thread
estimated run time will be 15h-20h...
lapis sequoia
have you tried dask? dask is specifically designed for these problems and it is developed on top of pandas and joblib
https://docs.dask.org/en/latest/delayed.html
specifically delayed might be what you are looking for
actually the basic dask dataframe should do it, probably no need for delayed, my bad
 eternal rivet
Hey all, I'm plotting a line graph with 5 lines on it. 4 of them are continuous but I need the 5th to have a few breaks in it where there is no data for the x coordinate. I'm struggling to find help on stackoverflow. Anyone know how to handle this?
real hollow
Thank you @lapis sequoia 🙂 Will check it out right now!
WOAH THAT IS EXACTLY WHAT I NEEDED
YOU ARE GREAT!!!!!!!!!!!!!!!!!!!!!!!!!!!!!!!!!!!!!!!!!!!!!!!!!!!
flat quest
hmm sounds like dask is useful 😉
maybe i should start using it
lapis sequoia
@real hollow no problem mate. have fun using it 🙂
 outer tusk
any one know how i can drop the unnamed row or column?
tried data.drop() and it wont delete it without dleeting the entire column
and also drop the 'Canada (map)' label
lapis sequoia
I stumbled across this:
webhook = DiscordWebhook(url=url)
embed = DiscordEmbed(title="**Ban Hammer**",
                     description=f"Banned {member}",
                     color=242424)
But that color value is really weird and how can I make it in pure red like rgb(255, 0, 0)
I tried searching it up but found nothing and also hex color doesn't work
 rare portal
any one know how i can drop the unnamed row or column?
@outer tusk Can you provide a screenshot of the dataframe? Print the index too, that looks like unamed is set to be the index, so you can df.reset_index and drop the column I believe. You can also drop the column before setting the index.
outer tusk
pastel compass
Sorry for asking the question here, but would anyone be able to share which file extension I should used for a bcolz.carray object?
outer tusk
driver = webdriver.Chrome(executable_path='/Users/w000jc/downloads/chromedriver')
driver.get('https://www150.statcan.gc.ca/t1/tbl1/en/tv.action?pid=2010001701')
html = driver.page_source
tables = pd.read_html(html, index_col=[0])
data = tables[0]
driver.close()``` @rare portalI've seen .dat, but I'm not 100% sure if that is typical convention
outer tusk
@rare portal when i do data.drop(columns="Canada (map)") it drops everything under it
rare portal
@rare portal when i do
data.drop(columns="Canada (map)")it drops everything under it
@outer tusk Yeah, I see the issue. I don't have selenium installed right now so I can't provide you with the code, but can you try deleting the index_col from the read_html method and replace it with skiprows=[0]? You want to skip the Canada map line and set headers to line 1 I believe. Something like:
pd.read_html(skiprows=0, header=1)
That should return a cleaner dataframe,. Basically, the issue is that your data is 'nested' under the Canada (map) column so dropping using columns="Canada (map)" will drop everything.
outer tusk
@rare portal it just worked using this
data.columns = data.columns.droplevel(level=0)```multiindexes 😡
rare portal
@rare portal it just worked using this
data.columns = data.columns.droplevel(level=0)```
@outer tusk haha yeah. They're quite tricky.
outer tusk
last thing
for column in data.columns:
data[column].apply(lambda x: x[:-1])``` how can I put this 'inplace'?trying to iterate over all of the columns and take off the a letter at the end of the dollar amounts.
for example every cell is like so: 1231313A or 1441B
i want the letters to be removed and trying to loop over every column
 umbral geode
Hey,can someone help we with dataframes?
I wrote this code:
df1 = a_list=["hi","bye","car"]
for word in a_list:
if 'i' in a_list:
print(word)
That part worked.
Then I did this: df1=pandas.DataFrame([a_list])
and got this
0 1 2
0 hi bye car
I should only get hi.
From multiple columns how can I filter required columns ,and put them in a dataframe.
Please help.
rare portal
for column in data.columns:
    data[column].apply(lambda x: x[:-1])``` how can I put this 'inplace'?
@outer tusk Hmm, you don't need to iterate through the columns; in fact, you should avoid doing that due to performance reasons.
You can use pd.replace to make these kinds of operations. Combined with regex, you can do quite a lot of powerful stuff.
https://pandas.pydata.org/pandas-docs/stable/reference/api/pandas.DataFrame.replace.html
Something like:
df.iloc[:,1:].replace(regex='[^0-9]',value='', inplace=True)
Should replace none numeric characters from all columns that go from column 1 to last column.
 pseudo sonnet
where is the filtering happening?
umbral geode
Only words that have i in them should be put in the dataframe.
outer tusk
for column in data.columns:
data[column].transform( lambda x: re.sub(r'[A-Z]', '', x)).replace(',', '')``` I did this but the commas still there 😦 @rare portalthat doesn't filter it, that just prints all the words with i in them
those words remain in a_list
umbral geode
I know,that is what I need. It did that but when I put in dataframe it is printing all words in the dataframe.
pseudo sonnet
well yeah
umbral geode
hi is the only word that should be in dataframe but all words are going in
df1 = a_list=["hi","bye","car"]
for word in a_list:
if 'i' in a_list:
print(word)
pseudo sonnet
because you're not filtering anything out of a_list
umbral geode
Could you tell me how?
pseudo sonnet
print() doesn't delete anything
umbral geode
Oh no not that
I need it to delete in the dataframe.
df1=pandas.DataFrame([a_list])
what do I need to do to make only words with 'i' go in dataframe
pseudo sonnet
that's something that's better handled outside the dataframe
so you want to keep a_list as it is?
umbral geode
yes
pseudo sonnet
df1 = a_list=["hi","bye","car"]
change this to ```python
another_list = a_list = ["hi", "bye", "car"]
since assigning a_list to df1 is redundant if you're just gonna reinitialize df1 as a dataframe anyway
for word in another_list:
    if 'i' in word:
        print(word)
        another_list.remove(word)
then initialize pd1 as a dataframe with another_list
umbral geode
It did the opposite of what I need.
It removed hi,but I need it to remove the rest and only put 'hi' in the dataframe.
pseudo sonnet
oh sorry I misread lmao
well then just use if 'i' not in word
or initialize another_list as an empty list and use another_list.append(word)
umbral geode
so i just change remove(word) to append(word)?
pseudo sonnet
initialize another_list as empty as well
Python - Lists - The most basic data structure in Python is the sequence. Each element of a sequence is assigned a number - its position or index. The first index is zero, the s
umbral geode
ok so i made another_list empty
another_list=[""]
now i have no data though
if i make it an empty list
outer tusk
anyone know why this line is jsut silently failing
for column in data.columns:
data[column].transform( lambda x: x[:-1]).replace(',','')```not returning anything in jupyter
no changes made in the columns
 modern canyon
Hello, anyone here has any experience with recommendation systems?
I have this dataframe:
I'd like to take some movie/tv-series titles as input and recommend some similar items by taking in 'titleType', 'genres','averageRating' as features
How do I go about doing this?
Can cosine similarity provide good results?
If yes, how do I feed in non-numerical data as input?
marble jasper
you'd need to tokenize the non-numerical data
or vectorize I guess
for example if you did: Documentary=0, News=1, Sport=2, Drama=3, Adventure=4, Fantasy=5, Biography=6, Family=7 then your genre vectors would be:
[0, 0, 0, 1, 0, 0, 0, 0]
[0, 0, 0, 0, 1, 1, 0, 0]
[0, 0, 0, 1, 0, 0, 0, 0]
[0, 0, 0, 1, 0, 0, 1, 1]```for the five films
cosine similarity may work ok-ish for matching the genres
I don't think you should try to do cosine similarity across genres and averageRatings for example
or at least you'd need to figure out an appropriate weighting
pseudo sonnet
yeah
Up to you how much you think rating should be considered in comparison to genre
or if you don't trust yourself on that you could find a pre-trained model for movie recommendations and see what the feature importances are
serene scaffold
I think I've almost wrapped my head around neural networks. I'm trying to make one to map between vector spaces.
Softmax is a function you can use to calculate loss, yes?
Do you multiply the loss vector by each matrix of weights?
modern canyon
@serene scaffold @pseudo sonnet I see, so what are the SOTA methods for recommendation systems? I'd prefer not to use pre-trained models as I am a beginner and would love to learn and build my own models.
serene scaffold
recommendation systems? No idea, I've only done NLP.
lapis sequoia
Hi, How to convert column object to column string
frank bone
some help needed please:
im trying to get the lowest directory names in a folder structure using this code (from stackexchange):
for root,dirs,files in os.walk(starting_directory):
    if not dirs:
        lowest_dirs.append(root)```
I have to get many thousand paths back, but it's the same depth for every single one. Is there a way to define a "mindepth" so it doesnt waste so much time walking?found solution i think, ill just use this https://walkdir.readthedocs.io/en/stable/
pseudo sonnet
@modern canyon I wouldn't know, try googling. I mean my opinion is that you don't really need ML to do what you're doing. You're really just developing a similarity metric between movies based on the features you chose
An ML-appropriate problem would be optimizing that metric based on a bunch of training data
frank bone
is there any performance loss when running python code in visual studio code? or is it the real thing?
serene scaffold
@frank bone VSC isn't what's running the code, so no
frank bone
@serene scaffold i just tested it though, it was somewhat faster
Like 30-40%
30s vs 17s, multiple runs
Anyways is there something to make it even faster? Read something about c wrappers or something? Any experience how much faster it can get?
serene scaffold
if it was faster, I don't think it had anything to do with VSC.
What are you trying to do?
frank bone
Sifting through csv files and storing data in dataframes
serene scaffold
Looks like Pandas uses Cython.
frank bone
Oh so not much to gain i guess?
Or nothing
17s to sift through 12370 items, import 2 data columns from each csv and multiplying + summing them then print to console
It seems very slow imo
Gonna take like 1-2 hours for a year of data
serene scaffold
I'm not really experienced with that, though I have gotten significant performance improvements with Cython code.
I've never used pandas
frank bone
Time to investigate
But 1-2h waiting is painful
Especially if you have to make frequent changes to parameters
serene scaffold
I know that if you're using numpy, you miss out on a lot of the C optimizations if you use for loops.
that might be true with pandas as well
serene scaffold
what's an example of an operation that you do with for loops?
frank bone
Iterate through csv files