#data-science-and-ml
1 messages · Page 231 of 1
 blazing bridge
 velvet thorn
basically, .loc gets a subset of a DataFrame in the format (rows, columns)
: means "all"
 dull turtle
I am working on CNN currently. how i can get no of training samples in one variable and no. of testing samples in second variable? now i am getting this way Found 807 images belonging to 23 classes. Found 164 images belonging to 23 classes. how i can save it like "train_samples" = 807 and "test_samples" = 164 etc this way? i need these variables in cnn algorithm
 fading lake
anyone have any good books or references to get started with machine learning
 steel roost
can someone explain why this doesn't work?
first_event_frame = pd.DataFrame(first_event, columns=first_event[user][date], index=first_event[user])
print(first_event_frame)
states index must be called with a collection of some kind
 desert oar
@steel roost what is first_event?
and what is user?
index= and columns= need to be passed lists or Series or something like that
not single strings or numbers
steel roost
first event is a dictionary
desert oar
hence "must be called with a collection"
 livid flower
The size 100, does it mean that the random integer doesn't surpass 100? @flat quest
desert oar
depends on the dict but i dont think so
because its not clear how it should use the dict
can you give me an example of this first_event thing so i can see what you're trying to do
steel roost
damn, I basially want the columns now to be the row
sure 1 sec
@desert oar 'aprather5': {'05/29/2020': '07:55', '05/28/2020': '07:54', '05/27/2020': '07:54', '05/26/2020': '07:54'}}
desert oar
{
    'aprather5': {
        '05/29/2020': '07:55',
        '05/28/2020': '07:54',
        '05/27/2020': '07:54',
        '05/26/2020': '07:54'
    }
}
like this?
and how do you want the resulting data to look?
steel roost
row to be aprather, column headers to be the dates. But the time to be the data
but for some reason it shows like this when i try it:
desert oar
data = {
    'aprather5': {
        '05/29/2020': '07:55',
        '05/28/2020': '07:54',
        '05/27/2020': '07:54',
        '05/26/2020': '07:54'
    }
}

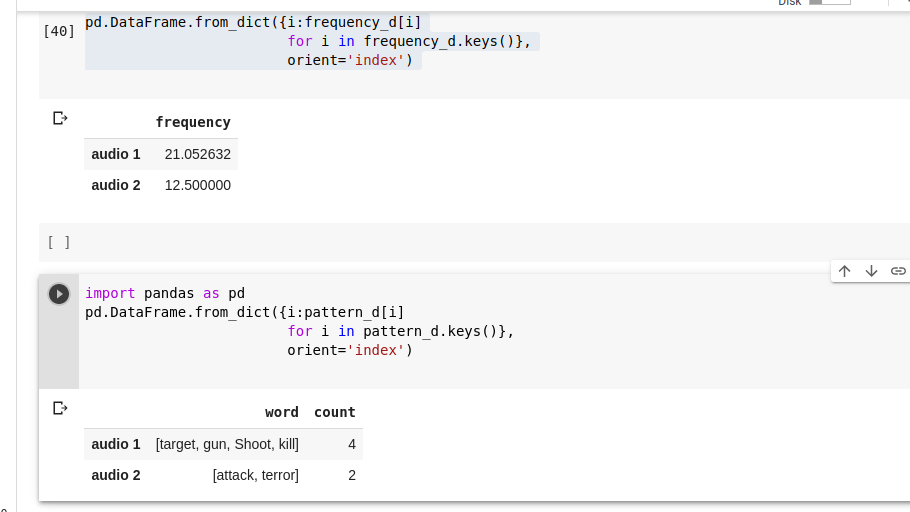
data = pd.DataFrame.from_dict(data, orient='index')
@steel roost ^
steel roost
@desert oar lets say i have several dictionaries. How would i write their values to specific columns
this is how the ouput should be:
desert oar
how does the input data look?
dull turtle
can anyone help here python File "E:\paymentz\image_save_api.py", line 155, in trainmodel steps_per_epoch = stps_per_epochs)
steel roost
i0xGSJNU
desert oar
first_event = {
    'aprather5': {
        '05/29/2020': '07:55',
        '05/28/2020': '07:54',
        '05/27/2020': '07:54',
        '05/26/2020': '07:54'
    }
}

last_event = {
    'aprather5': {
        '05/29/2020': '17:00',
        '05/28/2020': '17:00',
        '05/27/2020': '17:02',
        '05/26/2020': '17:02'
    }
}
like this? @steel roost

 arctic wedgeBOT
Pasting large amounts of code
If your code is too long to fit in a codeblock in discord, you can paste your code here:
https://paste.pydis.com/
After pasting your code, save it by clicking the floppy disk icon in the top right, or by typing ctrl + S. After doing that, the URL should change. Copy the URL and post it here so others can see it.
dull turtle
@desert oar can u help me here?
 slim fox
really? why'd they ban pastebin
steel roost
desert oar
@dull turtle you need to post the full error output and the code you used
steel roost
@desert oar
desert oar
@slim fox they also blocked github and IRC and imgur but not reddit or amazon or discord or 4chan
dull turtle
Traceback (most recent call last):
  File "C:\Users\Admin\anaconda3\lib\site-packages\flask\app.py", line 1949, in full_dispatch_request
    rv = self.dispatch_request()
  File "C:\Users\Admin\anaconda3\lib\site-packages\flask\app.py", line 1935, in dispatch_request
    return self.view_functions[rule.endpoint](**req.view_args)
  File "C:\Users\Admin\anaconda3\lib\site-packages\flask_restful\__init__.py", line 468, in wrapper
    resp = resource(*args, **kwargs)
  File "C:\Users\Admin\anaconda3\lib\site-packages\flask\views.py", line 89, in view
    return self.dispatch_request(*args, **kwargs)
  File "C:\Users\Admin\anaconda3\lib\site-packages\flask_restful\__init__.py", line 583, in dispatch_request
    resp = meth(*args, **kwargs)
  File "E:\paymentz\image_save_api.py", line 242, in post
    self.trainmodel(self,country, epochs)
  File "E:\paymentz\image_save_api.py", line 155, in trainmodel
    steps_per_epoch = steps_per_epochs)
  File "C:\Users\Admin\anaconda3\lib\site-packages\keras\legacy\interfaces.py", line 91, in wrapper
    return func(*args, **kwargs)
  File "C:\Users\Admin\anaconda3\lib\site-packages\keras\engine\training.py", line 1732, in fit_generator
    initial_epoch=initial_epoch)
  File "C:\Users\Admin\anaconda3\lib\site-packages\keras\engine\training_generator.py", line 179, in fit_generator
    while epoch < epochs:
TypeError: '<' not supported between instances of 'int' and 'str'
127.0.0.1 - - [29/Jun/2020 18:37:07] "POST /savimg HTTP/1.1" 500 -
``` @desert oaralso @dull turtle can you please wait
steel roost
well theres no error per se. Just trying to format it correctly at this point. I suck with
slim fox
🤦 blocking github soulds absolutely counter-intuitively dumb lol
steel roost
dictionaries
desert oar
yes @slim fox and i was very very vocal
i can read it
but i cant post
because its "sharing to social media" 😂
so much for filing bug reports
or making PRs to fix buggy libraries that we use
@steel roost that was directed at berlin
steel roost
oh ok
slim fox
@dull turtle can you paste on pydis paste service a piece of code that gives error too?
the error itself seems rather self-explanatory:
TypeError: '<' not supported between instances of 'int' and ```
it would seem that either `epoch` or `epochs` is a string rather than intPasting large amounts of code
If your code is too long to fit in a codeblock in discord, you can paste your code here:
https://paste.pydis.com/
After pasting your code, save it by clicking the floppy disk icon in the top right, or by typing ctrl + S. After doing that, the URL should change. Copy the URL and post it here so others can see it.
dull turtle
https://paste.pythondiscord.com/foloporabe.py see here @slim fox
slim fox
and which line of the pasted code produces the error?
slim fox
yeah I saw
what is in data and specifically data["epoch"]
it looks like it is a string? @dull turtle
desert oar
@steel roost https://repl.it/@maximum__/data-from-dicts
 slim fox
can you verify that data["epoch"] is int type? and if it is not, make it int
dull turtle
@slim fox see here
dull turtle
means ?
drop qoutes around 500 @dull turtle and try again
@slim fox
slim fox
in your request body
dull turtle
in postman?
dull turtle
yes i have "epoch": "500"
slim fox
so drop qoutes around 500
 indigo steppe
Hi,i am doing a tutorial in ml,it says it is a hello world tutorial for ml.It is a iris flower classification tutorial.So i loaded the modules and libraries and the first three line s of code are
url="https://raw.githubusercontent.com/jbrownlee/Datasets/master/iris.csv"
names=['sepal-lenght', 'sepal-width', 'petal-lenght', 'petal-width', 'class']
dataset=read_csv(url, names=names)
I understand that we are getting the csv file from that andress and we are storing it in a variable.After that it looks like we wqnt to name each column.The third line says that the program should read a csv file...can someone explain the stuff in the brackets pls?Thx
dull turtle
Traceback (most recent call last):
  File "C:\Users\Admin\anaconda3\lib\site-packages\flask\app.py", line 1949, in full_dispatch_request
    rv = self.dispatch_request()
  File "C:\Users\Admin\anaconda3\lib\site-packages\flask\app.py", line 1935, in dispatch_request
    return self.view_functions[rule.endpoint](**req.view_args)
  File "C:\Users\Admin\anaconda3\lib\site-packages\flask_restful\__init__.py", line 468, in wrapper
    resp = resource(*args, **kwargs)
  File "C:\Users\Admin\anaconda3\lib\site-packages\flask\views.py", line 89, in view
    return self.dispatch_request(*args, **kwargs)
  File "C:\Users\Admin\anaconda3\lib\site-packages\flask_restful\__init__.py", line 583, in dispatch_request
    resp = meth(*args, **kwargs)
  File "E:\paymentz\image_save_api.py", line 242, in post
    self.trainmodel(self,country, epoch)
  File "E:\paymentz\image_save_api.py", line 155, in trainmodel
    steps_per_epoch = steps_per_epoch)
  File "C:\Users\Admin\anaconda3\lib\site-packages\keras\legacy\interfaces.py", line 91, in wrapper
    return func(*args, **kwargs)
TypeError: fit_generator() got an unexpected keyword argument 'epoch'``` @slim fox see heresee here @slim fox
desert oar
you posted your server code?
dull turtle
means?
 latent wedge
whats the best module to learn as a highschool students who wants to make some simple physics simulations?
slim fox
@indigo steppe 3rd line will download the csv file from url and name columns according to names
@desert oar their code is here https://ptb.discordapp.com/channels/267624335836053506/366673247892275221/727149399964123608
indigo steppe
thank you Lossberg
dull turtle
@slim fox on which line ?
slim fox
on line 153 of what you pasted before, it seems that you used to have epochs = epoch but according to that error you now have epoch = epoch
desert oar
@latent wedge numpy is a good start
latent wedge
alright, thanks.
dull turtle
how to decide batch size in CNN ?
slim fox
it depends
there is no universal answer, but usually your upper limits corresponds to memory you have
dull turtle
wdym upper limits corresponds to memory you have?
slim fox
typically you use powers of 2 between 16 and 256
like
the bigger is the batch the more RAM you need
so if you choose it to high you may run out of RAM
slim fox
I would do 16 or 32
dull turtle
first we are running on local system then we are using a linux server
slim fox
IIRC, you want powers of 2 in order for GPUs to be able to distrubute tasks efficiently between its cores
dull turtle
ok so what i can do now then ? @slim fox
dull turtle
ok wait
steel roost
@desert oar how did you come up with this?
Jeez you took 10 mins on something that took me a week
slim fox
it takes practice. today it can take days, in a year hour, and in 2 years, only 10 min 🙂
dull turtle
@slim fox now i have kept it 16
livid flower
These guys are smart
slim fox
cool, good luck with training/predicting then @dull turtle 🙂
livid flower
Good thing there's a discord
livid flower
@slim fox can you help me now 😩
slim fox
depends. ask your question and we'll see
dull turtle
how i can get class name when predicting @slim fox

Stack Overflow
I have a functional model in Keras (Resnet50 from repo examples). I trained it with ImageDataGenerator and flow_from_directory data and saved model to .h5 file. When I call model.predict I get an a...
@slim fox how i can get accuracy of my model ?
see here model training completed but programm not getting terminated
slim fox
no need to ping me 5 times in 5 consequent messages.
why should it terminate if it is a FLASK API?
it won't stop until you shut it down
for accuracy you get your true and predicted test data set values and compute accuracy
dull turtle
for accuracy you get your true and predicted test data set values and compute accuracy
@slim fox how i can achieve this?
slim fox
dull turtle
sklearn.metrics.accuracy_score(y_true, y_pred, *, normalize=True, sample_weight=None) see here @slim fox
livid flower
# Generate synthetic data using the "data augmentation" technique
def trafo_measurements(df, num=100, fraction=0.1):
    data = {}
    idxmax = len(df.index)
    ranvals = np.random.randint(low=0, high=idxmax, size=num)
    for name in df.columns:
        if name == 'GRNN-S':
            data[name] = df[name].iloc[ranvals]
        else:
            sd = df[name].std()
            datavals = df[name].iloc[ranvals].values
            ransigns = np.random.choice([-1., 1.], size=num, replace=True)
            synvalues = datavals + ransigns*(sd*fraction)
            values = np.empty_like(synvalues)
            for i, val in enumerate(synvalues):
                if val > 0. or val is not np.NaN:
                    values[i] = val
                else:
                    values[i] = datavals[i]
            data[name] = np.round(values, decimals=3)
    data = pd.DataFrame(data, columns=df.columns)
    return data
what we can put here y_true, y_pred
slim fox
did you read the documentaton for the function?
livid flower
For the randint does the size(100) mean the value doesn't go beyond 100 or just 100 random variables
dull turtle
which function bro u are talking?
slim fox
accuracy_score, the one I linked and you ask about
in your case @livid flower 100 random values
slim fox
its used in the mid of the code synvalues = datavals + ransigns*(sd*fraction)
but to what end, I don't know
dull turtle
i have this score= model.evaluate_generator(test_set)
this is waht i get score [6.091120303608477e-05, 1.0]
@slim fox can u help here to undersstand?
slim fox
but I am sure that if you try to do prediction and use sklearn metrics fuctions you will get proper accuracy
I honestly don't remember nuances about generators and especially evalueate_generator in keras and don't have time to lookup 🤷♂️
steel roost
question. Say for instance im looping over excel sheets. How would i make python print the name of the sheet?
desert oar
just print the name of the sheet, no?
import pandas as pd

with pd.ExcelFile('my-workbook.xlsx') as xl:
    for sheet_name in xl.sheet_names:
        print(sheet_name )
        # do something
OSError: Unable to open file (unable to open file: name = 'india.model.h5', errno = 2, error message = 'No such file or directory', flags = 0, o_flags = 0)
steel roost
@desert oar tried that kinda with this:```python
for x in sheets:
df = x
name = str(x)
#DATA i want to pull out
login_attempts = {}
last_event = {}
first_event= {}
what is x though
for x in sheets:
    df = x
    name = str(x)
this is almost certainly very wrong
 lapis sequoia
anyone know why this isnt plotting as a line graph
df = df.sort_values('MIN_DATE', ascending = True)
plt.plot(df['MIN_DATE'], df['TOTAL_INCIDENTS'])
looks like a line graph, just with lots of big jumps
hard to tell from a screenshot though
desert oar
@steel roost what is sheets, a list of strings?
lapis sequoia
i could change to log y -axis scale for better visualization right?
to show it's actually a line graph
steel roost
its a list of the different sheets i pulled out
case_management = pd.read_excel(file, 'Case Management')
medical_records  = pd.read_excel(file, 'Medical Records')
QI = pd.read_excel(file, 'QI Coordinators')
navigators = pd.read_excel(file, 'Navigators')
billing = pd.read_excel(file, 'Billing')
coding = pd.read_excel(file, 'Coding')
ref_specialists = pd.read_excel(file, 'Referral Specialists')
analysts = pd.read_excel(file, 'Analysts')
credentialing = pd.read_excel(file, 'Credentialing')
admin = pd.read_excel(file, 'Admin')


sheets = [case_management, medical_records,QI,navigators,billing,coding,ref_specialists,analysts,credentialing,admin]
@desert oar
desert oar
oh
you can't get the sheet name from the dataframe
once the data frame is loaded, it has no knowledge of the original excel file
you can make a dict of dataframes instead maybe
dataframes = {
    'case_management': pd.read_excel(file, 'Case Management'),
    'medical_records': pd.read_excel(file, 'Medical Records')
}
str on a dataframe most certainly does not produce the sheet name....
 rare portal
Hello.
I wonder if you could help me figure out how to reindex a date column in a groupby operation (using pandas). Basically, I want to insert missing dates for every id given a date range. I've tried a bunch of janky alternatives, but there must be a better/proper way to do this (I assume this must be a common operation),
This is the pastebin link with example code and the latest failed attempt at using reindex.
https://paste.pythondiscord.com/denefudetu.bash
desert oar
what does "doesn't work" mean
rare portal
It doesn't actually reindex the dataframe. I don't even see a difference even though the operation succeeds.
desert oar
hm
i see
i would have expected it to work that way too
workaround: @rare portal https://repl.it/@maximum__/pandas-dt-reindex
not ideal imo
but easier to read than some kind of messy groupby operation
rare portal
workaround: @rare portal https://repl.it/@maximum__/pandas-dt-reindex
@desert oar Oh, that seems to be working! Thanks! And yeah, I've actually had issues doing groupby operations. Sometimes the results don't match expectations, and other times the performance of certain operations is way too slow (ie: shifting during a groupby). Maybe I should avoid groupby operations whenever possible...
desert oar
its not the worst, but it can be slow and can be messy with indexes
rare portal
Hmm, I celebrated too early. The code seems to add the date_range multiple times (I think it adds a date_range for every row or something like that). I'll work on debugging the code snippet though because I think this is the best way to do this.
edit:
I got it, just add .unique() to df.index.get_level_values('site')
 flat quest
was sleeping @livid flower but no it doesnt mean the random integer can't surpass 100, it just means that we select 100 random integers.
What that fn does is return a matrix of random indices of size 100, thus we select 100 values at random indices.
desert oar
good catch @rare portal
steel roost
I noticed that it keeps overiting the first sheet. i thought i could make it create other sheets.
livid flower
@flat quest that's cool, thanks man really appreciate all the help
 viral pecan
Anyone recommend a stock market data API? It can be premium, I don't mind paying.
livid flower
if I'm using augmented data, does increasing the amount of augmented data skew the results/accuracy or is it okay to use a lot?
@flat quest (sorry for at twice) so say I create 1000 random variables instead of the 100 what would be the repercussions?
Because instead of predicting the actual index value, I'm predicting if it's very good, good,fair, bad, very bad, so VG,G,F,B,VB and assigned those strings to numbers 0-4
indigo steppe
https://machinelearningmastery.com/machine-learning-in-python-step-by-step/
@drifting umbra
Omg i feel so dumb,it starts good but after a time i again get lost in the syntax.i am not sure if i can follow everything 100%.it says for beginners but i struggle even with beginners tutorial.maybe machine learning and programming isn't for me after all 🙁.i am afraid that there aren't ml tutorials out there that are made for idiots like me.sorry for the self pity text but everything is so discouraging even after 3 months of python learning

Do you want to do machine learning using Python, but you’re having trouble getting started? In this post, you will complete your first machine learning project using Python. In this step-by-step tutorial you will: Download and install Python SciPy and get the most useful packa...
@drifting umbra
Omg i feel so dumb,it starts good but after a time i again get lost in the syntax.i am not sure if i can follow everything 100%.it says for beginners but i struggle even with beginners tutorial.maybe machine learning and programming isn't for me after all 🙁.i am afraid that there aren't ml tutorials out there that are made for idiots like me.sorry for the self pity spamming but everything is so discouraging,even after 3 months of python learning
@indigo steppe
desert oar
@indigo steppe programming and data science both require a long process of building small ideas on top of other small ideas
many successful professional data scientists spend 4-8 years in school and at least 1-2 years in industry and lots of self-study before they feel confident and capable
and i think that's with a very good education and good access to resources
your focus needs to be understanding the fundamentals
if you don't understand a document or tutorial, you must ask yourself: what part of this don't i understand?
indigo steppe
yes i know,and this iris classification is like the hello world of data science and i still struggle with it.is there still hope for me?should i first practice with modules like numpy and pandas before moving to project tutorials?
desert oar
there is no "hello world" of data science
steel roost
anyone know what this is about?
File "/usr/lib/python3.8/zipfile.py", line 1336, in _RealGetContents
raise BadZipFile("File is not a zip file")
zipfile.BadZipFile: File is not a zip file
desert oar
and "hello world" in programming can be either easy or difficult depending on how familiar you are with the programming language
steel roost
with pd.ExcelWriter(FULL_REPORT, mode = 'a') as writer:
  data.to_excel(writer,index = 1, sheet_name=sheetname)
  print(sheetname+' created')
if you don't understand a document or tutorial, you must ask yourself: what part of this don't i understand?
@desert oar
mostly syntax since i am used to my previous "automate the boring stuff with python" tutorial.every line of syntax was so nice explained
desert oar
then you should know the syntax already, right?
it's possible that you read the book but did not remember what you read
which means that you need to improve your own learning methods
learning is a skill
most people cannot just read and instantly develop knowledge
it takes practice
especially if you are a total beginner
or maybe you remember what you read. but you do not really understand
maybe the book isn't that good (i personally don't like it as much as i used to)
or maybe it's not that good for you
or maybe you were distracted when you read it
etc.
and yes. numpy and scipy and scikit-learn are very big complicated libraries and they assume you have basic familiarity with the subject matter
 gray matrix
hi im just asking do i use python or pycharm
desert oar
if you don't know anything about linear algebra and matrices, numpy will be bewildering
gray matrix
is that to me @desert oar
gray matrix
ok
desert oar
your question doesnt make sense and this isn't the right channel
gray matrix
were do i do it then
desert oar
pycharm is an "IDE", which is a program that helps you write code. python is a programming language
steel roost
#help-cherries is open
gray matrix
i know so is unity java ect
desert oar
pycharm is a good IDE but it can be complicated to set up for a beginner. it might be easier to use IDLE or Thonny
indigo steppe
i made a ton of comments while going through the tutorial so i can look it up once i know i did something like that but don't remember exactly.i liked the book (actually the udemy course based on the book),but you are right,maybe there are some better options out there.so for data science,could you recommend me something?or something one step before data science?
desert oar
@indigo steppe i cannot because i dont know what exactly you are missing
can you give an example of something you don't understand
and what you don't understand about it
indigo steppe
hm,wait,i got the answer yesterday but i will show you...sec
Hi,i am doing a tutorial in ml,it says it is a hello world tutorial for ml.It is a iris flower classification tutorial.So i loaded the modules and libraries and the first three line s of code are
url="https://raw.githubusercontent.com/jbrownlee/Datasets/master/iris.csv"
names=['sepal-lenght', 'sepal-width', 'petal-lenght', 'petal-width', 'class']
dataset=read_csv(url, names=names)
I understand that we are getting the csv file from that andress and we are storing it in a variable.After that it looks like we wqnt to name each column.The third line says that the program should read a csv file...can someone explain the stuff in the brackets pls?Thx
indigo steppe
so this was the first 3 lines of code,and it isn't that complicated once explained but it gets harder and harder and i miss the explanations of the syntax
desert oar
then you need to re-read the book and memorize the syntax
there's nothing specific to data science here
you just forgot what a list literal looks like
that's fine
but then you need to go back and refresh yourself
indigo steppe
yes,i understand that we made a list and put it in a var... but the last thing was about url and names=names
desert oar
what don't you understand?
read_csv is a function
url is the url variable
names=names is passing the names variable as a keyword argument
again, you should be familiar with all of this
https://dabeaz-course.github.io/practical-python/ here, i like this book better
since you already read through AtBS you should be able to move through this more quickly
desert oar
good luck
livid flower
💀
indigo steppe
alcynic,is that skull for me? 😩
indigo steppe
man,i could need some encouragement,not skulls
livid flower
Don't worry everyone starts out at the basics man
You have to start from here to get somewhere
indigo steppe
yeah,i am the same stuff for 3 months and feel like i just mastered the hello world course
indigo steppe
well,that is the question,do i progress?but that's for another channel.maybe some "i am frustrated" channel😁
 ripe forge
General tip, always check the datatypes of whatever you're working with. Remember the real lesson here
Half your problems can be solved by just checking types
indigo steppe
I guess the other half is getting comfortable with the basics of python.maybe i want too much too quick
livid flower
start from the very basics
indigo steppe
i just wanted to move to a project that interests me,not just the basics for months
livid flower
but then again if you have done programming prior its basically just syntax
i just want to get my degree tomorrow but not how it works have to grind for 4 years
everything takes time
indigo steppe
i have done tutorials,but not that much applying it to real world problems
i guess that was a mistake
or even solving small problems...just going through stuff won't help me obviously
ripe forge
Feel free to apply your knowledge.
I think moving to a project that interests you is the right call
indigo steppe
yes,and that includes trading and ml but now i see that this is a maybe a too big and too ambitious project
ripe forge
Don't worry, no one knows "the basics" completely, because there is no such thing.
No such thing. Make progress. Read. Repeat.
desert oar
@indigo steppe i dont think its too big
i hope my comments werent interpreted as "savage"
Make progress. Read. Repeat.
this
my point was that if you don't understand something, your instinct should not be "it's too hard i can't do it"
your instinct should be "what am i missing? i should go learn it"
indigo steppe
i now see that the initial tutorial says that for now i don't need to understand everything which is a bit encouraging
and no,you weren't savage
in fact you were helpful,thank you for that.all of you guys
flat quest
@livid flower well i haven't used that augment technique ever before so not too sure of the repercussions
Personally I don't think it will really improve your results, that significantly. It may reduce overfitting in that you're adding some noise.
But from what i can see in the code, he's just adding or removing the standard deviation, while keeping the labels the same.. That can lead to label input mismatch.
 agile anvil
Can we agree on the term 'confederate' for supposed allies deliberately placed at risk?
reading no objections, so decided. @-me for appeals
desert oar
huh?
 drifting umbra
@indigo steppe i would say to avoid tutorial or stuff that gives you the code or just avoid looking at it
i have found i learn much better working thru each step and googling what i want to do such as "import csv python"
you mention syntax problems so try just search each one or problem you get
 plush crescent
What would be the best way to store information that’s organized in pandas dataframe where I need to compare changes on every new pull of data? Say I’m pulling 100 lines every second and want to compute the change of those 100 lines every second? Should I look into storing in a database? I’m wondering how feasible this all is
steel roost
import pandas as pd
df = pd.read_csv('/home/doomedapple7565/Documents/Python/Output_of_scripts/Athena_Audit_output.csv')
sorter = df.sort_values('username', ascending = True)

#creates the report
report = '/home/doomedapple7565/Documents/Python/Output_of_scripts/athena_modified_report.xlsx'
file = pd.ExcelFile(report)
FULL_REPORT = '/home/doomedapple7565/Documents/Python/Output_of_scripts/jermaine.xlsx'

sheets = file.sheet_names
#makes sheets ahead of time
for x in sheets:
    with pd.ExcelWriter(FULL_REPORT,engine='xlsxwriter') as writer:
        df.to_excel(writer, sheet_name=str(x),index=False)
can someone explain why the code above doesn't make a sheet per x?
it makes the sheets, but it keeps overiting and replacing the sheet with the next x, and basically i only end up with the last sheet
 remote raft
Presumably that's what using ExcelWriter with to_excel does and you're just doing it once for each sheet
I'd guess you would want to open the writer once, not once for each sheet
steel roost
right. I am trying o make new sheet by the name x and right the data to that new sheet created.
but it just leaves me with the last made @remote raft
is that not possible?
remote raft
Do you see that you are creating a new ExcelWriter for every sheet?
steel roost
i got it figured out...had to be really creative with it lol
just atted each data to a list.and iterated over this using tthe x as a naming template. Thanks for the advice though
fading lake
anyone got any good books or references to get started with ML
drifting umbra
Do you want to do machine learning using Python, but you’re having trouble getting started? In this post, you will complete your first machine learning project using Python. In this step-by-step tutorial you will: Download and install Python SciPy and get the most useful packa...
fading lake
ur the man thank u
 distant spire
Hello everyone, I seek some help with Pandas excel formatting and I am aware that DS people are fairly profficient in Pandas, BUT this isn't a DS question, so is this the right channel or is there a better one? 🙂
dull turtle
how to access dictionary when i have { "key" : "value" } , In my case i have "value" , how i can get which key it belongs to?
distant spire
There's no easy way to do this, you have to loop over the dict and validate if they key equals
 trim leaf
i think that's the only wayt
why would you be using a value to the key of a dict?
at that point you might as well be using a dataframe
though i have my own question
i'm playing around with gpt2 and i'm curious if there's a way to generate text without finetuning
from what i see there's no way
but i'm curious if anybody knows differently
also i'm curious
which model can i run on my computer
i have a gtx 1070 ti and 16 gigs of ram
i'm running the 355 model but i would like to get to the 700 one if possible
also going back to the dict what if you have multiple keys that have the same value?
you'll have to iterate through the whole dict to ensure that it's either unique or that the multiple keys you get back are what you're expecting
@distant spire i personally just use pandas for data cleaning and processing
then use vba if i want to create any formatting
distant spire
Problem is, I have to set this up on a Linux environment and send it out without VBA
And I swear, I have issues with such awful things like cell borders getting removed, text not being aligned properly
I have spent 3 hours y-day trying to bring back the cell borders after colouring background of the cells xD
And I am fairly certain it is easy, I just have 0 experience with Pandas and it can be overwhelming at first
dull turtle
i have a CNN image recognition model
i have two classes for prediction. 1) "passport images" 2) "driving_licence images"
it is working well as of now. When user provides "cat image" to model to recognise which is this? then it will predicts from "passport image " or "driving_licence_image"
waht we can do for "Invalid images" or "wrong images" like other than "passport" and "driving_licence"
 twin belfry
Hi all; I'm seeking some advice on Pandas.
I suspect what I'm trying to accomplish isn't hard, but I'm so green that I feel I lack the vocabulary to google effectively.
I have a CSV, one column of which contains 0...n keywords. For sake of example:
| Line | Keywords |
|---|---|
| 1 | beer, pizza |
| 2 | beer |
| 3 |
I'm trying to work with this data, display it (e.g. as a histogram), perhaps go looking for correlations or whatever.
What's the best way to ingest this CSV so I can effectively work with the data? Am I even approaching this the right way?
distant spire
Guys, I have the following piece of code, the alignment to the left side of the cells does not work, could somebody please help out? 🙂
worksheet = writer.sheets['Sheet1']
border_fmt = writer.book.add_format({'bottom':1, 'top':1, 'left':1, 'right':1})
border_fmt.set_align('left')
worksheet.conditional_format(xlsxwriter.utility.xl_range(0, 0, len(df), 3), {'type': 'no_errors', 'format': border_fmt})
worksheet.set_column('A:D', 80, cell_format=format)
writer.close()
Borders though, work fine
ripe forge
@twin belfry honestly get that data in memory first but it doesn't seem like particularly table-like. One thing is sure, all keywords should be together in one column, don't split it out further at first.
twin belfry
thanks for takling a look, @ripe forge; those are categories from free-text survey answers so one person may have yielded more than one category
so far they're all together in one column (represented as a comma-separated list themselves)
ripe forge
@dull turtle good question. Sadly models are notoriously bad at rejecting predictions. One possibility is to look at the prediction confidence, and set a threshold. But it won't be a perfect solution. One thing you may think is good, but it's bad, is trying to teach the model by making a new "other" class. The problem is, that is an open ended class, so your model can't possibly learn all different images that would cover all possible unseen data
twin belfry
bun I'm kind of at a loss as to how to proceed 🙂
ripe forge
That depends on what you want to do next
twin belfry
say, a histogram
ripe forge
I personally would probably ditch pandas at that point, and make a dictionary
twin belfry
OK
ripe forge
Take the column with keywords, convert it to a list. Iterate, split on comma, and make a dictionary counter
The keys are the keywords. The values are the counts
Keep doing a +1 for each respective keyword. And you're done
twin belfry
fair enough; I was expecting pandas to have functions for that, but perhaps I was expecting too much
ripe forge
Well, pandas very well might
But it's like trying to use a hammer when a pencil would do
ripe forge
And when you start welding hammers, everything becomes a nail. 😉
Haha i know. So, force yourself not to give in to the temptation haha. Use the right tool for the right job
twin belfry
👍
ripe forge
how to access dictionary when i have { "key" : "value" } , In my case i have "value" , how i can get which key it belongs to?
@dull turtle make a reverse mapping. One iteration, make a new dictionary where the values are now keys. Then, be aware, if the values and keys are 1:1 it's fine, but if two keys used to point to the same value, you'd have a problem in reverse mapping. You can use a list to store multiple reverse matches in that case.
dull turtle
@ripe forge i have tried with "invalid" class . I had make "invalid" folder consists of "cats , dogs, cars or other than passport and driving_licence images. Then i had trained it along with "passport images", "driving_licence images" and "invalids images". while predicting it is predicting correctly . for e.g. "cat image" predicted as "cat" this way.. is this correct way what u think for it?
ripe forge
As I mentioned, it may seem good, but you cannot possibly teach this model all possibilities of images.
Essentially the model doesn't learn that this is a bucket for random images, it rather tries to learn features and classify images into this bucket. Having said that, if you don't expect images that are going to be too varied, then stick with this, if it works for you then it's good
slim fox
with this approach you risk getting something that is unlike your target classes and invalid on which you trained. Then you can't really know what will your network predict.
One possibility is to look at the prediction confidence, and set a threshold.
This sounds like decent idea to me, you can also see the probabilities it predicted
like it gives 53% chance it's a passport and 47% it's a diriving licencse then it's pretty much a coin toss
actually, I don't remember off-hand, does it gives normalized prob across classes?
or for each class it will be 0-1 and you can have class A predicted with 0.95 and class B with 0.8?
dull turtle
how i can get parent folder name as prediction class @ripe forge @slim fox
for e.g. say i have folder structure this way "albania" -->training --> 1) driving_licence 2) passport image
--> testing --> 1) driving_licence 2) passport image
how i can get "albania" and "passport" at the time of prediction?
 winter barn
If I want to do a data science project, would you guys recommend learning with example projects, or start collecting as much data about a topic I can, and learning from doing a project around my custom data set?
ripe forge
Example projects first.
The effort required to prepare a good clean dataset is insanely high. It's one thing tutorials won't even talk about, but it's the most time consuming aspect. When starting you probably don't want to mess with that aspect though, it's easily the toughest part of the whole project
 unkempt rapids
Hey, i have been learning machine learning for 2-3 months and recently did 2 kaggle competitions.
What's the next step?
Should i focus on making more accurate models or should i focus my energy on smth else ?
Not sure where to go from here.
dull turtle
how i can make use of parent folder name at the time of prediction @ripe forge @slim fox
slim fox
please avoid repeating your questions with tags.... if/when we can answer we will
livid flower
Yeah just ping once after that I think they'll respond to all of the questions
ripe forge
You asked this same question in another room as well apparently
I remember answering it
lapis sequoia
hi y'all. I have a maybe stupid question, but is there some simple rule of thumb how much time training an LSTM takes? Something like x * Number_of_rows + y * fields_per_row + z * iterations ... = time_to_train ?
I dont need an exact number. I just want to know roughly if i am talking about minutes, hours, days or weeks
e.g. i have a set with 2.5 Mio rows and about 20 fields per row
how much would this roughly take?
desert oar
Depends on your computer
CPU will be much slower than GPU
You can also test it on a small batch and just multiply that to estimate full training time
A very simple model might take a few minutes
Bigger model, 15 minutes? An hour?
The "6 days of training on 30 GPU" models like BERT are exceptional cases
lapis sequoia
any of yall good with sql
i have a somewhat complex query i need assistance with
select x,y, count(z) as "3_month_count"
from table
where created_date >= 1/1/2017 and created_date <= 4/1/2017
group by x, y```how can i get 3 and 6 month counts from 2017-2019 in 1 table?
would i have to create new queries each time
 paper niche
COUNT(CASE WHEN ... THEN z END) is your friend
and you should be able to use created_date BETWEEN ... AND ... (both ends inclusive)
@lapis sequoia
lapis sequoia
thanks. ill try this
paper niche
@lapis sequoia You could just run for 1 epoch and see how long that takes. It would be a pretty good, rough gauge for the overall time, I would say.
lapis sequoia
im using oracle sql. why does this not work?
select count(
case CREATED_DATE_GMT
WHEN CREATED_DATE_GMT between TO_DATE('1/1/2018', 'MM/DD/YYYY') AND CREATED_DATE_GMT TO_DATE('4/1/2018', 'MM/DD/YYYY')
THEN "3_MO_2018")
FROM TABLE;
theres a red circle around the parentheses at ""3_MO_2018")"
and it says missing keyword
paper niche
I've not used Oracle before, but I imagine it'll be pretty much the same. try this:
select x, y, count(
case
WHEN CREATED_DATE_GMT between TO_DATE('1/1/2018', 'MM/DD/YYYY') AND TO_DATE('4/1/2018', 'MM/DD/YYYY')
THEN z END) AS "3_MO_2018"
FROM TABLE
GROUP BY 1,2;
so plenty of mistakes in your attempt: i) your between date1 and date2 syntax was wrong, and ii) you forgot the END for your case...when...end statement
lapis sequoia
i see. im still getting a missing keyword at the 'between' line. trying to figure out why
paper niche
if the between...and is causing issues, try without it first (i.e., go back to the original date >= d1 and date <= d2) and see whether that works
slowly chip away at the query until you get a working query, then start building up the logic bit by bit. Same debugging process as you would when programming in python, really.
lapis sequoia
will do thank you
i figured it out but im getting a different issue now lol. im gonna try to solve this myself, but thanks for the help
 safe tapir
Maybe meta for DS:
What production data aggregators do you use? Anything similar to Quandl?
lapis sequoia
got it to work. Thank you! @paper niche
paper niche
awesome
lapis sequoia
Another stupid question: I have two gpus in my computer. how can I indicate which GPU to use if I use e.g. keras to train a model? Is CPU the standard case?
If i want to visualize 3-month and 6-month spans of a value per year, is it a bad idea to use a graph that looks like this?
i'm thinking it may be bad because it sort of implies that the lines occur for the entire of year (even though i have a legend that shows 3-months and 6-months for each line)
 unreal kindle
can you make the datapoint show up as a point instead of just having the line?
like you said, the way it is, is a little bit miss-leading, but not the worst I have ever seen
unreal kindle
that should be a bit better at least
 gritty solstice
So, I'm trying to find the best way to build a Q_Table for a personal project.
Efficiency isn't a main concern, but I'm trying to take it into account. I'm not using DQN, just basic Q_Table stuff rn
I built a Tetris Environment, and push my board as a state, converting all occupied spaces as 1's and empty's as 0's
With a grid of 10x20 this obv makes 2^200 different possibilities for the board.
What would be the best way to make a smaller variable state, or perhaps what types of observations would be better? I'm pretty new to Q Learning
I can post an example of a state. Also the environment has 4 moves:
0 - move left
1 - move right
2 - do nothing
3 - rotate 90 degrees
lapis sequoia
@unreal kindle do you think this looks better
Idk if im overthinking this but it kinda looks weird
unreal kindle
if you draw the lines between them now it should be fine
lapis sequoia
Ohhh you meant line graph with a point marker
unreal kindle
yea, sorry
unreal kindle
yup! hope that works for ya
safe tapir
Maybe meta for DS:
How much CPU is required when training / inferencing with GPU? Is the CPU used primarily for I/O to/from the GPU?
lapis sequoia
hey there!
how do i convert a PIL image into .raw ?
basically how do i get the reverse of this:
with open('file.raw','rb') as scene_infile:
    scene_image_array = np.fromfile(scene_infile,dtype=np.uint8,count=W*H)
    scene_image = Image.frombuffer("I", [W,H], scene_image_array.astype('I'), 'raw','I',0,1)
plt.imshow(scene_image)
plt.show()
i have an Image object already, now i want to just turn it into a .raw file, 8 bits, black and white
 waxen burrow
Hello, i wanna know how to save data for my Python scribes in a Dynamic Library (or like a database), that can be read and allows to change their values. I know from C++ that we have .dll. Is there something similar in Python, which i could use?
 turbid hearth
can someone explain to me what this means?
i can give more context if needed
f is a variable saved to a value in a dictionary
lapis sequoia
Seems like f is a callable?
lapis sequoia
In Python, functions are first-class citizens. Which means you can pass them around as variables (and other things)
For instance:
def hello(name):
  return f'Hello {name}'

greeter = hello # Notice I'm not calling the function. No paranthesis
greeter('John') # Here I am calling 'greeter' which is in fact the 'hello' function
You mentioned that f is a variable that is saved in a dictionary. In the image you provided f is called with two arguments, str(table) and str(phylogeny)
turbid hearth
sorry im not fully understanding this. Im gonna put a pic of the whole function and I can explain what it is meant to do but there are some parts of it that are a little confusing
im just not understanding the result = f(str(table), str(phylogeny)) and dont exactly understand what exactly is being stored inside the result variable and what is being returned
also the result.name = metric part but im not sure if that is as important
ripe forge
So f must be a function
Thar line is simply calling this function f with 2 string arguments.
turbid hearth
also for some more reference the _phylogenetic_functions() returns a dictionary so wouldnt f be the value of the key specified which is "metric"?
ripe forge
Mhm.
And so, that's the right line to think along
What is being stored in the values of this dict?
turbid hearth
ripe forge
(the answer is: functions! Since functions can be used as first class objects in python. You can assign.)
turbid hearth
unifrac.faith_pd is a calculation of the diversity index
this is bioinformatics btw
ripe forge
All that is jargon to me 😅
But it's a function yes?
Function or method or any callable
turbid hearth
which part are you referring to?
ripe forge
unifrac.faith_pd is a calculation of the diversity index
@turbid hearth
If you're not sure, check the type of that.
turbid hearth
ye im trying to figure out rn
im working on this project for the first time so honestly im very lost also
just trying to understand everything
ripe forge
All good, take your time
The thing is, the code tells you those are functions because of the very line you were confused about. Also its name is a clue too. The values in this dict must be callable (functions or methods or similar)
turbid hearth
oh actually that makes sense
i was assuming that unifrac.faith_pd was just a float
but it is most likely a method that is used for some calculation with table and phylogeny as inputs
and one last thing
do the colons and arrow ( ->) just define what type should be inputted and outputted
 pale thunder
yes
turbid hearth
ok thanks everyone!
 warm pawn
how do I slice a pandas dataframe? in essence it's just this:
         column_1          column_2              column_3
0         value_1           value_2               value_3
1         value_4           value_5               value_6
2 value_7 value_8 value_9```but when I try to slice it
for example
df['column_1':'column_2'] it says I can't
TypeError: cannot do slice indexing on <class 'pandas.core.indexes.range.RangeIndex'> with these indexers [r:S1] of <class 'str'>
when I try df.loc['column_1':'column_2'] it returns an empty list
when I try df.iloc['column_1':'column_2'] it also returns an empty list
same thing when I use column 3 instead of column 2, so I know it's not an inclusion/exclusion issue
can I slice by index or something?
unreal kindle
do you just want those 2 columns in a df?
df2 = df1[['column_1','column_2']] should work
warm pawn
for now I just want to print them
what happens if you iterate over a dataframe?
such as
for x in dataframe will x be by row?
because I need to get 2 values which are in separate columns
so if that would work by row
then creating another dataframe like that would be perfect
unreal kindle
if you just want to print column_1 you can just do
print(df['column_1'])
warm pawn
sorry, i explained wrong
what I need is to simultaneously sort through 2 different columns
say
column 1 and 2
i need value 1 from column 1, and value 2 from column one (which will be in the same row)
unreal kindle
Oh, so you need the row with a certian value
warm pawn
not a specific value, I just need to parse rows
so once i got value 1 and 2 i would need 4 and 5 and then 7 and 8, in the example i sent above
unreal kindle
df[df['column_1']==somevalue] is a way to search, but I think I'm still misunderstanding
warm pawn
sorry i think i'm still explaining wrong lol
okay so i have my dataframe that i sent above
i want to separate out ONLY columns 1 and 2
unreal kindle
Columns, not rows?
warm pawn
yea
and then from those 2 columns
i want to simultaneously read what's in each of them, with a given row
so for the first pass, i want value 1 and 2
then the second pass i want 3 and 4
so on and so forth
unreal kindle
ok, so what are you trying to accomplish? are you comparing them to something?
or are you trying to just separate the values out
unreal kindle
df.iloc[0] might work, and you can iter over all of the records, or map it
var1 = df['column_1'].iloc[0]
var2 = df['column_2'].iloc[0]
alright, i'll give it a try
thanks!
it seems to work
is there a way to tell how many rows are in the dataframe?
unreal kindle
you can also iterrows
for a in df.iterrows():
  var1 = a['column_1']
  var2 = a['column_2']
yea sorry, realized that after I typed the first part out
this topic would have probably been good for one of the help channels 🙂
warm pawn
oh yeah, sorry if i clogged
unreal kindle
you're good
warm pawn
can we go to a help channel? something's gone weird
unreal kindle
sure just @ me
steel roost
any places where i can go to practice data science?
unreal kindle
steel roost
kaggle?
 real wigeon
conceptually, how would one go about this scenario:
I have a workbook, with multiple sheets, im trying to concatenate all of the sheets into one, however in certain sheets i have columns that i need to rename before i do so. Because some of the columns in have the same name, and i actually need to rename them before
 scarlet badge
you could pull them into panadas dataframes, rename them as needed, then combine
real wigeon
you mean make a new df per sheet that i need to modify
unreal kindle
if they have all the same rows you should be able to loop over and combine them
scarlet badge
ya could do it in a loop or whatever but do```pd.read_excel()
real wigeon
hmm
scarlet badge
is there a ton of sheets or something?
unreal kindle
the pandas docs have some pretty good examples
real wigeon
yeah I took a look
I attempted to solve this earlier today and I could rename the specific column, but when I ran the kwarg inplace=True, it did make the change. However when I tried to then concat the two new workbooks it reverted to the old df
I was going to use 2 workbooks, drop 1 sheet from 1; modify the other in the 2nd wb
and concat
so I didn't know if this was ideal, so I thought I'd ask how would you guys approach this problem conceptually
my first attempt was to just set the sheet name as the one I wanted to modify, modify it, than try to concat across all sheets
but after I'd rename the column, I couldn't figure out how to reset the kwarg sheetname
unreal kindle
you should read all the data in and write a new CSV
after you do what you need to do to the data
read n sheets -> combine -> do any transformation you need -> write new csv
real wigeon
well the issue is that during the combination process
concat does some funny stuff with columns of the same name
ah
unreal kindle
you should be able to do this
pd.concat([s1, s2], keys=['s1', 's2'],

          names=['Series name', 'Row ID'])
Series name  Row ID
s1           0         a
             1         b
s2           0         c
             1         d
dtype: object
so I thought maybe it would be: read n sheets -> do any transformation you need -> combine -> write new csv
unreal kindle
you could do that too, but combining them first would let you do your transforms on 1 df instead of many
scarlet badge
is it the same transforms on all sheets?
real wigeon
so my actual objective is to get all sheets, onto one sheet
but as i said concat acts funny with duplicate column names
scarlet badge
are you trying to join them instead of appending them?
real wigeon
correct
scarlet badge
ah, i see
real wigeon
it's HR data
unreal kindle
oh, join is different then concat
unreal kindle
yea, if they only share 1 or 2 columns, Join would be better
scarlet badge
you can specify the column names of a dataframe with columns=['col1','col2',...]
unreal kindle
yes that's what concat does
real wigeon
where as the join/merge would just take column 1 and place it next to column 2
unreal kindle
correct
real wigeon
but i cant merge if i don't have a unique identifier
otherwise the data isn't correlated correctly
scarlet badge
the index is not in correct order?
real wigeon
and not all worksheets actually have the identifier
well the format on one of the worksheets is not the same as the others
actually 2
it's a total of i think 4-5 worksheets
scarlet badge
dataframes have an index so if the data is in the correctly correlated order in the source sheets, just join on index. if not, sort it and reindex.
real wigeon
on 2 of the pages the index is off
unreal kindle
@real wigeon you should probs take this to a help channel
 celest comet
Hello everybody, I have a question about the field of data science. I'm learning how to clean data currently (self taught with tutorials) and I'm wondering what the short term job prospects are for somebody with that skill set?
I know Data Analysts exist and Data Scientists, but do people specifically hire data Mungers/Wranglers or do most companies expect you to fill more than that role
I'm asking because I'd like to work towards doing more stuff with data, but I'd also like to get a job and I know cleaning data can be a big part of that process.
flat quest
its likely ppl will want someone who can do more than just wrangle data
Data analysts and data scientists generally are already fairly competent in data cleaning.
Also you'll be expected to do a lot more than just data cleaning when you're doing wrangling. Cleaning is an annoying process, and takes a large amount of time, but I'd say figuring out which part of data to use and feature extraction is just as difficult of a task.
But if you become competent in data wrangling, you'll be that much farther ahead in becoming an analyst or scientist than anyone else. @celest comet
real wigeon
i suck at wrangling, are there turorials or best practices
celest comet
@real wigeon I've done a few tutorials, Codecademy has been a big help (I got a free 90 day subscription for the pandemic)
but you can find stuff everywhere
Reading the documentation for Pandas (python) is a good place to go.
 vernal cypress
Hi, i got a csv full of a months sales like this:
i use df.groupby to count each poduct sold
using py pandas
and i get this
how can i just add a seperate "quantity sold" column in here
and be able to see the other row entries in the columns
i tried df[qty] = df.groupby('lineitemname').count() but that dosent work
pobably because i need extra code to tell the rows to combine right?
but how do i do that?
dull turtle
hello i have a CNN image recognition model . eveytime a new image gets added in dataset it predict incorrect
when i increase the epoch it predicts correctly
how i can manage this ?
 acoustic halo
you are probably overfitting, there are lots of things you can do
to name a few, adding dropout, decreasing the hidden layer size/model complexity so it generalises better, adding L2 cost
dull turtle
@acoustic halo see here i m getting this way python 10/10 [==============================] - 2s 241ms/step - loss: 1.2836e-06 - accuracy: 1.0000 - val_loss: 22.3877 - val_accuracy: 0.0000e+00
ripe forge
Uh... Exactly how many images do you have?
acoustic halo
You have 0 validation accuracy and 100% training accuracy
dull turtle
@ripe forge in training?
acoustic halo
so your probably feeding the data in wrong
ripe forge
OK. Something is seriously wrong here to be getting 100% train accuracy.
You have both types of images in train yes?
acoustic halo
show us the model.fit line of code
ripe forge
And code?
dull turtle
 model.fit_generator(
                training_set,
                validation_data = test_set,
                samples_per_epoch = training_count,
                epochs = epochs,
                validation_steps = validation_steps,
steps_per_epoch = steps_per_epoch)```!pastebin
arctic wedgeBOT
Pasting large amounts of code
If your code is too long to fit in a codeblock in discord, you can paste your code here:
https://paste.pydis.com/
After pasting your code, save it by clicking the floppy disk icon in the top right, or by typing ctrl + S. After doing that, the URL should change. Copy the URL and post it here so others can see it.
dull turtle
https://paste.pythondiscord.com/wacogibisi.py see here i have code for both first it saves a image then it starts training a model line 25 onwards contain model training code @ripe forge
when i do score= model.evaluate_generator(test_set) i get this here score : [0.4805685579776764, 0.7532467246055603]
but it has predicted correctly with accuracy 0.7532467246055603
do u getting my point here bro @ripe forge
@acoustic halo is their anyone guyz 😄 ?
acoustic halo
I can't see anything that sticks out
acoustic halo
What happens if ytou sue validation_split instead of the test set while training
dull turtle
on which line @acoustic halo
 left folio
I am trying to create a dataframe from 3 nested dictionaries. I was able to create 1 from a nested dictionary but when I am trying to use all of them I get syntax error. Here's my code : https://dpaste.org/A7S1
dull turtle
@acoustic halo on which line and why u want to use validation_split?
acoustic halo
change line 152 to validation_split=0.2
test hwether there is an issue with the test_set by using the training_set to validate
dull turtle
validation_data = test_set, to validation_split=0.2 this way? @acoustic halo
acoustic halo
yes
dull turtle
let my check @acoustic halo
also i have same images in "training set folder" in 80% and "test set folder "in 20% @acoustic halo
acoustic halo
yeah, we are ignoring the test_set for now to find out what is bugged
dull turtle
same images in both folder but in ratio 80:20
ok lets see
@acoustic halo python TypeError: fit_generator() got an unexpected keyword argument 'validation_split'
see this is what i am getting
acoustic halo
sorry I guess you can not use validation_split on generators
acoustic halo
not sure, change fit_generator to fit because fit_generator is deprecated, update keras and then check your test_set generator is actually working properly
acoustic halo
yes, generators work in fit(
 silver slate
use : python model.fit(X, y, validation_split = (X_val, y_val), epochs = 200 batch_size = 32 validation_steps = 10 callbacks = callbacks)
dull turtle
  model.fit(
                #model.fit_generator(
                training_set,
                #validation_split=0.2,
                validation_data = test_set,
                samples_per_epoch = training_count,
                epochs = epochs,
                validation_steps = validation_steps,
                steps_per_epoch = steps_per_epoch)```this way ? @acoustic halo
  File "E:\paymentz\image_save_api.py", line 158, in trainmodel
    steps_per_epoch = steps_per_epoch)
  File "C:\Users\Admin\anaconda3\lib\site-packages\keras\engine\training.py", line 1118, in fit
    raise TypeError('Unrecognized keyword arguments: ' + str(kwargs))
TypeError: Unrecognized keyword arguments: {'samples_per_epoch': 169}``` @silver slate see here@dull turtle use my script it is better than your script I think
because there is some things who don't work in fit but work in fit generator
use :
python model.fit(X, y, validation_split = (X_val, y_val), epochs = 200 batch_size = 32 validation_steps = 10 callbacks = callbacks)
@silver slate
dull turtle
can i share small part of my scipt
silver slate
yes
dull turtle
see here ```python
training_samples = len(os.listdir(rf"E:\paymentz{country}\training"))
print("training_classes: ", training_samples)
steps_per_epoch = (training_count// batch_size )
print("steps_per_epoch", steps_per_epoch )
validation_steps = ( testing_count // batch_size )
print("validation_steps", validation_steps)
            model.fit(
            #model.fit_generator
            training_set,
            #validation_split=0.2,
            validation_data = test_set,
            samples_per_epoch = training_count,
            epochs = epochs,
            validation_steps = validation_steps,
            steps_per_epoch = steps_per_epoch)```
ok i check that
dull turtle
ok then what should i do here
left folio
How to merge these two dataframes? I tired saving them as df1 and df2 and did df1.merge(df2) but that gave merge error. https://imgur.com/IMVNH2K https://bpa.st/NFCA
 silver slate
If you want to use model.fit :
model.fit(training_set,
          validation_split = test_set
          epochs = epochs #you don't need samples per epochs
          batch_size = 32
          validation_steps = validation_steps
          callbacks = callbacks #only if you have calbacks)
yes
@left folio please search on Google before asking a question here : https://pandas.pydata.org/pandas-docs/stable/user_guide/merging.html
@dull turtle does it works ?
dull turtle
@silver slate see here
left folio
@silver slate Sorry - should have known better. Thank you for the help.
dull turtle
see here @silver slate
silver slate
if you want
but after, don't forget to delete the , in the previous line and add a )
dull turtle
@silver slate see herepython validation_steps = validation_steps) File "C:\Users\Admin\anaconda3\lib\site-packages\keras\engine\training.py", line 1132, in fit y, sample_weight, validation_split=validation_split) File "C:\Users\Admin\anaconda3\lib\site-packages\keras\engine\training_utils.py", line 327, in check_generator_arguments raise ValueError('If your data is in the form of a Python generator, ' ValueError: If your data is in the form of a Python generator, you cannot use `validation_split`.
silver slate
ok
euh
your data is in the format for using fit_generator : you need to create a data like (X_val, y_val)
dull turtle
i am buiding a CNN image recognition model bro , i hope u were aware of it @silver slate
dull turtle
see here @silver slate
silver slate
ok thanks
to build your differents variables, you can import your X_train in a variable name X, and your labels in an other variable name Y
after you can use the line : python X_train, y_train, X_test, y_test = train_test_split(X, y, shuffle = True, random_state = 47)
and now you have your four variables
model.fit(X_train, y_train,
          validation_split = (X_test, y_test),
          epochs = epochs,
          batch_size = 32,
validation_steps = validation_steps)```and finally use this script
dull turtle
how i can use X_train, y_train, X_test, y_test = train_test_split(X, y, shuffle = True, random_state = 47) this?
silver slate
before using it, do you have X and y ?
silver slate
Yes
dull turtle
!pastebin
arctic wedgeBOT
Pasting large amounts of code
If your code is too long to fit in a codeblock in discord, you can paste your code here:
https://paste.pydis.com/
After pasting your code, save it by clicking the floppy disk icon in the top right, or by typing ctrl + S. After doing that, the URL should change. Copy the URL and post it here so others can see it.
dull turtle
see here https://paste.pythondiscord.com/liwilekiza.py after line 28 u get my CNN code
@silver slate
silver slate
ok
dull turtle
do u get my code bro @silver slate
acoustic halo
Does anyone know what might cause sklearn NB models to hang when using .fit() with the whole dataset but not partial_fit, again with the whole dataset
Specifically: model.partial_fit(train_x, train_y, classes=list(range(0, 1000))) works
But model.fit(train_x, train_y) hangs
dull turtle
@silver slate hi bro do u get my code?
ripe forge
Just one request, please avoid pinging people unnecessarily, if people have time and are willing to help, they will see and comment.
dull turtle
ok sir apology for it
 earnest meteor
Hi, where can I deploy docker container with nvidia GPU for Deep learning? Google is to complicated, I wait like a month to give me GPU quota increase.
dull turtle
how i can add dropout layer ?
acoustic halo
model.add(Dropout(0.5)) below the layer you want to add dropout to
Obviously replace the 0.5 with thatever value you require
dull turtle
@acoustic halo see here ```python
model.add(Dense(output_dim= 64, activation='relu' ))
model.add(Dropout(0.4))```
this way?
acoustic halo
yes without the indent
dull turtle
ok
is this possible to save a model based on its loss and accuracy
if its loss is < 0.05 and accuracy > 85 then only it will save otherwise it retrain the model with increased epch
something like that?
@acoustic halo what u think about it?
 dull turtle
what exactly it is?
Whether to only keep the model that has achieved the "best performance" so far, or whether to save the model at the end of every epoch regardless of performance. @acoustic halo what it means bro?
lapis sequoia
"Do you want to save the best performing model, or the latest one"
dull turtle
best performing model
lapis sequoia
That's what it is saying
acoustic halo
You pick how it chooses the best
dull turtle
based on what?
acoustic halo
monitor='val_acc' will judge based on validation accuracy
lapis sequoia
model.fit() accepts a list of tf.kers.callback.Callback. ModelCheckpoint is one of these callback classes.
So all you do is choose what to monitor, like spagoose says. Keras handles the rest
dull turtle
ok
so i need to add this in my script?
what i am doing is " i am saving an image based on "country" and "state" and "documents type"
then i am training a model for the country for it has saved a image
so i want to save it based on its performance or accuracy
evrytime new image gets added it starts train the model
now i need to save image based on its performance or accuracy
stuck here ...
i need some guidance
for it
my training model status 10/10 [==============================] - 3s 317ms/step - loss: 7.4592e-09 - accuracy: 1.0000 - val_loss: 25.7148 - val_accuracy: 0.0000e+00
score= model.evaluate_generator(test_set) i get this [0.8791118860244751, 0.6470588445663452]
@acoustic halo see training status above
also why modelcheck point is used?
@lapis sequoia do u hav idea ?
dull turtle
how i can separate loss and accuracy from this score= model.evaluate_generator(test_set) ?
@lapis sequoia can u share some review on this score= model.evaluate_generator(test_set)?
lapis sequoia
What do you want to know? It evaluates your model and you save it to the variable score
Nothing out of the ordinary 🙂
dull turtle
can i separate loss and accuracy from it?
and based on loss and accuracy i save it
if loss < 0.05 and accuracy > 85 % then only it will save something like this?
@lapis sequoia
@acoustic halo can u share some points here score= model.evaluate_generator(test_set) about this how i can separate loss and "accuracy"
acoustic halo
it's a list with two elements, so score[0] and score[1]
dull turtle
yeah so if score[0] < 0.05 and score [1] > 85 % then it saves a model @acoustic halo this way
acoustic halo
I guess so yeah except it would be if score[0] < 0.05 and score[1] > 0.85
dull turtle
if score[0] < 0.05 and score [1] > 85 % it saves a model else again retrain a model with increased epoch by 200 say this way ? @acoustic halo
acoustic halo
To be honest, I'm not entirely sure why you would want to do that, but yes, but if a model never reaches the accuracy or loss threshold then it will run forever
dull turtle
i want to do this because prediction we get is corret @acoustic halo
acoustic halo
My point is, you can't always train a model more and more epochs to get a higher accuracy, it normally reaches a limit where it wont get better
acoustic halo
There is no magic solution, it might be impossible to get 85% accuracy, especially with such a small dataset. All you can do is change your model around and see what works best, but even then theres no guarantee you will find a better model
I think you should do some more background reading on NNs, something like deep learning with python by francois chollet, it might help you understand what you are actually trying to achieve
dull turtle
let me try doing like loss <0.05 and accuracy > 85 % then it saves otherwise it retrain with increase epoch by 100 ..
 granite shuttle
Hi guys, I'm really new in Python programming. I bought a course at udemy and do the lessons right now. In lesson 10 there was an axample about a web crawler. After the lesson I wanted to do an example on my own. Right now it's working pretty good, but I have a problem to select the next page link.
Could you please help me to find the easiest way to move to the next page at this url: https://www.mindfactory.de/Hardware/Prozessoren+(CPU).html
I tried to enclose it with:
next_link = doc.select_one(".pagination.pull-right")
but I have no idea how to just select the next page href
 lapis sequoia
if i have a continuous target variable with several levels, how can i build a predictive model to see how certain variables impact the target along with all the levels within the target
lapis sequoia
thank you
unreal kindle
yup
lapis sequoia
is there anything else i can do as well or is the answer to my question just use a partial dependency plot
unreal kindle
I think that should answer your question
you can do the plot per feature, or combine features
lapis sequoia
alright. thanks
unreal kindle
yup
 ripe marlin
from sklearn.datasets import load_wine
from sklearn.naive_bayes import GaussianNB, MultinomialNB
from sklearn.model_selection import train_test_split
wine=load_wine()
GNB=GaussianNB()
MNB=MultinomialNB()
X=wine.data
y=wine.target
X_train,y_train,X_test,y_test=(X,y, test_size=0.2)
GNB.fit(X_train,y_train)
Bad input shape error
What should i do?
lapis sequoia
check that X and y have same number of rows i'd guess
unreal kindle
try this
    x = df.copy()
    x = x.drop(columns=dependant)
    y = df[dependant]
    x_train,x_test,y_train,y_test = train_test_split(x,y,random_state=5,test_size=0.25)
@lapis sequoia how? It's an inbuilt dataset
lapis sequoia
X.shape, y.shape or try what nvrmissasho tsuggested
lapis sequoia
so i have to build the model first before using the partial dependency plot. my target is number of incidents and each incident has 6 different levels like severity 2 incident, severity 4 incident, etc.
would this mean i have to build 6 different predictive models (with the target variable for each model being the severity level) and then build a partial dependency plot for each model? @unreal kindle
unreal kindle
300, wait what are you trying to predict, number of incidents or severity?
lapis sequoia
well im trying to see how specific variables affect change in number of incidents. but incidents have different severity.
for example, in month one, if i had 100 incidents, 80 could be low severity, 15 could be medium, 5 could be high. in month two, i could have 120 incidents with 80 low severity, 20 medium, 20 high. i want to see how my variables impact the change in incident number and if possible the severity
unreal kindle
hmm
Ok, yea i don't think that would help, I thought you already had a model built
The only thing i can think of off hand is scatter plots to see the correlation between variables, or maybe a heatmap
lapis sequoia
i see
unreal kindle
f,ax = plt.subplots(figsize=(15, 15))
sns.heatmap(df.corr(), annot=True, linewidths=.5, fmt= '.1f',ax=ax)
plt.show()
so instead of building a model it'd just be seeing association
unreal kindle
yea, if I'm understanding it correctly it sounds like you need to graph out your data to understand it
unreal kindle
I would look at ranges, as well as scatterplots and histograms if applicable
lapis sequoia
the thing is
most of my data is categorical
so it seems id have to do like a cramers association
to view categorical correlation
target is numeric though
unreal kindle
Ah ok, so you might want to try and bin you target varible
using mostly catagorical data to predict a continuous variable doesn't work too well
lapis sequoia
i see, so basically dividing into categories like 0-10, 10-20, 20-30, etc?
the target^
unreal kindle
yea
lapis sequoia
and then building a cramers association
using mostly catagorical data to predict a continuous variable doesn't work too well
@unreal kindle wait im not predicting anything though
we're just viewing association right?
unreal kindle
sorry keep forgetting you aren't predicting anything >.>
lapis sequoia
lolol no worries
unreal kindle
but yea I think that would wokr
lapis sequoia
thank you though, appreciate the help!
ah wait one last thing im sorry
when im building the actual correlation, i should break the incidents down into severity and the total right?
so like do i view
- severity level 1-6 incidents
- sum of incidents
or should i just do
-severity levels 1-6 incidents
unreal kindle
I would yea. So # of incidents in each severity level
lapis sequoia
including the sum?
unreal kindle
yea, something like a stacking bar chart or stacking line plot
so you can see each of them and the total
lapis sequoia
alright thanks
 sonic scaffold
Any resources to learn data science and ml? I have shortlisted some but I'm not sure how good they are
Andrew Ng 's course on ml coursera is in matlab and octave not python does that mean that it'll be very different to switch to python later?
unreal kindle
kaggle.com has some good resources
sonic scaffold
I'll check it out thanks
dull turtle
when i do model.evaluate_generator(test_set) i am getting this [11.76180648803711, 0.09333333373069763]
 lusty coral
hey guys, so in numpy when i sort values, i want to preserve the original indexes
is it possible?
paper niche
as in np.argsort?
acoustic halo
@sonic scaffold Deep learning with python by fancois chollet is good, it's neural net/keras specific but it does teach the fundamental concepts of neural nets
If your a student, the codecademy machine leaning stuff is free too, which is good
 shell raft
Anyone know why this is giving me an error, but it still prints the correct value?
cn = str(data_entry[key]['CASENUM'])
    print(cn)
    cn = str(data_entry[key]['CASENUM'])
KeyError: 'CASENUM'
@acoustic halo I am 17 and I've heard about code academy I'll check that out too if it's free
silver slate
Anyone know why this is giving me an error, but it still prints the correct value?
@shell raft I think it is because you make a mistake when you write CASENUM because he didn t find ths key in your matrix
lapis sequoia
how do you know if you can perform time series analysis on something
for instance if i have a graph like this that shows number of occurrences in the past 12 months
how do i know time series would be a meaningful forecast for next month's number of occurrences
 umbral aspen
Hi guys - Does anyone have some examples of using a "one to rest" strategy for a multi label image classification problem? I have around 13 labels which are not well balanced and some are highly coorelated so I figure this approach might be more useful
Until now I have been using tf/keras with transfer learning/ 1 sigmoid layer at the end but my results have not been great...Which is why I am thinking about using the "one to rest" strategy
umbral aspen
Also could even be that the approach with one sigmoid layer with the number of possible labels could already be using the one vs rest strategy? I am just starting with ML so not sure..
 chilly geyser
By 1-to-rest, do you need to re-split the 'rest' into the specific label?
lapis sequoia
first you got to get it on first
chilly geyser
how do i know time series would be a meaningful forecast
^ this isn't something I think data science itself can answer. You need domain-specific knowledge.
Like, say your time-series is demand for a product. It makes sense you need to know what product you're talking about to even deduce data from it.
Time series analyses make more sense when you know there's a cycle (so your trend would repeat, good for prediction) or basically when "things don't change" - not easy to say when things actually do or don't change in a pure data science perspective other than saying good or bad fit
Either way wrt to 1-to-rest, easier to do it first and get some classification metrics and compare with those. A train/test/validation metric is more important than any theorising
lusty coral
as in
np.argsort?
@paper niche thanks 🙂
 drowsy kite
hey guys, trying to work on a personal intermediate project but don't how do you handle missing data. Im pulling data directly from WHO for corona virus stats and there is a lot of null values for different stats


how do i go about filling in these values from a statistical perspective? I cant seem to find a way to apply the mean of continents to the missing portions (would probably be best)
chilly geyser
The 'simple' methods are to use either the mean or medians
Another alternative is to throw the whole day/etc. away because insufficient data
You could also try simulation-based or other advanced methods but that'd not be easy
drowsy kite
i thought about ditching countries with not a lot of data but id assume that continents at least share similar things like: smokers, diabetic people, poverty rate, etc. I've been also looking at python interpolate() as way to connect the dots but i'm not too familiar with how exactly it would work in the situation.
what kind of advanced stuff could i look into?
chilly geyser
ah data interpolation probably assumes some kind of polynomial fit within the data?
Works better when you know endpoints (e.g. 10 day 1, 100 day 50, but no information on day 25)
As for 'advanced' stuff I think SIR is a good starting point
IIRC MIT is using a specialised S(E)IR model but I couldn't really read their code
rare portal
Hmm, is there a way to stop seaborn from 'interpolating' missing values in a graph? I feel like there should be an easy way to do this but I'm not finding it...
chilly geyser
You might want to split up that part into two plots I think?
rare portal
Hmm, how do you mean?
chilly geyser
>>> import matplotlib.pyplot as plt
>>> plt.plot(list(range(10)) + list(range(20,10,-1)))  # ugly
>>> plt.show()
>>> plt.plot(range(10,20), range(20,10,-1))
>>> plt.plot(range(10))
>>> plt.show()  # 2 lines, different colors - but changeable
Only problem I foresee is when/if you add a legend
There's a SO answer on 'combining' the legends if you need to, but I haven't tested it myself
https://stackoverflow.com/questions/26337493/pyplot-combine-multiple-line-labels-in-legend
Stack Overflow
I have data that results in multiple lines being plotted, I want to give these lines a single label in my legend. I think this can be better demonstrated using the example below,
a = np.array([[ 3....
But yeah, make it a two plot objects
I think that's the easiest way anyway
This answer advocates masked arrays, a good alternative also
https://stackoverflow.com/questions/15652503/put-a-gap-break-in-a-line-plot
Stack Overflow
I have a data set with effectively "continuous" sensor readings, with the occasional gap.
However there are several periods in which no data was recorded. These gaps are significantly longer than...
rare portal
I see, I understand now. I think I may try the masked array approach first and see how that works out. Odd that there's not a simple boolean param for doing this. Thanks for the help btw.
 lapis galleon
I have tried to group a dataframe obtaining the frequencies of coordinates X and Y. How can I store the 'count' values in an array?
rare portal
@lapis galleon You can chain to_dict or to list to get those values after the groupby and aggregation.
 still sage
does anyone have experience modelling 2d rigid tethers? i have a system where i find accelerations based on radial fields and other factors etc, and have been able to iterate a differential formula to get locations of orbits etc to be precise, but im not sure that theres merit in applying a differential system to correct the course of 2d particles without calculating paths or such beforehand? since rigid interactions essentially apply infinite acceleration to keep things a set distance away. im not sure if here is the best place to ask this, but a physics question board likely wouldnt have as much help with modelling and simulating and such.
TL;DR: is it possible to calculate how a 2d rigid tether would accelerate particles attached to it in a stepwise simulation? if so, how?
chilly geyser
😐 why wouldn't a physics board not help
A 2D rigid tether sounds more like a 2D 'fixed-distance' constraint instead
A rigid tether essentially transmits acceleration information
So in essence I think you need to
- Consider the line between the two points as solid (so can't be a wall?)
- transmit acceleration information on both points.
- seems easy. 1. I'm not too sure.
still sage
my understanding is that id calculate the acceleration of the 2 particles separately, then apply an equal and opposite acceleration (force if theyre different mass) to each one such that the distance between them after one step is the length of the tether?
and currently im only working with particles not walls so i should be ok getting them to avoid overlapping
chilly geyser
apply an equal and opposite acceleration
Huh why
still sage
rods can only exert a force in their direction right?
i mean apply an additional acceleration onto their resultants
chilly geyser
Ahhh I see
Pulling along the rod is easy, you just copy the force I think
I'm not sure about turning effect, I'd need to go to the Wiki planar-movement page to be sure about the derivatives
You should ask a dedicated physics discord/forum TBH. My dynamics is a little foggy.
A little meaning 'very very'
still sage
well thank you
i think trying to explain the problem has led me to a couple of thoughts on it
chilly geyser
Well basically you could always split the force into rod-parallel and rod-perpendicular
The parallel component should be copied
The perpendicular component decides turning, I'm not too sure how exactly it will turn
Although if the perpendicular components are the same for both points, you'd have to move the whole thing
still sage
i think the same with parallel
since a resultant parallel rightward force before the rod acceleration cant be countered
if things are equal and opposite
chilly geyser
So basically the 'hardest' part comes when the perpendicular components are not equal, you need a turning effect
still sage
yeah
chilly geyser
Well yeap that's all I can say I can't help with the details sorry
still sage
that makes sense though thank you :D
chilly geyser
:>
still sage
ill get to rotation when i do :P
dull turtle
when i do score= model.evaluate_generator(test_set) i get this score : [4.870871543884277, 0.1599999964237213]
why i am getting loss very high @acoustic halo
i am using droput layer (0.5)also
 hollow silo
need some help
  # of k in k_choices, run the k-nearest-neighbor algorithm num_folds times;   #
  # in each case you'll use all but one fold as training data, and use the     #
  # last fold as a validation set. Store the accuracies for all folds and all  #
# values in k in k_to_accuracies.```what does this mean exactly? liek if i have 5 folds
then does that mean i have to train on 4 folds each time but the validation set will change each time
 thin terrace
@hollow silo It means you will train and validate the model 5 times with different train/test splits. Letting the instances take turns in which belong to the validation data
Say your data can be represented as A B C D E
Fold 2: A B C E is training data, D is validation data
Fold 3: A B D E is training data, C is validation data
Fold 4: A C D E is training data, B is validation data
Fold 5: B C D E is training data, A is validation data```After the 5 folds you calculate the mean performance from all 5 folds.
thin terrace
You're welcome :)
dull turtle
when i do model.evaluate_generator(test_set) i am getting this [11.76180648803711, 0.09333333373069763] when epoch = 1500
score : [7.044810771942139, 0.1066666692495346] when epoch = 2000
score : [11.078099250793457, 0.17105263471603394] epoch = 2500
why i am getting high loss and accuracy here ?
dull turtle
now i am getting [4.443623065948486, 0.29870128631591797] when epoch = 2000
can anyone help here what is happening here
@acoustic halo can u hav look here bro ?
acoustic halo
Because the model isn't very good and you're probably overfitting
I face, you are almost certainly overfitting and the data you are putting in is probably not enough
As I said yesterday, you can't just add more epochs to get a better result
dull turtle
see i have training folder consists of "passport images = 35", "driving_licence images = 40" and "invalid images = 101" this way @acoustic halo
 tender wind
I am currently working with nested JSON data (one row per customer), although I am wondering how to extract feature vectors as some of the columns have an order detail. I am struggling to understand how the training set should be structured:
https://stackoverflow.com/questions/62684757/build-feature-vectors-from-nested-data
Stack Overflow
I am working with a nested JSON dataset containing various fields with different levels of granularity. The task is to evaluate some classification models to predict whether or not a user will be a