#data-science-and-ml
1 messages · Page 230 of 1
 serene scaffold
(array([23.0565851 , 22.87019498, 22.87071761]), array([112510,  12720, 112510]))
(array([23.30417445, 23.19021561, 23.3775399 , 22.90670191]), array([105295, 105295, 105295, 105295]))
(array([22.74603252, 23.22012757, 23.2737033 , 22.80527985]), array([  8198, 157740,  22032,  22032]))
(array([22.5872876 , 23.10634371, 23.04521822, 22.38311271]), array([141691, 161664, 27218, 88819]))```not sure how to use an array with three elements to lookup in a list.
 desert oar
yes, the first item in the tuple is the distances to the 3 nearest neighbors
the second item in the tuple is the positions of the 3 nearest neighbors in the tree's data
desert oar
im just reading off the docs here
serene scaffold
shrug
serene scaffold
tokenizer = transformers.BertTokenizer.from_pretrained('allenai/scibert_scivocab_uncased')
# tokenizer.to(device)
model = transformers.BertModel.from_pretrained('allenai/scibert_scivocab_uncased')
model.to(device)

def learn(mention: str) -> str:
    tensor = torch.cuda.LongTensor(tokenizer.encode(mention)).unsqueeze(0)
    bert_output = model(tensor)[0][0]
    bert_output = bert_output.cpu().detach().numpy()
    best = tree.query(bert_output, k=1, n_jobs=40)
    print(best)
    return best
whats the shape?
serene scaffold
the shape is (768,)
desert oar
so it's querying 768 points
for 1 neighbor each
so if im reading the docs right, the outputs should have shape (768, 1)
serene scaffold
The output of the kdtree query?
serene scaffold
let's see
desert oar
so it should be (768,)
serene scaffold
huh
bert_output.shape is `(768,3)
not what was wanted.
I'm surprised the kd tree is even working if the vectors are different shapes.
desert oar
well that explains it
what's the dimension of the data in the tree?
presumably also with ,3 at the end
desert oar
the docs say the last dimension should be m which is the dimension of a single data point
serene scaffold
tree.data is <class 'tuple'>: (167247, 768)
I assume that the first element is the number of elements.
desert oar
tree.data is a tuple?
serene scaffold
I'd like to think I've gotten better at documentation spelunking in recent months, but I suppose I'm not that solid on the math that underpins all of this.
desert oar
i think it has more to do with reading between the lines to understand how it stores the data internally
numpy and scipy assume you are very comfortable with array indexing
 lapis sequoia
uh i just got a 99.5% r-squared after adding and converting normalizing my numbers in the pca.. wtf lol\
desert oar
dont be like me and accidentally include the target in the features
lapis sequoia
clf =randomforestregressor(oob_score=True)

clf.fit(X_train, y_train)
y_pred = clf.predict(X_Test)

print(r2_score(y_test, y_pred)
nope theres no target
in x train or x test
this is so weird lol
i didnt normalize the numbers in the PCA and got 27% Rsquared
i normalize and get 99.5 rsquared
had to have messed something up
lapis sequoia
LOL
i mean it looks like i set it up right
X_PCA2 = df_pca_mod2.loc[:,df_pca_mod2.columns!='TOTAL_INCIDENTS']
y2= df_pca_mod2['TOTAL_INCIDENTS']
X_train, X_test, y_train, y_test = train_test_split(X_PCA2, y2, test_size = 0.25, random_state =0)

clf =randomforestregressor(oob_score=True)

clf.fit(X_train, y_train)
y_pred = clf.predict(X_Test)

print(r2_score(y_test, y_pred)```theres nothing wrong with this ??
 stray ivy
huh, that actually looks pretty simple to use
desert oar
seems more or less right
stray ivy
it just does all the regression for you?
lapis sequoia
yea
lapis sequoia
people do it online u can basically copy/paste the code too lol
desert oar
wait what? nobody is writing regression models by hand in 2020
lapis sequoia
^
stray ivy
tell that to my work
desert oar
nobody has done that since like 1999
stray ivy
we use matlab
desert oar
rather, nobody has needed to do that
oh god
i worked for a prof who wrote his own regressions in matlab
to this day i will never understand
lapis sequoia
rip
stray ivy
matlab does have good qualities to it, but for our use case, we might as well just use python
it's easier to interop with python than matlab
desert oar
yeah for real, plus any regression package worth its salt is going to write something optimized
eg QR decomposition
i see 0 value in writing that by hand
again except as a learning exercise or if youre implementing regression on a weird platform
stray ivy
to be fair, some of our regression models are nonlinear
desert oar
yeah it gets more sensible when you are writing custom models
stray ivy
we use nonlinear least squares in a couple of our models
desert oar
thats more understandable
this is random forest btw
so yes you could definitely write your own random forest implementation
but......... why
(unless you can convince your boss that its worth spending weeks of your time on, which it almost certainly isnt)
(unless you're in some very very specific application)
stray ivy
exactly
lapis sequoia
so i guess PCA with one hot encoding works and normalizing numeric variables work extremely well in my case?
since i got a 99.5% r-squared lol
even though i got 27% r squared after not normalizing numeric variables
these are out of bag y test vs y pred performances
 slim fox
dont be like me and accidentally include the target in the features
xDDD
what was data spread before normalizing?
sometimes normalization can be quite important
but from 27% to 99.5....
suspicious
lapis sequoia
im not sure. my data was 95% categorical
desert oar
Out of bag =/= test
lapis sequoia
sorry i meant it was the r squared of y test vs y pred
slim fox
yeah I remember that... But what did you do in the add? OHE + some kind of dimensionality reduction?
lapis sequoia
add?
i one hot encoded all categorical variables, and normalized the columns
wait i think it's because i may have normalized my y variable too
mistakenly
could that be why lol
slim fox
hm.... by normalizing you mean squeezed between 0 and 1 (or -1 1)?
slim fox
yeah that one
I asked cause with OHE you already have 0 or 1
so you normalized your numerical features
right?
lapis sequoia
yea
and the target variable too
should i have done that^
i think that was a mistake
the target variable is numeric
slim fox
out of the blue I would say normalizing target, if it is just one number and not a vector should not matter
while I can see how normalizing numerical value that are strongly spread along with OHE 0 and 1s can matter
nonetheless, try to not normalize target 🤷♂️
but unless I am missing something it won't matter much
at the very least it should not be wrong doing that
lapis sequoia
so you think the reason for the jump in performance is because theres strong association between the normalized numbers and the OHE predictors?
slim fox
well... you're using random forest?
lapis sequoia
yeah
i am just trying to understand why the performance had a huge spike
(btw im re-running the model without normalizing the target)
slim fox
then it's weird. Tree ML algos are supposed to be rather insensitive to scaling
lapis sequoia
oh btw
i was using PCA with a random forest
idk if you knew that
because one hot encoding resulted in 9000 columns
so i used pca to capture 90% of the variance which turned out to be ~500 columns
so the dataset used in my random forest was 6000 rows x 500 columns
wait
slim fox
I see. Still, AFAIK the most sensitive to non-normalized data are algos like KNN or SVM
while tree based algos should not be affected
due to the way they work
desert oar
yeah im surprised too
something seems very off
99.5 is insane
also r2 doesnt even make sense for random forest
the interpretation of r2 depends somewhat delicately on the model being linear regression
 hearty jewel
damn salt rock is a beast
lapis sequoia
wait this is even weirder though
so my random forest model dataset is 6000 rows x 8000 columns
and i ran a random forest
and got 99.7% test r squared
no pca
but i one hot encoded everything
but i forgot to do the actual pca
lol
so basically i one hot encoded and got 6000 rows x 8000 columns, ran a random forest on that, and got 99.7% r-squared on test
desert oar
q: is one of your features very highly correlated w/ the target?
lapis sequoia
i dont think so. not the numeric variables at least
the categorical variables im not sure because i had 250 of them
Hey, I wanna get started with ML, any tips for a beginner?
wait i think i know whats wrong
slim fox
do tell us, I am intrigued 🙂
lapis sequoia
i'll let you know
i'm waiting for this model to run before i confirm lol
thanks everyone for the help though
alright so i accidentally added duplicate columns that somehow made the model go to 99.7% lol
but i re-ran the entire one hot encoded model and got 37% R squared which makes more sense
thanks for helping out
 floral siren
kind of a weird ANOVA question
does anyone know how to do a duncans multiple range test in python
 gilded shadow
You might need to roll your own, looks complicated after looking at the definiton. But i have no idea and it very well may be that someone has already written that procedure and it's in a library on pip
 trim leaf
hey does anybody know a good pdf text extraction library?
the couple i found seem to be abondoned
hopefully one that strips out all the contextual data (such as page numbers) and leaves me with text
trim leaf
oh ok i'll look into it
lapis sequoia
it's sometimes a bit "low level" in that it gives you boxes with text and coordinates on the page, but it does the job.
I started to build something on top of that to extract rows and columns and stuff like that but it's still under development and not really usable at the moment
trim leaf
ah i see
i'm downloading it now lol
i'm just surprised that there isn't an up to date well maintained pdf library
seems like it would be useful
haha
 heavy ruin
So what is this place help with?
If is data science does that mean matplotlib in it or no? Just asking
 dull turtle
is their any python library which validates "country" and "state name" ?
 uncut shadow
wdym?
dull turtle
for e.g. see if user provides "country name" = "usa" , state_name" ="california" then this to be validated weather "state " belong to "particular country"
lapis sequoia
i
 ripe marlin
I have data in which prices are decreasing from 2013-2016. Why is the linear regression model predicting that they will increase every year from 2017?
The plot looks like this
What did i do wrong?
 blazing bridge
"R-squared tells us what percent of the prediction error in the y variable is eliminated when we use least-squares regression on the x variable."
There is one thing I wanted to ask about this, what do they mean on the x variable. Is it just saying using the x variable we have how much error is eliminated. So when we have an r-squared of say 0.65 then that means all the x variables explain 65% of the variation, so in other words means that with the current x variables we have the error eliminated is 65%.

Khan Academy
Read and learn for free about the following article: R-squared intuition
this is where I got the information from
 spark stag
@ripe marlin linear regression just creates one straight line to try and fit your dataset, as you can see in the plot, the prices have been increasing upto 2013 and overall from the start there is a overall gain in prices so although from 2013-2016 prices started to decrease, the net change in prices was positive so that is why the gradient of the slope is also positive
if you were to see that dataset and were told to drwa one startight line to best describe the data, the general trend is an increase in price with respect to time so the line should have some positive slope
ripe marlin
I see
Yeah, makes sense, the accuracy of the model is just 89%
Meaning that Linear Reg is obviously not a suitable model for this
@spark stag thanks a lot!
 noble merlin
yo what is the probability of being infected with a disease, when 1) the chance of actually being infected while being positively diagnosed is 4.7% and one was tested twice and both tested positive?
desert oar
this sounds like a homework question
noble merlin
yes @desert oar
desert oar
!rules 5
 arctic wedgeBOT
5. Do not provide or request help on projects that may break laws, breach terms of services, be considered malicious/inappropriate or be for graded coursework/exams.
desert oar
we can help with homework by guiding you to the right answer based on what you learned in your course
we cannot hand out answers, and people generally don't like the attitude of "copy and paste my HW question and hope someone answers it for me"
you will find this is true all across the internet, not just in this discord
noble merlin
ok but i did the math myself
i just need to know what the concept for this probability is
 coral walrus
anyone here with experience using pandas and sql?
arctic wedgeBOT
Asking good questions will yield a much higher chance of a quick response:
• Don't ask to ask your question, just go ahead and tell us your problem.
• Don't ask if anyone is knowledgeable in some area, filtering serves no purpose.
• Try to solve the problem on your own first, we're not going to write code for you.
• Show us the code you've tried and any errors or unexpected results it's giving.
• Be patient while we're helping you.
You can find a much more detailed explanation on our website.
desert oar
@noble merlin can you clarify your question?
coral walrus
I'll try. I'm using pandas to import data into python. I query a table and I get the result that I want. I now want to add a condition that the data has to be between 2 dates and I'm wondering if it's possible to prompt user input to query the data between date x and y.
does that make sense? @desert oar thx for your response. sorry, it's difficult for me to explain
kinda like:
date1 = input("from: 22-06-2020")
date2 = input("to: 23-06-2020")
and insert that input into the sql query/function
ripe marlin
I've a line plot and I want to change it's color after a certain value of x. How should I proceed?
 unique quest
you can always draw a line from 0 to some point in color 1 and from the next point to N in other color
i.e. two lines
serene scaffold
I have a predicted vector, and what I want is for that vector to have a cosine distance of one to a certain vector and a distance of zero to all the others
and I'm supposed to use a feed forward neural network to accomplish this.
what is happening to me?
 sharp crow
Anyone know how can i visualize my graph network?
I'm not using any external libraries like networkX to implement the graphs. Although i'm doing it from scratch. So, does anyone knows how i can visualize the nodes and edges structure of my own implemented graphs.
slim fox
I think you have two ways: either find some graph visualizer and adapt your graph to match its inputs or write your own
sharp crow
i found out some tools like pydot3, networkX and GraphViz but i guess, they are using the networkX implementation of graphs.
BTW, is there any way using matplotlib to draw the nodes on a plain graph and then connect them through lines ?
slim fox
probably you can achieve this. But it's not just "any way" - it will be DIY
sharp crow
yeah DIY is right.. thanks for replying
sharp crow
no worries man, I'll try to first do it manually and if nothing works then i'll do NetworkX in parallel .
slim fox
also you can, if you are up to challenge implenet it with some GUI framework
sharp crow
like pygame?
slim fox
if I am not mistaken @pine wolf has done something like that with Kivy
sharp crow
that would be cool if he shares some ides about it 🙂
 woeful tusk
Hey guys, I think my question belongs here. So, I’ve had 2 python classes 3 years ago due to college (I’m not from programming area). It was very good and I’ve managed to pass with a high grade. Class 1 was mostly python basics, functions, etc. Class 2 was basically using python with pandas library to work on Excel. I’ve said this to contextualize. Anyways, now I’m can’t remember a lot of the stuff I learned and I have some stuff to do in excel which I think would be better to use pandas.
I’ve tried accessing my older stuff from college but they removed it when I passed that classes.
woeful tusk
Basically I have 2 excel files which I will work on to make a third one. I’ve already managed to open the excel files as data frames using Spyder environment
 lime jewel
 ripe forge
Google everything
lime jewel
Use this link
it will tell you the command and the arguments you need
I also have a pandas related question
woeful tusk
Ive googled it, but im having trouble since im not from programming area. Ive already checked how to make a dataframe and later write it as excel. But I could not learn/figure out how to make a dataframe empty, and fill it with the rows from the first 2 files concatenating them.
lime jewel
I have two datasets with an ID column.
One dataset has twice as many rows as the other dataset (i.e., Dataset A has a subset of IDs from Dataset B). The IDs are also out of order. Dataset A has repeated IDs with different info (it has a secondary ID to distinguish between these subcases). Dataset B has only unique IDs.
I need to combine the datasets such that the information from Dataset B is appended to Dataset A in the right rows as per the ID. It is okay if Dataset B's info is repeated.
@woeful tusk explain the data
what is it?
woeful tusk
Ive already in my head that ill use an iteration with For to go through rows from file1, and concatenate it with 7-10 (chosen at random) rows from file2, but dont know how to put it in the new dataframe
woeful tusk
in file 1 the columns are age, date of subscription and name of a person (up to 1500) and file 2 the columns are a code, an action to do, and the deadline to do it
file 2 is 25 rows
lime jewel
So the output you want is something like
Age  Date of Subscription  Name  Code  Action  Deadline
22    03012016             Mary  A25   Blah    03012018
...
47    06032016             John  NaN   NaN     Nan
right?
woeful tusk
yea
lime jewel
because there are more rows in the first one?
Okay so you just need this
df1['Code'] = df2['Code']
That should add a column to df1 with the column header 'Code' with the same values that are in df2's column called 'Code'
woeful tusk
A single person in file1 will be matched with 7-10 actions (I’ll use a list and random.choice())
In file3, the persons name/age/date will appears as many times as the number of actions. It will be more like in file3 will be a row for each action assigned to a person
 safe tapir
Are custom JIT numba methods always faster than built-in pandas methods, or do you have to test and see?
For example:
def mad(x):
    return np.fabs(x - x.mean()).mean()

df.rolling(10).apply(mad, engine='numba', raw=True)
vs.
(df - df.rolling(10).mean()).abs().mean()
 pine wolf
@sharp crow https://github.com/salt-die/graphvy
heavy ruin
can someone help me with this plot thing
my dad said the first image i sended is the x-axis and the 2nd image has the y-axis has four columns of numbers in the file and my dad only wanted the first column
heavy ruin
does anyone know how to do this?
heavy ruin
does no one know how to do it? just saying
slim fox
read it with pandas as csv with separators as tabs/whitespaces
and just filter out first col
can also use awk terminal tool
slim fox
yeah
slim fox
are you famiiar with pandas?
slim fox
so you imprort pandas in your python code
and then run something like
pd.read_csv("your_file.csv", header=None, delim_whitespace=True)
also I would advice either delete or change format of first two lines
coral walrus
does anyone know if it's possible to accept user input for the date in the BETWEEN {} and AND {} criteria?
example:
a = """
SELECT SUM(
CASE WHEN dates.dates BETWEEN '2020-06-20' AND '2020-06-24' <----
AND employee_area = 'afd.56'
AND employee_shift = 'day'
AND wkday_num IN ('1','2','3','4')
THEN employees.day ELSE 0 END) AS b
FROM dates, employees
"""
@slim fox but mine is not csv file the file called 'out.tglf.eigenvalue_spectrum"
heavy ruin
ok ill try that
heavy ruin
so do i put 'import pandas as pd'
slim fox
Yep
I'd recommend you read some docs or quick start on pandas. It is really an amazing lib
heavy ruin
oh i need install pandas?
slim fox
Well of course)
heavy ruin
but u know i need to use matplotlib right?
that look like this
i am trying ploting that but idk how
heavy ruin
can u show me exmple?
slim fox
I'm on phone 🙄
slim fox
No sorry it's 1 am and I already closed and powered off everything for night
heavy ruin
rip
slim fox
I can either help in the morning, or you can see if someone else will jump in
Alternatively, there are some good guides
Like google for plotting with pandas and matplotlib
heavy ruin
can u link me to that guide
slim fox
I am sure it will find something usable
heavy ruin
but do u know what type of plot is that?
slim fox
https://towardsdatascience.com/a-guide-to-pandas-and-matplotlib-for-data-exploration-56fad95f951c smth like this to start

Medium
After recently using Pandas and Matplotlib to produce the graphs / analysis for this article on China’s property bubble , and creating a…
I see it's some spectra from names
 outer tusk
Can anyone help me with Plotly? I am getting ValueError: Lengths must match to compare on dff = dff[dff['sector'] == option_selected]
me entire code:
# CONNECT THE PLOTLY GRAPHS WITH DASH COMPONENTS
@app.callback(
[Output(component_id='output_container', component_property='children'),
Output(component_id='my_line_graph', component_property='figure')],
[Input(component_id='select_sector', component_property='value')]
)
def update_graph(option_selected): # refers to Input component property value (^above)
print(option_selected)
print(type(option_selected))
container = "The sector chosen by the user was: {}".format(option_selected)
dff = df.copy()
dff = dff[dff['sector'] == option_selected]
# Plotly Express
fig = px.line(
data_frame=dff,
x='occupancy_date',
y='occupancy'
)
return container,fig ``` safe sparrow
I'd love some help on this, as i've tried so many different approaches, and cannot find a solution
lapis sequoia
if anyone has a moment to help me debug some stuff with dataframes and a calculated column taking a v1 uuid and making a timestamp, I'd surely appreciate it!
my question and details are in #help-cake
sharp crow
@pine wolf interesting, thanks for the link. Btw is it possible to visualize the graph DS of our own implementation. I mean, I checked the networkX library and if you want to create a diagram of nodes and edges Structure then you have to implement graph network using their own graph() class
pine wolf
if you want to use any visualization library then you'll have to use a format that's relatively popular
otherwise you'll have to write your own vis library --- there's no way for these libraries to decipher arbitrary data formats
 fallow nymph
hello
blazing bridge
"R-squared tells us what percent of the prediction error in the y variable is eliminated when we use least-squares regression on the x variable."
There is one thing I wanted to ask about this, what do they mean on the x variable. Is it just saying using the x variable we have how much error is eliminated. So when we have an r-squared of say 0.65 then that means all the x variables explain 65% of the variation, so in other words means that with the current x variables we have the error eliminated is 65%.
https://www.khanacademy.org/math/ap-statistics/bivariate-data-ap/assessing-fit-least-squares-regression/a/r-squared-intuition
Khan Academy
Read and learn for free about the following article: R-squared intuition
did I interpret this correctly
 hidden bison
Hi
 steel roost
users = (df['username'])
event_types = (df['event_type'])
occurrence_date= (df['occurence_date'])
with pd.read_excel(report) as rd:
for i in usernames:
#count each date
#for each date count login
#get last and first occurrence
[8:45 AM] Doomedapple7565:
[8:46 AM] Doomedapple7565: I am tryong to count the number of 'login ' event types for each user and date
[8:46 AM] Doomedapple7565: and take the time of the first and last 'login' event
[8:48 AM] Doomedapple7565: can someone @ me with advice.
sheets = [case_management, medical_records,QI,navigators,billing,coding,ref_specialists,analysts,credentialing,admin]

test = sheets[0]
df = test
users = df['username']
dates = []

for i in users:
pass
for each user, i want to count the number of LOGINs for each date
how would i do this?
Please @ me
safe tapir
df.groupby('occurence_date').event_type.count()
Anyone know how to get rid of this ugly [conda env: xyz] notation?
desert oar
@safe tapir it looks like you have the conda nbkernel thing installed
thats just how that tool works, i dont know if there is a way to change it
this thing right? https://github.com/Anaconda-Platform/nb_conda_kernels

GitHub
Package for managing conda environment-based kernels inside of Jupyter - Anaconda-Platform/nb_conda_kernels
ahh there is a way https://github.com/Anaconda-Platform/nb_conda_kernels#configuration
GitHub
Package for managing conda environment-based kernels inside of Jupyter - Anaconda-Platform/nb_conda_kernels
 raw rapids
you have to surround it by square brackets
i.e. df.groupby('occurence_date')['event_type'].count()
@steel roost
 runic juniper
hi all - i have a question regarding opencv (lmk if this isnt the appropriate channel). basically, i have a known real-world object and a corresponding 3D model of that object, and i want to localize a camera taking photos of the real-world object, i.e. find where the camera is positioned relative to the target object. what are some ways to achieve this using cv?
 worthy phoenix
yo can anyone help me with my tensorflow-rocm setup?
 obtuse jacinth
Anyone here available to assist with a weird Jupyter Notebook issue?
Cannot get the images to show in Jupyter Notebook - only shows the <Figure Size> line
steel roost
Hey guys, What did you do to get better at data science. I am absolutely terrible at it. LOL
i have this :
for index, row in df.iterrows():
    if row["event_type"] == "LOGIN" and df['occurence_date']=='05/29/2020':
        login_counter[row["username"]] += 1
print(login_counter)
but im not understanding why this is failing. Any ideas will be appreciated
desert oar
df['occurence_date'] should be row['occurence_date'], no?
 static gull
I getting this error if someone could, help I training a custom object detection model...
ValueError: ssd_mobilenet_v1 is not supported. See model_builder.py for features extractors compatible with different versions of Tensorflow
desert oar
@obtuse jacinth thats weird, have you tried making all your subplots up front and zipping them with your data? that always works for me
@static gull it sounds like you're using something that isnt compatible with your version of tensorflow
that's all i can say from that error
static gull
I am using 2.2
should I upgrade?
or look for a upgrade
?
here is the full error
Traceback (most recent call last):
File "train.py", line 186, in <module>
tf.app.run()
File "C:\Users\PK\Anaconda3\envs\object_det\lib\site-packages\tensorflow\python\platform\app.py", line 40, in run
_run(main=main, argv=argv, flags_parser=_parse_flags_tolerate_undef)
File "C:\Users\PK\Anaconda3\envs\object_det\lib\site-packages\absl\app.py", line 299, in run
_run_main(main, args)
File "C:\Users\PK\Anaconda3\envs\object_det\lib\site-packages\absl\app.py", line 250, in _run_main
sys.exit(main(argv))
File "C:\Users\PK\Anaconda3\envs\object_det\lib\site-packages\tensorflow\python\util\deprecation.py", line 324, in new_func
return func(*args, **kwargs)
File "train.py", line 182, in main
graph_hook_fn=graph_rewriter_fn)
File "c:\users\pk\downloads\models-master\models-master\research\object_detection\legacy\trainer.py", line 248, in train
detection_model = create_model_fn()
File "c:\users\pk\downloads\models-master\models-master\research\object_detection\builders\model_builder.py", line 950, in build
add_summaries)
File "c:\users\pk\downloads\models-master\models-master\research\object_detection\builders\model_builder.py", line 326, in _build_ssd_model
_check_feature_extractor_exists(ssd_config.feature_extractor.type)
File "c:\users\pk\downloads\models-master\models-master\research\object_detection\builders\model_builder.py", line 208, in _check_feature_extractor_exists
'Tensorflow'.format(feature_extractor_type))
ValueError: ssd_mobilenet_v1 is not supported. See model_builder.py for features extractors compatible with different versions of Tensorflow
obtuse jacinth
@obtuse jacinth thats weird, have you tried making all your subplots up front and zipping them with your data? that always works for me
@desert oar I managed to get the cell of code to run - silly me had not moved any data into the test folder!! But I still can't get the images to show in Jupyter Notebook for some reason. I can view the scalars without an issue in Tensorboard, though.
desert oar
@obtuse jacinth did you forget to %matplotlib inline?
obtuse jacinth
Nope I have it in there
In the wrong place
Oh geez
Thank you!
Thank you for being the light bulb that I needed @desert oar - I appreciate it so much!
woeful tusk
Can someone help me with a basic stuff? I want to concatenate a row with 2 columns from a DF (let’s say 1) and a row with 3 columns from DF 2 to make a row in DF with 5 columns. I’m trying with concat but I get a rows mismatch columns error
This is what I’m getting
When I try with append I get cannot reindex from a duplicate axis
woeful tusk
Anyone?
 spare karma
Really enjoyed this, so I thought I'd share: https://www.youtube.com/watch?v=G5lmya6eKtc

Transfer Learning in Natural Language Processing (NLP): Open questions, current trends, limits, and future directions. Slides: https://tinyurl.com/FutureOfNLP
A walk through interesting papers and research directions in late 2019/early-2020 on:
- model size and computational e...
@woeful tusk I would use an available help channel for that my friend 🙂
woeful tusk
I thought it would belong here, but I’ll try there too
spare karma
👍
 wintry atlas
Hi all,
I'm currently attempting to build a regression model that takes into account 4 numeric variables.
I've trained it across a number of models, but can't get anything better than an Rsq value of 0.23. I've attempted to tinker with hyperparameters, but to no avail.
The models I've tried are
- LassoCV
- Ridge
- Elasticnet
- Linear
Is there anything else worth trying?
I did get a Rsq value of 0.959 when using a Backward elimination model, but when showing it a new dataset it wasn't so good.
lapis sequoia
Is it possible that after running a grid search the results are worse than default random forest results
Just means parameters from random search are worse than those of default right?
desert oar
yes
@wintry atlas have you considered that maybe your 4 features only explain 23% of the variance in your target?
also r squared doesn't say anything about the real world accuracy of your model. imo you should use it in conjunction with MSE or something that can actually be connected to the real-world problem
(unless explaining variance is in fact your goal, usually it's not)
 solid aurora
What is the proper way to run df[df['Group_ID'] in valid_group_ids]?
i.e. selecting the rows where Group_ID is in the list valid_group_ids from the dataframe df
the list is a pandas Series, not a regular python list
if it was a regular list, I could dodf[df['Group_ID'].isin(list)]
the latter seems to give me an empty dataframe when I pass a series:
np.any(df['Group_ID'].isin(valid_group_ids)) gives me false
somehow converting the series to a list just seems hacky
===
EDIT: nvm I needed the index of the series, not the values
rubber duck moment

lapis sequoia
Has anyone had a runtime error: in set_text: could not load glyph? Idk how to fix this
For matplotlib
I cant even do a plot of a column
lapis sequoia
Hi someone can help me with a Big Data and RStudio exam?
 earnest meteor
Does anyone know how GC instances work with GPU hourly?
If I add GPU it bills it montly
 unreal bridge
GC = google cloud?
 indigo steppe
i finished the automate the boring stuff with python and want to move to neural networks,deep learning and machine learning in general in trading crypto and stocks...any good source/site/book/course for someone who is still pretty new to python?
earnest meteor
mateothegreat: yes, it's google cloud
so I don't understand if the hourly rates are if the machine is on, or if I use the gpu for few hours. Let's say I setup the machine and don't touch the GPU, is the cost split or overall for the whole machine on time.
unreal bridge
you're charged for the GPU
because it's "provisioned" .. or "allocated" to your instance
whether or not you use it is up to you
earnest meteor
But I won't be charged 255$ if I don't use the instance aka is off ?
Lets say I use it 1 day
unreal bridge
yea, you're not charged if your instance isn't running
you'll be charged for the storage though regardless
earnest meteor
The storage is ok, cause it's a permament rent
unreal bridge
cool
earnest meteor
phew I though for a moment that will charge 255$ upfront 😄
unreal bridge
heh
you could also look into using TPU's
where you just rent-a-gpu (temporarily)
similar to AWS's "elastic inference"
earnest meteor
Yes, I need just to rent the GPU per hour
so TPU's don't need a VM instance?
ok, good to know the info, I will start with this, then for optimization of costs I can switch to TPU
unreal bridge
yep
 blissful cipher
Hello guys, does anybody have set up numpy as External Documentation in PyCharm? I am trying to use https://numpy.org/doc/stable/reference/generated/ but can't figure out the right macros to use 🤔
lapis sequoia
can somebody say what is a continuous label is?
i tried to use knearestneibours algorithm
when i fit it.it throwed me an error saying its a continuous label
please help me
slim fox
@lapis sequoia please show your code and perhaps a sample of data
otherwise we have no idea
lapis sequoia
i got that
i have made an error
thanks anyways for response
is this correct?
coz whenever i make a prediction there will not be 100% accuracy
wintry atlas
Hi all,
I'm currently attempting to build a regression model that takes into account 4 numeric variables.
I've trained it across a number of models, but can't get anything better than an Rsq value of 0.23. I've attempted to tinker with hyperparameters, but to no avail.
The models I've tried are
- LassoCV
- Ridge
- Elasticnet
- Linear
Is there anything else worth trying?
I did get a Rsq value of 0.959 when using a Backward elimination model, but when showing it a new dataset it wasn't so good.
@wintry atlas
This is my latest using backward elimination method with liner regression model
@here after using the backward elimination model, how do I find out what of the initial variables were used (x1, x2, x3, x4)? I began with 6.
desert oar
ooh. good question
maybe spacy has something built-in for that
i wonder if there is a grammatical or linguistic term for what you want
@ me if you find anything interesting
safe tapir

A collection of interactive demos of over 20 popular NLP models.
Same thing
A collection of interactive demos of over 20 popular NLP models.
allennlp package
should include pretrained models that you can download
slim fox
this going to my bookmarks heh
steel roost
can someone help out on my data-science question on #help-grapes ?
dull turtle
i am bulding a CNN image recognition model
i have "training folder" and "testing folder"
i have kept "1) cat images and 2) dog images in training folder
also i hav kept "cat images and dog images" in testing folder
80 % images in training folder
20% images intesting folder
in this way i have kept
also i end up with build a model which recgnizes "cat" and "dog" images
is this correct way to do this?
lapis sequoia
Do i need to log transform my target variable to create a normal distribution when using random forests?
steel roost
hey guys. After a dictionary is made, how do i add to it?
say for instance i have this:
'aprather5': {'05/26/2020': 4, '05/27/2020': 3, '05/28/2020': 3, '05/29/2020': 4}
for i in range(len(users)):
    if event_type[i] == "LOGIN":
        user = users[i]
        date = dates[i]
        time_event= timed_event[i]
        # Add the user to the dictionary if they're not in it. Give it a new dict as value
        if user not in login_attempts:
            login_attempts[user] = {}

        # If the user don't have an entry for this date, set it to 1
        if date not in login_attempts[user]:
            login_attempts[user][date] = 1

        # If the user already have an entry for this date, increment it by 1
        else:
            login_attempts[user][date] += 1
but i want to add the earliest event time. and the latest event time, even if it doesnt ="LOGIN"
ripe forge
All your code looks to be inside an if block that checks for login
steel roost
right. Im not used to using dictionaries. So i'm really struggling to use them
ripe forge
Are you used to using lists?
steel roost
yeah.
ripe forge
Then here's an analogy that may help
steel roost
but i cant ".append()" to a dictionary right?
ripe forge
Lists are like list[2] and so on for one item
Dicts are simply dict["key"] instead
So lists access values using indexes. Dicts access values using keys.
Yeah, no appends. You can simply assign, so in that sense it's even simpler than a list
steel roost
they seem so much more complicated.
ripe forge
Dict["some key"] = 42
And tada, you just added "some key"
It's a very simple and a very powerful structure. A dictionary is simply a mapping of keys to values
As a comparison, list is a mapping of indices to values.
steel roost
okay hang on
TypeError: string indices must be integers
for i in dict(login_attempts):
    print(i[date])
i is a string
Just print out login_attempts first
(but yeah, i[date] makes no sense because it is a string)
steel roost
@ripe forge will it be okay to message you in a moment. Have to go for a second
 real wigeon
Does anyone know if I have to install anaconda in order to run pandas on Jupiter note book the web version
I'm getting a file not found error
safe tapir
easier done in dataframe:
x = df.groupby(g).event_type.value_counts()
first = x.sort_index().iloc[0]  # first item
last = x.sort_index().iloc[-1] # last item

pd.concat(first, last, x.query('event_type == "LOGIN"'))
@steel roost I'm at a work terminal rather not install anything
real wigeon
Hmm I'm curious what the issue is. I can use pandas, but idk about importing files it seems
steel roost
wait it says file not found right?
have you tried to pass it the file path for file located on Jupyter
real wigeon
What do you mean
safe tapir
cast your series to df or use the [] operator
real wigeon
I copy pasted the file path
Ohhhhh
You mean I actually have to load it into the Jupiter directory in order for it to see it, since it's a web app and not on my HD
real wigeon
That makes sense, but then how would I make the call to the file in the notebook?
Just by filename
steel roost
@safe tapir did you import something specific
real wigeon
Not location, since it's relative
steel roost
do you have example code we can see @real wigeon ?
real wigeon
Well I guess my question is how do you reference files in the Jupiter binder
steel roost
@real wigeon do this for me```python
import os
directory = os.curdir
print(directory)
No
real wigeon
That ain't it
ripe forge
The r is enough
real wigeon
The things is that I added the file to the binder
ripe forge
Full trace back? Can you paste the text here
real wigeon
But I'm not referencing that file, I'm referencing the one I downloaded to the desktop
I can take a picture
ripe forge
Ah. So you're just using the wrong path?
real wigeon
It's actually to large to photograph
ripe forge
Where is this notebook running
real wigeon
It's on a webapp
ripe forge
Does the URL start with localhost?
real wigeon
ripe forge
OK. It's not on your system then
Your system's paths won't work, it's running elsewhere
Whatever file you need to use needs to exist where ever this thing is running. You'd know about that location more than us
real wigeon
Yeah that's what I was saying, I loaded the csv into the binder, but I'm not referencing it in my code
Well how would I get the location of the file if it's in my binder
ripe forge
Cool, use the paths according to this binder thing
ripe forge
There you go, that should be one way to do it. If not, again this would be something you'd know about more than us
ripe forge
Since you'd need to figure out where the files are going
You said you have a URL though for your file?
Is this file uploaded somewhere that's accessible with a URL?
ripe forge
So, where are you uploading this file, and what is this place exactly.
This binder thing or whatever
real wigeon
Yes
real wigeon
I got it to work
steel roost
nice
safe tapir
Any thoughts on ensembling classical models with modern ones?
Eg. ARIMA + GARCH + GBM?
How would you create the weighting for each model?
lapis sequoia
Anyone know why using random state 0 results in 27% R-sq for my XGBoost whereas random state 1 results in 52%
solid aurora
@lapis sequoia small amounts of data?
desert oar
@safe tapir normally don't you do something like training regression model on the individual model predictions? I see nothing wrong with ensembling models like that, as long as they give results that aren't too highly correlated
solid aurora
Also, what sort of things should I do if I'm training a classification model on heavily imbalanced data?
desert oar
@void anvil too bad but good to know
solid aurora
I don't want to throw away most of my training data to make it "balanced"
desert oar
@solid aurora you can do oversampling or undersampling with something like SMOTE
Check out the Python lib imbalanced-learn
safe tapir
smote is usually bad in practice... has negative lift in most cases
desert oar
Alternatively if you have enough data in the less frequent class, you can just use a different model performance metric that is robust to imbalance
safe tapir
you can achieve the same thing with oversample. it's also faster
desert oar
@safe tapir fair enough, I never got good results from it myself but I know it's popular
I just assumed it wasn't meant for the kind of problems Ive worked on
solid aurora
@desert oar I am looking at model performance metrics that aren't really succeptible to imbalance
safe tapir
@desert oar you train a regression model over each model's output in the ensemble and take the ratio of "most correct?" In this case I assume argmax ratio?
solid aurora
smote is usually bad in practice... has negative lift in most cases
@safe tapir what's negative lift?
safe tapir
you will get a worse model with smote
solid aurora
ah ok
safe tapir
there are a lot of assumptions when you impute data which are often broken IRL
on your training data, it will look good, but in the real world it will look bad
lapis sequoia
@lapis sequoia small amounts of data?
@solid aurora 6000 rows
solid aurora
is 6k datapoints enough for reliable XGBoost?
that seems dubious but I don't have much experience with xgboost
desert oar
@safe tapir i guess its called stacking. Use the prediction outputs as features for training another model on top
solid aurora
that's more like a pipeline I thought ^^^
desert oar
Either train that model on the main training data set, or reserve another holdout set to train it
desert oar
@lapis sequoia sorry, the stacking comment wasn't for you
solid aurora
@lapis sequoia how many features?
desert oar
In your case, some variation will always be expected when you change the random seed
lapis sequoia
@lapis sequoia sorry, the stacking comment wasn't for you
@desert oar no worries
@lapis sequoia how many features?
@solid aurora 60
desert oar
Think of how a tree-based algorithm works
lapis sequoia
In your case, some variation will always be expected when you change the random seed
@desert oar I understand but the performance doubles from 26-52% by changing the seed
desert oar
You are randomly bootstrapping rows and sampling features
solid aurora
you basically have a variance problem @lapis sequoia
lapis sequoia
I was playing around with the seed to see what would give me the best hah
desert oar
How many boosting rounds
solid aurora
somehow you need to err towards more bias
tbh I don't remember the techniques to do that
lapis sequoia
Im using col sample by tree = 0.3
Learning rate = 0.1
Max depth = 5
Alph = 1
N estimators = 100
6000x60 dataset
desert oar
For what it's worth I've never seen anything like that with such a wide range of variation by changing the seed
desert oar
@solid aurora Thats not how xgb works
solid aurora
oh oops
desert oar
Its boosting
solid aurora
ah right I forgot about that part
lapis sequoia
So should i still adjust my parameters
solid aurora
maybe try a grid search / random search to try to find optimal values?
if you have access to a cluster you can heavily speed that search up by paralellizing it
solid aurora
well if you see so much variance then your model is certainly flawed... just looking for a seed which gives you >80% isn't a good idea
solid aurora
you certainly want to change up things somehow, either by adding data/features or changing parameters or even switching your model
lapis sequoia
Sorry my score goes from 39% to 52%***
lapis sequoia
Okay thank you
 iron nimbus
How do I add a layer (a pre-existing map) to the folium.layercontrol? I want to overlay a cluster map on a Choropleth map and so far I'm only getting my Choropleth map.
 warm pawn
does anyone have experience using pysmithplot? I need to use it for something and I'm a little confused on how to
 strong trench
hey
does anyone wana help on a solitaire machine learning project im working on?
just looking for people who are interested :D, its gonna be on repl.it
 empty apex
idk much of code tbh, just starting with python tho
 sharp leaf
for some reason i cant install scikit-learn idk why
lapis sequoia
try running cmd with admin
sharp leaf
how do i do that
lapis sequoia
right click cmd and choose run as admin
lapis sequoia
?
sharp leaf
when i right click there is no options
lapis sequoia
can you ss?
sharp leaf
it says its installed but why i try and use it it says its not installed
lapis sequoia
try updating
sharp leaf
i did
lapis sequoia
did you use pip install -U scikit-learn
sharp leaf
yes
sharp leaf
k
lapis sequoia
then if you see scikit learn there,you are done
sharp leaf
it is there but if i run my script it says its not installed
lapis sequoia
where did you run? can i see?
sharp leaf
Traceback (most recent call last):
File "C:\Users\username\Desktop\code\yeeeeeeeet.py", line 1, in <module>
from sklearn import datasets
ModuleNotFoundError: No module named 'sklearn'
is the error
lapis sequoia
then you have to restart your pc
sharp leaf
k
ripe forge
Uhm, this simply means you probably have multiple python installs and the package is being installed in the wrong one
sharp leaf
i have 2 i installed it into pip3 which is the one i am using
 reef arrow
can anyone tell me why this is giving me an error? My understanding is the dictionary only has 2 values (date, and number) yet its saying there are more than 2 values?
ripe forge
Nah, your dictionary has two "types" of values, but look at the screen, the whole thing is filled with stuff
Anyways, when you type just the dictionary like that, it actually tries to just unpack keys, so even that wouldn't make sense
Print len of runspergame and you'll see how many key value pairs are there
ripe forge
Exactly. Each is a distinct key
reef arrow
i guess its probably better to just make a df of it and plot it that way
ripe forge
So then if you wish to collect all the keys in one group, and all values in another, you could simply use x= list(yourdict.keys()) and y = list(yourdict.values())
PS. Apologies, on phone. Typing code is rough
reef arrow
no worries man - you have been super helpful the last few days - lol i just need more syntax practice to get the pandas logic down
ripe forge
Pandas is pretty powerful, but honestly, I just google all the syntax every time I work with it 😅
The main thing is knowing what different methods are available. After that, syntax you can always look up
reef arrow
👍
iron nimbus
@lapis sequoia I think this might help with your unknown label type: 'continuous' -> https://stackoverflow.com/questions/41925157/logisticregression-unknown-label-type-continuous-using-sklearn-in-python

Stack Overflow
I have the following code to test some of most popular ML algorithms of sklearn python library:
import numpy as np
from sklearn import metrics, svm
from sklearn.linear_model...
lapis sequoia
thank you
dull turtle
how i can automatically train a ML model ?
uncut shadow
wdym?
indigo steppe
I am finishing atbswp udemy course.Any good source for ml in trading (neural networks,supervised data ,unsupervised data ect)? Something that somebody who is new to ml can understand...Thank you
spare karma
Any NLP scientists out there? I'm looking for ELI5 literature on dictionaries (used for sentiment analysis).
safe tapir
Gonna echo this here in case this is the better spot for this question:
#async-and-concurrency message
 flat plank
new to channel and data-science I been playing with python for long time for games and automation and retro gaming.
But recently created my 1st project simple recommender system for cold start first I did one based on tutorials using a movie database. but thought it was off track as should be more weight in genre then storyline and same with music as you you might not like same song lyrics as rock and jazz. Some I created another one using a more simple approach get_dummy values and works great but then wanted to bring more life into the results by running data against anything sentiment analysis and topic clustering. Now I want to make it a hybrid recommender but combining the two is where I get stuck.
steel roost
can someone explain what i'm doing wrong here?
for i in range(len(users)):
    user = users[i]
    date = dates[i]
    time_event = event_time[i]


    if user not in first_event:
        first_event[user]={}

    if date not in first_event[user]:
        first_event[user][date] = 1

    if time_event not in first_event[user][date]:
        print('need time HERE')
im trying to get the earliest event for each users date
my error is this:
File "/home/doomedapple7565/Documents/Python/Scripts/personal_projects/test2.py", line 75, in <module>
if time_event not in first_event[user][date]:
TypeError: argument of type 'int' is not iterable
lapis sequoia
What's the structure of first_event?
steel roost
just first_event = {}
login_attempts = {}
first_event = {}
last_event= {}

users=df["username"]
event_type=df['event_type']
dates= df['occurence_date']
event_time = df['occurence_time']

for i in range(len(users)):
    if event_type[i] == "LOGIN":
        user = users[i]
        date = dates[i]

        # Add the user to the dictionary if they're not in it. Give it a new dict as value
        if user not in login_attempts:
            login_attempts[user] = {}

        # If the user don't have an entry for this date, set it to 1
        if date not in login_attempts[user]:
            login_attempts[user][date] = 1

        # If the user already have an entry for this date, increment it by 1
        else:
            login_attempts[user][date] += 1

for i in range(len(users)):
    user = users[i]
    date = dates[i]
    time_event = event_time[i]


    if user not in first_event:
        first_event[user]={}

    if date not in first_event[user]:
        first_event[user][date] = 1

    if time_event not in first_event[user][date]:
        print('need time HERE')

print(first_event)
@lapis sequoia this is the majority of the script
im terrible at DATA and i am really trying to get better at it
'tstreater': {'05/26/2020': 1, '05/27/2020': 1, '05/28/2020': 1, '05/29/2020': 1}, 'tlawrence43': {'05/26/2020': 1, '05/27/2020': 1, '05/28/2020': 1, '05/29/2020': 1}}
lapis sequoia
I'm trying to figure out the error.
 pallid mica
Howcome this doesnt show any line at all on the graph?
from matplotlib import pyplot as plt

Distance = []

def Square(Num):
  return Num ** 2

for i in range(1,25):
  SqrdNum = Square(i)
  print(SqrdNum)

X = [(range(1,25))]

Y= [Square(SqrdNum)]

plt.plot(X,Y)

plt.show()
You're setting first_event[user][date] = 1. Then in time_event not in first_event[user][date], you try to check if time_event is in date. Since date is an integer, not a list, it errors.
steel roost
ok. Than how would i set it as a list?
wait, i think i'm getting it
'tlawrence43': {'05/26/2020': {}, '05/27/2020': {}, '05/28/2020': {}, '05/29/2020': {}}}
just need to find the earliest occurence for each date
steel roost
@lapis sequoia
how would i make this ```python
for i in range(len(users)):
user = users[i]
date = dates[i]
time_event = event_time[i]
if user not in last_event:
    last_event[user]={}

if date not in last_event[user]:
    last_event[user][date] = {}

if time_event not in last_event[user][date]:
    last_event[user][date]=event_time[i]
show the earliest time now?
lapis sequoia
I'm not sure. Maybe sort event_time?
steel roost
right now it's print the last event. But now i also need the first/earliest event
lapis sequoia
event_time.reverse() will reverse the list.
steel roost
OOOOHHH what?!?!?!?!
thats possible?? 🤦♂️
wait, would that get assigned to the time_event varialble?
@lapis sequoia that doesn't work on a series though
tried ::-i as well
steel roost
hey guys i got it to work 1 last question though
how do i right dictionaries to an excel file? each example i;ve seen uses a csv
steel roost
but how would that work with mutiple dictionaries.
they're all pretty much the same:
except for the last value:
first_event[user][date]=event_time[i]
login_attempts[user][date] += 1
@ripe forge
or can i just pass each one into a list, then pass that list to a dataframe to write the excel?
ripe forge
Do you care about keeping them as dictionaries for some reason?
Because the cleaner way is simply to start thinking of arranging the information as a table
Usually dictionaries and tables have good logical links. So, the question to you can the contents of these dictionaries fit in a tabular structure? Perhaps the keys being column names for example
If yes, prepare the dataframe based on that logical tabular layout.
steel roost
well i ld liketo write each [user] to coolumn1 and date to column2
lapis sequoia
import pandas as pd
import numpy as np
from sklearn import linear_model
from sklearn.model_selection import train_test_split
from sklearn.datasets import load_boston

boston = load_boston()

#dataframe
df_x = pd.DataFrame(boston.data, columns = boston.feature_names)

df_y = pd.DataFrame(boston.target)

df_x.describe()
hey guys sorry if this sounds dumb as I am completly new to data science but could someone explain why my code wont display anything?
lapis sequoia
okay hold on
import pandas as pd
import numpy as np
from sklearn import linear_model
from sklearn.model_selection import train_test_split
from sklearn.datasets import load_boston

boston = load_boston()

#dataframe
df_x = pd.DataFrame(boston.data, columns = boston.feature_names)

df_y = pd.DataFrame(boston.target)

df_x.describe()

#regression
reg = linear_model.LinearRegression()

#split

x_train, x_test, y_train, y_test = train_test_split(df_x, df_y, size=0.2, random_state=4)

reg.foy(x_train, y_train)

LinearRegression(copy_X=True, fit_intercept=True, n_jobs=1, normalize=False)

reg.coef_

a=reg.predict(x_test)

a[1]
i get these
lapis sequoia
ok
strong trench
import pandas as pd
import numpy as np
from sklearn import linear_model
from sklearn.model_selection import train_test_split
from sklearn.datasets import load_boston

boston = load_boston()

#dataframe
df_x = pd.DataFrame(boston.data, columns = boston.feature_names)

df_y = pd.DataFrame(boston.target)

df_x.head()
run this
tell me if it works
and then run df_y.head()
if your data is good then we can keep moving forward
lapis sequoia
strong trench
:/
you can be getting those errors if you are just running whats above
dont call the model yet
just run the data setup
lapis sequoia
ok
 lapis sequoia
oooo thanks
 stone ruin
Quick one about OpenCV, is there a way to extend the timeout time on a call like cv2.VideoCapture()?
steel roost
guys is github worth learning ?
 zealous hinge
probably
git is certainly worth learning
github and git are closely related, but not exactly the same thing
lapis sequoia
Hi guys
What requirements should be learned before learning Artificial Intelligence?
What requirements should be learned before learning Artificial Intelligence?
In mathematics and data science
 languid warren
https://www.fast.ai/ is a good start
Making neural nets uncool again
lapis sequoia
I want a list of the things I have to learn before learning AI
languid warren
if you look closely you will find the basic math you need to know for a beginning
lapis sequoia
can somebody please help me?
what is con ?
pd.read_sql('Sample-SQL-File-1000-Rows.sql')
@languid warren
Can you tell me about it?
i get an error saying missing 1 req positional argument 'con'
please help
lapis sequoia
yeah i saw that
but i can't understand though
what is the requirement for that?
please anyone?
i need to make a school project
uncut shadow
@lapis sequoia it requires 2 args: name which is name of the table and con which is connection to that db
uncut shadow
@lapis sequoia check this https://stackoverflow.com/questions/46694359/read-external-sql-file-into-pandas-dataframe
Stack Overflow
This is a simple question that I haven't been able to find an answer to. I have a .SQL file with two commands. I'd like to have Pandas pull the result of those commands into a DataFrame.
The SQL ...
 paper niche
there are examples in the pandas doc if you scroll down: https://pandas.pydata.org/pandas-docs/stable/reference/api/pandas.DataFrame.to_sql.html
example* on how to open up a sqlite connection
 ancient ivy
Does anyone here have experience with neural networks here, specifically in creating art? Not changing a given image from one style to another, but creating an entirely new piece in a given style.
stray ivy
im not the person you want, but im just curious what kind of predictor variables would be used for something like that
ancient ivy
Assuming I’m understanding your meaning correctly, I’d have a library of other images for training it.
lapis sequoia
If you're looking for what kind of Neural Network algorithms you should look into, GAN's are the way to go.
ancient ivy
Awesome, thanks! Is there a way to attach a few select tags to images? Like, if I want some images to have a certain tag, and other images to have a different tag or no tag?
stray ivy
why not make a class so you can store the tag as a string along with the image data or path to the image? just a thought
 obsidian nexus
Hello! Is there someone around with OCR experience? I've fiddled with Google Vision which gives good OCR results, but the output is actually giving me random X,Y coordinates for several images even though they have the text in the same location and the same resolution image.
Also tried tesseract with opencv, which can't even translate image into text properly. Even tried that in a binary format.
 wise pine
hi
    >>> X = np.array([[1, 1], [1, 2], [2, 2], [2, 3]])
    >>> # y = 1 * x_0 + 2 * x_1 + 3
    >>> y = np.dot(X, np.array([1, 2])) + 3
here
does the 2nd column also get multiplied ?
2nd column of X
i mean this is multivariable linear regression ?
 acoustic forge
Hey guys. I’m starting my data science major in September. Now that I have some months off, I’d really like to prepare for that. So, what are some recommendations you guys might have, in terms of how to prepare?
 livid flower
Anyone know where to find data augmentation example codes, doing a project but don't have that much data
livid flower
All the data augmentation guides I see are images but I'm not working with images
 flat quest
what are you trying to augment? @livid flower
livid flower
@flat quest using some transformer characteristics to predict the health index, but I only have like 50 transformers working with, not sure if that's enough for the neural network
flat quest
what do you mean transformer characteristics?
you mean the transformer architecture?
@livid flower
livid flower
So like the moisture content, acidity, breakdown voltage etc., To predict it's insulation state
Its
So the characteristics are combined to determine health index score, so the features would be the characteristics, and the label would be the index value
@flat quest
 cursive sun
oooooooooh I know this one
do you have lots of examples of transformers but not lots of ones with the health index listed?
livid flower
Well I only have 55 transformers in total lol
cursive sun
ok, but do you have extra unlabled examples you could find?
because you can one-shot learn it
livid flower
I'm just gonna calculate their hi, I tried looking on kaggle but don't see any datasets for it
flat quest
oh gotcha
well for data augmentation you have to be fairly careful. If we take images for example, a number that is zoomed in such as 9 is still a 9.
But rotate 9 and it becomes a 6. When you augment data, you have to be careful that the augmentation doesn't actually change the value.
In this particular case, its best to just gather more data from an online dataset, since changing the value of your features slightly can make the actual label value change.
Unlike for example zooming on an image
livid flower
Yeah I have some unlabeled ones
flat quest
maybe theres some datasets made by some unis
cursive sun
ok, if you have unlabled ones you can try basic one-shot techniques
livid flower
Ohhh I see, so having small dataset is better than making it larger by augmenting?
cursive sun
try setting up a simple variational autoencoder on your unlabled data
flat quest
well augmenting is better as long as it doesn't affect the labels
in this case
augmenting would affect the labels
cursive sun
then running normal statistical methods on the latent space with the labled data
you reduce the dimensionality of the problem hugely
livid flower
@cursive sun explain that lol cause I'm like fairly new to data science, I'm doing this for my final year project
Thanks @drag
@flat quest
cursive sun
I actually have a bunch of images for this because I'm writing a paper on it now
flat quest
yeah np
cursive sun
but it's very simple
livid flower
👀 simple
flat quest
final year project for college?
flat quest
its mostly just difficult terminology
concept isn't that hard
cursive sun
basically, you have a neural network that takes some complicated information with a lot of dimensions
compresses it down to just a few dimensions
and then tries to learn a decoder network that figures out what the high dimensional input was
basically, it takes the complicated data, like an image, and compresses it to 2 or 3 numbers
livid flower
@cursive sun for the unlabeled ones, do the features have to be exactly the same amount, or can I just use some of them?
cursive sun
where you're missing features you can just use a placeholder number
so all missing features can be -1 for example as long as -1 doesnt naturally occur in the data
but basically, the key is you want to use some kind of tool to take your high dimensional unlabled data and place it in a low dimensional space
then, you can take your much less numerous labled data and project it to that space
and use standard ML methods that work in low dimensional spaces
tl;dr: find method that turns high dimensional data into low dimensions, then apply low dimensional techniques
livid flower
So this technique, will use the other transformer data to do what with the unlabeled ones?
cursive sun
so you use the unlabled data to learn what transformers tend to 'look like'
you learn low dimensional representations
uh, like, an example might be if I asked for a tonne of information, not including their political leanings, about 50 people and if they liked donald trump or not
you would have an easier time taking huge amounts of information from census forms and projecting it into a low dimensional space that would naturally pick up big groupings
then using that low dimensional projection to make predictions
flat quest
hm but doesn't that suffer from information loss as well?
and with the limited data that alcynic has, that info loss might be critical?
not too sure, don't have too much exp in this area
cursive sun
yeah, there's information loss for sure, but otherwise you run huge overfit risks
flat quest
true
cursive sun
it's a trade-off, but it works well in many situations
like you could go wild into MDL methods, but there's no guarantee that will work
livid flower
Can you direct me to where I can read on this, is there a way to determine the accuracy of using this method too? Would it be more accurate than say just using the minimal data?
cursive sun
i think this is a paper on it
I skimmed it but there's all the right words
from what i can gather it's VAE->2d space -> some statistical work
I think you generally just want to learn about one-shot learning
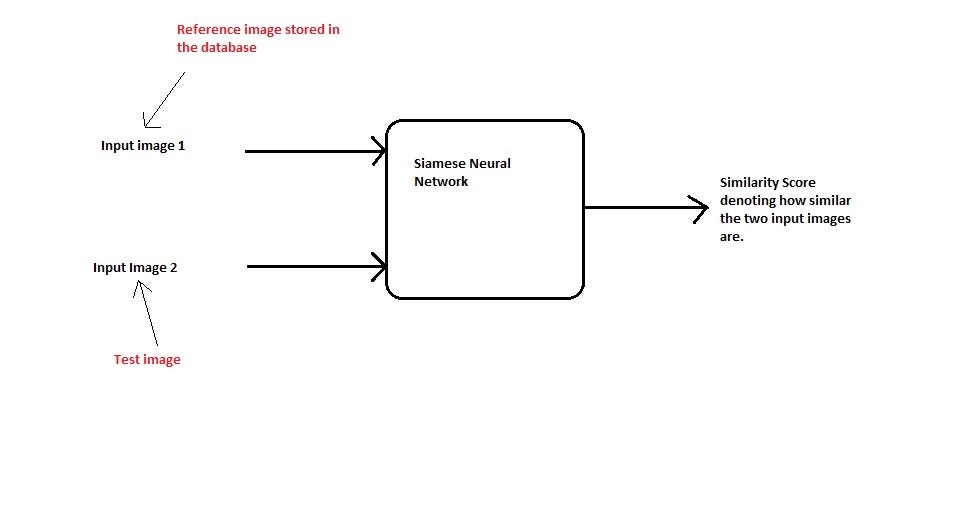
this is probably something easier
flat quest
hmmm yeah this one's a fairly simple approach
And it reduces overfitting, esp on a smaller dataset like alcynic. So a fairly good route to take.
cursive sun
thanks, I like it
flat quest
whats your paper about btw?
cursive sun
Image-Context contextual multi-armed bandits
basically, here's a picture of my cat, does it have diabetes lmao
flat quest
lol
cursive sun
but yeah, I used to be big into compressive sensing and all that
I honestly very much like this though
man 2017 was a long time ago lmao
flat quest
so reducing image dimensionality, then making classificationson it?
i think it'll be interesting to see if we can use ml in mainstream file compression, tho i doubt that'll happen anytime soon
for sure
2017? is that when you started this paper?
cursive sun
uh kinda, in this case you're presented several choices
and you gotta pick the one that you think is most likely to induce some kinda reward
so you also have to worry about not only 'is this result likely to induce reward' but will other results I havent really explored produce more reward
and how do I balance exploration vs reward gathering
flat quest
ah a reinforcement learning problem?
cursive sun
Kinda not really, there's no way that your actions influence the state
so it's like related, but what you do won't influence what future choices you are given
flat quest
ah gotcha
so the choices you're given is already set
just a matter of choosing the one thats likely to give the greatest return?
i'm guessing the loss calculation on this is quite complex?
cursive sun
no, the loss calculation isn't that wild haha, none of the individual steps are really that complex
it's just slapping things together
bear in mind this paper is only like a month old
should be out the door next week tho
livid flower
Thanks @cursive sun I'm gonna read up on it, it actually looks like it's gonna be helpful considering the small dataset, I saw a similar project use just 40 transformers so idk, but it's better to be safe than sorry, I really need to finish and it's the final thing I have to do to graduate
cursive sun
yeah, honestly lots of low dimensional methods will work fine on a 50 element dataset
you just need to take your high dimensional data to a low dimensional form
worst case use something like LASSO regression
flat quest
lol, well thats good
lmk when the paper is out 😄
indigo steppe
Guys i need help.I just finished automate the boring stuff with python video course and want to move to machine learning.I watched 2-3 videos and i get lost pretty quick.Is there any machine learning course for bloody noobs like me?Doesn't have to be a course where i predict the position of the stars in our solar system,just simple stuff.I really don't understand some syntax and some concepts when watching tutorials.I have invested so much time into getting into basic python stuff and now i am COMPLETELY lost.Pls help
 drifting umbra
@indigo steppe Hi, congrats on your progress with Python
i would recommend some basic machine learning problems on Kaggle and Analytics Vidha
iris prediction is one of the basic / intro suggested data sets
try these

This article lists the best machine learning, data science projects for beginners to advanced level with example code to boost your knowledge and skills.
Beginner Level: 1. Iris Data Set
you'll prob have to learn Pandas and numpy as you go
indigo steppe
Thank you,when i watched the tutorials i felt like i did when i first printed hello world.so intimidating and so discouraging...a bit frustrating since i understood the basics pretty much and now i don't understand jacksh...everyone is suggesting pandas and numpy but i feel like this whole ml stuff is something for nasa or google scientists.i just feel like a 1st grader watching some algebra.thx for the link bastiat
drifting umbra
what ide do you use?
for data science i would recommend jupyter noteboooks
take it step by step
such as importing a csv file
indigo steppe
yes,i am using vs studio code with the jupyter notebook addon.i love jupyter,can't live without it.i see the iris tutorial mentions R.when i sign up,is there a step by step python tutorial as well?
oh i see i have to pay for the course,anything free? ☺️
drifting umbra
oh i am sorry did not see it is paid

Do you want to do machine learning using Python, but you’re having trouble getting started? In this post, you will complete your first machine learning project using Python. In this step-by-step tutorial you will: Download and install Python SciPy and get the most useful packa...

If you want to master machine learning, fun projects are the best investment of your time. Here are 6 beginner-friendly weekend ML project ideas!

(sorry for spamming channel)
indigo steppe
Thank you,you made my day.I hope this will be a bit easier for me.Thank you so much
drifting umbra
no problem and be sure to google or ask any questions 🙂
indigo steppe
I will
flat quest
kaggle's where you'll have a lot of improvement
force you to think 😉
livid flower
@flat quest I found a code online where he used similar dataset and augmented...but I have no idea what it's saying lol 😕
flat quest
rip :/
the way that billo was talking about? reducing dimensionality?
drifting umbra
with tf.device('/device:GPU:0'):
  # define the keras model
  model = Sequential()
  model.add(Dense(64, input_dim=296, activation='relu'))
  model.add(Dense(64, activation='relu'))
  model.add(Dense(64, activation='relu'))
  model.add(Dense(1, activation='sigmoid'))
  # compile the keras model
  adam = keras.optimizers.Adam()
  model.compile(loss='binary_crossentropy', optimizer=adam, metrics=['accuracy'])
  model.fit(X_train, Y_train, epochs=100, batch_size=1, shuffle=True)


  print(model.summary())
does this force it to run on gpu 100% ?
does not seem faster
livid flower
nah online it just says "data augmentation technique"
how do i copy a code like that @drifting umbra
drifting umbra
three of these next to 1 key: `
then paste code
then put three of these at the end on a new line: `
livid flower
thanks
# Generate synthetic data using the "data augmentation" technique
def trafo_measurements(df, num=100, fraction=0.1):
    data = {}
    idxmax = len(df.index)
    ranvals = np.random.randint(low=0, high=idxmax, size=num)
    for name in df.columns:
        if name == 'GRNN-S':
            data[name] = df[name].iloc[ranvals]
        else:
            sd = df[name].std()
            datavals = df[name].iloc[ranvals].values
            ransigns = np.random.choice([-1., 1.], size=num, replace=True)
            synvalues = datavals + ransigns*(sd*fraction)
            values = np.empty_like(synvalues)
            for i, val in enumerate(synvalues):
                if val > 0. or val is not np.NaN:
                    values[i] = val
                else:
                    values[i] = datavals[i]
            data[name] = np.round(values, decimals=3)
    data = pd.DataFrame(data, columns=df.columns)
    return data
so 'GRNN-S' would be the index score and data would just be what's read from the csv file @flat quest but idk what's going on besides that
drifting umbra
oh i am sorry
i forgot to mention if you put the word python without a space, after the three `. it will do colored formatting @livid flower
at the top
livid flower
yeah i did
 plush crescent
I got a pandas Dataframe that looks like this with the column after date named One and the next Two and so on. I'm running into a problem when I'm trying to do math.
When I want to do something like df['One'][1] - df['Two'][1] I get an error 'Not supported between instances of 'numpy.ndarray' and 'str'
I've tried using df.to_numpy() but then I seem to lose all structure of that dataframe. Is there a way I can convert all these so I can compute them without losing the structure?
flat quest
@livid flower so theres a bit to digest here but here's basically what its doing
ranvals = np.rand.int This part here is generating random integers of size num (100)
He then goes through each column name in df.columns
and if the name is GRNN-S, he gets 100 random values from that column. The iloc will match any random index with the indices of the column and return the values at those col indices.
If column name is something else.
he gets those random 100 values, and adds or subtracts sd * fraction (standard deviation * porportion) and sets it to synvalues
then he iterates over these new synthetic values
and if they are greater than 0 or not nan, he keeps, them, otherwise, he gets the original random value at that index.
Then he rounds them and returns the dataframe
well thats probably because one is of type str and the other isnt
you can't add a number to a date @plush crescent
numpy doesn't know how to do that
plush crescent
The date is just the index. It's not being used in the math. For example with the above image I would be trying to do 9752.12 - 9758.35
Using type() all those floats are str
flat quest
ah gotcha
well you could convert the columns to type float
and that should work out fine
unless theres actual strings in there
plush crescent
No the only string would be the column name which I'd like to keep
How would I go about converting the columns
flat quest
df[col].astype(np.float32)
although in this case you can just do df[col].to_numeric()
and pandas should automatically convert it to type float
plush crescent
Will give that a go. Thank you!
flat quest
yeah np 😄
plush crescent
I'm getting AttributeError: 'Series' object has no attribute 'to_numeric'
I'm assuming i'd have to put it in a series then convert then replace that column?
plush crescent
da = pd.to_numeric(df['One'])
df['One'} = da
The above does the trick 🙂
will have to do that with all columns but it works
Got it working. Thanks for pointing me in the right direction. Really appreciate it 🙂