#data-science-and-ml
1 messages · Page 227 of 1
 lapis sequoia
 grand breach
is there a row['something'] in pandas ? ```python
Selecting Features (list)
feat = ['keywords','cast','genres','director']
for f in feat:
df[f] = df[f].fillna('')
Combining selected features into a column in DF
def combine_feat(row):
return row['keywords']+" "+row['cast']+" "+row['genres']+" "+row['director']
#Apply the func/transform to all rows of DF vertically;
df["combined_feat"] = df.apply(combine_feat,axis=1)
and 2nd methodpython
df["comb_feat"] = df["keywords"]+df["cast"]+df["genres"]+df["director"]
``` the first method defines a func and applies to all the rows vertically and also removes NaNs from each column
should the remove NaNs be applied to the second method also ?
i've tested both of these and they produce the same output
lapis sequoia
basic question, but let's say I have data points in t0 = 1000, t1 = NaN, t2= 2000, t3 = 3000 should I fill t1 = (t0+t2)/2 so that I have 1500 for t1? Or rather take average for the whole column (1000+2000+3000)/3 = 2000?
it is timeseries data and later an LSTM will be trained with it
do you have a good link to read more into data cleaning?
Or is there a different way to clean a dataset?
 blazing bridge
is gradient of loss as intercept changes just another way of saying take the derivative of the loss function i.e get the slope of the curve at that point
lapis sequoia
@lapis sequoia you could try out various ways of filling the NaN and see if any of them generalize well. Otherwise you could add a masking layer
 serene oar
Hello!
I would need to make a new column using pandas that shows the len() value of the previous columns row.
Like this
A     B        c(Newrow)
SD   1, 2, 3    3
SFG  1          1
AS   3, 4, 23   3
Must I do that in a for loop?
Or for better naming, the columns would be
parent childrenNames amountOfChildren
Whats the type of B?
lapis sequoia
You could use .apply()
df['C'] = df['B'].apply(lambda row: len(row))
There's probably a better way than that though
serene oar
TypeError: object of type 'float' has no len()
I don't see how it can be a float
Isn't float a numerical thing?
When I print the entire df the row comes as
childNames
[name1, name2, name3]
[etc1, etc2]
I get
object
I did this previously
gdf = df.groupby('parent')['childNames'].apply(list).to_frame()
But I assume that to_frame returns it to normal
 desert oar
@grand breach they are equivalent conceptually, with slightly different null handling as you noted
grand breach
So the 2nd method does null handling ? Or it needs to be implement ed
desert oar
try it
i would say that in both cases pandas' default behavior is bad, and i think that's a good thing. you should always consider how nulls should be handled without relying on default behavior
grand breach
When I printed 1st one it resulted in error of float (nan) and str type
desert oar
mishandled null data is probably the #1 most annoying thing i deal with at work, and mishandling null data is an obvious sign of an inexperienced data scientist
grand breach
The 2nd method printed without errors
desert oar
okay. let's back up. what should be done with null entries
grand breach
So i assume it works
desert oar
"works" in that "it gives you no errors" is not the point
you need to decide how nulls should be handled
then write code to achieve that
not write code and just be happy that there were no errors
desert oar
a pandas data frame has 2 axes
the columns, and the rows i.e. the index
generally you use .loc or .at in order to select from one or both of those axes
grand breach
I only know about iloc, loc etc
desert oar
ok
when you use .apply(fn, axis=1)
each row is passed to fn
in the form of a Series
grand breach
I couldn't find about row on search results
desert oar
therefore the function fn should accept and operate on a Series
a Series lets you select elements with []
a "row" is not a special data type in pandas
grand breach
Should I do a try-catch on the 2nd method
desert oar
no
you should decide
how you want to handle nulls
then figure out how to write code that implements your decision
@blazing bridge yes, in the 1 dimensional case
lapis sequoia

Medium
A couple of days ago I started thinking if I had to start learning machine learning and data science all over again where would I start…
desert oar
seems very opinionated
there's a lot more to data science than kaggle and deep learning
lapis sequoia
I wish I can win some medals on Kaggle.. it's so hard to break into the top n
desert oar
arent the top medals won by professional teams with huge cloud computing budgets
 slim fox
possibly
also people in academia sometimes with access to computational powers
but I agree about it beeing opinionated, everyone learn differently
and kaggle is not really data science, it's mostly machine/deep learning - you miss out lots of things that are present in actual DS work
desert oar
indeed. machine learning is one subset of data science
slim fox
does not mean that kaggle micro courses are bad though
desert oar
i havent looked into them
slim fox
and unless it's NLP or Image processing more likely it will be classic ML rather than Deep learning
I skimmed through some of them, I think they are well composed
and considering they are free, it is not a bad start
desert oar
good to know, i can direct people there
slim fox
isn't it per week?
slim fox
don't take my word for it though. We are trying some competition with friends, and I think I saw per week
lapis sequoia
you're right
slim fox
oh ok
slim fox
yeah between colab and kaggle you can have quite some amount of GPU /TPUtime
desert oar
thats quite a lot
good to know
kind of annoying to have a setup in 2 places but free is free
slim fox
I wonder if physically it is all the same place now, since Kaggle is owned by google
lapis sequoia
FREE
hmm well they unified their serving platform, and hosting everything on google infrastructure..
slim fox
the downside I noticed with colab is that it can semi-randomly disconnect session
so if you need to train something big you should be careful with checkpoints
lapis sequoia
yeah I don't use colab for training.. just writing and practice
they just launched colab pro
grand breach
it turns out i didn't test my notebook properly, it returns an error with the 2nd method
:p
yes and it's due to the nulls present
@desert oar fixed the nullhandling anyways. Thanks ;}
lapis sequoia
hello does anyone knows how to use multiple imputation chained equations (Mice) imputation on python to treat missing values
 flat quest
kaggle doesn't present much of the challenges using docker and google cloud computing, but nevertheless its a good place to start 😉
lapis sequoia
I have a very simple code:
def newscore(score1, score2):
    delta = score2 - score1
    return delta

df['delta'] = df.apply(newscore, args=(df['score'], df['new_score']), axis=1)```Why does it return: TypeError: newscore() takes 2 positional arguments but 3 were given
?
I only provided the value in column score and column new_score
figured it out... nevermind 🙂
 fossil estuary
Hey, I have two dataframes,
pd.DataFrame({"group": [1, 1, 1, 1, 2, 2, 2, 2], "min": [25, 50, 75, 100, 25, 50, 75, 100], "max": [50, 75, 100, 120, 50, 75, 100, 120], "result": [100, 123, 534, 10, 123, 455, 111, 432]})```
and
pd.DataFrame({"group": [1, 1, 2, 3], "value": [32, 45, 65, 100]})
I want to get the results column when the group is the same in both dfs and value is between min and max.
There's a pythonic / optimized way of doing it? wintry mural
@fossil estuary Yes, there is
 serene scaffold
This project I'm working on requires that I find which vector (stored in a gensim Word2Vec) has the lowest cosine distance to a given vector. Does numpy have a solution so that you're not doing all that looping in pure Python?
huh looks like Word2Vec has a most similar method.
desert oar
@serene scaffold yes, a lot of libraries have built-in nearest neighbors search. if it doesn't, you can use a KDTree or BallTree from scikit learn
serene scaffold
Do you think the built-in nearest neighbors searches use kd trees internally?
 dusty depot
uh
numpy has .dot and .linalg.norm
so np.dot(a, b) / ((np.linalg.norm(a)*np.linalg.norm(b))
broadcasting adjustments/argmax/whatnot as necessary
blazing bridge
what is the formula at the bottom doing
is it finding the slope of the curve or taking the derivative of the loss function
cause it says we are taking the gradient of loss ao im not sure what they are referring to or is taking the gradient of the loss function the same as finding the slope of the loss function curve
desert oar
@serene scaffold
This method computes cosine similarity between a simple mean of the projection weight vectors of the given words and the vectors for each word in the model. The method corresponds to the word-analogy and distance scripts in the original word2vec implementation.
https://radimrehurek.com/gensim/models/keyedvectors.html#gensim.models.keyedvectors.WordEmbeddingsKeyedVectors.most_similar
Efficient topic modelling in Python
so no they aren't using a tree but maybe you can use a method like this
@blazing bridge the slope is the derivative/gradient. they are the same concept
blazing bridge
Gradient Descent is the workhorse behind most of Machine Learning. When you fit a machine learning method to a training dataset, you're probably using Gradient Descent. It can optimize parameters in a wide variety of settings. Since it's so fundamental to Machine Learning, I d...
in 14:50
Could you look at this and see what they mean by first taking the derivative of the loss function
desert oar
do you know what a derivative is?
there's nothing to explain
they take the derivative of the loss function
blazing bridge
Im in grade 10 currently I know that a derivative is basically the rate of change
so slope
desert oar
yes, that is approximately correct
think of it this way: you can compute the slope at every point of the loss function
the "slope at every point" is itself another function
that function is the derivative
blazing bridge
yeah so basically the formula above is finding the slope/gradient/derivative of the loss function/curve
desert oar
which formula specifically?
blazing bridge
the one i pasted above
desert oar
ah, no
blazing bridge
just before you responded
desert oar
finding the derivative is a whole topic you will learn in calculus
finding the derivative is the process of figuring out how to write down the derivative function
e.g. for the function f(x) = x^2, i know that the derivative is f'(x) = 2*x
in grade 10 you don't need to know those rules yet
that formula is the derivative function
 misty mirage
Can anyone explain to me the purpose of fit_transform in a pipeline
blazing bridge
so we are differentiating the function
desert oar
so if you put x and y into that formula, you get the slope of the loss function at that (x, y) point
the formula in the screenshot is the derivative of the loss function
stated another way: the formula in the screenshot tells you the slope of the loss function at a specific point
@misty mirage it just runs .fit() and then .transform() , returning the result from the latter (assuming you are talking about sklearn)
blazing bridge
so when we insert a guess of our intercept into our formula the formula will tell us the slope of the curve at that point
misty mirage
Then what is the workflow?
desert oar
@blazing bridge if the intercept is the only parameter you are fitting, then yes
desert oar
the former
blazing bridge
ok @desert oar thank you for answering my dumb questions i know ive been a pain
misty mirage
why?
blazing bridge
just a question about this discord is their like a cap on how many questions you ask
misty mirage
Does pipeline.fit(x,y) call the pipeline's vectorizer's fit_transform method on the input data?
desert oar
@blazing bridge it's not a problem, usually it's assumed that you have some calculus experience. you see how, once i knew that you were in grade 10, i was able to clarify things more effectively?
@misty mirage that's actually a good question. i don't know if it uses fit_transform internally, or fit and transform separately. i would assume it uses fit_transform, but I don't think it's explicitly documented. you might have to check in the scikit-learn source code to answer that question
misty mirage
but either way pipeline.fit calls the vectorizers transform method?
blazing bridge
@desert oar yeah much more Ive just started really diving into the math of all this and once you told me that the formula above finds the derivative of the loss function so the slope of the function you really cleared up my confusion because I thought they were two different things
desert oar
yes @misty mirage
misty mirage
hmm
desert oar
assuming by "vectorizer" you mean "any of the transformers before the final stage"
misty mirage
like tfidfvectorizer?
misty mirage
very odd, because one of the features that it outputs is a word that I know exists in every document in the corpus
dusty depot
pipeline fit_transform is just pipeline fit with the final step's transform applied
which attempts to run fit_transform if it exists, otherwise fit then transform for legacy things
misty mirage
the fit_transform for tfidf should remove such words no?
desert oar
import numpy as np
from sklearn.base import BaseEstimator, TransformerMixin
from sklearn.dummy import DummyClassifier
from sklearn.pipeline import Pipeline

class MagicTransformer(BaseEstimator, TransformerMixin):
    def __init__(self, magic_word):
        self.magic_word = magic_word

    def fit(self, X, y=None):
        print(f'Fitting with the magic word: {self.magic_word}')
        return self

    def transform(self, X, y=None):
        print(f'Transforming with the magic word: {self.magic_word}')
        return X

    def fit_transform(self, X, y=None):
        print(f'Fit-transforming with the magic word: {self.magic_word}')
        return X

pipeline = Pipeline([
    ('transformerA', MagicTransformer('A')),
    ('transformerB', MagicTransformer('B')),
    ('classifier', DummyClassifier())
])

X = np.random.rand(50, 2)
y = np.random.choice([-1, 1], 50)
pipeline.fit(X, y)
Fit-transforming with the magic word: A
Fit-transforming with the magic word: B
so yes it apparently calls fit_transform internally
if there is something wrong with your output it is 99% of the time a problem with your code, not scikit-learn
misty mirage
Hmm, thank you!
Is my assumption about how TfidfVectorizer works correct?
That it should remove a word if it appears in every document?
 supple minnow
vol = 3   #number of different traffic volume(Normal, +40%, -40%)
met = 3   #number of methods of different algorithms
sim = 10  #number of simulation
wb = Workbook()
ws1 = wb.active

#example of how to save traffic data
#data = [
#    ['/', 10000, 5000, 8000,],
#    ['/',   2000, 3000, 4000,],
#    ['/', 6000, 6000, 6500,],
#    ['/',  500,  900,  4500,],
#    ['/',  8006,  300,  3400,],
#    ['/',  6004,  400,  3500,],
#    ['/',  5003,  800,  6700,],
#    ['/',  4002,  700,  7800,],
#    ['/',  2005,  3060,  2500,],
#    ['/',  5080,  3000,  7400,]
#]

data2 = []
for k in range(met): #ovdje idu sheets
    if k == 0:
        ws1 = wb.create_sheet(title="M1")
    elif k == 1:
        ws1 = wb.create_sheet(title="M2")
    else:
        ws1 = wb.create_sheet(title="M3")
    for l in range(vol): #column headings
        if l == 0:
            ws1.append(["Normal", "QLen", "MaxQLen", "Stops"])
        elif l == 1:
            ws1.append(["+40%", "QLen", "MaxQLen", "Stops"])
        else:
            ws1.append(["-40%", "QLen", "MaxQLen", "Stops"])
        for m in range(sim): # results
            #for value in data:
            #    ws1.append(value)
            data2.append([m, 230, 560, 897])
            for value in data2:
                ws1.append(value)

wb.save("Test.xlsx")``` I have a problem with my last for loop. How can i save data so it doesn't repeat saving result before?@misty mirage not necessarily, depends on how you set it up
tf idf on its own doesnt do filtering, it just converts words to numerical vectors
misty mirage
ah, and how do the classifiers use the resulting vectors?
desert oar
do you know the definition of tf-idf?
misty mirage
Do they understand that the matrix is a tf-idf matrix?
desert oar
no
misty mirage
term frequency inverse document frequency
desert oar
classifiers do not know or care what the features mean
it's all math
math doesn't know about words
misty mirage
but the higher the tf-idf of a given word the more importance the classifier gives that word?
misty mirage
term frequency is the number of times each term appears in a given document
desert oar
@supple minnow can you explain your desired algorithm in words? i think i understand your problem but i can't tell what you're actually trying to do
misty mirage
inverse document frequency is the number of documents divided by the number of documents where the term appears
desert oar
idf is usually the logarithm of that, but yes
so if you compute tf-idf vectors for 20 words over 10 documents, you get a 10x20 matrix
so now consider what the elements of that matrix are. a word that appears frequently in every document like "the" will have a high tf, but log-idf will be nearly 0. so the feature for that word will always have a small magnitude relative to other features, and it will have a small amount of variation relative to other features
misty mirage
so element [0][0] in that matrix is the tf-idf of term 0 in document 0?
desert oar
yes
supple minnow
On the last loop, I'm trying to save traffic data in excel, so later I can use it for visualization. So the last loop needs to go 10 times (10 simulations), and at the end of every simulation, I'm saving data as a list inside an empty list then exporting it to excel. The problem is that when the loop is m>0 I got in excel old data+new data.
desert oar
so yes, in some sense the classifier will ignore that very-frequent word, because its effect of its parameter on the objective function will be very small
whereas a word with a very big tf-idf score will not only have a large relative magnitude but a lot of relative variation
meaning that adjusting the parameter for that feature will cause big changes in the value of the objective function
misty mirage
So the smaller that number the less impact it will have on the classification?
Impact is determined by relative magnitude and relative variation?
desert oar
intuitively yes
desert oar
this is incidentally why it's important to normalize or scale your inputs before training a model
misty mirage
normalize or scale?
desert oar
if you have one feature with numbers like -10023590 and 843508, and another feature with numbers like 1.2 and 0.7, that will cause problems getting your classifier to converge
misty mirage
Oh I see.
so tfidf_vectorizer.idf_ is not the actual weight?
The actual weight is in the matrix?
desert oar
correct, that is just the idf value
tf must be computed per document
@supple minnow what if you keep an inner list per simulation, then keep an outer list to track all simulations
misty mirage
I see, then how do I compute the weight of the term? Would it be the sum of each column in the feature_matrix?
Or sum of column divided by column size maybe?
desert oar
what do you mean the weight
misty mirage
As in the impact it has in the classifiers decision
desert oar
that number would be the gradient of the loss function, with respect to that feature's parameter
so it depends on the classifier
the intuition about variance and magnitude comes from linear regression
i suspect (but cannot prove) you can draw more general conclusions for all convex optimization problems
but that's past the limit of my math training
misty mirage
I see, so a feature could have a different weight for 2 classifiers even though the tf-idf matrix is the same for both?
desert oar
theoretically yes. people dont typically quantify this "weight"
misty mirage
Is there another term for it?
desert oar
not really honestly
misty mirage
The amount of impact the term has in the decision making process
desert oar
i don't see much discussion about this
and it's not in any of the standard textbooks that i know of
i got this intuition from my stats classes in grad school
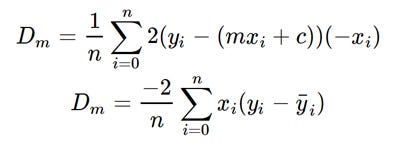
you can see it in the gradient descent expression of linear regression, for example https://towardsdatascience.com/linear-regression-using-gradient-descent-97a6c8700931

Medium
In this tutorial you can learn how the gradient descent algorithm works and implement it from scratch in python. First we look at what…

the gradient partial derivative of the linear regression slope depends on the magnitude of x
(m being their notation for slope)
misty mirage
I see, so I have to look at the function on which the classifier operates?
and then evaluate the how the elements of the feature matrix impact the calculation?
By this logic most classifiers won't benefit at all from things like Word2Vec right?
For example the equation you just posted doesn't consider the distance between the elements in the matrix right?
desert oar
i wouldn't say that they don't benefit at all
again this is where the limits of my math training come in
you could probably derive some geometric results about the distances between elements
but that's no longer something you can read right off of the equations
misty mirage
but would it affect the classification?
Like would linear regression classify the same features differently if the feature vectors were reordered?
misty mirage
So then using word2vec to compute the feature matrix for linear regression wouldn't be useful right?
misty mirage
a tf-idf vectorizer
dusty depot
are you referring to sklearn's TfidfVectorizer?
misty mirage
yes
dusty depot
so that's basically two thing stuck together
sklearn's countvectorizer and sklearn's tfidf-transformer
so, tf-idf is bascially a scoring system for weighing words
whereas word2vec is an embedder, similarly to countvectorizer
countvectorizer counts the number of words in a text blob and turns it into a VOCAB_SIZE-dim array
whereas word2vec refers to a group of neural models that embed via a more complicated system that vaguely takes into account neighboring words, etc
desert oar
yes it absolutely would be useful @misty mirage
they give different embeddings
therefore they give different results
even if you produced the same number of features from both embeddings
you can plot the resulting feature matrix on a heatmap for example
to see how they differ
ideally with some kind of seriation to bring out any broad patterns that might exist
misty mirage
I see how the actual data they output would be useful, but most classifiers would just ignore it correct?
desert oar
no
if you put different data into a classifier
you get different results
the classifier cannot ignore it unless you happen to get identical results out of 2 completely different methods
will the learned model necessarily reflect all the intuitive behavior of natural language? maybe or maybe not
depending on the model
usually it will reflect enough to make sense
this is why we've progressed from linear regression and svms to random forests and xgboost and finally lstm's
misty mirage
Word2Vec stores the closeness relationship between words by the ordering of the vectors though.
So if two word vectors are close then the words are similar
desert oar
yes
misty mirage
but linear regression wouldn't know about that relationship correct?
desert oar
no, the linear regression only sees that the 2 vectors are close
misty mirage
and that relationship wouldn't impact the calculation that linear regression performs?
desert oar
of course it would impact it
misty mirage
because if you reorder the vectors you get the same result right?
desert oar
it has nothing to do with the order
it has to do with the actual numbers involved
if you have 2 vectors with target values 3.5 and 3.6
and those 2 vectors are relatively close
then the classifier sees a region with similar values
misty mirage
Oh, I thought that word2vec stored the vectors of similar words in adjacent locations
I didn't know it was the values that determine their similarities
desert oar
yes
you have the concept backwards
word2vec looks at nearby words in order to produce a vector
misty mirage
That makes much more sense.
desert oar
with the practical effect that the word vector should capture the "context" for the word
misty mirage
Thank you
desert oar
i can see how your version would be confusing...
flat quest
if u want to capture context
transformers are generally the way to go atm.
lstms, rnns are all fairly limited in their ability to capture context
misty mirage
Have any of you guys used allennlp?
 sonic finch
Have a pretty basic question. Using this tutorial code to understand bigrams/trigrams. Simple stuff, right? Trying to display top n-grams without stop-words. Somehow when I run through this code though, stop words are consistently displayed:
from nltk.util import ngrams

def get_top_ngram(corpus, n=None):

    vec = CountVectorizer(ngram_range=(n, n)).fit(corpus)

    bag_of_words = vec.transform(corpus)

    sum_words = bag_of_words.sum(axis=0)

    words_freq = [(word, sum_words[0, idx])
                  for word, idx in vec.vocabulary_.items()]

    words_freq =sorted(words_freq, key = lambda x: x[1], reverse=True)

    return words_freq[:10]


corpus_list = []

for word in corpus2:
    if word not in stop:
        corpus_list.append(word)

top_n_bigrams=get_top_ngram(corpus_list,1)[:15]

x,y=map(list,zip(*top_n_bigrams))

seaborn.barplot(x=y,y=x)
When I test whether individual stop words are in corpus_list, it consistently returns false. What gives?
 paper niche
what does print(corpus2[:3]) give you? give us a sample
flat quest
does anyone know how to feed inputs into a tensorflow model using an input_dict that has dicts.
So like
input_dict = {
  'input_a' = tf.random.uniform((20, 5)),
  'input_b' = {
    'ids' = tf.random.uniform((20, 5)),
    'mask' = tf.random.uniform((20, 5))
  }
}
 humble mantle
I don't know what this is called, data science, deep-learning, machine-learning, AI or whatever, but I have a question 🙂
I have a collection of fire/smoke images, bounding-box coordinates and segmentations and want to train a neural network (with mxnet, mask rcnn), to recognize and mask fire/smoke. Do I need to grayscale the image, or use hsv, or whatever? What you suggest to get a better performance?
P.S. Sorry if this is not the right place to ask this question, as I've said, I dont't know is this is a data science or not, and my English is so poor to google it and understand from huge paragraphs describing what data science is... 🙂
lapis sequoia
when you need to classify images, you need to understand which method can help you extract the underlying features you need to do the classification on
I would suggest read a paper where they've applied ml techniques to something similar.. then you'll be on the right track
humble mantle
I'm gonna try presets.rcnn.MaskRCNNDefaultTrainTrans form gluoncv.data.transforms
lapis sequoia
ok.. just dont put method over application..
humble mantle
I have train.json, containing images and annotations. One field from annotations:
{'area': 266.5, 'bbox': [306.0, 176.0, 22.0, 16.0], 'category_id': 1, 'id': 1, 'image_id': 1, 'iscrowd': 0, 'segmentation': [[306, 179
, 311, 177, 320, 176, 326, 176, 328, 183, 323, 190, 319, 192, 307, 188]]}
Is this is a common format so I can automatically prepare the training datasets or I need to read all images and prepare the dataset by hand?
 olive lagoon
hey guys
import pandas as pd
def school():
    df = pd.read_csv("C:\\Users\\yahya\\Documents\\note.csv", index_col=0)
    pss = pd.read_csv("C:\\Users\\yahya\\Documents\\pass.csv",index_col=0)
    role = str(input("are you a prof or a student: "))
    name = str(input("what's your name: "))
    ps = str(input("your passsword: "))
    if role == "prof":
        return df.loc[name]
    else:
        return df[name]
print(school())
i want to give the prof the permission to edit on the csv file
desert oar
i don't think this is a data science question
it's also not entirely clear what you're asking
olive lagoon
@desert oar i want to give the user the permission to edit the file
serene scaffold
I'm struggling to figure out the method for a given operation
I have a Word2Vec object
and a vector
I want the most similar vector in that Word2Vec to the vector that I have.
The vector that I have doesn't represent a specific token.
desert oar
are you using gensim? or another library
serene scaffold
gensim yes @desert oar
tokenizer = transformers.AutoTokenizer.from_pretrained('allenai/scibert_scivocab_uncased')
model = transformers.AutoModel.from_pretrained('allenai/scibert_scivocab_uncased')
cuis = KeyedVectors.load_word2vec_format('/home/steele/datasets/s1975.cui.200.bin', binary=True)


def learn(mention: str) -> str:
    tensor = torch.tensor(tokenizer.encode(mention)).unsqueeze(0)
    bert_output = model(tensor)
    average_vector = np.array(bert_output[0])
    # What I really want is an average of all the tensors in bert_output but this will do for now
    best_cui = cuis.wv.similar_by_vector(average_vector)
    return best_cui[0]
There's more code that isn't necessarily relevant.
Also there's no reason to believe that the vectors in cuis have anything to do with those from model, but I'll deal with that later.
desert oar
similar_by_vector seems like the right thing, no?
Efficient topic modelling in Python
i'd be very skeptical of what that similarity means given that these word vectors are coming from 2 completely different models
serene scaffold
right. I think I eventually need to figure out how to map between the two vector spaces, if that makes any sense.
I end up with
    best_cui = cuis.wv.similar_by_vector(average_vector)
  File "/home/steele/venvs/normalcy/lib/python3.7/site-packages/gensim/models/keyedvectors.py", line 622, in similar_by_vector
    return self.most_similar(positive=[vector], topn=topn, restrict_vocab=restrict_vocab)
  File "/home/steele/venvs/normalcy/lib/python3.7/site-packages/gensim/models/keyedvectors.py", line 549, in most_similar
    for word, weight in positive + negative:
ValueError: not enough values to unpack (expected 2, got 1)```similar_by_vector is actually just a wrapper for a specific way of calling most similar
The typing here doesn't make a lot of sense
The signature for similar_by_vector is def similar_by_vector(self, vector: np.array, topn=10, restrict_vocab=None) -> Union[List[Tuple[str, float]], np.array]
I added the type hints myself based on the doc string
however vector gets passed to most_similar to the positive argument, which is List[str]
Doesn't make any sense
def learn(mention: str) -> str:
    tensor = torch.tensor(tokenizer.encode(mention), requires_grad=False).unsqueeze(0)
    bert_output = model(tensor)
    average_vector = bert_output[0].detach().numpy()
    # What I really want is an average of all the tensors in bert_output but this will do for now
    best_cui = cuis.wv.similar_by_vector(average_vector)
    print(best_cui)
This is slightly more functional.
desert oar
are you able to recover actual text from those vectors?
in order to sanity check the similarity results
normally i'd expect you have to train some kind of model that converts from one to the other
or maybe not
you definitely need some kind of sanity check on that though
 umbral aspen
Anyone know of good pretrained models to handle a multi-label problem involving people feature detection...things like moustache, short hair, long hair, fat, skinny etc
flat quest
depends on what kind of architecture u want to use @umbral aspen ssd, yolo, rcnn
umbral aspen
Does not matter to me too much...I am using tensorflow/keras though so something I can use there would be nice
flat quest
hmm
tf has some models already that are pretrained
tho the tf object detection api is fairly difficult to use. You'll have to use tfv1 to use their object detection api
umbral aspen
I am less interested in object detection and more interested in people feature detection...so there will be people in all my images and I need to know what features those people have 🙂
Not if there is a person there or not etc
Not sure if by object detection you mean what I mean with feature detection 😄
flat quest
people detection, feature detection is the same concept
its just instead of using the people as objects you label the mustache, eye, ear, as an object
umbral aspen
What would be the best data set to retrain a pre-trained model for this use case?
At the moment I just have about 15k labelled images
Just the image and what is labelled
Do I need to do anything to point out exactly where the features are located in each image?
Or should the labels be enough? I am looking for a model which guesses with about 80% accuracy (so no need to reach over 95% or something)
So image 1, labels [beard, eye, ear] etc
flat quest
you need to draw the bounding boxes
labelimg is the tool ur looking for if u want a free annotator
umbral aspen
I see...This was not the answer I was hoping for lol
Labeling 15k images is no small task 😄
flat quest
lol xd true
tho there are other annotating tools available
some do it automatically
there might be a beard, moustache, eye, ear dataset with preannotated images already
not sure tho
umbral aspen
Yeah I doubt it - my problem also is not 100% fitting those features...but will be similar
Anyone want to label 15k photos for me?
lol
umbral aspen
True
I did the work to label them already manually tho 😢
But not the actual annotations
flat quest
oof
well i guess u can just copy the labels then
but ull still need the actual annotations
umbral aspen
Yup
flat quest
depends on how difficult the task is
but u might be able to pass with a couple hundred images
umbral aspen
Ya I will try maybe to label 2k images or something
See how it goes
Anyways I am heading to bed. Thanks for your help @flat quest
flat quest
yeah for sure
np
 glad night
Greetings community! I've been working on automating analysis for my work, and this is a task that needs to start with the following two actions: merging two datasets based on a common variable (let's say Unique Row Code) and cleansing all rows containing Unique Codes that start with a certain alphabet letter (let's say A) effectively leaving only the ones for which the Unique Code starts with e.g. B
I've cracked the first part, and am finding the second one difficult... PS. Python Noob, this is my first piece of 'professional' code after two months of training and writing from absolute scratch
Apologies in advance if this is the wrong place for this
Thank you!
flat quest
you'll want to look into pd.merge
or pd.join for the merging
pd = pandas
and for cleansing you'll want to look into the pd.apply as well as regex.
u trained and wrote neural nets from scratch?
glad night
drag - strong kudos my friend, will investigate tonight
desert oar
@glad night what if Unique Code B1232 exists in dataset 1 but not in dataset 2?
do you want the combined dataset to include that row? or should it only have rows where the unique code appears in both datasets?
(i ask because pandas gives you the ability to decide)
# Load both datasets from disk
data1 = pd.read_csv('dataset1.csv')
data2 = pd.read_csv('dataset2.csv')

# Assuming both dataframes have a column called "Unique Code",
# merge the datasets, keeping all rows from both datasets
# even if they don't share a Unique Code
data = pd.merge(data1, data2, on='Unique Code', how='outer')

# Find the rows where "Unique Code" meets our criterion
unique_code_b = data['Unique Code'].str.startswith('B')

# And filter the data to only include those rows
data_filtered = data.loc[unique_code_b]
 brave jasper
Hey, I have a pandas dataframe. How can I export it as a string and import it again? I am trying to create a minimal example for a question and having issues to export my two dataframes.
brave jasper
Already found a way.
glad night
@desert oar Appreciate the support man. 1) Unique code has to exist in both datasets by default, as they refer to different elements of the same record essentially. It's just that due to design they are captured in different places at source. 2) I want the new merged dataset to drop rows starting with a specific char, and keep the others so I can then run analysis on them. 3) I tried your code (thank you!!!) and I'm getting the following "Pandas doesn't allow columns to be created via a new attribute name - see https://pandas.pydata.org/pandas-docs/stable/indexing.html#attribute-access"
brave jasper
I am struggling with a combined plot with matplotlib and two dataframes. On the x-axis are dates, but in one dataframe are missing dates. Is there a way to plot them in one plot?
This is a "minimal" example: https://pastebin.com/QFfRtRxB

 arctic wedgeBOT
Hey @sharp dagger!
It looks like you tried to attach file type(s) that we do not allow (.json). We currently allow the following file types: .3gp, .3g2, .avi, .bmp, .gif, .h264, .jpg, .jpeg, .m4v, .mkv, .mov, .mp4, .mpeg, .mpg, .png, .tiff, .wmv, .svg, .psd, .ai, .aep, .xcf, .mp3, .wav, .ogg.
Feel free to ask in #community-meta if you think this is a mistake.
 sharp dagger
Was given an json configuration file for a Feed-Forward Neural Network. Having some difficulties start it up. Im mostly concerned what to do about overfitting, underfitting, imports, array sizes, and so on. There are 24 input nodes, 10 hidden nodes, and 16 output nodes. Apparently the NN can be programmed using Jupyter but it isnt necessary. Also the UUIDs in the json are not necessarily needed to program it, apparently. Not sure why that is. The UUIDs are apparently, only for showing the direction of information and how the synapses work. Any thoughts? Been trying to crack this one for about 5 days and over 60-ish hours by now. Any input?
desert oar
@glad night that error is unfamiliar to me and it's very unlikely that my code as-written generates it. can you share your code?
@sharp dagger what library is the json file meant to work with
sharp dagger
@desert oar There isnt anything that explicitly says what library to use. The neural network uses prime numbers as input and its presumably supposed to output a 16-digit number that will be used for an equation down the road. My assumption is it's going to use matplotlib and numpy.
desert oar
who gave you this
sharp dagger
My professor.
desert oar
is this homework?
theres no way someone just gives you a json file and says "theres a neural network in here"
sharp dagger
These are for the x, y, and z arrays, supposedly:
[206047, 206249, 206341, 206347, 206447, 206543, 206641, 206749, 216149, 216347, 216641, 216647, 216649, 216743, 216841, 216947, 226141, 226241, 226547, 226549, 226643, 226649, 226741, 226843, 226943, 236143, 236449, 236549, 236641, 236749, 236947, 246049, 246241, 246247, 246343, 246349, 246641, 246643, 246941, 246947, 256049, 256147, 256349, 256441, 256541, 256643, 266047, 266447, 266449, 266549, 266641, 266647, 266947, 276041, 276043, 276047, 276049, 276247, 276343, 276347, 276443, 276449, 276847, 276949, 286043, 286049, 286243, 286249, 286541, 286543, 286547, 296041, 296047, 296243, 296249, 296347, 296441, 296741, 296749, 296843, 296941]
[110339, 110359, 112339, 112349, 113329, 113359, 114319, 114329, 115309, 115319, 115399, 116329, 116359, 117319, 117329, 117389, 118369, 118399, 119359, 119389, 210319, 210359, 211319, 211339, 211349, 211369, 212369, 213319, 213329, 213349, 213359, 214309, 214369, 214399, 215309, 215329, 215359, 215389, 215399, 216319, 216329, 216379, 217309, 217319, 217339, 217369, 218389, 219389, 310379, 311329, 311359, 312349, 313399, 314329, 314339, 314359, 314399, 315349, 315389, 316339, 317399, 318319, 318349, 319339, 319399, 410339, 410359, 411379, 412339, 414329, 414389, 415319, 415379, 416359, 416389, 416399, 417379, 418339, 418349, 419329, 510319, 510379, 512389, 513319, 514309, 514379, 514399, 515369, 516319, 516349, 516359, 517399, 518389, 519349, 519359, 610339, 611389, 612319, 612349, 615379, 615389, 617339, 617359, 617369, 618329, 618349, 619309, 619369, 710389, 710399, 711329, 712319, 712339, 713309, 713329, 713389, 713399, 714349, 715339, 716389, 716399, 718349, 718379, 810319, 810349, 810379, 810389, 811379, 812309, 812359, 814309, 814379, 814399, 815389, 816329, 817319, 817379, 818309, 818339, 818359, 818399, 819319, 819389, 910369, 911359, 912349, 913309, 914339, 914359, 914369, 915379, 916319, 916339, 918319, 918329, 918389, 919319, 919349]
[200063, 200363, 200461, 200467, 200569, 200861, 200867, 200869, 210169, 210263, 210361, 210461, 210467, 210761, 210869, 210961, 210967, 220063, 220163, 220169, 220361, 220369, 220469, 220663, 220667, 220861, 230063, 230369, 230467, 230561, 230563, 230567, 230663, 230761, 230767, 230861, 230863, 230969, 240169, 240263, 240763, 240769, 240869, 240967, 250169, 250267, 250361, 250867, 250963, 250967, 250969, 260263, 260269, 260363, 260461, 260467, 260569, 260761, 260861, 260863, 260969, 270163, 270167, 270269, 270461, 270463, 270563, 270667, 270761, 270763, 270961, 270967, 280061, 280069, 280463, 280561, 280769, 280963, 280967, 290161, 290369, 290663, 290669, 290761, 290767, 290861, 290869, 290963]
desert oar
so this is some kind of puzzle you have to solve?
what information do you have
what is the structure of the json data
sharp dagger
The json data are a bunch of UUIDs showing the connection between the synapses of each node. The json has over 88 thousand lines of data...
desert oar
ok, but what is the structure
sharp dagger
It starts off with bias, then shows the 24 input layers, 10 hidden layers, and the 16 output layers.
sharp dagger
As in have I copy-pasted the json data and checked if it ran cleanly? Yes. Jupyter successfully output the entire json.
Error free.
desert oar
i mean you should be able to reconstruct the network
if you have all the weights
do you know how a neural network works?
sharp dagger
Last time I made an NN it was a CNN and used MNIST data sets and that was maybe 3 years ago. So my understanding is probably a bit different. But yeah, I get the jist of it.
Something like that, I presume is what it's supposed to be when using an FFANN framework.
desert oar
right
so for each layer all you have to do is take the weights and slap them into a matrix/tensor
then take your input data and progressively multiply through each layer
sharp dagger
Yeah, multiplication seems right cause the input data is all 6-digits and you need to output a 16-digit integer.
Do you mean matrix or tensor, or do you mean matrix divided by tensor when you say "matrix/tensor"?
sharp dagger
Shouldnt the shape of the input be based on how the arrays look?
sharp dagger
Yep.
The input data is the array. So if the array is just a bunch of prime numbers then the shape of the input should be the dimensions of the array?
Thanos snapped.
desert oar
sounds right although i think you're thinking about this in a weird way
@lapis sequoia ```python
data_2 = data.loc[data['class'] == 2]
data_4 = data.loc[data['class'] == 4]
I tend to overcomplicate a lot. My first worry was that the NN would be impossible since I had no idea what the bias would be, or how the cross entropy, softmax, gradient descent, and all that would be added in and calculated.
desert oar
you don't need gradient descent if they already give you the weights
same with the loss, cross entropy or otherwise
you just said they tell you the biases
and presumably there's no softmax layer otherwise they'd tell you
sharp dagger
{
"bias": {
"id": "1a4de92d-3c77-4d92-855b-51c2437cbe75"
},
The IDs are only a bunch of UUIDs. I was told the UUIDs dont matter and are only used to show the direction of the synapses.
Isnt the bias supposed to be an integer? I suppose it could be either 0, or 1...?
sharp dagger
Just UUIDs, and whatever this is going to be used for: 2,3,5,7,11,13. It was originally one larger integer divisible by 23. Apparently I have to separate the number up into it's primes. One guy in DM told me he "thinks the bias is just 1". But no, the json is just weights and UUIDs.
desert oar
in that case the biases are probably 0. alternatively, if the weights are 1 bigger than the input to the corresponding layer, the last or first weight is probably the bias for that layer
sharp dagger
Probably. Makes sense if there's no back-propagation.
Simple, lightweight forward-feed.
desert oar
yeah thats the only sane assumption here
backpropagation is part of the fitting process
sharp dagger
Thats why I was so confused. Because why would I want to build an NN that includes cross-entropy and back-propagation, but I dont have the configuration for that? I'd end up with either an underfitted or overfitted mess.
desert oar
without data to train on, it makes no sense
sharp dagger
I usually used MNIST datasets. But then I realized the arrays are the training data. So, no importing of data libraries necessary.
blazing bridge
i had a question about the difference between returning a list and returning a tuple
`#Your step_gradient function here
def step_gradient(b_current, m_current, x, y, learning_rate):
b_gradient = get_gradient_at_b(x, y, b_current, m_current)
m_gradient = get_gradient_at_m(x, y, b_current, m_current)
b = b_current - (learning_rate * b_gradient)
m = m_current - (learning_rate * m_gradient)
return [b, m]
#Your gradient_descent function here:
def gradient_descent(x, y, learning_rate, num_iterations):
b = 0
m = 0
for i in range(num_iterations):
b, m = step_gradient(b, m, x, y, learning_rate)
return b,m`
what is the difference between returning a list than just a tuple of values and what are the benefits
`import matplotlib.pyplot as plt
months = [1, 2, 3, 4, 5, 6, 7, 8, 9, 10, 11, 12]
revenue = [52, 74, 79, 95, 115, 110, 129, 126, 147, 146, 156, 184]
def get_gradient_at_b(x, y, b, m):
N = len(x)
diff = 0
for i in range(N):
x_val = x[i]
y_val = y[i]
diff += (y_val - ((m * x_val) + b))
b_gradient = -(2/N) * diff
return b_gradient
def get_gradient_at_m(x, y, b, m):
N = len(x)
diff = 0
for i in range(N):
x_val = x[i]
y_val = y[i]
diff += x_val * (y_val - ((m * x_val) + b))
m_gradient = -(2/N) * diff
return m_gradient
#Your step_gradient function here
def step_gradient(b_current, m_current, x, y, learning_rate):
b_gradient = get_gradient_at_b(x, y, b_current, m_current)
m_gradient = get_gradient_at_m(x, y, b_current, m_current)
b = b_current - (learning_rate * b_gradient)
m = m_current - (learning_rate * m_gradient)
return [b, m]
#Your gradient_descent function here:
def gradient_descent(x, y, learning_rate, num_iterations):
b = 0
m = 0
for i in range(num_iterations):
b, m = step_gradient(b, m, x, y, learning_rate)
return b,m
months = [1, 2, 3, 4, 5, 6, 7, 8, 9, 10, 11, 12]
revenue = [52, 74, 79, 95, 115, 110, 129, 126, 147, 146, 156, 184]
#Uncomment the line below to run your gradient_descent function
b, m = gradient_descent(months, revenue, 0.01, 1000)
#Uncomment the lines below to see the line you've settled upon!
y = [m*x + b for x in months]
plt.plot(months, revenue, "o")
plt.plot(months, y)
plt.show()`
this is my code for context
 leaden igloo
show plot?
 hidden grail
Hi, which Python libraries/ml techniques would you recommend for doing image classification on buildings and interior? Should be able to classify which images are taken outside, and which are from inside a house/building.
 autumn galleon
hello all, I got a question with how i can make a more efficient removal
So lets say i got a list "buses" with a tuple of (long,lat) and a list of "stops" with tuple of (long,lat)
buses have size of 9000 and stops have size of 6500, i want to remove all buses that are within 50m to a stop.
I have been trying to make each list smaller and smaller, but i dont really think i can make them even smaller.
what is the most efficient way to do this task
I am calculating distance using geopy's distance function
for s in stops:
    for key in list(buses.keys()): # key = (lat,lon) value = count
        if (distance.distance(s,key).meters < 50):
            removed_counter.pop(key,None)
@glad night that error is unfamiliar to me and it's very unlikely that my code as-written generates it. can you share your code?
@desert oar MY BAD - I did not replicate your code in its entirety. Reason is - my first half was different and produced an excel sheet that I was hoping to filter afterwards. Applied your code appropriately and in its entirety and it seems to work fine! Tried a quick print of the filtered dataset and I am indeed getting back half the rows of the original merged dataset and the same number of columns - as it should be! Thank you for your help - you're amazing!
desert oar
you're welcome
@blazing bridge a list and tuple have 2 different meanings in python
a tuple is usually used for a "fixed size" structure, e.g. a pair of longitude,latitude coordinates, or when you want to return 2 unrelated values from a function, such as you get from the built-in divmod. a list is for an arbitrary-length collection of homogeneous data, such as something you might plot on a graph
 rapid widget
Hey everyone, I do not find an elegant solution for a manipulation of a numpy array. I would like to roll (as in np.roll) all the rows of a 2D array by a random amount (may be different for each row).
This code does the job but is slow. Any ideas ? (I have to transpose the code to PyTorch eventually if it helps)
a = np.arange(25).reshape(5, 5)
print(a)
for row_idx in range(a.shape[0]):
    shift = random.randint(0, a.shape[1] - 1)
    a[row_idx, :] = np.roll(a[row_idx, :], shift = shift)
print(a)
[[ 0  1  2  3  4]
 [ 5  6  7  8  9]
 [10 11 12 13 14]
 [15 16 17 18 19]
 [20 21 22 23 24]]
[[ 3  4  0  1  2]
 [ 6  7  8  9  5]
 [13 14 10 11 12]
 [15 16 17 18 19]
 [22 23 24 20 21]]
sample code
for s in stops:
    for key in list(buses.keys()): # key = (lat,lon) value = count
        if (distance.distance(s,key).meters < 50):
            removed_counter.pop(key,None)
@paper niche all the rows are rolled with the same amount in your example
I need the amount of rotation to be random
paper niche
ah okay
https://stackoverflow.com/a/20361561 try this with r generated randomly

Stack Overflow
I have a matrix (2d numpy ndarray, to be precise):
A = np.array([[4, 0, 0],
[1, 2, 3],
[0, 0, 5]])
And I want to roll each row of A independently, according to roll va...
rapid widget
@paper niche thank you, I'll try it
flat quest
@hidden grail you're gonna be looking for something like tf or pytorch and use pretrained models
training it yourself will take days and multiple gpus
hidden grail
@flat quest Thanks! I have access to Azure ML also, so that might be a possibility
flat quest
ah nice nice
free tier? @hidden grail
hidden grail
I actually don't know yet 😬 I'll have a look at it next week.
 shell raft
Does anyone know how to scrape data from the PDF? I don't know how to get information from it
 pastel compass
@shell raft Have you tried https://pypi.org/project/PyPDF2/
 shell raft
yeah thats what im using
but that PDF is so unorganized its like impossible to scrape
pastel compass
What info are you trying to obtain?
shell raft
SECTION STARTED ON ROW 8
page: 0 row: 9 line: Booking Date Time
page: 0 row: 10 line: DOB
page: 0 row: 11 line: Booking Number
page: 0 row: 12 line: Sex
page: 0 row: 13 line: Race
page: 0 row: 14 line: Release Date
page: 0 row: 15 line: Agency
warrant #:  19CR2179
page: 0 row: 16 line: 19CR2179
page: 0 row: 17 line: Sentenced To County Time
page: 0 row: 18 line: NO BOND
page: 0 row: 19 line: Warrant
page: 0 row: 20 line: Statute Description
page: 0 row: 21 line: Bond Amount
page: 0 row: 22 line: Bond Type
page: 0 row: 23 line: Court Date Time
NEW SECTION STARTED ON ROW 23
NAME:  Coffman, Gene Kelly
page: 0 row: 1 line: Coffman, Gene Kelly
CASE:  2020-00003753
page: 0 row: 2 line: 2020-00003753
date:  6/9/2020 3:40 PM
page: 0 row: 3 line: 6/9/2020 3:40 PM
sex:  Male
page: 0 row: 4 line: Male
birthday:  01/18/1978
page: 0 row: 5 line: 01/18/1978
race:  White
page: 0 row: 6 line: White
page: 0 row: 7 line: KS0890000
page: 0 row: 8 line: Name
SECTION STARTED ON ROW 8
page: 0 row: 9 line: Booking Date Time
page: 0 row: 10 line: DOB
http://www.snco.us/doc/booking/(S(mgv3bhohvbweq0rj4wsq3puo))/inmate/DailyBookingArchive?Length=0
trying to read those types of PDFs
the problem im running into is that some have multiple Warrants. So I can figure out how to check if they have multiple entrys
Daily Booking Report
Shawnee County Adult Detention Center
Merrifield, Christine Renae
2020-00003758
6/9/2020 8:40 PM
Female
03/20/1970
White
KS0890100
Name
Booking Date Time
DOB
Booking Number
Sex
Race
Release Date
Agency
20CT58
Court Order Adult
NO BOND
2020-46603
Battery Intentionally Causing Contact In A
Rude, Insulting or Angry Manner
$2,500.00
PS
Warrant
Statute Description
Bond Amount
Bond Type
Court Date Time
Oates, Dustin Eugene
2020-00003759
6/9/2020 7:15 PM
Male
04/06/1980
White
KS0890100
Name
Booking Date Time
DOB
Booking Number
Sex
Race
Release Date
Agency
OS19TR1098
Hold For Another County In Kansas
$3,000.00
PS
7/30/2020 9:00 AM
16TR3680
Sentenced To County Time
NO BOND
Warrant
Statute Description
Bond Amount
Bond Type
Court Date Time
See, that has 2 different people
i dont know how to even start trying to seperate it lol
shell raft
rawInfo = pageinfo.extractText().split('\n')
Ive just been spliting it by lines of text
pastel compass
What if you split it based on when specific words showed up
shell raft
Thats what I was thinking also, but the words dont line up well
Cause it will print the whole row then go to the next row
The static data is just all over the place and unorganized lol
pastel compass
wait this is a dumb idea
but
what if you considered trimming the pdf and read the trimmed data
I skimmed through trimming in the docs
so it might be possible
shell raft
Trim? what is that lol
pastel compass
Scroll to the bottom
I don't know what a rectangle object is exactly
but maybe you can work with those
pastel compass
that might make it a bit easier to work with
 silver lion
do you do -- sorting stuff here -- bubble and other?
shell raft
@silver lion what
silver lion
well -- i want to gather data from ADC create logs , maybe on the fly diplsya of data -- but i know so many ways to process it
 kindred canyon
how can i get the average sensitivity/accuracy etc while using k fold with classifcation methods
i am using cross_val_score
but thats only score
 frozen moth
Hey guys can anyone help me? Assignment for my time series (TS): fit GARCH type model to Nasdaq TS (Adj. Daily Close 2014-2015)
TL; DR How does resample work in the arch function?
**Import **
.csv format to multivariate DataFrame containing volume, open price, adj close price, etc
convert index to .datetime
Feature Engineering
What really explains that TS is volatility; create new column: Daily Log Returns
EDA
statistical descriptions of the TS; plot the Daily Log Returns (what I refer to as residuals); explore styled facts. Here is a summary of the section.
Daily Log Returns: Count: 1256; Mean: 0.000508; STD: 0.010225; Kurt: 3.07; Skew: -0.5
Kurtosis close to 3 means no heavy-tailed marginal distr. Skewness implies that adj close reacts more to negative shocks than positive.
Stationarity
Test TS for stationarity using Augmented Dickey-Fuller Hypothesis test. While the Adj closing price is non-stationary (expected) the residual (Daily log-returns) is (acts like White Noise)
Correlograms
ACF/PACF for residuals find that GARCH/ARCH appropriate with p = [4,5] and q = [0,1]
Grid Search
run grid search for ideal ARIMA params for residual using min AIC as performance criteria.
Best params come out as p, q = [2, 4]
Residual Diagnostics
Jarque-Bera test to test for residual’s distr. With a Kurt of around 3 (i.e excessive 0) I would expect normal dist. The skewness is -0.5 however so BAM! Turns out the dist. is t student.
Model Fitting
Using Correlogram and grid search findings I try ARCH(4), GARCH(2,4) etc.
example code:
# Defining Model
model_1 = arch_model(train, vol = 'ARCH', mean = 'Zero', p = 4, q = 0, dist = 'studentsT')
Now if i don't include in the ARCH function the following param:
rescale = True
my alpha and beta terms come out all exactly the same. Can someone explain to me why that is? How resample works? Does it affect the time series? How?
 slate hollow
!rules 5
arctic wedgeBOT
5. Do not provide or request help on projects that may break laws, breach terms of services, be considered malicious/inappropriate or be for graded coursework/exams.
 hearty jewel
i really have a hard time understanding the loop
can someone please tell me whats going on here
i get what happened, it removed the characters from those columns i specified
i just want to understand what is happening in these loops
paper niche
which line specifically? there's a comment explaining every step
hearty jewel
ok ive read some stuff
i think i understand
i just need to know a few things
what is 'col'
and when the astype method is called
what did it do to the data
from what i can tell, we are temporary converitng those columnst o full string data, and then removing those characters
then making them numeric again in the last line
hearty jewel
ive went over the for-loop material 3-4 times
its a bit confusing
especially when its a nested loop
paper niche
it basically executes the block within the for loop for every single "thing"
hearty jewel
exactly i think i do understand it its just because its within the context of data there is a lot of extra lines of code that is dealing with the data and its purpose
lol
paper niche
in this case, for col in cols_to_clean means for the first round of the loop, col takes the value "Installs", during the next round, col takes the value "Price"
hearty jewel
apps[col] = apps[col].astype(str).str.replace(char, '')
its this line
i want to understand
paper niche
you pretty much got it already ^^
app[col] will return the column
.astype(str) converts the column to an object dtype
.str gives you access to string type methods on the Pandas series
of which .replace is one of them
hearty jewel
i want object dtype
because of the method thats coming after?
its numerical before that astype i called?
paper niche
and .replace('+', '') just replaces the + in your column with nothing (basically removing it)
its numerical before that astype i called?
I doubt so, if it has '+', '$' in it
paper niche
I don't actually think there's a need for the astype, but you can try removing it and see if any error arises
paper niche
no, it's ensuring every single element in that pandas Series (basically that column) is of object dtype
hearty jewel
element meaning
paper niche
(there's a new string type in Pandas v1.0, but I digress)
paper niche
no, basically the rows
a pandas dataframe is like an excel spreadsheet yeah? you're looking at a single column
lapis sequoia
hi
paper niche
and basically .astype(str) ensures every single "cell" in that column is of object dtype
hearty jewel
okay
and at which point in the code
did it become a pandas series
and not a data frame
lapis sequoia
what is data frame
paper niche
apps is a dataframe, when you access it like apps[col] <--- this is a Series
if you do apps[[col]] it's a dataframe
lapis sequoia
i see
lapis sequoia
hey guys im new here how to i ask for help, i believe i tried to but i dont know if it went through or not
paper niche
@lapis sequoia #❓|how-to-get-help
when you say return the column
@hearty jewel just tryprint(apps['Price'])and see for yourself
"return" in the same sense as a return used in a python function
please don't take this the wrong way, but I'ld really recommend you brush up a bit more on your basic python skills (like for-loops and the basic data structures) before delving deeper into pandas' ecosystem
hearty jewel
i definitely will 🙂 really appreciate your help !!
paper niche
👍
 solid mantle
hello there
Can anyone tell me why this warning bar appears?
I don't even understand what this is trying to say
paper niche
it's saying that backend_kwargs (probably u used as an argument for arviz.plots.distplot) is being passed in, but it's useless & will be ignored since the backend engine (matplotlib) doesn't use it
I pretty much regurgitated the error message back to you lol. but that's the gist.
@solid mantle
 lyric violet
i started learning ipynb using jupyter notebook. i have downloaded turicreate and i am trying to find how to add it to Jupyter notebook and also how should i import Graphlab
i'm kinda new to this so yea 😅
lyric violet
@paper niche so i just need to type that in the jupyter notebook command line?
cause i downloaded the file from github and was not sure what to do next 
paper niche
type that in the first cell of your notebook
lyric violet
ugh
paper niche
there should be installation instructions on the github

GitHub
Turi Create simplifies the development of custom machine learning models. - apple/turicreate
lyric violet
yes
paper niche
GitHub
Turi Create simplifies the development of custom machine learning models. - apple/turicreate
follow the instructions there
lyric violet
will it be same while installing graphlab?
paper niche
idk, I don't use either. do you have a link to graphlab?
lyric violet
PyPI
GraphLab Create enables developers and data scientists to apply machine learning to build state of the art data products.
this i guess
 lyric violet
so when using ``pip install virtualenv` do i need to download it at a specific path or i just start it as soon as open command prompt?
paper niche
you can type that immediately.
lyric violet
hmm ight.
lyric violet
@paper niche since turicreate only supports python 3.7 i can't install when python 3.8 is present right?
paper niche
look into pyenv to manage multiple python installations in the same system
or if you're using conda, I think conda can support multiple py versions as well
but the short answer is no, you can't https://github.com/apple/turicreate/issues/3099
GitHub
Issue details copied/modified from #788 As of October 14th, 2019 Python 3.8 has been officially released. We should support it. At an absolute minimum these things will need to be done: Ensure ever...
lyric violet
didn't install conda. so i guess i need install it again?
paper niche
what os you on?
lyric violet
Windows
paper niche
yeah go with conda then
lyric violet
i am doing a course right now and they didn't say anything about using conda. i downloaded python 3.7 and jupyter notebook and doing it on jupyter notebook
paper niche
u downloaded from the python website?
lyric violet
Yes
paper niche
if you're on py3.7 then there's no issue right?
lyric violet
No. I first download 3.8
paper niche
ah okay
lyric violet
Then when i tried to download turicreate package i noticed that it isn't compatible with 3.8 yet
paper niche
sure if you have no need for 3.8 then you can just nuke your python installation and reinstall 3.7

 paper niche
if you ever need to manage multiple python versions (3.7 and 3.8 at the same time, for example), then you're better off looking at conda as a solution
So ig I'll be installing jupyter notebook again for 3.7 right?
@lyric violet yea
lyric violet
Ight. Thanks man.
 fathom bronze
Hey guys. I have a column in my pandas df which has lots of text. I want to write it to excel and also make it look beautiful automatically.
How do I do that?
 tacit marlin
Hey guys, i'm new to jupyther and python and i want to create color a map with contourf, but idk how to work with that properly, can someone help me please?
lyric violet
i am facing issues when i am trying to download turicreate in a environment with python 3.6
the current python version is 3.6.10
 wraith sage
What is the complexity of this?
if the length of the vector is n.
 plain jungle
Does anyone have a CSV for COVID 19 cases that has the features : sex, age, pre-existing_medical condition, weight. And the Label : recovered/Died
 uncut shadow
ummm... you should probably look for it on kaggle
 median drum
does anyone know about the applications of data science in the study of the brain and the mind?
desert oar
@median drum pretty much any experimental research relies on statistics for designing the experiment and analyzing the results
i also work with a guy who has a neuroscience phd and used a lot of math and some primitive machine learning in his research (10+ yrs ago). don't know exactly what he used it all for
lapis sequoia
anybody has exeprience with scipy.optimize?
 willow minnow
Hey guys, I'm doing a course on ML, and I have a question:
At some point, the instructor says that in backward elimination (for filtering variables), we remove all predictors (variables) that have a higher P-value than a specified significance level.
I don't understand why you would want to get rid of significant predictors; wouldn't those be the most important ones that we should keep in our models?
 lusty coral
Maybe they are too good to be a feature. That's because they might be a dependent variable which produces the output.
y=b.x + c, there x is not a good feature.
willow minnow
@lusty coral Hmm, I’m still not sure I understand. If you’re filtering predictors, then you should already know all of them are independant variables, right? I also don’t understand your example. Isn’t the formula you provided the same formula used in simple linear regression algorithms?
 real wigeon
how can i use dcc.dropdown and combine it with dcc.callback
trying to sync up my drop down selection with a callback
and can i do if else logic with the dropdown inputs?
i need to change my graph hover text
real wigeon
as well as the dataset used
 river wing
Need help in this snippet
lusty coral
So if the calculated p-value is less than 0.05, it means that there’s very less probability that we’ll get the same results as the null hypothesis. And if the p-value is more than 0.05, then the probability of getting the same results as null hypothesis is very high, so we can consider the null hypothesis to be true.
so higher p value than 0.05 is a feature elimination criteria, but it really depends on your design in the end
you eliminate the highest one, then keep going until there is no more
@river wing what is .res for ?
try to put your strings into parenthesis maybe?
river wing
Its a package i am using :
reference to problem: https://github.com/huseinzol05/Stock-Prediction-Models/issues/5
@lusty coral

GitHub
I got the script running by using Pipenv. Please see this readme and the Pipfile I made. The problem now is that I'm getting: Best AGENT accuracy value: 3.244000 Is this because I am traini...
@lusty coral you got something for me?
lusty coral
i see. look, your NN_BAYESIAN is a list, not a dict
in this output, the output is a dict
so you cant access them via strings
then print out type(NN_BAYESIAN.res) please
river wing
Okay let me try that real quick.
i wonder i did not made any changes but this time it did not threw any errors. What does that means @lusty coral
hearty jewel
is a pandas series basically one column of a dataframe?
willow minnow
@lusty coral
What is the “null hypothesis” you refer to?
From a quick Google search, this is what I found:
A null hypothesis is an initial statement claiming that there is no relationship between two measured events.
How is that relavant to numerical values, though?
real wigeon
is a pandas series basically one column of a dataframe?
@hearty jewel yes, but this also means that you can not set the index. someone correct me if i am wrong
lusty coral
@river wing when working with jupyter, refresh your kernel all the time when starting over
variables might mess up
river wing
okay bro! but the way here the snippet you ask for.
lusty coral
@willow minnow it basically says this is a good feature if null is passed
@river wing now it's dict; i think no more problems?
river wing
restarted the entire thing to double check. Its in progress
ran perfectly. Thank you so much @lusty coral
lapis sequoia
any data science folks can help me with some matplot trouble in #help-dumpling
thanks
 junior quest
hey guys, does anybody know how to animate markers (i.e. make moving points) on a map using folium?
i've found this: https://nbviewer.jupyter.org/github/python-visualization/folium/blob/master/examples/Plugins.ipynb#Timestamped-GeoJSON

Check out this Jupyter notebook!
i have a dataset containing tons of geocoordinates and other variables like car lanes in a csv, so i can probably make the animation by moving from one point to another in my data using timestamped geojson(idk if anybody understands what i meant) , but can i do that if my data doesn't contain the date/time?
is there a better/easier way to do this?
 crimson steppe
anyone know why cursor.fetchall() for sqlite3 is returning a list of tuples containing tuples as strings?
using cursor.execute("SELECT * from table_name")
 slate scroll
A linear model is fit to some training data. If you've got a bunch of points in Euclidean space you can fit a linear model to those data with .fit(). Is that clear?
blazing bridge
kinda but what does fit itself mean
slate scroll
A linear model is defined by an intercept and slope, right? Fitting just means that we're going to define those two parameters based on the input data.
 surreal pewter
It finds the slope and y-intercept that best matches all the data points
blazing bridge
ok correct me if im wrong and thank you for helping me what the .fit() method does for a linear regression model is make the best optimal line for us that has the lowest lost instead of us coding it from scratch. So like in google sheets or other spreadsheet tools there is a line of best fit which basically means that it finds a line that is closest to all points
it finds the optimal m and b values
surreal pewter
Exactly
slate scroll
Yes it minimizes the residuals
blazing bridge
ok thank you so much
I read this, is this true: "When you call fit method it estimates the best representative function for the the data points (could be a line, polynomial or discrete borders around)."
"With that representation, you can calculate new data points"
Im not really sure what this means
slate scroll
That sounds like a more generic description of the .fit() interface which exists across sklearn models. Describing that fit is fitting some parametric model to the input data.
surreal pewter
It means that your model doesn't have to be straight line - could be a parabola, exponential, logarithm, all sorts of things
and with that approximation you can predict what the value of other points, not present in the training set, are
blazing bridge
so if from sklearn.linear_model import LinearRegression is not specified it will try to find the best type of function to use
or is this still possible in linear regression like parabola and other functions
slate scroll
No, linear regression only fits linear functions. If you want to try other models you'll need to try them. The documentation you mentioned just sounds like it's referring to the .fit() method more generally which exists across all (almost all?) sklearn models.
blazing bridge
yeah thats what i read on stack overflow, so for a linear model what i said before is what happens
surreal pewter
ok correct me if im wrong and thank you for helping me what the .fit() method does for a linear regression model is make the best optimal line for us that has the lowest lost instead of us coding it from scratch. So like in google sheets or other spreadsheet tools there is a line of best fit which basically means that it finds a line that is closest to all points
@blazing bridge for a linear regression, yes this is true
blazing bridge
Im so sorry to bother you but one last question, I am very new to this and I hate to keep annoying you but what is a "model"
slate scroll
So a model is any mathematical representation of your data that can be used to predict new outputs (y-values).
Linear regression is one example of a model but there are many others like random forests, SVD, or naive bayesian
blazing bridge
Does KNN also count as a model
slate scroll
Some would say yes, I would say no, KNN is a clustering algorithm but it wouldn't surprise me if people refer to it as a model.
surreal pewter
KNN is more like a way to obtain a model
blazing bridge
so when we refer to model, cause when I searched this up I was getting all sorts of answers. A model is basically a ML algorithm like linear regression, SVG that is used to predict any y value. Like time of day on temperature
surreal pewter
For example the formula for free fall in physics is kind of a model. People tried to measure falling things and saw that the data points seem to create a parabola. So they came with the formula of that parabola. And then, even when they measured only t=0.01 and t=0.02, with the formula (model) you can predict what happens even in t=0.015
That's the idea of a model
blazing bridge
Ok so i found this: "Machine learning algorithms are procedures that are implemented in code and are run on data.
Machine learning models are output by algorithms and are comprised of model data and a prediction algorithm."
Is this correct
surreal pewter
yes
blazing bridge
in math for like relationships, is against referring to y vs x like for example in the article it says "
Plot sales_predict against temperature as a line, on the same plot as the scatterplot." is this just the dependent variable vs independent variable
and why is it said like this if we plot it (x,y)
Why would we just say plot the temperature against sales_predicted or temperature vs sales_predicted, etc.
 dull turtle
how i can accepts the inputs provided by user . if user provides "country name" and "document type" . I want that image get saved in respectd country folder
 floral siren
@blazing bridge it depends on what your dependent and independent variable. In this case the article says plot sales against temperate. This means that you should plot sales as the x and temperate as the y
@blazing bridge also plotting the x input vs the y prediction value, helps you to figure out the relationship between these variables (negative slope , positive slope, straight line, etc). Also you can figure the type of regression you may want to use
lapis sequoia
has anyone here connected to a sql developer using cx oracle from python? i'll pay $5 if you can help me get the client working properly on my mac. see #help-chestnut
lapis sequoia
anybody has exeprience with scipy.optimize?
 random arch
Hi guys, I'm trying to understand how exactly to do a conditional merge in pandas. I've posted a question in help-calcium. Please help me understand if you know, thanks!
blazing bridge
@floral siren they plotted temperature as x and sale as y
random arch
I have a dictionary of a dictionary of dataframes
I thought its neat to have one structure hold my related dataframes in an organized manner.
but I'm having some trouble to do merges with them. Please look into #help-cherries
thanks!
lapis sequoia
can someone help me with a data filtering question in #help-cake
 storm scroll
Hey everyone, is it good practice when doing data pre-processing to scale different columns with different methods? Example, I want to scale column 'A' using MinMaxScaler, and column 'B' using StandardScaler.
flat quest
generally best to use the same scaler
@storm scroll
otherwise you're not really normalizing the data properly (you're using different scaling rules for each feature)
However, it shouldn't be too big of a deal as long as you scale the data to within the same range.
real wigeon
i cant get my dash button to update my graph, i checked the docs
and stack
and im completely lost
desert oar
@flat quest @storm scroll I actually disagree that using different scaling methods is bad even on conceptual grounds
It very much depends on whether your data has naturally occurring upper and lower bounds or not
blazing bridge
in math for like relationships, is against referring to y vs x like for example in the article it says "
Plot sales_predict against temperature as a line, on the same plot as the scatterplot." is this just the dependent variable vs independent variable. and why is it said like this if we plot it (x,y)
Why wouldnt we just say plot the temperature against sales_predicted or temperature vs sales_predicted, etc.
storm scroll
@desert oar @flat quest I agree it's all about the data, but was wondering if it is used, I never really seen it done before
desert oar
yep i do it all the time
 modern vapor
Hi, how do I get the python interpreter that's linked to my conda environment to run from within the terminal? I've tried activating the environment and then typing 'python', but that runs the python 2.7 interpreter on my system instead. I'm on a mac
blazing bridge
well I think you should put the python 3 into path
blazing bridge
ok
modern vapor
but yes, putting python 3 into the path is a good idea too
and you meant putting anaconda's version into the path right?
blazing bridge
yeah that would make every program that requires python to run what is on path instead of the macOS default
modern vapor
I see
blazing bridge
yeah you could do that or just put python 3 as path and anaconda would see that as the default interpreter
modern vapor
Are there any comprehensive resources that you would recommend for this kind of stuff? I've tried googling, but it wasn't easy to find high-quality stuff
blazing bridge
Whats the specific question i could help you with
Cause this took me quite a while to figure out as well
modern vapor
hmm, well, I just looked at conda's webpage, and they said to use conda init to add them to path
blazing bridge
yeah also putting anaconda in path is a good idea so that both anaconda and python are in path
modern vapor
and along the way i think i need to find the path to the conda interpreter
but how can i do that?
im not sure where my conda is installed
blazing bridge
just a question did you just install conda
blazing bridge
Cause what you could do is just uninstall it and reinstall it and when installing it there is an option to add to path cause itll do the work for you
cause thats what I did and everything works just fine
modern vapor
that's a good idea, but I'd rather just try to do the init without reinstalling because I have some environments and packages that will be a pain to re-setup
im looking at the output of conda info now. will the path be in one of these fields?
blazing bridge
ok if it seems easy do it that way
Yes it should be or search for conda path MacOS
It should give you a concrete answer
modern vapor
thank you!
blazing bridge
Np
modern vapor
Okay should be sorted out now, thanks once again!
blazing bridge
When someone asks you to plot something A vs B, is A on the x-axis or on the y-axis? or A against B
desert oar
in english yes
 cloud furnace
Has anyone been using pandas-profiling? It seems to work most of the time, especially if you have numeric columns. But if you were to change string columns to type 'category', it just seems to get buggy or crashes randomly.
 lime jewel
hey everyone
I have a question about numpy
I have a numpy array that is like this
file ID, param1, param2, param3
There are thousands of rows
I want to output all rows with 1's as values in all three of the parameters
I think np.logical_and.reduce(array[param1]==1,array[param2]==1,array[param3]==1) should work but it doesnt
wat do
blazing bridge
Had a question about a deep learning course. Has anybody here done the fast.ai course and if so would you recommend it, is pytorch taught or is it a prerequisite and what are the prerequisites for the course
desert oar
@lime jewel "doesn't work" isn't helpful, you need to tell us more detail about what went wrong
 modern canyon
I just finished an introductory data science course and now I am looking to get into deep learning. Is there any point learning TensorFlow or should I skip it and learn 2.0? Also, what's the difference between TensorFlow and Pytorch? I know TensorFlow is preferred in the industry whereas PyTorch is preferred in academia, but is it worth learning both if I prefer to go to industry? I am very confused, please provide some clarity. Thanks in advance!
 remote raft
Where did you hear Pytorch is preferred in academia?
modern canyon
remote raft
I don't think that's quite right. That may be true of Computer Science, since some find it easier to experiment with Pytorch, but other disciplines aren't often creating new algorithms.
desert oar
@modern canyon they're both similar enough that if you know one you can pick up the other one
i would say play around with both and pick the one you think is easier to use
the same basic concepts apply to both libraries
modern canyon
thanks for the clarity, but what about TF1 vs TF2? Does these share the same syntax?
desert oar
no, tf2 adopts a syntax more similar to pytorch
i would personally always use the newer version
it's like python 2 and python 3, if you were learning python 2 any time after 2012 i think you were making a mistake
modern canyon
Ah, I see, Tf2 seems to be the way. Thanks y'all for the help!
serene scaffold
@desert oar I think Python2 was the most popular course on codecademy long past that.
I'm not a big fan of theirs though.
desert oar
i know, that doesn't change my assessment
serene scaffold
right
Just that codecademy was encouraging bad behavior.
Is anyone familiar with a word2vec loader that represents each entry as a tensorflow tensor?
desert oar
don't most w2v implementations represent vectors as numpy arrays? you can probably just convert each vector to a tensor as it's loaded
 spare karma
Hello fellas, newbie here, any suggestions on how to efficiently share models with team members? Taking Yolo as an example, I download the weights and 'boom' I'm able to use them. Am I able to do that, or some kind of equivalent, across model types (linear, log, svm, etc, etc)?
Is there some kind of magic file each of them creates, like weights, that I can look for?
(sorry if i'm hijacking, please delete if I am)
serene scaffold
@desert oar I'm trying to use some of the nearest neighbor functionality in gensim, so it would need to be a gensim-like API where the whole thing is GPU-bound tensors.
desert oar
ah, i don't know of anything that exists like that already
sounds like something you'd have to write yourself
serene scaffold
However my code is currently not doing anything interesting with an exit code of -1 and I have no idea why
desert oar
i never got GPU tensorflow working myself...
@spare karma have you looked at http://onnx.ai/

GitHub
Tutorials for creating and using ONNX models. Contribute to onnx/tutorials development by creating an account on GitHub.
desert oar
great, happy to hear it
random arch
I'm stuck with one last step, which seems like I'm missing something very obvious
but I tried and tried, but failed to understand what it is.
will explain my current issue.
random arch
Okay, so I posted my question in #help-avocado . Would greatly appreciate any help here. I'm actually perplexed at the output to a conditional assignment with loc (not what I expected)
random arch
Not sure why that didn't work, but I figured out another way - use combine_first().
blazing bridge
prod_per_year = df.groupby('year').totalprod.mean().reset_index()
Could someone explain what is happening here
I understand that we group the year but what is totalprod
And what is happening here
spare karma
@desert oar hey, thanks for the link!
random arch
@blazing bridge Basically, we’re building a table which takes ‘totalprod’ column’s , and groups them by ‘year’, and get their mean values. Reset index simply makes an index from 0 for these rows..
desert oar
@random arch I have to go out for a few hours, I'll take a look when I get home
random arch
@desert oar I’ve solved the problem using combine_first, thanks!
 pallid geyser
How can I implement a seq2seq chat bot from scratch and deploy for users
Using tensorflow or tensorlayer
 wise pine
i have a doubt, i am very new to ML
when we use Linear Regression we don't need gradient descent right ?
we can just use the calculus formulae generated to calculate the thing in one calculation
Am i correct or is it necessary to use gradient descent to minimise the cost function
blazing bridge
I had the same question. So what gradient descent does is minimize the loss by calculating new values of the slope, m and intercept, b. When using sklearn we don’t need gradient descent. Everything is taken care of. As well as learning rate and calculating a new slope and intercept. Gradient descent is basically finding the derivative of the loss function for every point. I hope that helped
lapis sequoia
Hello, guys I know this python.forum discord but since this is discord for Data,Science i was hoping if anyone knew programming language R and could help me out real quick over 1 question
slim fox
we can just use the calculus formulae generated to calculate the thing in one calculation
@wise pine I believe what you mean here is normal equations
those, indeed allow to avoid the gradient descent and just solve the matrix equation in one go
however if you go beyond linear regression it won't work
When using sklearn we don’t need gradient descent. Everything is taken care of
@blazing bridge I would not say "we don't need". It might be still used under the hood of sklearn (I don't want to claim theat becasue I did not read the source code).
lapis sequoia
@wise pine @blazing bridge when you want to get the parameters for your model, during training you solve an optimization problem. linear regression is a special case where the optimization problem can be formulated as an ordinary least squares problem, which is easier to solve in comparison to other nonlinear optimization problems.
slim fox
you can say we don't need in a sense that we don't need to implement it as it's done already in sklearn
lapis sequoia
@slim fox New to data science stuff. I have what I think is a gradient descent problem, did multivariable calc but am having a little trouble implementing it. Mind if I dm you or just ask it here?
slim fox
ordinary least squares problem, which is easier to solve in comparison to other nonlinear optimization problems.
even then i think if you go to lots of dimensions and huge samples it can become less performant than gradient descent
hey @lapis sequoia, it's best to ask things here
lapis sequoia
Alright thanks
slim fox
better chance of getting asnwers, considering its' 11:15 PM for me and I just jumped in shorrlt
lapis sequoia
even then i think if you go to lots of dimensions and huge samples it can become less performant than gradient descent
@slim fox
You think inverting one matrix can be more expensive than running multiple steps of descent? Just wondering I have never faced with such a case.
lapis sequoia
I agree but in this case is running gradient descent gives more performance?
slim fox
also there is a question of memory, for gradien dsecnet you can do batch/stochasitc while for equations it will be NxN matri

Cross Validated
I am taking the Machine Learning courses online and learnt about Gradient Descent for calculating the optimal values in the hypothesis.
h(x) = B0 + B1X
why we need to use Gradient Descent if we can
@lapis sequoia some info here on the subj
lapis sequoia
@slim fox thanks for the info!
I have a list of orders that I can ship sooner. Orders are given values for how valuable they are.
Order 1, value: 10
Order 2, value: 4
.....
Order 400, value: 19
If an order is shipped, it can decrease the value of another order, or make another order unable to ship at all (value is therefore 0).
I am therefore looking to optimize a sequential listing of orders in order to maximize this value.
Approaches I've thought of: Gradient Descent and some sort of Travelling Salesman approach.
I'm still an undergrad, and am still learning about algorithms and optimization. Any recommendations for how I handle this problem?
Hopefully I explained this well enough, does what I said make sense? Are there any other places where I should go to ask this question if I can't get an answer here?
@lapis sequoia it sounds like a dynamic programming problem to me but I am no expert in it.
@lapis sequoia thank you so much, looking into dynamic programming right now :)
@lapis sequoia Well I'm already using dynamic programming to calculate the value, because that in it of itself is a series of subproblems. I don't think there's any simple way of breaking down the orders themselves and their relations. Still reading into it though and I appreciate the suggestion.
Looking through the different applications to see if anything is similar, but right now travelling salesman seems like the best research line.
blazing bridge
prod_per_year = df.groupby('year').totalprod.mean().reset_index()
I dont understand how this works
prod_per_year = df.groupby('year').df["totalprod].mean().reset_index()
why do i get an error
could someone also explain what is happening in the first line
prod_per_year = df.groupby('year')['totalprod'].mean().reset_index(), i dont get an error
I dont understand how this work except that we group the year but everything after that doesnt make sense
lapis sequoia
@lapis sequoia Ok I looked into it more and this is absolutely a travelling salesman problem on a Hamiltonian circuit
hearty jewel
quick question: I've noticed that using axis='rows' here gets me the actual output i wanted, namely, im multiplying the rows i want and getting an output of two columns that I actually want. when i dont use the axis argument, i get a multiplication across all the rows and end up with a bunch of NaN values. so my question is, what does the axis actually do when im saying axis=rows?? should it not be 'axis=columns'?
blazing bridge
if someone could ping me if they have the answer to my question that would be great
desert oar
@blazing bridge you can select columns from a grouped dataframe just like from a non-grouped regular dataframe
does a dataframe have a .df attribute? of course not, unless you happen to have a column called "df"
with that in mind, your experience should make perfect sense
@hearty jewel what data type is dollars?
numpy matrix? pandas dataframe? pandas series?
 pseudo yacht
Hey all, Currently looking for some guidance on reading xml to 2 dimensional array with a generic algorithm that will for example, read into excel no matter what the structure of the xml looks like
happy to point this elsewhere
wise pine
ok so for linear regression i use calculus to solve
i think no need of gradient descent is needed in that
maybe for some more complex functions , where cost function is too complex to take derivative directly
also i am thinking of not using sklearn for these easy algo and implementing them myself
i can do the same for logistic regression too ?
🤔
flat quest
no
normal equations don't work for logistic regression
And very few problems are truly linear regression problems. Unless you define the inputs and outputs yourself, and explicitly make it a linear regression problem
its more likely that while a certain dataset may look linear for a certain subset of values, the data doesn't follow a linear pattern for the entire dataset. And normal equations are quite difficult to solve, especiallly with higher dimensions, so it might not be worth.
@desert oar
ah didn't see ur message before.
yeah of course everything should be dependent on the data and the context of the data that you have at your disposal.
But while it is good to keep natural bounds, if some features aren't normalized, they might affect an ml model too much since gradients are directly dependent on the loss (and higher losses tend to be correlated with greater input values)
blazing bridge
@flat quest are u able to help me
I had a question about the groupby function in pandas
flat quest
ask the question and i'll see if i can help
blazing bridge
@flat quest drag sorry for the late response
I have this line of code prod_per_year = df.groupby('year').totalprod.mean().reset_index()
prod_per_year = df.groupby('year')['totalprod'].mean().reset_index()
What is the difference between the two lines of code
and one last thing I dont understand what we are doing after the groupby function
Are we specifying the column we want to access in the dataframe because there is nothing called totalprod in year its just the years. Is it basically getting the column in the dataframe and then getting the totalprod for each year?
 cobalt fjord
how can i read multiple images from a folder using glob and opencv?
modern canyon
@cobalt fjord
import glob
import cv2
import numpy as np
dataset = glob.glob(r"your\path\to\image\folder\*.jpg")
images_data = np.array([cv2.imread(image) for image in dataset])
replace *.jpg with your image files extension
 thin terrace
Hi,
I have a large dataset with super many missing values. 195k instances, 96 features, 1 binary label and a 19:1 imbalance ratio between the two classes.
After cleaning the data I end up with 97k instances, just 4 features and the same imbalance ratio between the classes.
Training a CatBoostClassifier on the train data and validating it on the test data gives me a 100% accuracy. These results feel unrealistic but at the same time I cannot think of something I would have done wrong.
Are my results legit? Can I validate them better?
desert oar
@flat quest maybe i didnt explain well, i think you're saying the same thing as me. if you do have natural bounds, i don't see a reason not to normalize them the [0,1] or some other range that's closer to the scale of your other features
@thin terrace does your test data have the same 19:1 ratio as your training data? how many of the rare class instances are in the test data? remember that the "sample size" of many models is not the total number of records, but the total number of records in the smallest category.
thin terrace
@desert oar Yes, approximately 19:1 ratio in both subsets.
Total data:
Class 0: 184760
Class 1: 9842
Ratio: 18.8:1

Train data:
Class 0: 166220
Class 1: 8903
Ratio: 18.7:1

Test data:
Class 0: 18540
Class 1: 939
Ratio: 19.7:1
So you had 100% accuracy on 939 instances of the rarer class? I find that very implausible
thin terrace
yep
desert oar
My first instinct would be to assume that I had a bug in my code
Of curiosity though, how many boosting rounds did you do and what were your model parameters
thin terrace
categorical_features_indices = np.where(X_train.dtypes != np.float)[0]
clf = CatBoostClassifier(class_weights=[0.9467, 0.0533], custom_metric='Accuracy')
clf.fit(X_train, y_train, cat_features=categorical_features_indices)

print(clf.score(X_test, y_test))  # 1.0
y_pred = pd.Series(clf.predict(X_test))
y_pred.value_counts()  # class_0: 18540, class_1: 939
I tried 2 approaches:
- One where I just did
df.fillna(-999, inplace=True)and kept all the features and rows in the dataset. - One where I dropped columns and rows in order to have no NaN values.
Both give perfect prediction rates
thin terrace
Found the problem: an error in my code hehe, thx for helping tho
lapis sequoia
how do I kill my code if it runs for more than 3 hours
I'm running in a notebook
like, I want it to throw an exception and just stop everything
 sand fractal
Any noob friendly tutorials to learn data science? For context, I know some basic python and I am a more into application based learning.
 boreal portal
What do you wanna do?
 vital echo
I need help regarding a scenario which is:
However, the area I am having trouble with is how to move the new ratings to the next match (row) that a team plays. In the image you can see a red square with 1525 inside it – this is the new_rating for St. Pauli. I need this rating to pop up in the team_rating column for St. Pauli’s next game. I also need it to find the opposition rating (in this case Darmstadt 98), and find their most recent new_rating, and populate the oppo_rating column with that value. This would then allow the ELO calculation to create a new_rating for St. Pauli for that game, and the process would continue.
kindly provide me some solutions regarding it
vital echo
any one?
desert oar
@vital echo i would just do this manually
i'm not sure there is an efficient or programmatic way to do it
# Get the row you want to fill with data
next_match_row = data.iloc[-1]
next_match_index = data.index[-1]

home_team = match_row.at['team']
home_rating = data.loc[(data['team'] == home_team) | (data['opppo'] == home_team)].iloc[-1].at['new_rating']

oppo_team = match_row.at['oppo']
oppo_rating = data.loc[(data['team'] == oppo_team) | (data['opppo'] == oppo_team)].iloc[-1].at['new_rating']

data.loc[next_match_index, ['home_rating', 'oppo_rating']] = [home_rating, oppo_rating]
something like that
vital echo
its fine even if its not efficient
desert oar
instead of just using .iloc[-1] obviously you have to select the row you need
you might have to loop over rows or something
or better yet, loop over index values corresponding to the rows you need to fill
if you provide me with sample data i can show a fully working example
vital echo
let me give you sample data
arctic wedgeBOT
Hey @vital echo!
It looks like you tried to attach file type(s) that we do not allow (.csv). We currently allow the following file types: .3gp, .3g2, .avi, .bmp, .gif, .h264, .jpg, .jpeg, .m4v, .mkv, .mov, .mp4, .mpeg, .mpg, .png, .tiff, .wmv, .svg, .psd, .ai, .aep, .xcf, .mp3, .wav, .ogg.
Feel free to ask in #community-meta if you think this is a mistake.
desert oar
thanks. i got the DM, i will have to try it tonight
vital echo
yeah great thanks a lot
spare karma
any pytorch users in chat? RuntimeError: CUDA out of memory. Tried to allocate 2.07 GiB (GPU 0; 11.00 GiB total capacity; 6.73 GiB already allocated; 1.82 GiB free; 6.78 GiB reserved in total by PyTorch)
Shouldn't I be allocating to what pytorch reserved?
spare karma
I'm, obviously, new and super confused.
desert oar
@spare karma can you share your pytorch code?
i'm not an expert or anything but i can at least eyeball and see if you are doing something weird
lapis sequoia
looks like you don't have enough memory
spare karma
@desert oar @lapis sequoia thank you for the responses. Just started working with pytorch yesterday, never ran into a memory error till today. I attempted to expand my training dataset by a factor of 2 and quickly ran out of memory...and then cried wolf here.
 steel ravine
Hi guys, I was directed here to repeat my question. Do you have experience with image/pattern recognition using python, like detecting a face on a photo?
I just need a direction to research in
 spiral peak
OpenCv is definitely a library to use. In terms of the pattern recognition, that depends on the algorithm or what type of recognition you want.
spare karma
Agreed
steel ravine
I would like to recognize a special card simbol that is used to mark some cards. Source input is a IC camera
steel ravine
So OpenCV would be better suited in this situation?
boreal portal
OpenCV will cover you for any ol thing
steel ravine
Great, thank you very much
boreal portal
It's a good place to look
But it's not gonna get you to the end of what you want
What that guy said up top with YOLOV5 is fast and will cover you good.
A simple CNN would also work and be easy
steel ravine
Since this is a stamp and not a handwriten mark I don't think neural networks will be needed
steel ravine
Stamps on a flat surface only have 2D transforms applied to them when you see them and hand written marks have subtle deviations from mark to mark
boreal portal
So this stamp is always the same?
steel ravine
yes