#data-science-and-ml
1 messages · Page 225 of 1
 rigid storm
 polar acorn
Yes. Some terms and conditions apply by the way, I said no matter what distribution the data originally had, that is not quite true, there are exceptions. For instance your sample values must be independent of each other (a time series for instance is most likely not). Also some distributions are exceptions but you are unlikely to run into any of those.
rigid storm
But this wont help me if i still need to decide on methods to run t tests on for example right?
because if i have x columns (of DV's) where i want to compare means of vs the other group that filled in the same thing
then i would have to check for normality of each column? each group seperately?
or should i in this case just ignore it and look for other tests that dont assume normality of data?
this is how responses look
@rigid storm if for example the data looks something like this
so 85 rows, and it goes on for like 50 columns wide (half of the rows 1 group other half the other group) and then those 50 rows can be merged into 12 columns total
50 columns will become 12 columns* sorry
but still, trying to check normality for 12 columns and potentially twice (1 time for each group?) would be 24 tests for normality?
that doesnt seem efficient
polar acorn
Hmm now I never did surveys, but I would assume that each group having >30 samples per column might be enough to assume the mean of that column being normally distributed. In that case you have two normally distributed values for each column and can compare them as you would with any two other normally distributed values. The normality of the data does not really matter if you have enough samples because you will likely be comparing the means anyway right? And with enough samples those are normally distributed.
rigid storm
Ah yeah so im indeed comparing the mean for each column against the mean of the other group.
i have to make sure im actually saying the right thing
lol.
should be right. theres a certain distribution and SD, M for each column (of the total of 12 columns)
for group 1 of that column
and group 2 of that column
those means get compared.
polar acorn
That is what I would do.
rigid storm
there might be problems with the variance tho. but there is tests that dont assume equal variances so should not be a problem?
one sample is 37 the other is 47
polar acorn
Doesn't matter there are significance tests for both equal and unequal variance.
rigid storm
would you default to the test that doesnt assume it right away?
or test on equal variances first for 12 columns and hope they all pass?
essentially im going to conduct 12 t-tests unfortunately
thats what it looks like right now
polar acorn
That depends on the data I guess, I believe it's an assumption you just have to do.
However if you are actually going to try to publish this anywhere I would definitely talk with someone who is more up to date on stats than I am. The field of statistics in social science for instance has been changing drastically the last 10 years and all the stuff I learned is probably dated. Look into the whole replication crisis if you have time, interesting stuff.
rigid storm
Sure, thanks for the response! 🙂
polar acorn
No problem, best of luck 👍
 sonic raft
Hi guys! Is it possible to make a neural network with sklearn that can operate with other programs, like a snake game?
 uncut shadow
well, I'm not 100% sure if sklearn has neural nets but if it has then yes, you can
sonic raft
As I see, it has several MLP algorithms
 gritty solstice
God I need some Pandas help.
I'm trying to avoid a recursive function and generating multiple dataframes. I'm sure theres a way in pivot to achieve this, but I can't quite figure it out
Lets say I had the following DF
    status    alive   errors    maint_needed
0    P3    True    True    True
1    Not Set    True    True    True
2    P2    True    False    True
3    P2    True    False    False
4    P3    True    True    False
...    ...    ...    ...    ...
77    P2    False    False    False
78    P2    True    True    False
79    P3    False    False    False
80    P3    True    False    False
81    Not Set    True    True    False
What would be the most pythonic way of reshaping it to the following Dataframe? where I used column status as the grouping index
Status  Count  alive     errors      maint_needed
P1      7      57.1%     42.9%       14.3%
P2      26     80.8%     57.7%       69.2%
I know about values_count() and grouping, and pivoting. But I cant seem to find a way to combine them all simultaneously without predefining a receiving dataframe and manually iterating through each of the columns to get the values
I can add the flavor of multiplying by 100, and adding the percentage. But basically I need to get the normalized value counts for each column aside from 'status' where value = True whilst pivoting I guess
Figured it out!
dataframe.pivot_table(
  index='status',
  agg_func = lambda x: x.value_counts(normalize=True).get(True)
)
 buoyant vine
if __name__ == "__main__":
    spells = [{'name': 'my custom spell', 'data': 'this thing has 120hp'}]
    spells_data_frame = pd.DataFrame(spells, columns=['name', 'data'])
print(spells_data_frame.to_dict())```doing pandas
how can i orient the to_dict() to return the same dict as what went in
atm its returning:
{'name': {0: 'my custom spell'}, 'data': {0: 'this thing has 120hp'}}```wait nvm
records did the trick
 arctic canopy
what's up guys i have a numpy question,python arr = np.arange(16).reshape((2, 2, 4))
so this will create this array array([[[ 0, 1, 2, 3], [ 4, 5, 6, 7]], [[ 8, 9, 10, 11], [12, 13, 14, 15]]])
so why if I transpose it like this arr.transpose((1, 0, 2)) its will give me this array python array([[[ 0, 1, 2, 3], [ 8, 9, 10, 11]], [[ 4, 5, 6, 7], [12, 13, 14, 15]]])
like 1 is [[ 8, 9, 10, 11], [12, 13, 14, 15]]])
so why the [[ 8, 9, 10, 11] was replaced with the first one instead off all the array ,i know its because of the 2 but this is not making any sense for me
also if i type arr[2] it will give an error,sorry if i didn't explain well but im struggling with this for a while now and I searched for it but still not understanding the how
rigid storm
guys can i do something like this in rstudio?
to like create a list object where i store the column variables
and iterate over them, testing all of them once and making a sep histogram for each of them?
or: how to run one test for example, but for column X1 for example, whereby the test is only done on those rows of that column if the same row has a certain number in the column before it. in this case either 0 (group1) or 1( group2)
so for example here, there is 1s and 0s, and i only want to run a test on the numbers on the righthand column seperately based on which group they fall in.
 paper niche
so why if I transpose it like this
arr.transpose((1, 0, 2))its will give me this array
@arctic canopy
arr.transpose((1, 0, 2))means that the array's first axis and second axis (axes 0 and 1) are swapped, with axis 2 being unchanged.- Let's break this down with a simple 2D example first. Think about a 2-dim array, say a 2x3 matrix called A. When you transpose axis 0 with axis 1, it will become a 3x2 matrix. More concretely, the element in A at index (0, 1) will go to index (1, 0) in A^T. The element at index (1, 2) in A will go to index (2, 1) in A^T. I'm assuming you understand this -- otherwise you need to brush up on your matrix basics first.
- Back to your example, when we transpose axis 0 and axis 1 (and leave axis 2 unchanged), a similar thing happens. The array at index [0, 1, :] in arr will become an array in the transposed arr at index [1, 0, :].
If you see the picture with output cell [12], arr[0, 1, :] == [4, 5, 6, 7] and arr[1, 0,:] == [8,9,10,11] do indeed swap places in new_arr.
with arr[0, 0, :] and arr[1, 1, :] remaining the same in new_arr for obvious reasons
also if i type
arr[2]it will give an error,sorry if i didn't explain well but im struggling with this for a while now and I searched for it but still not understanding the how
@arctic canopyarr[2]is equivalent to sayingarr[2, :, :]orarr[2, ...], i.e., you're trying to access the third "row" in the first axis, which doesn't exist. There are only 2 "rows" in the first axis.
paper niche
the numbers in that tuple correspond to the axes in the original array. the position of the numbers in the tuple represent the axes in the transposed array. For example, transpose((2, 0, 1)) would mean I want to make axis 0 in arr be axis 1 after transposing, axis 1 in arr be axis 2 after transposing and axis 2 in arr be axis 0 after transposing
just realized the exact same questions' been asked before. with better visualizations in SO: https://stackoverflow.com/a/32034565

Stack Overflow
In [28]: arr = np.arange(16).reshape((2, 2, 4))
In [29]: arr
Out[29]:
array([[[ 0, 1, 2, 3],
[ 4, 5, 6, 7]],
   [[ 8,  9, 10, 11],
    [12, 13, 14, 15]]])
In [32]: arr.tra...
arctic canopy
I read this but i thought I had to deal with bytes
Thanks a ton for the answering I think its now making for scense for me I will reread your answer again and try to understand it better
paper niche
sure np
arctic canopy
also one more thing do I need to know much math to understand numpy?
paper niche
yes
 timber quest
hey there, I have a pandas dataframe and one column contains a list of people separated by ",". I want to have a set of those people for each of these rows. I tried to to it via "split", but that gives me new rows? I have no idea how I can iterate through this to achive my goal
import pandas as pd

# read the file
df = pd.read_csv('list2.csv')

# fill the empty fields
df.fillna("", inplace=True)

# getting all the possible entries in each category
castmembers = {}

for film in df:
    print(film.loc['castmembers'].split(pat = ","))
This is what I tried
print just to see if I get what I think i'll get
it's iterrows(),
hm. I might be able to continuel. thanks for being my rubberducks to talk to.
Apparently iterating is not very pandas. I will continue with this: https://stackoverflow.com/questions/16476924/how-to-iterate-over-rows-in-a-dataframe-in-pandas
Stack Overflow
I have a DataFrame from pandas:
import pandas as pd
inp = [{'c1':10, 'c2':100}, {'c1':11,'c2':110}, {'c1':12,'c2':120}]
df = pd.DataFrame(inp)
print df
Output:
c1 c2
0 10 100
1 11 110
2...
uncut shadow
I have a question. Why are parameters in RNN shared between cells?
buoyant vine
                            sec = list(map(append_to, spell_data))
                            df2 = pd.DataFrame(sec, columns=['name', 'data'])
                            print(df2)
                            self.spells_data_frame.append(df2, ignore_index=True)
print(self.spells_data_frame)```Have this system to append to an empty df
but for some reason df2 even if its got items in it
doesnt get appended to self.spells_data_frame
any ideas?
 wanton oasis
u can use merge maybe
rigid storm
'Levene's test is not appropriate with quantitative explanatory variables.' the groups that i split on are split on either 0 or 1
im trying to test whether the groups have equal variances
this is in r btw. does any1 know how to resolve this?
is it even needed to test for variances? (1 group has 36, the other 47 people)
or should i just immediately use welsch's t-test?
 lusty coral
@buoyant vine you are using .append but not assigning it to anything
check if .append has inplace option, or just assign the result to itself
buoyant vine
oh so it doesnt work the same as lists?
lusty coral
let's say:
a = pd.DataFrame....
b = pd.DataFrame....
b.append(a) does nothing, just returns an appended df for your viewing pleasure. a and b are not updated
b = b.append(a) there you update your b variable with the returned dataframe
but remember you lose your original b, so if you want to avoid that just assign the new df to a new variable instead
@timber quest if you want to iterate over rows, try .apply(lambda x: x, axis=1) option
less confusing, more explanatory
@timber quest also check read_csv docs thoroughly, there are so many options
 candid thicket
Can I get some help with beautifulsoup? I'm trying just get the stuff inside the tags, I hear decompose() is how you do that. But it is removing the whole tag.
url = 'https://www.dengiamerika.com/a/kurdistan-human-rights-watch/5432009.html'
page = requests.get(url)
soup = BS(page.content, 'html.parser')
category = soup.find(class_='category')
category.a.decompose()
print(category)
with decompose:
<div class="category">
</div>
without:
<div class="category">
<a class="" href="/z/2204">ههرێمه کوردیـیهکان</a> </div>
I just want the foreign language text
 solid mantle
arctic canopy
solid mantle
arctic canopy
soup.select("div.category a")[0].text.strip() @candid thicket
candid thicket
@arctic canopy Thanks!
arctic canopy
np
 vital echo
Hello,
Can any body tell me about any method to check importance of variable to feed to neural network if I have several variables?
 wide rose
hey do we expect the SE to converge to the population SD?
no right
 velvet thorn
wide rose
velvet thorn
wide rose
Yea
 summer yarrow
https://stackoverflow.com/questions/61982261/pytorch-backpropogate-more-than-one-loss
Stack Overflow
Stack Overflow
I want to backpropogate more than one sample. That means more than one loss in PyTorch.
I am trying to do that:
loss = 0
for g, logprob in zip(G, self.action_memory):
loss += ...
I want to backpropogate serveral lossen in a loop
        for g, logprob in zip(G, self.action_memory):
            losso += -g * logprob
        self.buffer.append(losso)

        for loss in self.buffer:
            self.policy.optimizer.zero_grad()
            loss.backward(retain_graph=True)
            self.policy.optimizer.step()
I got a error
RuntimeError: one of the variables needed for gradient computation has been modified by an inplace operation: [torch.FloatTensor [91, 9]], which is output 0 of TBackward, is at version 2; expected version 1 instead. Hint: enable anomaly detection to find the operation that failed to compute its gradient, with torch.autograd.set_detect_anomaly(True).
 silent swan
I'm not sure what you're trying to do
but it looks like the solution may be to do the optimization step outside of the loop
 thin remnant
i'm trying to plot how the amount of cases and deaths grew in a time series with a line chart but for some reason it does this weird thing
this is what i want it to look like
but than just for deaths and cases
thin remnant
pingeling
 gusty willow
How to classify news articles into different categories and sub categories ?
candid thicket
@gusty willow I guess that would depend on what your goal is. News articles tend to already be categorized. I'm working on a news article webscraping project right now and there is a category tag that I just scrape out of the html
gusty willow
@candid thicket i already have data in csv format,dataframe
 lapis sequoia
hi
I'm having trouble reading my file into a dataframe..
I saved the output from my analysis as a dataframe object, but I'm not sure how to read it back properly
it's messed up like this when I try pd.read_csv or pd.read_table
lusty coral
Check out read_table documentation. There are so many options for it
Start with delimeter
lapis sequoia
thank you
i'm close
but it still doesn't display one of the columns
I think it's because I tried to put dicts into each row within that column
and couldn't figure it out
paper niche
your !cat shows that the ... is actually in the file though
you can see, 1 of the columns is named ...
lapis sequoia
ahh..
well, that's not what I actually named the column.. maybe it got squished.. I'm just going to leave it out
like that column was supposed to contain urls in a dict, for each row
I couldn't figure out how to do that
paper niche
it's a strange way of saving a dataframe though. why is it in this format, btw?
it's messed up like this when I try pd.read_csv or pd.read_table
@lapis sequoia this analysis was done in pandas?
lapis sequoia
I'm building a pipeline
so I wrote it to an object.. I tried writing it to parquet file first, but couldn't figure it out
so as a short term fix, I did this
paper niche
ah
 half hare
Using numpy how can I create a matrix from the intersection of two matrices
sonic raft
Hi! I'm trying to make a Image Classification model, with Logistic Regression, but I have a enormous problem, that I cant figure out, I'm trying to fit images as features, but it seem impossible, because, If I try to create an array of images, it will always be a 3D array, and I can only fit 2D array as features.
What Should I do?
silent swan
flatten the H and W dimensions
lapis sequoia
Trying to represent a large spreadsheet in python. Tkinter doesn't seem to be able to do this and I can't find alternatives. Anyone know of something I can use?
 valid drum
Why do I get diffrent values with TF and Numpy with the same weights?
w = np.random.normal(size=(y.shape[1], 128))
y_tf = tf.constant(y, dtype='float32')
yy = tf.keras.layers.Dense(128, activation='relu', weights=[w], use_bias=False)
y_tf = tf.keras.layers.Input(tensor=y_tf)
y_tf = yy(y_tf)

with tf.Session() as sess:
    sess.run(tf.global_variables_initializer())
    res = sess.run(fetches=y_tf)

y = np.matmul(y, w)
y[y<0] = 0
shape says 2,4 but i've got way more records in the df..
How an i make sure it doesn't throw that error
 dense scroll
Hey guys I just took a course about Data Types. I got introduced to libraries, tuples, lists and sets. I was wondering if any of these were better than using a dataframe with panda; are they worth my time learning for data science?
lapis sequoia
pandas are heavier.. I personally haven't used them for loading tabular files beyond 1 GB
there's dask, which implements all of pandas methods, but is meant for distributing the processing
you've listed basic types.. those are essential.. Lists are what numpy arrays are built on top of.. and pandas is built on top of numpy arrays
you gotta learn the basics
 real wigeon
im so confused about the dashboard ecosystem
people seem to like dash
is there a way to graph other libs using dash, because it looks like their mplt to dash method is deprecated
lapis sequoia
Hey guys, what server do I go to for machine learning help?
real wigeon
sentdex is good for ml
lapis sequoia
Do you happen to have a link for it?
real wigeon
it's on his youtube channel, under community tab
lapis sequoia
Thanks!
real wigeon
np
is dash basically useless, and I should just learn flask to build the dashboard since dash is based off of flask
?
dense scroll
@lapis sequoia Thank you for the answer! I will get comfortable with the basics then
lapis sequoia
@real wigeon dash is nice.. the typical case is integrating with existing dashboards, not building your own
tableau, powerbi, superset, metatron
 past pewter
is dash basically useless, and I should just learn flask to build the dashboard since dash is based off of flask
@real wigeon Dash isn't based off of flask. It runs on top of flask. You'll end up learning a bit of both if you go with Dash. It's great for dashboards, though it has a bit of a learning curve and I hate the documentation. Been using it a ton lately.
is there a way to graph other libs using dash, because it looks like their mplt to dash method is deprecated
Just learn plotly, which is the graphing library that Dash uses. It's got great documentation and is quick to pick up.
This course is a great jumping off point if you have money:
https://www.udemy.com/course/interactive-python-dashboards-with-plotly-and-dash
Otherwise this guy has a short video series that it nice, starting with this video:
https://www.youtube.com/watch?v=yPSbJSblrvw
real wigeon
I'm frustrated because I just did all my data parsing and visualizing with pandas/matplotlib
 ember patio
Is there anyone experienced in Tensorflow and Deep learning here? Thats what I want to get to eventually. Any pointers, videos, or information would be nice. That is if this is the right place for this question.
real wigeon
And I try to build a dashboard to display it all, and dash doesn't seem to allow me to use matplotlib
It just seems stupid, why learn another graphing library if others may be better
thin remnant
I wanna plot a calendar heatmap but only have records for 75 days
how can i crop the heatmap to only show these months/days?
i'm using the calmap
lapis sequoia
matplotlib is more complex than plotly imo
thin remnant
could i pm you ?
or ill just try and explain here
so my format looks lik this
so what am i doing wrong ?
the index are dates
but it still can't plot it out
paper niche
tempdf's index aren't dates, as the error message says. either do tempdf = tempdf.set_index('date') or calmap.yearplot(tempdf.set_index('date'), year=2020)
real wigeon
@lapis sequoia that's my point though, isn't it more versatile than plotly?
And then there's other libraries like seaborn, which aren't compatible with dash
thin remnant
@paper niche look at the first screen 😉
they are dates
so that's why i thought it was weird that it didn't work
if i do the inline set_index it gives me another error tho
whcih doesn't make any sense again..
paper niche
they are dates
@thin remnant you didnt assign it back to temp_df
thin remnant
do i have to if I inline it ?
paper niche
set_index is not an inplace operation
take a look at what tempdf is if you don't believe me
thin remnant
actually i don't want to plot the entire year...
just certain months
yea like 2 months or sth
2020-03-01 until 2020-04-xx
paper niche
deaths = tempdf.query("'2020-03-01' <= date <= '2020-04-01'").set_index('date')['Total Deaths']
calmap.yearplot(deaths, year=2020)
sports = {99: 'Bhutan',
          100: 'Scotland',
          101: 'Japan',
          102: 'South Korea'}
s = pd.Series(sports)
s[0]
why this shows an error ?
paper niche
there's no key called 0? your 4 keys are 99-102
either do s[99] or s.iloc[0] @lapis sequoia (assuming you're looking to get 'Bhutan' as the output)
paper niche
will what work?
lapis sequoia
if i write the keys as this :
'99'
thin remnant
xd
paper niche
yep
thin remnant
feel like im close
paper niche
I mean, give it a try
paper niche
erm, .ix is deprecated
thin remnant
yup thats what i saw on google
but you don't even use it
so where comes the error from
thin remnant
so i should overwrite the calmap function and change ix to iloc ?
paper niche
you can try? or maybe just downgrade your pandas version if you really really want to use calmap
thin remnant
i don't necesarly want a calmap
just a calendar format
you have any easier suggestions
paper niche
nope (I haven't done work on this before)
paper niche
GitHub
In version 1.0.0 of Pandas, Series.ix and DataFrame.ix was removed, breaking calmap. See https://pandas.pydata.org/docs/whatsnew/v1.0.0.html However, this method is still used at calmap/calmap/__in...
have a stab at the suggestions there
thin remnant
Yea
so i just copy the yearplot func
and change .ix to loc ?
that doesn't work ...
copied the function changed the ix to loc and it says name calendar not found
paper niche
the whole package is just a single file.. just copy paste this whole py file as a new file in your working directory, and import from that instead. https://github.com/martijnvermaat/calmap/blob/master/calmap/__init__.py
GitHub
Calendar heatmaps from Pandas time series data. Contribute to martijnvermaat/calmap development by creating an account on GitHub.
paper niche
no you just need this file
don't call it __init__.py tho. just name it something else like my_calmap.py or smth
thin remnant
ugh i hate python improrts
ofc it can't find it...
it's in the same direcotry as my notebook
yet when i say import myfile
'No module named ...'
paper niche
restart your notebook kerne
paper niche
no it's not, i'm in a notebook environment and it works
thin remnant
ill provide screen
wait gotta try sth first
yea import worked
i was just a lil retarded
@paper niche RIP
errors keep coming to me
paper niche
just pass in a linecolor='k' argument..
thin remnant
ok nice it plots it out
but not the way i want it xd
but ill play around with it
and if it doesn't get working ill just make a post
lapis sequoia
df = pd.read_csv('olympics.csv', index_col = 0, skiprows=1)
df.head()
what is this doing?
i know what df.head() does
but what is index_col = 0 doing?
 unreal thistle
hello guys ,i trained a model using transfer learning vgg and i need to do the segmentation of the model ,can someone give me a hint how i can do that
?
lapis sequoia
@lapis sequoia should not be to hard to read the documentation
past pewter
And then there's other libraries like seaborn, which aren't compatible with dash
@real wigeon Dash is compatible with plotly. If you want a matplotlib chart, you use matplotlib. If you want a dashboard, matplotlib isn't it. You pick the right tool for the job. What I'm not getting is where the issue is here. You set your x data and y data, and BOOM- you have your plot, just interactive.
df = px.data.iris()
fig = px.scatter(df, x="sepal_width", y="sepal_length", color="species")
fig.show()```If you want your exact chart, in the exact style, not interactive, you can save your matplotlib chart as an image and then use it as a background in a plotly chart.
https://plotly.com/python/images/
How to add images to charts as background images or logos.
real wigeon
I need interactive
It seems stupid, if it's so simple to switch plots then why wouldn't it be compatible
You're dependent on dash and plotly, unless you want to code a dashboard using django or flask
Plus, I believe you can use more charts/graphs using other libs like seaborn
It was deprecated, they suggest using images as backgrounds
past pewter
edit- that was unnecessarily snarky
real wigeon
I have to now refactor
past pewter
import plotly.graph_objects as go

fig = go.Figure()
fig.add_layout_image(
    dict(
        source="<YOUR IMAGE SRC HERE>",
        x=WHATEVERXYOUWANT,
        y=WHATEVERYYOUWANT,
    ))

fig.update_layout(
    title_text="<YOUR TITLE HERE IF NOT ON YOUR IMAGE>",
    height=<AN_INT_WITH_SIZE_YOU_WANT_YOUR_IMAGE_HEIGHT>,
    width=<AN_INT_WITH_SIZE_YOU_WANT_YOUR_IMAGE_WIDTH>,
)
👆 Refactored
valid drum
Any ideas why my implementation for backpropagation in a fully connected layer is wrong?
x = np.random.normal(size=(8, 500))
w = np.random.normal(size=(x.shape[1], 128))

y = np.matmul(x, w)
dy = np.random.rand(*y.shape)

dx = np.matmul(dA_prev, w.T)

xx = tf.constant(x, dtype='float32')
ww = tf.constant(w, dtype='float32')
dyy = tf.constant(dy, dtype='float32')
yy = tf.matmul(xx, ww)
dxx = tf.squeeze(tf.gradients(yy, xx, dyy), [0])
with tf.Session() as sess:
    dx_tf = dxx.eval()

np.testing.assert_almost_equal(dx, dx_tf, 3)
 cobalt jetty
what's the error message?
valid drum
Nevermind, it's working.
sonic raft
Hi! Is it possible, to read (multiple) images, as a 2D array, and store them in a 2D array somehow?
Because, I want to create a Perceptron that is capable of Image Classification
unreal thistle
hello guys 🙂
so i trained a model and now i try to make a gui for the app
but i have this problem
    model.model_predict()          # Necessary
AttributeError: 'Model' object has no attribute 'model_predict```can you help me pls
 slate hollow
@unreal thistle i thought it just model.predict() or something
 umbral aspen
hi guys - I am trying to filter a data frame based on row value. In my rows I could have the following list ['delete'] and I want to filter out those rows. I tried df = df['delete' not in df.tags] but this is not working
criterion = lambda row: 'delete' not in row['tags']
df = df[df.apply(criterion, axis=1)]
That seemed to work
 rain palm
@umbral aspen apply is very slow (gets slower as more rows are added):
In [8]: df = pd.DataFrame({'tags': ['delete', 'text']*1000})

In [9]: criterion = lambda row: 'delete' not in row['tags']

In [19]: %timeit df[df.apply(criterion, axis=1)]
57.9 ms ± 1.12 ms per loop (mean ± std. dev. of 7 runs, 10 loops each)
Use <column>.str.contains and the ~ (not) operator instead:
In [18]: %timeit df[~df['tags'].str.contains('delete')]
1.9 ms ± 35.9 µs per loop (mean ± std. dev. of 7 runs, 1000 loops each)
hi, so im coding a "sentiment detector" along with a tutorial, and my code is as so: https://paste.pythondiscord.com/viwoviqexu.py
however, it gives me this error, and it says that i handled the input wrong, but i don't know where i went wrong: https://paste.pythondiscord.com/ukudipubix.py
can someone help? (ping 2 reply thx)
umbral aspen
Thanks @rain palm In my case speed is not that important but good to know for the future
I am dealing with a multi label problem and after training my model for only 1 EPOCH I acheive pretty good results...however when I then predict with that model I am quite disappointed with the results...How does keras determine what is a "good" prediction when it calculates the val_accuracy?
Here is my model:
# transfer learning
base_model = tf.keras.applications.vgg19.VGG19(input_shape=(IMG_HEIGHT, IMG_WIDTH, NUM_CHANNELS), include_top=False, weights='imagenet')
base_model.trainable = False
x = base_model.output
x = layers.GlobalAveragePooling2D()(x)
x = layers.Dense(4096, activation='relu')(x)
x = layers.Dense(13, activation='sigmoid')(x)

model = models.Model(inputs=base_model.input, outputs=x)

# compile the model
model.compile(optimizer='adam',
            loss=tf.keras.losses.BinaryCrossentropy(from_logits=False),
            metrics=['accuracy'])
Results after only 1 EPOCH: 22/22 [==============================] - 217s 10s/step - loss: 0.3231 - accuracy: 0.8597 - val_loss: 0.2861 - val_accuracy: 0.8828
I have 13 possible tags..
unreal thistle
how i can transform an image to rgb without using opencv?
unreal thistle
thank you very much
real wigeon
Any data science courses worth buying right now before the memorial day sale ends?
real wigeon
I'm asking about courses to purchase, not websites to purchase from
lapis sequoia
oh.
 twin walrus
I think I'm in the right spot, but hoping someone here can help me with a Plotly charting question. I have information being charted from a CSV to a interactive graph. But the graph keeps inserting the "K" after this data for some reason. I'd like to remove just the "K" as it's sort of redundant and could be misread as 37,000,000 for example, compared to the accurate 37,000.
 ripe forge
What's the code snippet responsible for this display?
twin walrus
I belive this is the pertient code:
fig.append_trace(go.Scatter(
    x=df['Unnamed: 0'], y=df['MCD Sales'],  # Data
    mode='lines+markers', name='Sales', hoverinfo='y', # Additional options
    ), row=1, col=1) # Subplot Area

fig.append_trace(go.Scatter(
    x=df['Unnamed: 0'], y=df["MDC Units"],  # Data for second line
    mode='lines+markers', name='Units', hoverinfo='y', # Additional options
    ), row=2, col=1) # Subplot Area

fig.update_layout(height=600, width=600, yaxis_tickprefix = '$', hovermode='x unified',
                  template=symbol_template, separators=",", title_text="Stacked Subplots"
                  )
 pulsar crag
@umbral aspen i think the model is underfitting when validation accuracy is greater than train accuracy the model underfits try to run for few more epochs until the validation accuracy and train accuracy are close enough or train accuracy is slightly higher than validation accuracy
sonic raft
Hi! Is it possible, to read (multiple) images, as a 2D array, and store them in a 2D array somehow, (in numpy) ?
To use it later, as train dataset.
paper niche
Yes, it's possible
The natural way to store it is of course 3D, (# of images, width, height), but you could flatten into 2D and store that (# of images, width*height) as well.
 trail cloak
im still in the process of learning numpy, need to ask one question, how important are numpy data types? would i be using them a lot in the future?
paper niche
I don't think you need to deal with them that often. (I haven't) Numpy sets sensible defaults.
sonic raft
I copied that snippet of code from stackoverflow
d2_train_dataset = train_dataset.reshape((nsamples,nx*ny))```
I've tried it before, but I can't separate the data for each imagewhat do you mean? each image's data is a single row in d2_train_dataset.
 pale thunder
from what image, a clean one or just a random photo with a pokemon
sonic raft
@paper niche I know, that it is, but I can't build this image, for example with matplotlib's imshow.
And If I can't then the AI wont be able to classify it as well.
paper niche
@paper niche I know, that it is, but I can't build this image, for example with matplotlib's imshow.
@sonic raft why not? just reshape it back to(nx,ny)then you'll be able to imshow it already. or am I misunderstanding
plt.imshow(d2_train_dataset[0].reshape(nx, ny))
# plots/imshows the first image in your dataset
No you are not, I was just a bit confused, but I understand now. I just want to build a Logistic Regression model that can classify images.
Thanks!
 obsidian copper
trail cloak
obsidian copper
trail cloak
import numpy as np s = 'Hello World' x = np.frombuffer(s, dtype='S1') print(x)
Traceback (most recent call last): File "C:\Users\user\Desktop\stuffs\.py codex\numpy-tut.py", line 64, in <module> x = np.frombuffer(s, dtype='S1') TypeError: a bytes-like object is required, not 'str'
pale thunder
you want b'Hello World' to get bytes
trail cloak
what's wrong with the code?
im new to numpy and currently learning the numpy.frombuffer
pale thunder
a string is not a sequence of bytes, but text. frombuffer requires a sequence of bytes (well, something that has the buffer interface, e.g. bytes or bytearray)
you can convert between a string and bytes with str.encode
trail cloak
huh, that's funny cus i literally copied the code from the tutorial
pale thunder
it works in python 2. I would suggest finding a more up to date tutorial
trail cloak
oh ok thanks 🙂
ok it works but..
[b'H' b'e' b'l' b'l' b'o' b' ' b'W' b'o' b'r' b'l' b'd']
each letters have 'b' in front of em
import numpy as np s = 'Hello World' x = np.frombuffer(s, dtype='S1') print(x)
@trail cloak i added str = s.encode() between s and x
lapis sequoia
@real wigeon it's not a one size fits all.. there's different tools and sometimes that's how you gotta roll
lapis sequoia
can anyone explain how the third line is swapping rows here ?
arr = np.arange(9).reshape(3,3)
print(arr)
arr[[1, 0, 2], :]
 elfin bough
 ancient chasm
Hey there ! I'm searching for a way to do a 3d physics simulation.
I've just finished one in 2 dimensions with tkinter but I'd like to improve and add a dimension.
Which module can I use to render objects with 3 coordinates ?
pale thunder
Panda3D for example
 jolly island
somone knows something about artificial neural networks?
wide rose
@jolly island there is an AI discord might be able to better help
umbral aspen
Hi guys - I have a multilabel image classification problem that I am working on where I am trying to classify what classes I have in an image from 13 different classes (an image could be multiple classes) and I am having trouble reading the results from the prediction. How can I read this?
Model:
# transfer learning
base_model = tf.keras.applications.vgg19.VGG19(input_shape=(IMG_HEIGHT, IMG_WIDTH, NUM_CHANNELS), include_top=False, weights='imagenet')
base_model.trainable = False
x = base_model.output
x = layers.GlobalAveragePooling2D()(x)
x = layers.Dense(4096, activation='relu')(x)
x = layers.Dense(13, activation='sigmoid')(x)

model = models.Model(inputs=base_model.input, outputs=x)

# compile the model
model.compile(optimizer='adam',
            loss=tf.keras.losses.BinaryCrossentropy(from_logits=False),
            metrics=['accuracy'])
Example result after using predict:
[[9.4322875e-02 1.1413803e-03 2.1812395e-05 8.0683541e-01 4.4710188e-05 5.1057374e-01 3.0441267e-06 3.1798034e-05 5.4394479e-07 6.9495785e-04 1.5783628e-02 2.2164868e-01 7.0765722e-03]]
Would every result be the probablity between 0 and 1 for my 13 classes?
silent swan
That looks right, you're applying a sigmoid over 13 elements
 modest ore
@here hiya gurus, do you guys have any recommendations for a data pipeline tools that is python base?
 sand minnow
Metaflow
 kindred forge
hey all, got a question about numpy. how much faster is numpy actually? i've got a bit of code that deals with a bunch of vectors in R_3, and I'm just using basic python tuples for them
I was under the impression that numpy wouldn't really speed that up all that much because they're not like massive parallelizable arrays or anything
silent swan
much. much faster
the first primary benefit I believe is that your computation is done in basically native C space rather fumbling around python objects and logic
but if you're not doing that much computation it might not matter
kindred forge
but if you're not doing that much computation it might not matter
@silent swan i'm doing about 12 million projections ofa vectorvectors in R_3 onto a plane
silent swan
wouldn't that fall under parallelizable operations then?
kindred forge
i'm... not sure?
silent swan
I'd recommend looking into numpy then
kindred forge
they mostly have to be done in order
(it's for a custom video format, of sorts)
but I can do them in clusters of ~50-200
but, uh, i'm not really sure mathematically how I'd project 50-200 vectors at the same time
wait, i'm silly, projection's a linear function -- so I could just represent them as columns of a matrix
I suppose it does work, thank you!
ripe forge
As you increase the volume of work or data points, numpy really starts kicking the crap out of everything else (if the workload can be vectorized)
Super good, always worth at least trying for your use case for comparison
 flat quest
^^
yeah basically numpy is superior for most cases
 lone tartan
Is there any way to check if your dataset is imbalanced?
lapis sequoia
Hello guys.
It's been a short period that I have started machine learning.
Till now I have learned the Linear and Logistic Regression. Logistic regression is categorical and based on 1 and 0 , but linear predicts based on big or small numbers.
I have a question.
What if I have a data with both categorical and linear(number) inputs ?
What should I do then ?
paper niche
Linear regression is a model for a regression task: predicting continuous target variable (e.g. how much does a house cost based on input features?). Logistic regression is a model for a classification task: predicting discrete target variables (e.g. is the input a dog or a cat? 1 or 0).
Your choice to use one or the other has nothing to do with whether the inputs are categorical or numerical. But rather whether the output is categorical or numerical.
 empty flame
When to go for synthetic imbalance techniques ? The target column classification problem has around 98% 0 value. Do I have to do up-sampling for this data ?
ripe forge
Or downsampling. Or some mix thereof. It really depends on the task too, and how important the minority class is to you.
Also note to use a good metric, don't use accuracy with imbalanced data
lone tartan
Is there a way to use logistic regression on textual features?
 slim fox
what would be a good metric for imbalanced classifcation for you/ @ripe forge
F1 score perhaps?
Is there any way to check if your dataset is imbalanced?
@lone tartan depends on what exactly are you looking for: but in general just compute/visualize your features/target distribution
 shadow quiver
Hello there. After this pandas groupby statement: df.groupby(['A', 'B', 'C'])['id'], how can I pick 2 samples from each group? Any neat way without using loops etc.?
 marble swift
hey guys is there some tutorial where deployment along with UI is taught for machine learning models?
 dry hearth
Is Introduction to Statistical Learning by Gareth James an advanced level statistics book?
I've done some statistics in college but I barely remember any of it
Should I get a easier text?
flat quest
just count the number of classes and find their porportions. Either visualize that distribution or print out the indidividual values.@lone tartan
 desert oar
@dry hearth I wouldn't say it's advanced, but you should probably dig out your old math and stats books for reference
Linear algebra, calculus, probability, and statistics. Those are all prerequisites in some sense
dry hearth
Linear algebra, calculus, probability, and statistics. Those are all prerequisites in some sense
@desert oar thanks..i'll be doing elementary linear algebra by spence, arnold and insel along with introduction to statistical learning
i guess i should go through some easier material for statistics as well
paper niche
Hello there. After this
pandasgroupby statement:df.groupby(['A', 'B', 'C'])['id'], how can I pick 2 samples from each group? Any neat way without using loops etc.?
@shadow quiverdf.groupby(['A', 'B', 'C'])['id'].head(2)
 surreal pendant
how can I give uncertanties for both axes in lmfit? model.fit() only accepts a single "weights" parameter
desert oar
as in, there is some measurement error in both your predictor and target?
what would that model look like in math notation?
surreal pendant
I made some physical measurements of two values and I want to fit one against the other
desert oar
what do you mean "uncertainties"?
surreal pendant
errors
desert oar
as in, you know the amount of measurement error in your data?
surreal pendant
some error estimation, yeah
desert oar
don't you typically need a specialized errors-in-variables model for that kind of thing
i come from a social science background where there's so much error everywhere it's impossible to estimate 😛 so i never tend to use those models in practice, although i really should
you were hoping to put the inverse of the meausurement variance as your weights?
surreal pendant
yeah, but that works if you have errors on one axis
desert oar
right
surreal pendant
you can't just add them up or add their squares, it won't work
desert oar
yeah

In statistics, errors-in-variables models or measurement error models are regression models that account for measurement errors in the independent variables. In contrast, standard regression models assume that those regressors have been measured exactly, or observed without er...
there are a few fitting methods listed on the wikipedia page
i also never saw lmfit, looks like a useful library
ripe forge
F1 score perhaps?
@slim fox F1 is always a safe bet. in some cases, you only want to look at precision of minority class though, if you dont mind a few false positives for example. so, the metric, too, is dictated by the use case, what you're aiming for.
sonic raft
Hi guys! I'm classifying images with LogisticRegression, and it works quite well, though I used only 40 img's 20 for the positive class, and 20 for the negative class.
And I get 0.75 accuracy point for my test dataset, but, i get 8.6, for log-loss, is it acceptable?(because I'm working with images and i have doubts)
 ivory plank
Your log-loss is extremely dependent on your dataset and task, so you're asking a pretty unreasonable question here. It's definitely feasible to have a high loss even after converging, but "high" is a relative term
sonic raft
Thanks, I was looking for just like an answer like that! 🙂
ivory plank
You should do some data analysis, see how your model works, how the error goes down, evaluation metrics, etc. to evaluate your model
desert oar
you can only compare log loss across models with the same number of parameters
lapis sequoia
Does anyone have any recommendations on obtaining user data outside of scraping? I'm wanting to build an RE for skincare products for people with sensitive skin; Id ideally want to cluster users based on their skintype and other metadata, and then try to find data on skincare products and their ingredients and see what can be done, etc. I know this is a loaded question, and I don't have too much domain knowledge in skincare other than having sensitive skin and eczema, but I just can't think of a way to obtain this data. My last thought would be to literally scrape a bunch of Amazon skincare products that are geared towards those with sensitive skin and then move forward from there, but then I'm not too sure how to get associated user data with those reviews. Like I said, I know this is a lot, but any input would be helpful for an entry DS like me; even if it was just a generalized workflow
uncut shadow
well, getting data is often the hardest part. You can of course download some datasets (if there are), do some web scrapping and that's all
unless you want to make a website/app or anything like that which would store all this data from users so you can create your own datasets
but that will be hard
and will require a lot of time
so I assume you don't want to do this
so technically the only way to get data instead of web scrapping and making software is probably downloading datasets
lapis sequoia
I appreciate the reply, and yeah youre right, I dont have the time to do that, or commit the work for it haha. I assumed/feared this would be the case, chasing down somewhat niche datasets is already a task within itself, but seems like ill have to do that
desert oar
consider the ethical and legal repercussions of collecting and holding this data
lapis sequoia
Right, I don't intent to keep any of the data and was hoping that it would be public, but chances are, they're not. Albeit I'm still too junior to get to the point where I've had to consider that, thank you for mentioning it
 rancid dove
How do you use pd.DataFrame.attrs? Its very confusing. Do I have assign specifically in that dict or can I do like df.meta_data_attr = 5? If I do that it doesnt show up in df.attrs
marble swift
anyone here have experience with time series forecasting?
lapis sequoia
Nope, but I'm interested in learning as well.
lapis sequoia
Holy crap, I just learned that today, not sure if I can answer your question but what did you have in mind?
flat quest
yea what kinda time series forecasting?
marble swift
i have trained my model with 6 independent parameters+datetimeindex and i want to predict sixth parameter
the parameter i want to predict is solar radiation
those parmateres kn which i trained model are pressure, temperature,ClearnessIndex, humidity etc.
now i want to know the radiation of let's say 05June2020
what input should i give to model to get radiation on that day?
i am predicting radiation here is correlation matrix
i have already trained the model with lstm
now i want radiation of a particular date
marble swift
does anyone know what does dataframe[-10:] means?
pale thunder
Last 10 entries afaik
marble swift
yup that's it
lapis sequoia
I need help in data mining.
At which stage do I need to perform the following tasks? And how?
1.Association analysis
2.Clustering
Based on my studies, These steps are required.
Here is my tasks list:
 1.Select a dataset
2.Pre-process data
 3.Build and compile a deep learning model
But, Since I am using TensorFlow and keras, I am sure there are steps that I'm not aware of.
Help!
marble swift
@lapis sequoia Haven't done clustering but after loading the data you need to clean it
fill the missing values scale them
find correlation between them
feature selection is important
you should use PCA
it's a very good technique
see normalising as well
 hard yew
Why is Mixnet Algorithm's performance extremely low and slow?
it does not improve close to training accuracy as less than 20%
is this working ?https://github.com/leaderj1001/Mixed-Depthwise-Convolutional-Kernels

GitHub
Implementing MixNet: Mixed Depthwise Convolutional Kernels using Pytorch - leaderj1001/Mixed-Depthwise-Convolutional-Kernels
 cursive hazel
Hi, how do I convert a .so file to .pyd?
 arctic cliff
can someone please tell me how to download files in google colab using pickle?
 fervent bridge
Hmm so placeholder is depricated from TensorFlow v2 whats the alternative ?
 oblique belfry
Not gonna lie...Papermill is a pretty awesome project.
 opal gust
Hi, I know the fundamentals of python, and I know how to use libraries like NumPy and pandas, but I wanted to get into machine learning. Is someone able to give me like the best way or like a step by step method of getting into machine learning
lapis sequoia
Is there a "Machine learning" that uses common language? I realise it's a technical thing. But I pounded my head up against the wall trying to learn TF until I found a tutorial that said a "Tensor" was a "numpy vector."
 sweet flame
Are there packages for brushstroke extraction of oil paintings?
 simple ocean
Is there some kind of standardization for how datasets should be stored or converted to?
sand minnow
Thoughts on OMSCS and OMSA programs from GATECH?
lapis sequoia
Thoughts on OMSCS and OMSA programs from GATECH?
@sand minnow it's a good program
marble swift
Is there a "Machine learning" that uses common language? I realise it's a technical thing. But I pounded my head up against the wall trying to learn TF until I found a tutorial that said a "Tensor" was a "numpy vector."
@lapis sequoia keras,Tensorfloe,Pytorch
fervent bridge
@marble swift Maybe @lapis sequoia means such as NLP?
lapis sequoia
every tutorial I've found is over the top with industry specific jargon, for example "Tensors". If someone had just said "vector" or used linear algebra terms I'm familiar with I would be much further along.
It's like ML went out of the way to invent their own terminology to obscure what is actually going on.
I've finally gotten the gist, it's just @#()* statistics and minimization. Now if there was a straight forward explanation/tutorial with what each of the different things did rather than just throwing stuff at the user, I would appreciate it.
 stray cairn
anyone here that knows f sharp? I can pay for help
fervent bridge
Building neural networks from scratch in Python introduction.
Neural Networks from Scratch book: https://nnfs.io
Playlist for this series: https://www.youtube.com/playlist?list=PLQVvvaa0QuDcjD5BAw2DxE6OF2tius3V3
Python 3 basics: https://pythonprogramming.net/introduction-le...
Is neat
 deep totem
anyone know how/why to normalize data before throwing it into tensor/keras
more so like how to determine the axis within keras.utils.normalize
 merry ridge
A tensor is not industry specific jargon and it is a linear algebra term. Vectors are a simple example of a tensor.
 solid blade
Hi, I know the fundamentals of python, and I know how to use libraries like NumPy and pandas, but I wanted to get into machine learning. Is someone able to give me like the best way or like a step by step method of getting into machine learning
@opal gust Can't say best way but you can now start learning ML alorithm and implement it using numpy that will give you core knowledge of every techniques in ML. Linear regression, Logistic regression, classification etc.
A tensor is not industry specific jargon and it is a linear algebra term. Vectors are a simple example of a tensor.
@merry ridge yeah tensor are bigger version of vector. Muti dimensional.
lapis sequoia
We called those arrays/matricies in engineering. I took a 500 level linear algebra class and I don't think I heard tensor once. Maybe in the CS LA classes. Which is where my problem was. Why not break it down to terms that fit a broader audience?
merry ridge
Tensor is usually introduced at the graduate level
You've probably seem them in linear algebra at the undergraduate level without using the term
It's just a multilinear map taking inputs from both the underlying vector space V and it's corresponding dual V*. It's a common construction when you study linear functionals
That course is too shallow for this material
I'm not familiar with Purdue and their course directory is surprisingly difficult to use. It might be covered in MATH 55400 - Linear Algebra but I'm not sure because the syllabus isn't detailed enough
lapis sequoia
Differential Geometry (MA 562)
Topics:
Tensors and tensor fields on manifolds; exterior algebra, orientation, integration on manifolds, Stokes’ Theorem on manifolds
lapis sequoia
Any insight into why it's under a 'geometry'? I loved geometry but haven't taken it past HS
merry ridge
Have you studied the notion of a basis of a vector space?
I'm not really sure what to say to convince you it makes sense to be under differential geometry without knowing more about your linear algebra level
lapis sequoia
I'm not asking to be convinced, i don't know enough about math to know why it'd be under geometry.
Is there a Math Org Chart with how different branches 'evolved'? I'm a controls/mechatronics engineer so I'm familiar with up through Laplace and stuff. But no advanced geometry.
merry ridge
The basic idea without saying much about linear algebra is that you want to be able to use calculus to do geometry
lapis sequoia
neat.
merry ridge
and tensors are necessary, which should not be a surprise because the derivative is a linear operator and can be rewritten into the language of linear algebra
lapis sequoia
Are there any quick good videos on Tensors? At a high level, I just want to grok the concept. [After realising how much I actually use the proofs behind all my work :)]
merry ridge
I don't know. Honestly, I find them to be kind of frustratingly abstract at the level I originally studied them.
Unless you are going to go into a degree in pure mathematics or physics, you can just think of them as representable by multi dimensional arrays.
Without going into the language of dual spaces etc, a tensor is just a function taking some objects and spitting out a real number
It has helpful properties in the same way that, to use an analogy, e^{x+y} = e^{x}e^{y} is a helpful property that gives it structure. As a consequence of that structure, you can describe the output of these functions by operations such as matrix vector multiplication, and that makes them easier to work with.
ripe forge
I just think of it as simply scalar, vector, tensor. Tensor are higher dimensional matrices. When phrased this way, tensor are essentially a blanket term for all matrices.
You don't really need to know more to start working with tensors when it comes to using the ml libraries.
merry ridge
It is in some ways like a first course in studying differential equations where they brush off why separation of variables works so that the course doesn't veer off into a
half semester long study into differential forms. The notation is designed so that it just "works".
lapis sequoia
you can just think of them as representable by multi dimensional arrays.
I wish someone told me that line 4 years ago. In engineering professors always used scalar, vector, matrix. I don't know if there is a history behind that nomenclature.
merry ridge
I mean, I don't want to get too far from what Darr said and go too abstract
but the key word is "representable"
lapis sequoia
Literally I think that was one of my biggest hurdles was seeing "Tensor" everywhere and not having a clue what it was and people describing it in pure mathematical terms not "Scalar:Vector:Tensor".
Thank you so much.
merry ridge
They are abstract mappings taking inputs and spitting out another output. They have a convenient representation in that you can write them in terms of things like matrices, and by design, our definition of matrix multiplication etc makes everything work
A nice example I used to teach when I was in grad school was to write a certain class of integrals in terms of matrices
And as soon as you can represent something using a matrix, you can use all the tools of linear algebra and then integrate functions by representing them as vectors and doing matrix multiplication
 wild spoke
Hi, I am working on imbalanced dataset problem and using LSTM model, I have done everything described in https://www.tensorflow.org/tutorials/structured_data/imbalanced_data here, but still getting a high number of false positives, TP: 18629 FP: 3272 FN: 43 TN:382, is thier any way to reduce the number of type I error?
 paper niche
sure -- change the threshold for deciding when an instance is considered 'positive' (instead of the default 0.5)
increase p (in the plot_cm() function mentioned in that tensorflow tutorial)
wild spoke
thanks i will try
paper niche
note that this would necessarily mean FN rate will go up. Where to set this threshold is entirely a business decision
real wigeon
I was looking at plotly and pandas, and it looks like you can set plotly as the default plot engine
I'm curious if this impacts the ability to create dashboards with dash
 tough arrow
hey
can someone tell me how to properly install sklearn
I wanted sklearn.eternals.six.StringIO to plot a decision tree
\but I am inable to do so
how do I get that part
uncut shadow
well, the easiest way would be by doing pip install sklearn
paper niche
pip install scikit-learn
uncut shadow
ye
tough arrow
@uncut shadow how?
uncut shadow
what do you mean?
tough arrow
plot a decision tree
my installation is proper
the repo itself no longer contains the files
six is not there
paper niche
uncut shadow
you cannot change it
paper niche
read this: https://scikit-learn.org/stable/modules/tree.html#tree There's an example on plotting a decision tree there.
tough arrow
ah thanks
tough arrow
hey
I also wanna calculate Jaccard_score
I have a 1d np array
(['PAIDOFF' 'COLLECTION'])
there are only 2 kinds of values
KNNJaccard = jaccard_score(y, yhatKNN)
I tried this
c:\users\arnav jindal\appdata\local\programs\python\python38\lib\site-packages\sklearn\metrics\_classification.py in _check_set_wise_labels(y_true, y_pred, average, labels, pos_label)
   1254             if pos_label not in present_labels:
   1255                 if len(present_labels) >= 2:
-> 1256                     raise ValueError("pos_label=%r is not a valid label: "
   1257                                      "%r" % (pos_label, present_labels))
   1258             labels = [pos_label]

ValueError: pos_label=1 is not a valid label: array(['COLLECTION', 'PAIDOFF'], dtype='<U10')```I get this error
please help
I am new to data science and umpy
KNNJaccard = jaccard_score(y, yhatKNN,labels=['COLLECTION', 'PAIDOFF'])```tis also returned the same error
paper niche
I think you need to set the pos_label argument to be one of 'COLLECTION' or 'PAIDOFF'
pos_label (means the label corresponding to the positive class), by default is = 1. But your y and yhatKNN don't contain 1, only 'COLLECTION'/'PAIDOFF'
lapis sequoia
Hey folks, I am Raahul!
I am the GSoC Student Developer for OpenAstronomy this year.
My project is Solar Weather Forecasting using Linear Algebra.
I needed some advice with a certain side project that I want to do over the summer with the Solar Weather Forecasting.
So the basic idea is to make a package for domain specific machine learning and data science.
We already have a pretty awesome library for data analysis.
I don't know how I should proceed with this.
AutoML seems promising, but I have no real exp with it.
Any suggestions would be highly appreciated! 😄
 sterile zenith
are you making a package from scratch or using an existing package to do ML?
lapis sequoia
I plan on using pytorch and skl to do the ML
opal gust
What are the major differences between pytorch and tensorflow, and which one would be better to learn
lapis sequoia
The main idea is to make the lives of solar physicists easier.
For people who don't want to be bogged down with domain specific feature selection and engineering. Or Data Cleaning.
 blazing bridge
I had a path that I was gonna take to learn machine learning and I have a lot of time on my hands. I know numpy and pandas and I am taking the A-Z Udemy course and then I’m after reading Hands on Machine Learning with Scikit Learn, Keras and tensorflow. I also plan to learn any math that is required. https://www.udemy.com/course/machinelearning/. https://www.amazon.ca/Hands-Machine-Learning-Scikit-Learn-TensorFlow/dp/1492032646

Udemy
Learn to create Machine Learning Algorithms in Python and R from two Data Science experts. Code templates included.
These are the two links above
fervent bridge
@blazing bridge is that course any good? it doesn't seem to really dive deep into NN it just covers the algorithms.
blazing bridge
The reviews are great on it and people enjoy. They cover all the algorithms and they have a second course on deep learning
lapis sequoia
The videos are great orientation videos
 solemn terrace
Anyone know of any good free linear algebra? I really need to brush up on my algebra
rain palm
@solemn terrace KhanAcademy.
solemn terrace
I'll go look, thanks
fervent bridge

Dan Fleisch briefly explains some vector and tensor concepts from A Student's Guide to Vectors and Tensors
@lapis sequoia forgot to send you this vid 👀
lapis sequoia
Thanks!
fervent bridge
Honestly though that video is on point, cool dude like his way of teaching. Seems like he enjoys it.
 remote raft
@lapis sequoia Learn programming and statistics
 sacred flare
Any recommended textbook/playlist series for Python libraries like NumPy, Pandas and Matplotlib?
 fierce leaf
How can you get only the value of the evaluated function? thanks
lapis sequoia
@remote raft thanks, do you have suggestion for programming course and statistic
remote raft
@lapis sequoia I know there are plenty online, but I haven't reviewed enough to make a recommendation, sorry
lapis sequoia
@remote raft thanks again
 trim ridge
Is anyone knowledgable of any facebook datasets that atleast contain the user id and account creation date - preferably free. thanks.
 soft dock

MIT OpenCourseWare
6.0002 is the continuation of 6.0001 Introduction to Computer Science and Programming in Python and is intended for students with little or no programming experience. It aims to provide students with an understanding of the role computation can play in solving problems and to ...
@lapis sequoia https://www.kaggle.com/learn/overview
Practical data skills you can apply immediately: that's what you'll learn in these free micro-courses. They're the fastest (and most fun) way to become a data scientist or improve your current skills.
real wigeon
Can someone please show me how to plot a plotly graph, by referencing a pandas df. Everything online seems to be with dictionaries that you manually populate
lapis sequoia
@soft dock thanks
 gleaming falcon
Hi everyone.
As part of a big project that aggregates data from online sources, I'm implementing a deduplication algorithm that looks at descriptions, images and so on from database records. For images I'm using imagehash that uses numpy and it's working fine. But for descriptions I'm currently resorting to comparing each text to every other using levenshtein (precompiled), and I'm getting hundreds of thousands if not millions of comparisons. This takes too long for my purposes and it's not scalable.
Does anyone have some advice on how I could differently approach this? Are there builtin functions from RDBMs (postgres here) I could use to get a similarity map instead?
real wigeon
Have you looked at fuzzy string matching with the fuzzywuzzy library
gleaming falcon
That's what I'm using already
real wigeon
Gotcha, then idk. I'm not as experienced as others
gleaming falcon
I'm trying to look into an ngrams-approach ATM
real wigeon
At the risk of sounding stupid: have you looked into running the matching asynchronously
Or perhaps you need to train a neural network
Idk... you sound like you're ahead of the curb
gleaming falcon
There's still the GIL. Using multiprocessing would be too disruptive to the code flow right now.
This looks promising... https://towardsdatascience.com/fuzzy-matching-at-scale-84f2bfd0c536

Medium
From 3.7 hours to 0.2 seconds. How to perform intelligent string matching in a way that can scale to even the biggest data sets.
real wigeon
Good luck!
gleaming falcon
🤞
lapis sequoia
hello
so you have a dataset, then you seperate one colum that you want to predict
and the other that you predict with
what is that called
you split it into x and y
im new so this might seem like a stupid question
@here
 charred blaze
hey
not a stupid question at all.
At the moment, I'm not recalling a specific name for that procedure.
I think you can just call it splitting the dependent and independent variables.
 spark stag
@lapis sequoia do you mean train-test split? also in future, please do not try to ping @ here as there are a lot of people on the server
spark stag
I assume this is for machine learning/AI, if so you need to have some data to train the model on which is going to predict future values and you put some aside so that you can see at the end if it is very good at predicting on data it has never seen before
Its just a way that we can use to see if our model is overfitting to training data or not and gives us a good idea of how the model would cope with new data in the real world
lapis sequoia
does train test split also train the data?
and what does training the data even mean
spark stag
so when you split the data, you usually give 80-90 % of that data to the model to look at and try to learn patterns, for example if you were trying to make a model to predict if a givern animal was a cat or dog you woud give it several pictures of cats and dogs, then tell it what the image was actually of
then it learns from its mistakes to become better at predicting on the training data which it may see each image several times, then at the end you give it the test data which it has never looked at before in training (so new images of cats and dogs in this example) and then depending on how good it is at classifying these images, you can use this information to use a good estimate for how the model will perform in future
lapis sequoia
so train test split splits the data into train and test, and the training data is used to 'train' the model and the test data is used to check how good the trained model is?
spark stag
yes
lapis sequoia
oh alright, thanks a lot
spark stag
np
 bitter harbor
So I'm currently using mfcc to analyze/compare wav files to find similarities in a Netral network program, but I can't figure out how to set the number of outputs in the array to a constant. Does anyone who's worked with mfcc know how to do that orr is there a better way to do this?
And like I don't want to use google's api or any premade libraries, I'd rather have it open so I can tweak it
 languid tusk
hi all
I am a newbie at python, I would like to know how do I hstack an array onto an already existing array ?
arr = None
for i in range(30):
if arr is None:
arr=np.array([1,2,3])
else:
temp=np.array([4,5,6])
arr=np.concatenate(([arr],[temp]),axis=0)
print(arr)
that's how i tried to solve it, but it just joins the two said arrays. I want them to be separate
bitter harbor
you can use np.zero(3,2) and replace row 1 with your values, and the same for row 2
if you know the size of your array
/matrix
spark stag
@languid tusk instead of python arr=np.concatenate(([arr],[temp]),axis=0) try python arr=np.concatenate([arr, temp],axis=0)
ah nvm, I didnt see you wanted themm seperate, are you wanting the result to be something like python array([[1, 2, 3], [4, 5, 6], ... [4, 5, 6]]) if so you can use np.vstack, it stacks the 2 arrays on top of each other and returns the new array ```python
arr = np.array([1, 2, 3])
temp = np.array([4, 5, 6])
for _ in range(3):
arr = np.vstack([arr, temp])
arr
array([[1, 2, 3],
[4, 5, 6],
[4, 5, 6],
[4, 5, 6]])```
bitter harbor
Actually does that work with unknown lengths of arrays
spark stag
what do you mean by unknown? it will work with any length array as long as all the arrays are the same shape, apart from that they can be any length
@bitter harbor
bitter harbor
ah ok I mean like well a sound file mfcc would return an array depending on specifications and instead of knowing how many values im getting back I've just created a function that runs any amount of data through
Like that way I dont have to compress/cut each sound file into a specific length
languid tusk
sorry I wanted to stack them horizintally
my actual predicament is wanting to hstack an array onto and already existing array
@spark stag
@bitter harbor
bitter harbor
Then np.append() works for that
languid tusk
can I append an array itself ?
bitter harbor
numpy.append(arr, values, axis=None)
That’s from the documentation
And you can change it to append on a different axis, but by default they get flattened
languid tusk
what if i don't want it to get flattened
like say I want to append arrays with 10 rows and 1 column
bitter harbor
I’m kind of new still to this so I don’t know if there’s a more efficient way, but you could run it through a for loop
array1 = np.array('''your value(s)''')
array_l = [array2, array3, ...]
for i in array_l:
  x = 1
  np.append(array_1, i, axis=x)
x += 1```and in your case, the arrays in array_l would just be values
 hard veldt
hi I have a question about normalizing data in machine learning. I know you can normalize class data with one hot encoding (i.e. an array of inputs like ['red', 'blue', 'green'] becomes [[1, 0, 0], [0, 1, 0], [0, 0, 1]]) but why not use ratios of the data like ['red', 'blue', 'green'] becomes [0, 1, 2] becomes [0, 0.5, 1] where you index each element of the class data then divide each element by the max of the indexes (0/2, 1/2, 2/2)?
pale thunder
generally, one hot works better for this, because 'red' is not half of 'blue'
neural networks can deal with things encoded that way, but it does not work as well
bitter harbor
You could use the Rgb decimal code and treat each r,g,b value as a column of a matrix and normalize the values
That’d probably help a bit
 solid spindle
hi, i need a little guidance with a problem i'm facing:
given a network (lets say a road network) i would like to subdivide it into groups, of 5 edges that are connected to one another. Was reading up on networkx library, is that the way to go? can i achieve smtg like this with it?
lapis sequoia
For datascience is there a an argument for using 0-1 floats vs fixed point values? For embedded fixed point is orders of magnitude faster.
Correct me if I'm wrong, but I think that having a limited range of values (0-255, 0-65535) would also assist in preventing overfitting. If the model is poorly scructured it won't converge anyway.
flat quest
@languid tusk
the hstack will generally cause parts of your arrays to be joined rather than remain separate.
Your best bet is to vstack.
languid tusk
i got my code to work, thank you guys
ftr i used hstack
and a second temp variable
empty flame
Which all categorical encoding methods do I need to try for a Regression problem?
lapis sequoia
The first stop for new Kagglers | Getting Started

Medium
Most of the Machine learning algorithms can not handle categorical variables unless they are converted to numerical values and many…
empty flame
Thanks mate
lapis sequoia
LPT when trying to do that sorch of research is google "cheat sheet _______". Someone has likely made one.
It's a lot easier these days now that this stuff has been out 3-4 years and people have been compiling cheatsheets.
"Cheat sheet python data science" has been so much more helpful for getting useful information. I feel like most tutorials are like cooking recipes these days. It's 90% story wrapped around 10% content.
 gritty jay
Hey guys! Beginner here. How can I do DNA fingerprinting using python? I have to iterate through a string and see if a substring repeats itself consecutively. If it does, then +1 to variable count
valid drum
Does the iteration counter in Adam optimizer reset in the beginning of every epoch?
silent swan
generally no
 quick hawk
hi there, would here be the best place to ask help on time optimization related to pandas?
quick hawk
Basically, I'm looking for a faster way to do
test_index = df_race[df_race['horse_name'].values == row2.horse_name], where df_race is a small dataframe (less than 20 lines), and horse_name is a string. I'm iterating a lot on this, so when adding up, it's one of the slowest part of my code right now
(slow according to line_profiler)
quick hawk
a row of df_race
To put some context, I'm loading a big dataframe representing races. Each row corresponds to a starter of a race. df_race is a filtered version of this dataframe, where I just get every starters of a given race
 tawny thorn
and what do you expect as result
quick hawk
I need to set the value of the column elo for each row. I iterate over df_race, get the starter name, get his previous elo which I stored in a dictionnary thanks to this name, and I need to set the elo value on the current row
if that makes sense
paper niche
can u show us df_race.head()?
hard veldt
hey so I was training my basic neural network with 9 inputs that are all between 0-1.
In the end I get an output of 0 or 1 using my sigmoid activation function. It works properly right now after I train it as my neural net outputs match my desired outputs. The weird thing is, it only takes 2 epochs to get to greater than 0.999+ accuracy. This is my error history I plotted:
This is the code for training it:
np.random.seed(1)
weights = 2 * np.random.random((9,1)) - 1
error_history = []
epochs = 1000
training_rate = 0.00001

for i in range(epochs):
    output_layer = sigmoid(np.dot(training_inputs, weights))

    error = training_outputs - output_layer
    abs_error = np.average(np.abs(error))
    error_history.append(abs_error)

    delta = error * sigmoid_dv(output_layer)

    adjustments = np.dot(training_inputs.T, delta)

    weights = weights + adjustments
I have over 300,000 pieces of training data but I am only using 1,000
Can someone give me some insight as to why this is happening?
flat quest
can i see ur training data
flat quest
yeah sure
or just send me a snapshot of the data
 arctic wedgeBOT
Hey @hard veldt!
It looks like you tried to attach file type(s) that we do not allow (.csv). We currently allow the following file types: .3gp, .3g2, .avi, .bmp, .gif, .h264, .jpg, .jpeg, .m4v, .mkv, .mov, .mp4, .mpeg, .mpg, .png, .tiff, .wmv, .svg, .psd, .ai, .aep, .xcf, .mp3, .wav, .ogg.
Feel free to ask in #community-meta if you think this is a mistake.
flat quest
and are u pulling this data from somewhere or generating it?
flat quest
okay
and do you get the same error graph when u run ur model again?
flat quest
hm
flat quest
it might be its just learning really fast
try using a low learning rate and actually use it in your calculations
so weights = weights + rate * adjustments
flat quest
what training_rate are u using rn? 0.00001?
hard veldt
I was (forgot to implement in code tho)
then I used 0.001
this is what I got
this is 0.01
flat quest
yeah generally anywhere from 0.01 to 0.001 is a good learning rate for most problems
i think its just that for this dataset the relationship between the inputs and outputs is very strong and noncomplex
to test that -> try making a test dataset and calculuate your error on that test dataset
see if the model actually does well on test values as well
hard veldt
got it!
okay I will make a test dataset
but how do I know what the outputs should be for a test dataset?
flat quest
well use a portion of your training dataset and set it apart as the test dataset.
then just compare the outputs from that portion with the results from your model
hard veldt
got itttt
okay
also follow up question
how come the number of weights by the end of training is equal to (number_of_inputs) * (number_of_data)
like I said I am using 1000 rows of data
and each row has 9 inputs
and when I finish training and save my weights to a csv
I get 9000 weights
hard veldt
yeah! I thought I should have 9 weights too
my adjustments are a different shape than my weights though
is that why?
flat quest
ah gotcha
yeah so basically your output layer then would be a 1000 by 9
so what you have to do is basically average the error across your batch
hard veldt
ohh rlly?
flat quest
you don't calculuate the error for each element in your batch, you would average it.
So for each input since there's 1000 rows, you have to average those 1000 row errors for that input and then u'll have a 1 by 9 row of average errors
yeah
cause otherwise we're trying to update weights with far more adjustements than there are weights
and we want the same weight to be used for each row of input
not different weights
hard veldt
but it make it an actual model, right
because right now I have 9000 weights
with only 9 inputs
hard veldt
okay!
flat quest
alright
just tested to make sure
it should be this
np.average(data, axis=0)
so basically ur averaging on the first axis (aka the axis along the rows)
hard veldt
yes
error = np.average((training_outputs - output_layer),0)
actually
the shape prints as
(1000,)
whats the shape of training_outputs - output_layer?
hard veldt
I believe it is python (1000,1000)
flat quest
ah okay
shape for output_layer should be (1000, 1) and shape for training_outputs is also (1000, 1)
thus error should be (1000, 1)
Can u check that?
hard veldt
yes
#output_layer
(1000, 1000)
#training_outputs
(1000,)
I think they are different than expected
because the weights change those shapes
I will check the shapes at the 0th iteration
okay the shapes to start are
#output_layer
(1000, 1)
#training_outputs
(1000,)
okay 1000,1 is expected
flat quest
aight it works?
flat quest
does the avging work?
hard veldt
hrm
okay without averaging
it has a shape of (1000, 1)
with averaging the shape is (1,)
flat quest
yeah so now you can update the weights using that single average error value
then ur weights should remain 9 throughout training
flat quest
lol np. Anytime.
But just a heads up, generally we would update each input individually rather than using the same adjustement for each weight.
For that we need to do gradients
hard veldt
oh really?
flat quest
yeah
hard veldt
oh yeah
don't you update the wweight
proportional to how much it contributed
so like weight * error
flat quest
some tutorials say that, but that's really a surface level understanding of ml.
The actual way we update is not by porportion but based on the gradient of the error function with respect to the weight. Basically we're looking for the weight value that corresponds with the local minimum (or minimum error) for that weight.
To do that we have to use calculus and gradients (or tangents in 2d space). The negative tangent or gradient will always point towards the local minimum, so we use that for updating.
hard veldt
can you explain further?
I know calculus
I also know a little but about gradient descent
also isn't that somewhat what I am doing here?
because I am using the derivative of the sigmoid
to adjust the weights
delta = error * sigmoid_dv(output_layer)
def sigmoid_dv(y):
    return y * (1-y)
you are
but ur not using the partial derivative
normally a function would look like f = 2x + 3 in a 2d space
in this case f' = 2. This is known as f prime or the total derivative of f.
flat quest
in the case of a multivariate function such as f = 4x + 3y + 8z + 7 we can't really calculate the total derivative (f`) easily. If we could we could just update all the weights at once.
Instead we find the partial derivative of f with respect to x, y, z
To find the partial derivative we use f(x, y=c, z=c) essentially setting y and z to constants and finding df/dx.
calculating the partial derivatives gives us 4, 3, 8
if you look at this graph
when we have a positive tangent
the local minima is to the negative direction
since we calculate the tangent in the positive direction and it was positive. Thus the other direction is negative.
Likewise when the tangent in the positive direction is negative (left side of graph) -> the positive direction is where the local minima is.
This is why we do -(gradient)
if gradient is negative we move in that direction (towards minima), if it is positive (i.e. we're moving to a larger value -> we go backwards towards the minima).
Essentially these partial derivatives act like this graph since we have 1 independent variable (x), and response variable (y - cost). Thus if we update our weight by (alpha * gradient), we will move all of our weights closer to a value that would be our local minima.
When we update all of our weights individually by their gradient -> mathematically it is pretty much the same as getting the total derivative and updating all the weights at once.
idk if that made any sense :/
hard veldt
@flat quest Sorry! I was afk!
ohhhhhh
hrm I kind of get it
I understand how it gets hard when you move up dimensions
cause your gradient turns from a tangent to a plane right ?
or does it turn into a vector of tangents, 1 for each weight?
what is alpha?
trim ridge
Can anyone point me in the right direction to Recommender systems based around the frequency to which someone views a categorised item such as Products?
flat quest
alpha is also known as the learning rate @hard veldt
yeah its a plane for a 3d space
and its 3d in a 4d space
bitter harbor
So I'm trying to normalize a fft function between -1 and 1, anyone know if this is possible with complex numbers, or if there's a better function for doing this?
empty flame
I'm try to predict the price of used cars . Here price is the target variable and its is in log scale. The dataset size is around 300k x 12 . I got a RMSE value of 0.35 . Is it good ?
 stable forum
plot_title=element_text(ha='right', margin={'b': '50'}
Does not like the bottom 'b'.
lapis sequoia
Is it possible to implement Recursive Feature Elimination on KNN algorithm?
desert oar
@empty flame what are the units? it's "good" if it's good for your application - there's no absolute "good" and "bad"
empty flame
Price was in dollars...but I have done log transformation for tht column
desert oar
@empty flame https://medium.com/analytics-vidhya/root-mean-square-log-error-rmse-vs-rmlse-935c6cc1802a
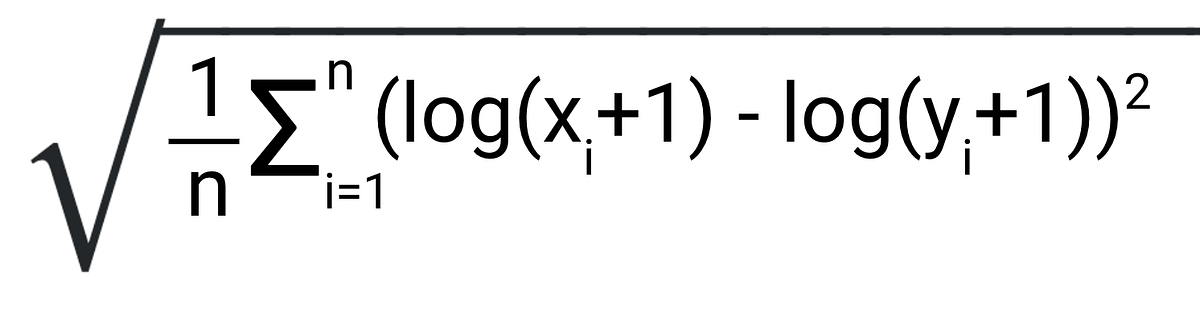

Cross Validated
I want to predict the duration a trip would take. For this I transformed my dependent variable (trip time in sec) to log transformed.
When I do regression on this variable with some other features...
lapis sequoia
if im scraping 1000s of tweets for analysis through tweepy should i write them to a json or csv
pale thunder
I would say sqlite3 for easy data access
 frigid turtle
how can i make a 3d graph
ValueError: shape mismatch: objects cannot be broadcast to a single shape
 jolly briar
@frigid turtle that's pretty vague
@frigid turtle that's pretty vague
Usually it's something along the lines of having an unequal amount of X y values (for 2d at least)
frigid turtle
do you want to see my code
im doing collatz conj and i want to display the list's with matplotlib
from matplotlib import pyplot as plt
from mpl_toolkits.mplot3d import Axes3D
import numpy as np

datax = []
input_num = int(input("Choose a number: "))
random_num = np.random.randint(100)
fig = plt.figure()
ax1 = fig.add_subplot(111, projection="3d")


def collatz_conj(input_num):
    if input_num == 1:
        return 1
    if input_num % 2 == 1:
        result = input_num * 3 + 1
    else:
        result = input_num / 2
    datax.append(result)
    # print(datax)
    # print(result)

    collatz_conj(result)


collatz_conj(input_num)
# print(datax)
########DATA#######################
datay = datax[: len(datax) // 2]
dataz = datax[: len(datax) // 2 * random_num]
print(datax)
print(datay)
print(dataz)
# datax2 = np.random.randint(2, size=10)
# datay2 = np.random.randint(2, size=10)
# dataz2 = np.random.randint(2, size=10)

###############Plotting
ax1.plot_wireframe(datax, datay, dataz)
ax1.setxlabel("x axis")
ax1.setylabel("x axis")
ax1.setzlabel("x axis")
# plt.plot(datax, linewidth=3, label="Result")
plt.show()
it says AttributeError: 'list' object has no attribute 'ndim'
frigid turtle
does all the data have to be the same?
 pulsar sluice
Boys, is it possible to write an programm that will execute a command (pressing left click) when it hears a specific sound? I'm new into phyton
uncut shadow
well kinda
- You will need a good microphone (or stuff you are going to use to get this sound)
- If it's just some random sound then you technically won't need this, but if you want speech recognition then you will need to use Machine Learning (actually, the Deep Learning)
Still
if you are new to python then I don't think that's a good project for a beginner tho
(if you want to use machine learning)
pulsar sluice
i wan't to put a mp3 file of that sound and if that programm hears that sound in a game for example it will press left click and shoot
uncut shadow
well
pulsar sluice
if you are new to python then I don't think that's a good project for a beginner tho
@uncut shadow ok, than maybe I will go to something different 😄
 misty mirage
Hello, I have a few questions about GloVe and whether it could be meaningfully applied to a project that I am working on.
I am under the impression that GloVe performs the same task that the Vectorizers in sklearn do, but with much more nuance and complexity such that the resulting feature matrix contains additional information on top of the list of features such as the relationship between features ect.
pulsar sluice
I didn't found something like this on the internet so I need to program it myself 🙂
 steel roost
with open(file) as df:
    reader = pd.read_excel('/home/doomedapple7565/Documents/Python/Output_of_scripts/provider_mapping.xlsx',dtype={'NPI':str})
    npi_list = reader['NPI']
    scheduling_name = reader['Scheduling Name']
    first_name = reader['First']
    last_name = reader['Last']
    type_of_provider = reader['Type']
    for row in reader:
        print(row[npi])
can someone explain why print npi_list shows my data, but i can do it by row?
for each row, i want to print the scheduling name, then the npi number
uncut shadow
well
you are looping through reader, not npi_list tho
so you should do
for row in npi_list:
  print(row)
idk what this row stores but I'll assume it's some float so it would look like this
So just a visualization, it takes out this NIP collumnt and prints every row's value from this collumn (in this example, it's just float)
It loops through rows and prints them.
    NPI
    1.12
    2.41
    4.13
    1.56
    1.46
I have an issue. is it okay if I ask in here?
steel roost
thanks, i didnt realize i was looping through the wrong list
lapis sequoia
I have a problem with strptime() function that I am stumped on
lapis sequoia
wait sorry i misintrupted the issue
uncut shadow
Ok
lapis sequoia
ok here we go
so
This is my parse_date function: def parse_date(date): if date == '': return None else: return dt.strptime(date, '%Y-%m-%d')
I am trying to loop through these but the cancel_date isnt working: for enrollment in enrollments: enrollment['cancel_date'] = parse_date(enrollment['cancel_date']) enrollment['days_to_cancel'] = parse_maybe_int(enrollment['days_to_cancel']) enrollment['is_canceled'] = enrollment['is_canceled'] == 'True' enrollment['is_udacity'] = enrollment['is_udacity'] == 'True' # for the two above we check if the value is = to the string True # so this will return the Boolean true is the string is True # if not then it is False enrollment['join_date'] = parse_date(enrollment['join_date'])
Here is my error: TypeError: strptime() argument 1 must be str, not datetime.datetime
here is the output of my CSV file after reading it in though OrderedDict([('account_key', '448'), ('status', 'canceled'), ('join_date', '2014-11-10'), ('cancel_date', '2015-01-14'), ('days_to_cancel', '65'), ('is_udacity', 'True'), ('is_canceled', 'True')])
I dont get it since cancel_date is a string???? ('2015-01-14')
uncut shadow
so first you should do is to check the types of both "strings" with type()
lapis sequoia
ahh okay so enrollment['cancel_date'] is datetime.datetime and not a str intresting
type(enrollment['cancel_date']) told me that
lapis sequoia
okay yeah I guess the course I am taking must be old then
uncut shadow
yeah, maybe it is
idk if this is just some dummy data or some real data. If it's the second one, then yeah, it might change over time and the course is still the same
lapis sequoia
dummy data
 novel sinew
Hey, guys. If you ever wanted to try IRIS Data Platform, which is great ML, you can now use Jupyter Notebooks :)
It also has a native api for python
https://community.intersystems.com/post/how-i-added-objectscript-jupyter-notebooks

InterSystems Developer Community
Jupyter Notebook is an interactive environment consisting of cells that allow executing code in a great number of different markup and programming languages.
To do this Jupy
charred blaze
@pulsar sluice if it's a specific sound, you don't need machine learning. Regular signal processing will suffice.
rancid dove
Hi I'm relatively new to Python. Less than a year of experience under my belt. I was hoping to get some insight on the practicality of what I want to do.
I've been reading up a lot on Pandas Extension Arrays and Extension Dtypes. I have an application where it would be very beneficial to be able to store a numpy structure array inside a pandas dataframe. What is want is for each element of a dataframe to be a numpy structure array with a couple fields. I would to be able to index into the dataframe through the usual methods but then access into the fields of the structure array using dot access.
To give an idea
In [85]: import numpy as np

In [86]: x = np.array([('Rex', 9, 81.0)],
    ...: ...              dtype=[('name', 'U10'), ('age', 'i4'), ('weight', 'f4')])

In [87]: y = np.array([('Fido', 3, 27.)],
    ...:       dtype=[('name', '<U10'), ('age', '<i4'), ('weight', '<f4')])

In [88]: import pandas as pd

In [90]: df = pd.DataFrame([[x,y],[x,y]], index=[0,1], columns = ['A','B'])

In [91]: df
Out[91]:
                  A                  B
0  [[Rex, 9, 81.0]]  [[Fido, 3, 27.0]]
1  [[Rex, 9, 81.0]]  [[Fido, 3, 27.0]]
I would then like to be able to do say df['A']['name'] = 'BOB' and it would result in
Out[92]:
                  A                  B
0  [[BOB, 9, 81.0]]  [[Fido, 3, 27.0]]
1  [[BOB, 9, 81.0]]  [[Fido, 3, 27.0]]
Would this be even remotely possible with Extension Arrays? I want to learn, but also want to make sure my goal is obtainable so I don't spin my wheels.
I must ask either completely stupid questions or really hard ones because I never get freaking replies lol
lapis sequoia
@rancid dove Tbh I don't have any experience with dataframes, hope someone else has
paper niche
technically in this specific example, since both rows in A point to the same x in memory, a df.loc[0, 'A']['name'] = 'Bob' would change both Rex to Bob. But I suppose you're hoping it would change all names of different arrays under col 'A' to be changed to Bob?
the trouble here is, df['A'] is a pandas Series. A bracketed getitem call for a Series already does something well-defined. You want to overwrite this behavior?
rancid dove
Yes I would like it to change all different arrays under col 'A'. Override it or be able to just access past that.
paper niche
honestly i'm not sure a pandas dataframe is the right datastructure for this. what pandas functionality are you hoping to utilize by trying to stick numpy arrays into pandas dataframes?
why not just store the whole thing as a numpy array? pandas is just a wrapper around numpy arrays anyway
rancid dove
I'm trying to automate the formatting of tables into excel using Openpyxl
I'd have some dataframe df and then co dataframes of all the styling to apply to each cell. So like background_color_df which is the same size and shape as df but each element of background_color_df will hold the keyword arguments and values (this is what the nump structure array would be for, or maybe a dictionary) for the background color method of openpyxl.
I know pandas has built in styling that can do this, but it is somewhat limited and not enough for what my company wants.
It only supports a small subset of features that cross over with CSS 2.2
paper niche
How many unique stylings are you expecting to have?
rancid dove
I mean just borders alone
theres dozens of options
I mean just borders alone you have width, style, color and each those have well over 5 choices
It might NOT be alot but, if I could provide the whole thing that would be best.
paper niche
hmm okay. I'm out of my depths here, but I imagine trying to overwrite a basic functionality (getitem/setitem) of Series might not be trivial.. basically a df['col'] = 2 is an operation that broadcasts the integer 2 into the series, you'ld need a way to hook into that (I'm not even sure broadcasting is possible in this manner? you might just end up having to do a for loop in the end)
rancid dove
Thanks for you time 🙂
steel roost
Hi everyone, looking for advice. I have an excel spreadsheet, only 1 page though. but i need to print every row as a separate list. or a way of combining each column into a list per row. Any ideas?
i tried seeing ig i could set an enumerate and if it equaled a particular index number for each list, print the data of that index from each list
import selenium
from selenium import webdriver
import pandas as pd

file = '/home/doomedapple7565/Documents/Python/Output_of_scripts/provider_mapping.xlsx'


#npi_list = reader['NPI']
#scheduling_name = reader['Scheduling Name']
#first_name = reader['First']
#last_name = reader['Last']
#type_of_provider = reader['Type']

df = pd.read_excel(file, header=None)
#print(df)
npi_column = list(df[5])
scheduling_name_column = list(df[4])
first_name_column = list(df[3])
last_name_column = list(df[2])
entity_type_column = list(df[1])
type_column = list(df[0])

index = range(1,202)
for i in index:
    if enumerate(npi_column)==i:
        print(i)
    else:
        print('Fail')
but it just fails.
steel roost
nevermind, i got it.
import selenium
from selenium import webdriver
import csv

path = '/home/doomedapple7565/Documents/Python/Output_of_scripts/provider.csv'
file=open(path,newline='')

reader = csv.reader(file)
header = next(reader)
data =[]

for row in reader:
    first_name = row[5]
    last_name = row[4]
    sched_name = row[8]
    npi_number = row[-1]
    start_date = '02/02/17'
    data.append([first_name, last_name, sched_name, npi_number, start_date])

print(data)
 supple minnow
Does anyone know how to aggregate more than three rules with scikit?
I'm using fuzzy logic
desert oar
@supple minnow scikit-learn? i didnt know they had a fuzzy logic implementation. can you give an example of what you're doing?
desert oar
what is scikit fuzzy?
oh this isnt scikit-learn
completely different library https://github.com/scikit-fuzzy/scikit-fuzzy

GitHub
Fuzzy Logic SciKit (Toolkit for SciPy). Contribute to scikit-fuzzy/scikit-fuzzy development by creating an account on GitHub.