#data-science-and-ml
1 messages · Page 222 of 1
 raw rapids
but u dont know
 lapis sequoia
Yeah im not too sure
lapis sequoia
oh
It will be hard to find one if there arent maybe
many*
and if there arent many it may be a small server with a couple hundred
 tired copper
 oblique belfry
Any thoughts on how you would implement machine learning and video streams? I am trying to run AI on different video streams and I am trying to think of the best way to present predictions to the end user. I am thinking I would need to incorporate different techniques from event sourcing.
 worldly elm
hey everyone, I am trying to train a transformer language model on wikitext2 using 6 layers, 12 attention heads and seq lenght 64
I know the papers usually report seq lenghts in the order of 512,but I can only dream that many GPUs, that being said, convergence to a low enough perplexity can be expected in less than 100 epochs?
I am using a steplr optimizer, starting from a lr of 6.8
 noble gyro
well if i understand it (probably i dont) databases u store data in them right? And data science is just using it
in ml or some analysis
 jolly briar
@noble gyro i don't understand how that seems to be similar to you
noble gyro
i said something wrong?
jolly briar
@noble gyro data-science is typically analysing data, databases are storing it efficiently and designing the storage of it
noble gyro
maybe its just connected like someone who is doing data science probably knows databases
jolly briar
they likely have to interact with them, but they might not know about design etc
a data engineer would be more likely to understand databases
jolly briar
i think it makes sense to do something within one first
noble gyro
'within one' means?
 spark stag
have a go at both and experiment to see which field you like
jolly briar
@noble gyro i mean do them, see what you like
 slim elm
hello, I am using sqlite3 to execute a query, I am running into an issue where I am not sure how to create a parameter around a datetime column to only execute items within that date range.
 arctic wedgeBOT
Hey @slim elm!
It looks like you tried to attach a Python file - please use a code-pasting service such as https://paste.pythondiscord.com
 dull turtle
hi huyz i am having my image recognition model.
I have used passport images & liscence images
I want that my model should identify that if user provides different image than passport & liscence image
Then model should identify that it is wrong image or different than provided categories.
How i tell my model that to identify it is wrong image
lapis sequoia
How to get started in data science ?
 uncut shadow
that is the question
 echo tendon
@echo tendon
samplecan be usefuldf.sample(5, random_state = 1)for example, if the top/tail of the dataframe aren't very representative
@jolly briar thank you, you have helped me so much!
exactly what I was looking for 😄
 twilit imp
hey so I am trying to create a neural net from scratch
and got into some problems when implementing the softmax functions
so here are some questions
do I have to use a softmax function in my neural network and why?
when using the softmax function, do I have still multiply the hidden neurons to the weights?
is just calculating the softmax from my hidden layer enough?
uncut shadow
umm
softmax is used mostly in the output layer when you want to perform multi-class classification
so I don't think you should use it in hidden layer
but I might be wrong
twilit imp
no I dont use it inside my hidden layer
I calculate the softmax from my hidden layer to my output layer
but I had weights and biases assigned between hidden and output layer
wait @uncut shadow do you know a little about neural networks?
uncut shadow
ye
so you calculate the output for the output layer
and apply softmax function
and the output for the output layer will be wx + b where w are weights and b is bias
if this is Dense layer
twilit imp
alright ive another question
so I am working on this "project" of mine where I am trying to learn a simple neural network to get to the apple, where I have two input neurons those tell the network if the distance to apple x is negative or positive and distance of apple y is negative or positive
I have one hidden layer where I multiply weights and biases to the input layers there are 8 hidden neurons
and 4 output neurons for the player movement: x, -x, y, -y
I am using a genetic algorithm where I pick every time the closest player to the apple and mutate his weights and biases
but for some reason after mutating weights nothing happens
all the players behave the same
!paste
this is the code I have so far
 lapis ice
Question regarding DCGAN/GAN's and datasets.
Can you manipulate your own dataset to increase the training data amount? For example, take the image, invert it.
 agile shale
Im beginner in datascience, pls i need init in this
noble gyro
Hmm guys okay i am using pandas and is there a way to visualate data without going to jypiter notebook site
 graceful ice
 vital sphinx
Hmm guys okay i am using pandas and is there a way to visualate data without going to jypiter notebook site
@noble gyro not sure, I understand the question. can't you just print the dataframe in whatever IDE you're using?
noble gyro
yes i can, i mean to make it like a graph @vital sphinx
vital sphinx
@noble gyro have you tried using the matplotlib library?
noble gyro
hmm i didnt, it allows data visualization?
jolly briar
@noble gyro yes it's a visualisation library
 drowsy ibex
What are some datasets related to Covid-19? Can someone make a recommendation or two for getting started in DS?
 royal lodge
Hi guys, pandas question. I dont understand the behavior or pandas.datetime today vs now
pd.to_datetime('today', utc=True)
Timestamp('2020-04-28 11:06:51.310959+0000', tz='UTC')
pd.to_datetime('now', utc=True)
Timestamp('2020-04-28 03:06:54.922901+0000', tz='UTC')
why is it different
 polar acorn
Seems pd.to_datetime("today") ignores the utc argument and returns local time. Why though? Not sure.
 thin kindle
Hello guys, does someone know a website that store covid datas in JSON format
 slim fox

View our growing list of novel coronavirus (COVID-19) API collections to help fight this pandemic. And learn how to use our blueprints for quickly deploying new APIs from existing data sets.
you can start here
thin kindle
Thx 🙏
jolly briar
@thin kindle if you want json and have csv then pd.read_csv(<url to raw csv>).to_json() might be useful... there might be a nicer way to do that though.
oblique belfry
Does anyone know if compiling OpenCV from scatch gives performance boosts?
 buoyant trout
maybe, if there are instruction set extensions that are disabled in the default binary and your CPU support those extensions.
thin kindle
Thx for the advice @rie
 hardy harness
In neural nets, do you apply dropout regularisation both in the forward and the backward pass?
If so, do you want to have the same masks for the layers in both passes?
buoyant trout
masks as in what nodes gets dropped?
hardy harness
yes
buoyant trout
yeah they are the same
in fact dropouts are applied to a layer, and you don't even specify which "direction"
at least for frameworks like keras or tf
hardy harness
I'm implementing a ffnn
and it's kinda weird as in we aren't using classes
so the network is defined by a dictionary of weights
which are in the dimensions needed to go from one layer to the next
buoyant trout
Ahh can’t help you there my experience with neural nets are limited to that one class I took in college. Sorry buddy.
hardy harness
heh no worries
any case, my weights look like this
so I guess I'd 0 some weights as a dropout?
buoyant trout
yeah but after one batch you want to restore them to the original values
the nodes only have weights and no bias right
hardy harness
yeap
we're not using biases for simplicity
def forward_pass(x, W, dropout_rate=0.2):
    out_vals = {}
    h_vecs = []
    a_vecs = []
    dropout_vecs = []

    #embedding lookup
    h0 = np.add.reduce(W[0][x,:],axis=0)
    a0 = relu(h0)
    h_vecs.append(h0)
    a_vecs.append(a0)

    for k in range(1,len(W)):
        h = np.dot(a_vecs[k-1],W[k])
        #don't calculate relu or store h,a for output layer
        if k+1 != len(W):
            a = relu(h)
            h_vecs.append(h)
            a_vecs.append(a)

        dropout = dropout_mask(W[k].shape[0],dropout_rate)
        dropout_vecs.append(dropout)

    out_vals = {
        'h':h_vecs,
        'a':a_vecs,
        'dropout_vec':dropout_vecs,
        'y': softmax(h)
    }

    return out_vals
this is my forward pass. I'm not sure how to use dropout tbh
buoyant trout
here chapter 4 talks about how to actually do it
but i'm too stupid to understand it, hope it helps tho
hardy harness
thank you for spending the time! I will look into it
 simple ocean
So all the various things I've read about (deep) neural networks seem to say that to calculate a neurons value you should take the sum of the previous neurons multiplied by the weights linking them to your selected neuron. Is there any use of taking the average of these values instead?
spark stag
you possibly could, it just means all your inputs to future layers would be however many inputs that neuron has times less than it would overwise be, but it may just lead the network to increase the weights and biases by that scale too, idk i'm no expert just speculating
simple ocean
Seems likely. I guess it might be affected by the activation function as well... using sigmoid for example I was wondering about how large networks dealt with the huge sensitivity of the neuron, because even a tiny change in the input would change the sigmoid if it was close to 0. So if we had 1000 input weights and all of them were 0 except for one, which was set to say, 5, then given the previous neuron was high value enough it would completely change the output of the neuron. That's really what I'm confused by
 turbid hearth
Are there any courses online for me to learn scipy and numpy?
 robust dome
hey guys can anyone help me understand this:
def PatternCount(Text, Pattern):
count = 0
for i in range(len(Text)-len(Pattern)+1):
  if Text[i:i+len(Pattern)] == Pattern:
    count = count+1
return count
print(PatternCount("GCGCG","GCG" ))
it returns 2
uncut shadow
@robust dome it tells you exactly how many times GCG occured in this text
also, I assume it's some DNA, right?
 wispy cradle
I have a tensorflow question if there are any experts here
uncut shadow
@wispy cradle it will be better to ask a question and if somebody knows the answer he/she can easily answer it
wispy cradle
Does anybody know if its possible to add extra text data to a tensorflow object detection bounding box? For example, adding a count of how many objects of that class in the image, to the bounding box.
robust dome
yes it is. @uncut shadow. I know that it does that but what confuses me the for loop part of the function, I jeep looking at it and I can't wrap my head around it
uncut shadow
@turbid hearth there is a numpy course on Udemy altough I don't think it's worth, you can always learn how to use it for free just using some cheat sheats and stuff
@robust dome so, this loop basically iterates through the text and checks if there is a pattern. Let's say that you look for GCG pattern in GCGCG.
It works like that:
- It chooses the first letter (
Gin this text). - it checks if
Gand next few letters together make this pattern (so it'sG+ next 2 letters which will together makeGCG) - It checks if together they make the pattern you specified so (in this first loop it checks if
GCG==GCGwhich is true)
for i in range(len(Text)-len(Pattern)+1):
if Text[i:i+len(Pattern)] == Pattern:
count = count+1
in your example, it returns 2 because it found GCG 2 times in your text
turbid hearth
@robust dome is that from the UCSD bioinformatics course on coursera?
uncut shadow
O.o
turbid hearth
witcher by cheat sheets do u mean the official documentation of the specific python libraries?
robust dome
@turbid hearth yeah it is
uncut shadow
well, docs are great too but I meant things like for example this
https://s3.amazonaws.com/assets.datacamp.com/blog_assets/Numpy_Python_Cheat_Sheet.pdf
turbid hearth
oh thanks
uncut shadow
but you can google "numpy cheat sheet" and you will find many more
or for example here https://www.dataquest.io/blog/numpy-cheat-sheet/
Download a free NumPy Cheatsheet to help you work with data in Python. Includes importing, exporting, filtering, sorting, scalar and vector maths and more.
robust dome
@uncut shadow ah okay I think I get it now. Thank you so much man
uncut shadow
👍
 serene scaffold
I'm taking a look at this word embedding implementation: https://towardsdatascience.com/an-implementation-guide-to-word2vec-using-numpy-and-google-sheets-13445eebd281

Medium
Word2Vec is touted as one of the biggest recent breakthrough in the field of Natural Language Processing. The concept is simple, elegant…
their code transposes some matrices, but the text explaining what's going on doesn't actually acknowledge this, so I think it might have been a mistake.
 eternal sentinel
i need help with my homework. i'm suppose to write an implementation of a confusion matrix but i have no clue how to
lapis sequoia
hey is there a course that teaches me ML and math needed for ML (I have a good basics but not sure all the basics I need)
serene scaffold
@eternal sentinel do you understand what a confusion matrix is?
eternal sentinel
i get it
serene scaffold
great
eternal sentinel
but how do you make it from scratch
serene scaffold
you can use a dictionary
I would do this as a dictionary of tuples
so that the dictionary is flat
eternal sentinel
do you have any reference you could pointme to
eternal sentinel
regurlar 1D arrays
hardy harness
noob question: in neural nets, does the size of each hidden layer have to be the same? meaning the amount of neurons
 feral helm
Is asking for help with a school assignment not allowed on this server
 sterile zenith
@hardy harness no, in fact, varying the number of neurons between layers is what helps neural nets choose the right features to pay attention to that give accurate predictions
hardy harness
@sterile zenith huh, interesting. So both the layers and their sizes are hyperparameters then
sterile zenith
I don't know what a hyperparameter is, but yeah, those are both variables
I remember seeing a website where you can play around with the # of layers and their size, let me see if I can find it
hardy harness
well, variables that require tuning to get optimal performance from the nn
sterile zenith

Tinker with a real neural network right here in your browser.
hardy harness
you wouldn't happen to be able to help with implementing dropout regularization, would you?
wow that's nice, thanks!
sterile zenith
nope, can't help with that, sorry
hardy harness
cool, cheers!
 opaque crest
I'm trying to import tkinter or Turtle, but it says I don't have tkinter. I'm trying to do pip instal tkinter but it can't find it, can anyone help me plz?
?
 late jackal
trying here again but im hoping someone here has some familiarity with the Kmeans algorithm
sterile zenith
I think I can help with that, though it’s been a while, could you remind me of it?
lapis sequoia
Anyone know of an API's, or barring that scrape friendly sites, with relatively accurate and as up to date as possible data for the labor market? Looking for things like projected shortages and surpluses, pay scales for different fields in different locations, and basically any other bits of data I can get. Ideally worldwide, but the US is my target so just that is fine as well.
 rough tapir
Am not sure if my problem relates to data science
Am kinda new ;/
Has anyone heard of glowscript?
late jackal
@sterile zenith it all of the sudden worked but i still have to do some heiarchical clustering and DBSCAN so maybe ill ping you then 😹
eww why is it a cat
sterile zenith
lol 👍 good luck
opaque crest
How can I match an action to a number? I mean only if the number is 3 for example, an action ceiling, if it is 4, another action ceiling.
Just with if?
if for every number?
vital sphinx
How can I match an action to a number? I mean only if the number is 3 for example, an action ceiling, if it is 4, another action ceiling.
Just withif?
@opaque crest you could write it in a dictionary
 amber ice
hello, does anyone have any resources that would help in learning point clouds through python?
drowsy ibex
https://covid-19-apis.postman.com/
@slim fox Thank you
View our growing list of novel coronavirus (COVID-19) API collections to help fight this pandemic. And learn how to use our blueprints for quickly deploying new APIs from existing data sets.
 balmy oar
Hey folks, I would like to ask some help, books or resources to get up to speed with the interview coming, I will be getting a Python task which might include usage of Scikit Learn and Pandas, any ideas on the books or other reading material ?
 brave frost
I think it's far more important to understand the thing you need to do with scikit learn than to understand how to use the lib itself (but I am not an experienced data scientist, just used it in college)
balmy oar
@brave frost that's a good point, so you would recommend steering for some materials that are more data science related than the lib itself ?
brave frost
Depends on what the job description is and what you think you will be doing with the library
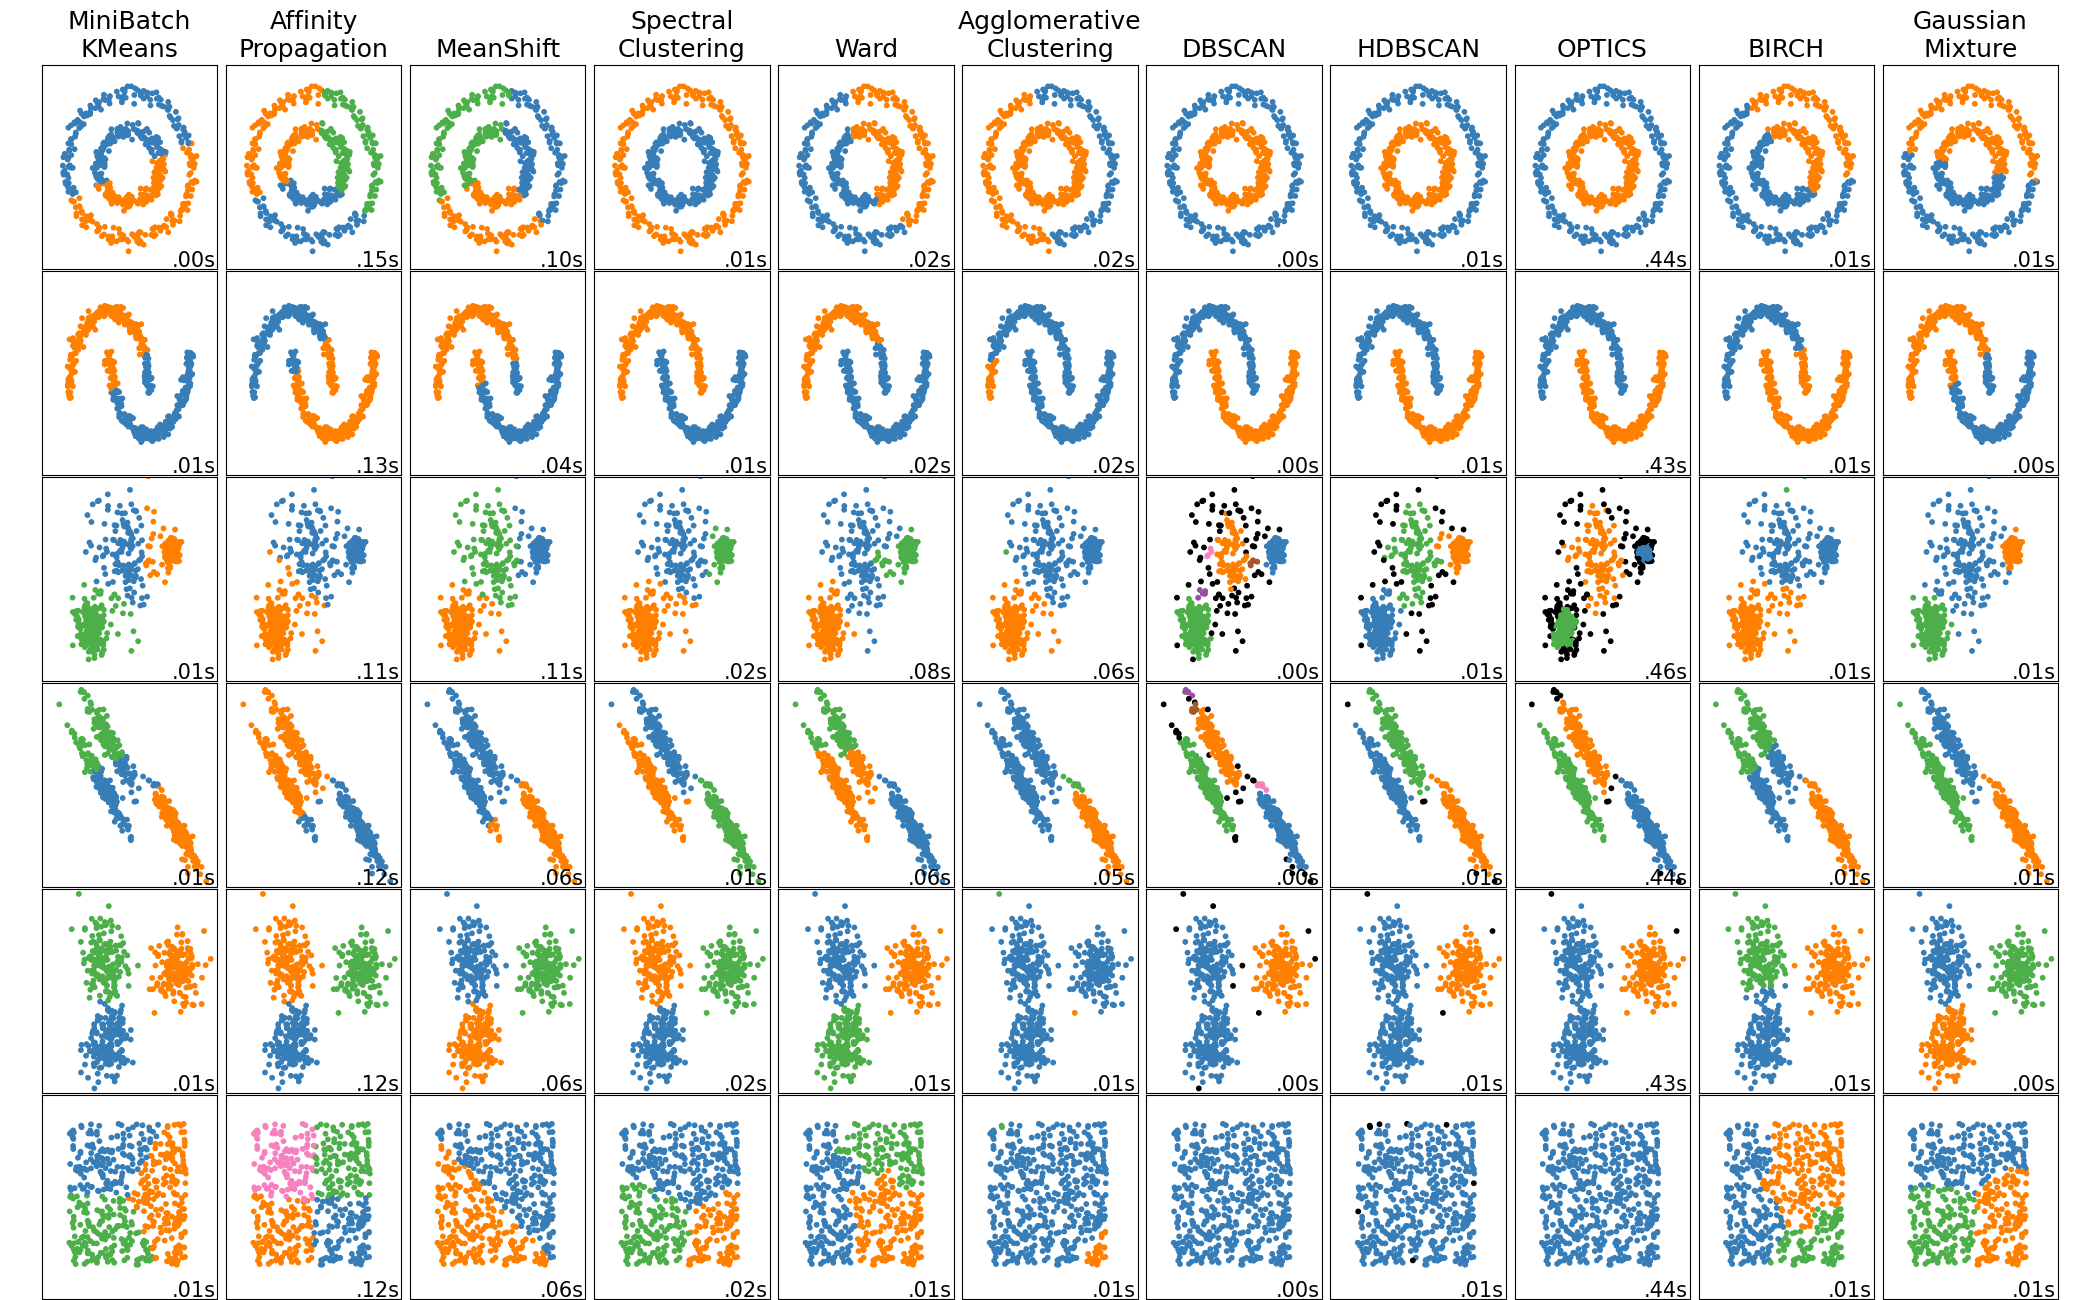
If you will be running ml models then know the different ones well and what their strengths and weaknesses are and which work for which data sets
For example, understanding this will help if the job is about clustering
 balmy oar
@brave frost ok, let me ask more straightly then, any recommendations Data Science books, that would dig deeper into understanding the screenshot above, since I couldn't explain it as this point
brave frost
Can't help you there, Stanford has some good free online courses about ai/ml/clustering/data mining/etc
balmy oar
@brave frost https://see.stanford.edu/Course/CS229 ?
brave frost
Yeah one of those
That is the more advanced one. The lower level of that course is 221
 finite solar
I'd like to add 1 to a specific "area" of a 2d np.array like this:
arr = np.zeros((10, 10))
arr[(2, 2):(4, 4)] += 1

arr

[[0 0 0 0 0 0 0 0 0 0]
 [0 0 0 0 0 0 0 0 0 0]
 [0 0 1 1 1 0 0 0 0 0]
 [0 0 1 1 1 0 0 0 0 0]
 [0 0 1 1 1 0 0 0 0 0]
 [0 0 0 0 0 0 0 0 0 0]
 ...
]```That's not the real syntax but I couldn't find what I actually need to do
Unless this is not possible and I just need to use a for product over that "area"
Since currently I have this py for point in itertools.product(range(s1, e1), range(s2, e2)): arr[point] += 1
But I imagine numpy has something like this built-in and I just can't find it
polar acorn
Works for me with arr[2:4,2:4] += 1, except slices are not end inclusive so it won't be exactly like your example.
dull turtle
how to raise an alert when something goes wrong in python. If i expect "cat image" as input and user provides "snake image or rat image" then it should raise an alert for it
alert may be like "Something wrong has happen" or "plz provide proper image"```@polar acorn thanks
dull turtle
how i can train to ML model to identify "Wrong image"?
hardy harness
I'm implementing a nn with 3 class output for text classification. As such, we're using softmax as the activation function for the output layer. I'm having a tough time computing the gradient on the output layer. any suggestions on that? or someone willing to take a look
 acoustic forge
I've written a script that gets a bunch of information on all of the games on steam. It does this through a bunch of API calls. It takes about 1 second for each game. My question is whether there's a way of making this faster? And is there a way of checking which parts of my script is taking up most of the time?
There are approximately 95k steam games/demo stuff etc. So that would be about 26 hours to get all information from steam
hardy harness
well off the top of my head one way would be to somehow index the games, and then run parallel tasks each on a subset of the games list
but, tbh, given that you want to do it once, 26h sounds quite reasonable for that amount
acoustic forge
That's probably true. It just seems like a lot to a new programmer :)))
uncut shadow
@acoustic forge you can technically speed it up a bit but it depends if the API is so slow (cuz if it is then you will have to wait those 26h) or if that's your code. Also, if you are using python it means you doesn't actually care about speed. Python was made to be easy but it's quite slow so to make it fast u should use C++/C
uncut shadow
it means you cannot subtract lists
!e
list1 = [1, 2, 3]
list2 = [1, 2, 3]
print(list1 - list2)
You are not allowed to use that command here. Please use the #bot-commands channel instead.
spark stag
@delicate rune i think you can replace that try-except block with .capitalize, it does the same thing, makes the first letter of a string upper case and the rest lower case
 delicate rune
Done it @spark stag
@uncut shadow yeah I know that but there is no list substruction in my code
Guys I do need help if anyone knows about Pygal help me I think the error is related to pygal library
 oak furnace
I dont see where youre importing pygal.maps.world
did you install it?
pip install pygal_maps_world
ey I did
oak furnace
does the file need to have a path
delicate rune
oak furnace
instead of just a filename
delicate rune
I use it in this file and I imported this file to the otherone
oak furnace
Im talking about the file youre trying to render
delicate rune
No it doesn't need
oak furnace
chart.render_to_file('/tmp/chart.svg') # Write the chart in the specified file
that shows a path
other than that im out of ideas
Ive never used pygal
you should try some small test examples to help you zero in on the issue
try to save a simple line chart with out all the country stuff
delicate rune
@oak furnace I already did that it works but I need to find a solution to make it work with the country stuff
oak furnace
is world.World() right?
yes I see that it is
pygal.maps.world.World()
try the example on the install page see if you cant get that to work
delicate rune
If I use a simple int variable like in this exemple the value of deaths in all countries it works properly but I need it to work with a list of variables
 bronze grove
Hi! I am making a line chart in matplotlib.pyplot using plot_dates. I have that part under the nail, but i want to know, how would i change the line style to indicate a change from current to predicted? e.g solid = current, dashed = predicted
 wise igloo
Is python decent for quasi-experimetal designs (time series, propensity score matching, ect)
lapis sequoia
hello, I plan on doing text analysis on scientific publications. what type of analysis can be done?
 grizzled quest
whats the best way you will read from pdf with python for data extraction
polar acorn
@wise igloo I'm sure python has some packages for that, certainly you'll find some time series stuff in the statsmodels package. But in general R is the place to go for more stats oriented problems.
 radiant notch
I've got a bit of an odd question here -
Does anyone have any ideas on how I could measure the correlation between two n dimensional arrays - where them lining up exactly gives the closest correlation?
The problem is I need some way of only checking if they line up when they are actually in proximity of each other
that's lining up pretty well
lapis sequoia
what's wrong here?
 copper panther
Anyone know a fix for this
 tawny oak
I think you should install textblob module
copper panther
@tawny oak I tried to by looking on the internet but unsure how to install it as those never worked
acoustic forge
How do I merge two dataframes where both contains some of the same data and some new data to get one new dataframe that has the collected data but not duplicates?
tawny oak
@copper panther write (pip install textblob) on your command prompt. I should work
copper panther
Its not that I figured it out
U cant do it in cmd u have to do it in a seperate command propmt
lapis sequoia
I have made a detailed visualization about deaths,confirmed cases,recovered patients and a cnn model to predict the number of confirmed cases in future.Please feel free to share your views and how to improve it.Thanks!!
https://www.kaggle.com/frozenwolf/covid-19-visualization-prediction-nn-model/notebook?scriptVersionId=33041397

Explore and run machine learning code with Kaggle Notebooks | Using data from Novel Corona Virus 2019 Dataset
late jackal
i am running some unsupervised learning algorithms to cluster data in 3d but every time i run the code i get slightly different plots
i am not sure if thats even an error or if that is how it should go
uncut shadow
It depends on what you mean by "slightly", but I don't think really small difference will be a huge problem
late jackal
well ok more than slightly like its odd it seems to vary by dimensionality reduction method
PCA changes almost none but logical linear embadding and ISOMAP flip flop all over
 unreal quiver
Hello guys I'm new here and I wanted to ask you to recommend me a machine learning project that icludes data visualisation. My experience so far is that I managed to create my neural network using only numpy and built minimax algorithm, also I have a vague understanding in liniar regression.
 deft harbor
What interests you?
Find some data on something you like, do some EDA
If you have labeled data, try doing prediction with something like a decision tree
uncut shadow
well, in ml there aren't often many things to visualize tho. I mean, you can still visualize data with 1, 2 features but it often comes with way more features (even after dimensionality reduction)
uncut shadow
it often has many features tho
but if it has 1, 2 then it should be ok
I think matplotlib has 3D function
unreal quiver
Ok thx I can look that up
late jackal
@uncut shadow one of my main ocncerns is im not getting very clean seperated clusters
after DR i have a 1995x3 dataset
uncut shadow
hmm
late jackal
i can send an image
uncut shadow
maybe you should try with different algorithm?
late jackal
left collumn is like the true labels then we have kmeans dbscan and hdbscan
the second figure is a slightly different dataset
we are suposed to tune the clustering algoristhms ill that match the truth labels then apply those settings to the second data set
. Truth KMeans DB HDB
PCA
ICA
t-SNE
ISOMAP
LLE
kmeans seem to be the only one functioning well
uncut shadow
hmmm
late jackal
🤷♂️
yeah not sure either i emailed a TA about it but we have a report due tomorrow lol
 tall pollen
hi, does anyone know how to perform a LR with adjustments by gender, age and so on?? I am new to python, and i know how to do this in SPSS but not in python.
anyone?
great community thankyou
 tame kernel
is there a way to fill a numpy array with the entire contents of a different array as the first entry?
lapis sequoia
any book recommendations for data science?
jolly briar
@lapis sequoia google ISLR, there' s a free text online as well
jolly briar
@lapis sequoia fair , i think ISLR is better, depends what you want really, any learning is good learning
lapis sequoia
Ok
jolly briar
islr doesn't use python either - so it's not necessarily better @lapis sequoia , it's just preference
lapis sequoia
@jolly briari checked islr
But thats based on r language
I wanna learn in python
jolly briar
yea - but it's more about the concepts
worldly elm
how do I add new items to a spacy vocab? I have some pseudowords which are not in the spacy vocab and I would like the tagger to tag them correctly
namely the text contains <eos> and similar stuff that gets tagged as <=XX, eos=NNP and >=XX
while I'd like spacy to tag the whole <eos> as SYM
 lunar holly
This is more of a general data science question, but when performing EDA how do you find relationships or potential trends among variables in the dataset? So far all the multivariate relationships I've explored have produced no results
worldly elm
@lunar holly I usually check correlations, variance explained, normality of distribution, and also all the assumptions of linear reg, like heteroscedasticity
lapis sequoia
is it necessary to define default value None by using pydantic??
class Model(BaseModel):
    attribute: Optional[int] = None


class Model(BaseModel):
    attribute: Optional[int]
 north sluice
uhhi actually have no idea
quick question - do you guys know any good resources to learn the Keras API? I've been trying to get into machine learning, but most of the resources I've found pertain to the commands themselves, rather than the theory and process behind it
I'd like to learn how to make a machine learning model based on the environment, rather than being a one trick pony refactoring some code i found on the internet
uncut shadow
@north sluice if you want to learn the Keras API you should check it's documentation
 rigid storm
Hi guys just a quick stats questions. I have 2 samples (n=34 and n=62). Should i even bother trying to run a student's t-test or should i go for Welsch's due to the fact that the variances are probably not equal anymore?
i was thinking, this ratio is 1.8. is there like a number, like a rule of thumb for which ratio is the maximum to be able to still assume equal variances?
worldly elm
always welsch imo
 thin remnant
I'm analysing a covid-19 dataset from a few weeks ago and try to plot some countries/regions. I made some code that takes all countries out of the dataset that start with the letter 'B' as shown in the first screenshot. In the second screenshot i'm plotting every country/region in the dataset. Now what i'm trying to do is only plotting the countries/regions I filtered out in the first screenshot. Could someone help me out on this one ?
lunar holly
@worldly elm cheers man, thanks I'll take a look into that. Just exploring a dataset for a school project and figuring out if there are any derived variables to create or relationships to figure out before I build a classification model for it
worldly elm
@thin remnant pie charts, if necessary, should have no more than 4 groups.
 coral yoke
you also get the countries and then revert entirely and plot the whole series rather than the ones you intended
 fiery maple
Do you guys understand a little bit of how Allen NLP design pattern works? Because I know they have a interesting way to consume config files for example.
lapis sequoia
Hey guys! I posted this video in discussion channel but it sank in a sea of messages in seconds 😄
I've prepared a list of 10 Python libraries for Data Science, that you might have missed. I have spent like 10 hours on editing because I lost all the progress due to Premiere Pro crush ^^
Please, tell me that at least such a list is useful for you.
This is the video: https://www.youtube.com/watch?v=FFEVAZhT7iw
Peace & love tech people. Let the algorithm be with us!

I have prepared 10 Python libraries that in my opinion might be useful for you and you could have missed them. I hope you will choose some of them and give them a try. It's always good to have a wider range of possibilities, so you can adjust the tool to the problem and not th...
 tribal granite
Does anyone have advice/ideas for unit testing a random number generator?
uncut shadow
@lapis sequoia well, I didn't knew about any of those libraries (except spaCy) and they might come in handy later. But I still don't like using libraries and prefer making things from scratch tho 👍
 pine dome
Hi, I'm new to deep learning and ran into this error while following a tutorial:
ValueError: Input arrays should have the same number of samples as target arrays. Found 12708 input samples and 25416 target samples.
Based on my reading online, I need the input and target samples to match
In this case, it seems like I have twice as many target samples as input samples
What is usually the cause of this?
coral yoke
@pine dome when you're preparing your data your x and y are way off when they should match. If you have 10,000 images, then you should have 10,000 labels
pine dome
Makes sense
I realized what I did wrong - I used the x input array twice instead of x and y
coral yoke
@lapis sequoia heard of most and used a bit of those libraries myself, hug I wouldn't suggest though. I'd much rather use fastapi or just flask as both are faster than hug in benchmarks i've seen.
 empty vector
Learning python for futures analysis. Slowly making progress 🥳
 noble gale
is data science actually hard?
lapis sequoia
Yes, if you want to do anything sophisticated. Basic data analysis isn't too hard to jump in to
thin remnant
I'm trying to put the country name or the date on the x-axis
can't get it to work...
both would be beste
Belgium - date
 vast tapir
@thin remnant
Does something like this work?
belgie_new.set_index('ObservationDate').plot(kind='bar', rot=0, linedwidth=2, figsize=(7,7))
Another that might work is add use_index=False
belgie_new.plot(kind='bar', rot=0, linedwidth=2, figsize=(7,7), use_index=False)
Also you could add x='Belgium' to get the country name on the x-axis (assuming there's only 1 country name)
belgie_new.plot(x='Belgium', kind='bar', rot=0, linedwidth=2, figsize=(7,7))
 graceful birch
i have an array qs = [0.13, 0.2, 0.3, 0.4, 0.5, ...] with 10 elements
i have a numpy array indexes which consists of indexes into qs (ie integers 0-9 inclusive).
indexes is quite large (10s of millions).
when I do y = qs[indexes] it seems very slow and uses a lot of RAM
is this expected? is there a better way to do that?
 stoic condor
@graceful birch have you ever tried using Numpy arrays?
graceful birch
@graceful birch have you ever tried using Numpy arrays?
@stoic condor I was doing stuff with pandas, turned out pandas is allocating loads whenever I dodf.loc[bool_mask, 'column'] = some_values
that was the problem
for some reason df['column'] = np.where(mask, some_values, np.nan) is massively faster and barely allocates
this weird tbh, my df is ~100Gb but if I even look at it funny by slicing it, pandas seems to copy it in into a massive temporary
stoic condor
@graceful birch you could use
pandas.DataFrame.at()
@stoic condor i have df.shape = (50_000_000, 50) , bool_mask is a vector of 50_000_000 bools, 90% of them true. I
stoic condor
another option might be
pandas.DataFrame.update()
For tons of data..
graceful birch
is there a reason why df.loc[bool_mask, 'column'] = some_values is so much slower than the df['column'] = np.where(mask, some_values, np.nan) ?
some_values is float64
perhaps i should not be using bool_mask with loc ?
stoic condor
I might be slower for the interpreter check each element via .loc, given multiple function calls. np.where implement problably is applied in place
if data to be replaced are Nan, you have .fillna function ofr DataFrames
 faint furnace
Hello! I am pretty new to data science and learning pandas, numpy, matplotlib,etc through courses online . Need to learn a new skill during this pandemic!
I want to find out which genre has received the maximum number of votes.
I converted the genre to a List
Now I just need to be able to select each genre like for example Documentary. Then get its index , use that index and add the number of votes it got.
Im trying to find out how to go about it but unable to get a lead
added them both in same dataframe
coral yoke
@faint furnace
>>> import pandas as pd
>>> df = pd.DataFrame({'genre': ['Documentary,Short', 'Animation,Short', 'Animation,Short', 'Comedy,Short'],\
...                    'votes': [1, 1, 1, 1]})
>>> df
               genre  votes
0  Documentary,Short      1
1    Animation,Short      1
2    Animation,Short      1
3       Comedy,Short      1
>>> df.groupby('genre').sum()
                   votes
genre
Animation,Short        2
Comedy,Short           1
Documentary,Short      1
 opal knoll

Working on a project. posted at this link. How do I assign names to the rotated rows that are unnamed?
 valid drum
Is that a correct implementation of backpropagation in regular fully connected layer?
    def backprop(self, dA_prev):
        dA_prev = self.activation.backprop(dA_prev)
        x = self.cache['X']
        self.grads['dW'] = np.dot(dA_prev, x.transpose())
        self.grads['dB'] = dA_prev
        return np.dot(self.weights.transpose(), dA_prev)
 slow lynx
Awesome if i may ask how did you start did you learn programming at school or by yourself and decided to dive into AI and stuff ?
slow lynx
Oh shit okay that amazing!
lapis sequoia
had a little bit on school
slow lynx
how many years of experience do you have ?
lapis sequoia
did a computer science
what ever
higher education
in holland
i prefer other languages to but whatever
slow lynx
Holland yeah nice place
so would you say that you can create an audio ai like siri or something similar ?
lapis sequoia
for filename in *.wav; do TempoDetector single "$filename" ; done
can anyone help me with this one liner
its spits outs text
the tempo
nah there are just a couple of datasets there are freely avalaible
but i want the output to be embedded in the wav fle instead
its madmom
library
coral yoke
i have experience with ML as well
slow lynx
@coral yoke how many experience and what all have you made ?
coral yoke
in ML specifically about half a year now and i've just made simple things, nothing fancy. image classifiers for different things, sentiment analysis for reviews, power plant generation prediction given very basic data, couple other things
slow lynx
For anyone wondering i am just asking cause i am @ my 978 attempt in learning python i started with the automate the boring stuff seems to be going well and eventually want to deepen my skills with ML , ai or robotics but i want to have a realistic road map i guess you could say to work towards that goal
Pretty awesome man!
 gloomy current
got a quick question about best practices- ive written a web scraper but now i want to grab lots more points of data from each page
but if i add on what i need it seems of an ugly way to do it
 timeframe_volumes = [[] for _ in range(4)]
         scrap data iterate through url list
             append data list for each iteration  create dataframe using lists
store dataframe to csv ```the data i want is in so many different places id have to declare like 15 different loops at the start which seems like the wrong way to do it
anone know if there is a better way to go about this? just need pointing in the right direction as im kinda learning as i go
jolly briar
how are python notebooks such trash compared with things like RMD? I'd have thought by now they'd have either sorted themselves out or just moved things over to a markdown setup like R has, what's holding them back?
Having a variable in a markdown cell, or showing / hiding cells in report output is completely trivial in RMD but in notebooks is a complete hassle.
given that data analysis is so widely done in python, and notebooks are one of the main means for it, I'm constantly amazed with how awful they are.
coral yoke
@jolly briar I don't know what you're talking about with "how awful they are." They're very useful and intuitive
Assuming by notebooks you mean Jupyter
jolly briar
@coral yoke yeah jupyter - they have use but when one compares them to something like rmd they're severely lacking
don't know what you're talking about with "how awful they are."
i've given specific examples in my comment, so i'm not sure how you don't know what i'm talking about
unless you are aware of approaches to this which are as straightforward as those in rmd?
Assuming by notebooks you mean Jupyter
This is also ambiguous, unfortunately. Are we talking about notebooks or lab? See - i was actually talking about lab, but said notebook through habit... though - the issues that I've outlined aren't solved in notebook.
There's now lab and notebook, lab is meant to be the next version of notebook, but notebook widgets don't work with lab because the back end was changed a lot.
coral yoke
Jupyter notebook is just fine and I nor my data analysis friends have ever had issues with it in any way. There wasn't any specific examples in your random, factless rant. I have no idea why you're acting like this
jolly briar
@coral yoke variables in markdown
there's an example
showing / hiding cells in report output, there's another @coral yoke
In an rmd file having an variable in a markdown section is simply done with
text `r variable` more text
and a cell is hidden / shown with echo=False/True (iirc).
it's also possible to turn off evaluation of a cell with eval = False, all these are just put within { } tags at the top.
I think it's quite clear how much more straightforward this is than with jupyter
coral yoke
Also none of that is anything I've ever needed so congratulations?
jolly briar
i didn't realise they were designed for you personally
coral yoke
If you don't want a cell evaluating in Jupyter notebook, don't run it
jolly briar
but having a variable in a markdown cell is a pretty basic ask for something to build a report from
coral yoke
I didn't realize they were designed for you personally either?
jolly briar
If you don't want a cell evaluating in Jupyter notebook, don't run it
that's not practical
I didn't really they were designed for you personally either?
no - i'm comparing it to general tooling
i'm not sure if you've ever used rmd before?
coral yoke
I haven't and I never will however it doesn't mean I haven't seen it used
jolly briar
well maybe you don't understand the difference then
but these kind of things are extremely straightforward in rmd, and it's frustrating that they're not in jupyter
coral yoke
Then why randomly rant in a python discord when nobody asked for it
jolly briar
because it's about a python tool?
coral yoke
Especially when you act like Jupyter is trash, and even said it, and don't even point out anything nice about it? Real nice of you
jolly briar
Yes - I think it is kinda trash for these reasons
They're pretty basic aren't they? using variables in markdown etc
coral yoke
No honestly. I've never needed variables in my markdown. I use code cells to display code, that's what it's for
jolly briar
It's quite common - when writing to want to reference a variable
it also enables dynamic reporting, pretty basic stuff
Similarly with hiding / showing cells in the output - sometimes the code is not relevant, sometimes it is
coral yoke
I just write in markdown "In this example we can see the mean of sales" and then just display it. It's not trash
jolly briar
Yes - that is a trash work around
coral yoke
In your opinion
jolly briar
because it's having to work around a basic functionality
jolly briar
sure - look at rmd, look at jupyter, and tell me one is not objectively much better in this regard
coral yoke
I'd still choose Jupyter
jolly briar
I'd like to hear why not having the option is better than having the option
coral yoke
I'm not going to fuss over having to write code in a code cell lol
jolly briar
i'm assuming you've not had to use them for reporting
there's also the matter of plain text vs the mess of json in jupyter notebooks i guess
coral yoke
I have for each project I've done and never have we had issues
jolly briar
Well I am highlighting things you don't seem to have considered, and your response is to double down
coral yoke
My response is my experience?
jolly briar
I'm not asking whether these are useful, I'm telling you they are, hence them being functionality in many other tools
and hence there being insane work arounds to try and bring them into jupyter rather than them being a default as they are in other tools
coral yoke
You find them useful, no? It's your opinion on the usefulness not a fact dude
jolly briar
Yes I do - and many others do as well
coral yoke
It's not insane to click the plus button and type one line
jolly briar
Yes it's clunky - the variable belongs embedded within the paragraph so that it reads naturally
coral yoke
Why so?
jolly briar
not a stupid staccato flow of "and here's a blah" <code cell> etc
coral yoke
I can read it naturally in Jupyter version
Does that not mean it comes down to preference?
jolly briar
It means you're willing to have something that's further removed from reading like a natural paragraph of written text
coral yoke
Have you looked at Jupyter notebooks then? They're very smooth transitions
jolly briar
which isn't usually what I'd go for when writing something, i'd rather have something that has the ability to have variables integrated into it
pretty basic
I've used notebooks a lot yes
coral yoke
You'd rather that, again preference
jolly briar
they're not smooth at all in this regard, not even close
coral yoke
Don't you see my point?
jolly briar
yes - you're saying that i can just have an evaluation follow a line of text
coral yoke
No disregard that
jolly briar
and that is breaking the flow of text - it's not as fluid as being able to embed the variable within a paragraph
coral yoke
I'm telling you it's preference, opinion
jolly briar
and if you want say 8 variable in the paragraph then it's horrendous
coral yoke
Not facts that you're sitting here screaming
jolly briar
well you could like lots of daft things i'm not going to assume that it's all a good idea am i
coral yoke
But it's again, your opinion, no?
jolly briar
No - hence me giving examples and you trying to boil it down to "everyone has their own view"
coral yoke
My point is there's no need to argue over a preference. You're honestly being childish man.
jolly briar
no i'm highlighting a deficiency
coral yoke
I'll let you do you and echo in your chamber oh great R programmer, have a good one
jolly briar
@coral yoke it's not about that - I use python far more than R - but it's pretty blatant given any thought that there are some extremely basic features missing from notebooks which severely gimp it compared to something like rmd
 agile forge
apparently you can use python from rmd, though it's not clear to me if you can do the variable referencing stuff in markdown
jolly briar
@agile forge I've heard some do this actually - i'm always a bit sceptical of these things for some reason... like using R within jupyter etc
jolly briar
yeah - i mean when one mixes python / r in the same notebook - i've never looked into it
I know others use it though, so I'm sure it's fine
agile forge
ah, mixing I don't know about
also apparently there's a jupyter extension for variables-in-markdown
jolly briar
yeah - you can have both, reticulate does it iirc
also apparently there's a jupyter extension for variables-in-markdown
they're often hassle though - and it depends if it's notebook or lab
agile forge
nods
agile forge
notebook is obsolete at this point, it seems, so if it works with lab it's all good
jolly briar
there was one with a {{}} kinda syntax or something
agile forge
definitely a lot of rough edges in notebooks though
like, three different solutions for working well with git
jolly briar
notebook is obsolete at this point, it seems, so if it works with lab it's all good
yeah it'd be great if there was a kinda centralisation or something to force people to use lab instead of notebook
agile forge
and they all feel a litle hacky
jolly briar
because the widget ecosystem still isn't there
like, three different solutions for working well with git
yeah this is another hassle
IMO I just don't know if they're ever going to be as flexible / straightforward as rmd... I just envy that they have plain text, simple flags for execution / hiding things etc
agile forge
I guess I should look into rmd sometime
jolly briar
yeah - although if you use python maybe it's not so much value, as a lot of others won't use it 😦
but it's _so_straightforward to have cells on / off for evaluation, having cells hidden, variables in markdown and the rest of it. So for generating reports it's super nice
agile forge
the best ideas are the one's you can, uh, liberate without any work cause someone else had a smart idea
jolly briar
yeah definitely - I'm not sure how they'd port over to lab though , i guess they'd have to have 'magic' stuff
like
%%show_cell
this cell will be in report
something along those lines might be ok
in rmd they have:
\`\`\`{r, echo=FALSE}
1 + 1
\`\`\`
nested backticks beat me
agile forge
https://rmarkdown.rstudio.com/ marketing talks about Python outright
Turn your analyses into high quality documents, reports, presentations and dashboards with R Markdown. Use a productive notebook interface to weave together narrative text and code to produce elegantly formatted output. Use multiple languages including R, Python, and SQL. R Ma...
not sure if that's reticulate or not
jolly briar
So here - the code would be hidden, but the output would be shown
agile forge
sounds like knitr just supports python
jolly briar
yeah the r in the {} is saying to execute with r, so it might be super easy
agile forge
maybe I'll write an article
jolly briar
you can publish straight to rpubs from r-studio ha
jolly briar
👍
faint furnace
This is a very big dataset of IMDB movies. I want to find which genre has the maximum votes. Everyone movie has max 3 genres. and the votes column is next to it as in the pic. I want to basically get the list of all titles with their total number of votes
like number of votes for "Animation" genre will be calculated by adding the votes of all movies which come under animation genre (like here 197+1287+121 + ....) . This is a big dataset. not just 5 entries. How do i do that?
How do I extract unique genres from this list? Like Documentary, Short, Animation, Comedy, Romance,Sport,etc.. this should be the result
lapis ice
Question regarding GANs,
What has already been done and what 'should be done' using GAN's?
It's a question which answers can be based on your own opinion or based on a paper, etc.
I would really appreciate any and all inputs 🙂
coral yoke
@faint furnace I gave you your answer the last time you asked. Scroll up dude
faint furnace
@coral yoke i read it. i didnt understand it 😦
>>> df = pd.DataFrame({'genre': ['Documentary,Short', 'Animation,Short', 'Animation,Short', 'Comedy,Short'],\
...                    'votes': [1, 1, 1, 1]})
>>> df
               genre  votes
0  Documentary,Short      1
1    Animation,Short      1
2    Animation,Short      1
3       Comedy,Short      1
>>> df.groupby('genre').sum()
                   votes
genre
Animation,Short        2
Comedy,Short           1
Documentary,Short 1```ok i understand it now. but that is not what i want
coral yoke
It's simply grouping by the given column and then summing the votes
Yes, but that's the snippet you need to finish now
faint furnace
see you are considering Animation, Short as same genre. i want it different
Animation =
Short =
each movie comes under max 3 genres. and i awnt to calculate the number of votes for each genre
coral yoke
Yes I know, that should be decent enough to work with
faint furnace
yea i know groupby can be used. but the problem im facing is how do i seprate this list of genres
coral yoke
You can separate the genres but you'll lose the votes when they go to one or the other
Short or long isn't a genre, you don't want that separated you want it removed
faint furnace
you are right . i was planning to ignore the number of votes of short. but how do i get the totan number of votes of Documentary, animation and other genres
faint furnace
how do i remove it btw?
coral yoke
Just use the built in replace function
faint furnace
ya replace thanks
faint furnace
I was able to remove the Short from genres_list. but groupby not working
@coral yoke
But you see there are genres like Crime Romance, Thriller. in same list.
coral yoke
not sure if groupby likes lists but it shouldn't be a one-length list
 drowsy marsh
I have a set of data that I can interpolate using scipy.interp2d, like z = f(x,y).
Now, can I obtain an analytic formula, type z = a.x + b.y or something from this?
I tried using linear_model from sklearn. But it does a 2D-linear-regression if I understood, which is, I just realized, different than a 2D interpolation. And so the results are very different than what I expect.
 terse torrent
Is IBM_DB2 working with anyone else’s python?
 patent kiln
Just a heads-up. HumbleBundle is having nice sales on O'Reilly books
https://www.humblebundle.com/books/definitive-guides-to-all-things-programming-oreilly-books?partner=limitedtimeoffer

Humble Bundle
Pay what you want for awesome ebooks and support charity!
 mortal vessel
Got a question for you all: is there anything special I have to do with pycharm to have my plots show up? Matplotlib plots are not displaying with plt.show command
uncut shadow
well
it should open new window with this plot
idk if pycharm supports opening plots
I mean
if you are going to run plt.show() (and you have made a plot already tho) then it doesn't change anything if it's pycharm
pycharm scientific mode has a function (I'm not 100% sure tho) for plots and stuff like that which makes it easier to use but it's only for profesional version
mortal vessel
Maybe I should try using scientific mode
I just know plots I would display in notebooks do not display correctly in pycharm. They don’t display at all
Dubugger steps right over them
coral yoke
@patent kiln 99% of the time you can find O'Reilly books as free PDFs instead of spending that money
lapis sequoia
Hey my fellow data science friends, I am trying to see if this is possible in pandas
I'm trying to get all rows from a specific column between two rows with certain strings, all the non string rows are random integers
is this possible?
I'm trying to "slice all rows" *
in between the rows with two particular strings
terse torrent
What should I use for SQL? MySQL or Jupyter?
coral yoke
what?
also @lapis sequoia i need a bit better explanation to understand what you're trying to do
terse torrent
What should I use for creating sql tables?
coral yoke
a program that can interface with the database or the database command line in the case of something like postgres
lapis sequoia
I have anexcel sheet of 48 columns
and for each column, they are basically all random integers
but the words " buy curve" appear , and "sell curve" appear in each column, in different indexes for each column
so I want to basically iterate for every column: find where buy curve appears and slice the column up to where "sell curve" appears
coral yoke
just grab the index of each and then slice
lapis sequoia
I know I can find a boolean for where buy curve appears I believe,
oh theres not a automated way to do it?
coral yoke
no?
lapis sequoia
because theres 48 columns and id have to individually find each buy curve and sell curve index
coral yoke
pandas allows you to work with data, it can't do what you don't tell it to do
lapis sequoia
oh I can use boolean actually yeah
coral yoke
no, use pandas
df.loc the rows with that buy and sell, grab the index
no boolean required
lapis sequoia
but from my understanding df .loc
it can slice within a column from one string to another even if there are integers in between?
coral yoke
then do that
lapis sequoia
ok, i remember trying that and it would give some error, let me give it a shot again
terse torrent
Why would my IDLE be daying ibm_db could not be found if I imported it already
coral yoke
because you're not using the correct interpreter
also, highly advise against IDLE. just get a proper IDE
lapis sequoia
so I made a small scale Example, Soul, is there something wrong with my slicing notation? it doesnt return the values in between my slicing parameters
terse torrent
Downloading Anaconda to run Jupyter.
coral yoke
@terse torrent jupyter will not do it for you. it is not meant for that
@lapis sequoia yes
which is why i said use loc to find the row index where the str is contained
lapis sequoia
@coral yoke I think i figured out how to do it!
that returns the index , now I can try to slice that with iloc or something, since i have a numbered index right?
thanks a million man
lapis sequoia
Yo i think i got everything! THanks a million @coral yoke for nudging me in the right direction! I converted the series to a list and used int( list.index ("Sell Curve")) then used i loc with that!! amazing
coral yoke
np!
worldly elm
Is there a simple way to get all the data from an MLFLOW experiment so that I can share them?
 unreal thistle
hi guys :)!
so i work at this project and i did a classification of a model and now i have to do the segmentation ,i found some examples online but they train and do the segmentation in the same time ,is there any method i can use to do the segmentation without editing all the code i did .Sorry if it is a stupid question ,i'm a begginer .
lapis sequoia
classify what now
what model did you make to classify what
and what do you need to do segmentation on
 warm wedge
bit of a newb question, but wondering if anyone could let me know...
if you run some vectorization over a column in a DataFrame, can the function be your own function, or is it only a select set of native functions you can do it with?
agile forge
you can run any function on a pandas column, but random python functions will be slower
warm wedge
but it would still be faster than doing it via iterrow() or .apply()?
with a custom function
lapis sequoia
Do i have to master matplotlib ?
Or being average in using matplotlib is fine
For data science
warm wedge
theres never and excuse not to master anything
but from my limited knowledge, its one of the bigger libraries so I'm sure theres no harm
but im not expert, im pretty much a newb to it all
 fervent bridge
Anyone here close to finishing the Neural Networks from Scratch book at NNFS.io? I like Sentdex series just want to know if the book makes it easy to grab the readers attention.
Also if I want to build a portfolio like what are some good example projects to actually work on?
uncut shadow
@lapis sequoia you should be able to use matplotlib without problems tho. It's not like plotting and stuff is the heart of ML and DS, but it's super usefull. It's often impossible to plot some data in some fields of ML especially in Deep Learning because it comes in many dimensions but if you have a chance to do that, don't hesitate if it's worth time. Not every dataset (datasets are often checked but some of them are not) is correct and some labels might be wrong. If you plot this dataset you will be able to easilly see the problem and solve it. For example, let's say you have a dataset of people's height, weight, gender and stuff like that. You do .head() (assuming u opened with pandas) and .tail() and everything seems ok, but it's not. 5 people in the dataset have wrong height and you don't know about that
wrong data might cause problems with your model which is very bad for it
and if you would plot this dataset you could easilly spot those anomalies and fix them
also, datasets are often not just 200 examples nor even 2000 examples. Some of them have millions of examples and human couldn't check them all
so they might contain wrong data
lapis sequoia
Ok@uncut shadow
uncut shadow
👍
uncut shadow
no
lapis sequoia
Then ?
uncut shadow
gimme a sec
lapis sequoia
I found this matplotlib series on youtube

YouTube
In this Python Programming series, we will be learning how to use the Matplotlib library. Matplotlib allows us to create some great looking plots in order to...
What do u think of it ?
uncut shadow
well, I didn't watch those tutorials but from what I can see they are good. Still, there is nothing which can replace your own coding so watching videos might help and show you the way but in the end you still have to make it for yourself to understand it
lapis sequoia
In that book i am reading he didn't teach a lot about matplotlib
uncut shadow
well, yeah, but still it doesn't mean it's not usefull
datasets are sometimes assumed to be clear where in reality they often aren't
there is no better way than plotting everything and seeing for yourself
 merry violet
That matplotlib series on youtube is brilliant. Corey Schafer has one of the best python channels you will find.
lapis sequoia
@uncut shadow@merry violet ok thanks
mortal vessel
So I know python 2.7 is no longer supported. Have some groups discontinued the ability to download packages for 2.7?
Like numpy or pandas etc
agile forge
mostly you'll just end up getting old versions
 trail light
uncut shadow
trail light
uncut shadow
Well, you can just post it tho but the best place for that (If It's not related to data science or ML) to post it in #303934982764625920
altough I'm not a staff member so it might not be what they would do
 past pewter
@lapis sequoia matplotlib and seaborn are both useful. Don't kill yourself memorizing syntax, but be familiar with them. Try and make a few professional looking, highly customized graphs and then call it done.
Corey Schafer is good, Sentdex is also good
https://www.youtube.com/playlist?list=PLQVvvaa0QuDfefDfXb9Yf0la1fPDKluPF

YouTube
Learn how to visualize data in the form of line graphs, bar charts, pie charts, 3D graphs, and more with Python 3 and Matplotlib.
lapis sequoia
@past pewterok thanks
Learning syntaxes isnt easy
You learn them then u forget them later
What is seaborn btw ?
past pewter
It's another plotting library built on top of matplotlib. Its defaults are a bit faster and sexier than matplotlib, but if you want to do any deep customization you need to use matplotlib
It's common in industry
jolly briar
@lapis sequoia knowing how to use dir() and help() is a bit of a must with matplotlib, in my experience at least
fervent bridge
Ah so many tuts, I did not know Sentdex has a Matplotlib tut. Will definetly look into it.
 umbral aspen
Does anyone know of any good tutorials for predicting thousands of images at once with Tensorflow? I find lots of things about building pipelines to train models but not much around actually using that model once it has been trained...
polar acorn
@umbral aspen Search for some info on tfx, I haven't tried it myself but it's a tensorflow library for hosting and using your tf models.
umbral aspen
@pptt Thanks for the tip never heard of it until now...Will take a look
spark stag
i have a question about the categorical crossentropy loss, from what I understand with how the it computed the loss value, as it multiplies the log of each prediction by the actual value, if there is only 1 true label does that mean only the prediction onto the real label is used in calculating the loss and the distribution of the predictions onto the labels that are not the true label isn't affecting the output
so if i have a prediction output of [0.05, 0.1, 0.7, 0.05, 0.1] and the labels are [0, 0, 1, 0, 0] the only values that are used to calculate loss are the log(0.7) * 1, none of the other values are used?
uncut shadow
I'm not sure if I understood your question right but no
You compute loss for each of those predictions
And then sum it
spark stag
so if that is one prediction with 5 output nodes, I calculate a loss for each then sum yes, but because I think the equation is -sum([real[index] * log(pred[index]) for index in range(len(real))]) where real is the labels, anything which has a label of 0 (it wasn't that item) has a * 0 so it isn't considered so is my implementation wrong or just how I am expecting the data
uncut shadow
Well
I'm not sure if we are talking about the same loss function tho. Cross-entropy loss function is
-(ylog(p) + (1 - y)log(p -1)) (or sth like that)
Where p is prediction and y is the label
spark stag
ok, i'll look into that because this is just how i saw it
uncut shadow
Ok
spark stag
@uncut shadow thanks for your help, i think i found the issue now
deft harbor
If im running a for loop, and I need to trigger an embedded if loop to run 15% of the time (extended to the future), what is a good way of going about it?
Some sort of draw from a distribution i would think
jolly briar
@deft harbor
if np.random.choice([True, False], p=[0.15, 0.85]):
    do stuff
like that?
deft harbor
yes
I ended up doing
        prob = np.random.uniform(0, 1)

        if prob <= 0.05:
curious what is the fastest way given i am using this to flip the labels while training a gan
lapis sequoia
@jolly briar ok thanks
faint furnace
Can someone tell me how to get it right
Basically I am trying to get the total number of votes for each genre. So I started out by making the "genres" column a list -> "genres_list" and set it as an index so I can use it in the find_votes() function
if there is anyone who can help fix my code or maybe give a better solution, would highly appreciate. been stuck on this problem for last couple days
 flat bough
@faint furnace Hi, are you trying to access a list element with round braces. It won't work you need square ones. line 6
flat bough
I'm not sure how to fix this exact function, but if i were you i'd give a try loc https://pandas.pydata.org/pandas-docs/stable/reference/api/pandas.DataFrame.loc.html
faint furnace
This is my dataset. I want to find the number of votes for each Genre. Every movie comes more than 1 genre. as you can ese more than 1 genre in each row
i dunno how I will use loc here. If I can get the index of a element then it will be great
i want to be able to get the index of [Documentary,Short] cells, then use this index to get the basics.numVotes[idx]
any way to do that?
flat bough
honestly, not sure I need some time to think
can you send link to this dataset, I wonna try to also solve it
 paper niche
 junior fossil
I was also curious, thank's for this explode hint. @faint furnace maybe this helps: https://share.cocalc.com/share/fe9a112b880dd0189ff891e503e420036824c001/pandas-groupby-list.ipynb?viewer=share
faint furnace
Thanks for the replies I will check these links!
damn I was actually thinking of something like this!!! explode ! I think this might be it !
flat bough
good job
 placid stratus
Hey all! I'm looking to develop a preferred citation for a model I work on. I'm confused about how to determine authorship for software, since I'm used to doing it for papers. How far back do I have to cite contributors? There are a couple who did initial work, but none of their code exists in the model anymore
and do we cite the primary investigator? He doesn't do any of the work, but I think we do
 mossy crow
Anybody here use boto3 (AWS SDK) with s3?
past pewter
@mossy crow what's the issue?
mossy crow
@past pewter For the past 3 weeks I've been uploading 5 files in a for loop to an s3 bucket with no issue. When I ran it today it randomly will get through 1-3 of them and then throws a socket.gaierror: [Errno -2] Name or service not known error
@past pewter here is a detailed explanation https://stackoverflow.com/questions/61642290/boto3-error-socket-gaierror-errno-2-name-or-service-not-known

Stack Overflow
I have a script that uploads files in a directory to s3 using the boto3 AWS SDK. I've been using it for weeks with no issue, and today it will upload a random amount of files (between 1-3 out of th...
past pewter
I haven't encountered that one but just saw this:
https://boto-users.narkive.com/l82CTCe4/cannot-create-a-bucket-following-simple-web-example-why
any chance it's on your end and not a boto3 thing?
past pewter
Yeah, that's what they concluded on the linked thread
mossy crow
@past pewter I turned on DEBUG logging for the function, and then it worked flawlessly, so, guess i'll never know what actually was the issue.
past pewter
🤣
 gritty solstice
hopefully quick question...
How do I get bytes to stop automatically showing in their ascii values?
IE: b'l' to b'\x4C'
.hex()
NVM, thanks guys
tribal granite
Hey guys, do you think Docker is worth learning for data science?
 flat quest
yeah its used pretty commonly with the data science / ml libraries
@deft harbor
if ur running np.random.uniform every time u want to run that if statement its not going to be much faster than a regular random generator
most of numpy's speed come from vectorizing i.e. doing multiple computations at once. A better way may to be to precreate a matrix of probabilities to refer to with the if statement
There might be a even faster way than that, tho i'm not sure what that might be
deft harbor
that makes a lot sense
        # Generate noisy labels for discriminator ------------
        # 5% of the time, switch the labels
        if np.random.uniform(0.0, 1.0) <= 0.05:
            # Labels swapped
            dis_loss_real = cdis.train_on_batch([X_real, label_batch], y_fake)
            dis_loss_fake = cdis.train_on_batch([X_fake, L_fake], y_real-smoother)
        else:
            # True labels
            dis_loss_real = cdis.train_on_batch([X_real, label_batch], y_real-smoother)
            dis_loss_fake = cdis.train_on_batch([X_fake, L_fake], y_fake)
That is what I have now, but I knew there had to be a way to speed it up.
I'm fighting the model while also trying to figure out speed.
the model won
that is per batch, which is 64 out of like 1,000,000
flat quest
what kinda model are u making?
 reef flume
What exaclty is an AJAX API and how will it influence web scraping with BeautifulSoup? I'm trying to parse data from a table, but upon parsing, the extracted data (specifically from the table) differs from that of the source code found on Google Chrome. Almost as if I can't access it.
flat quest
whats with the dis_loss_real and dis_loss_fake btw 😂
uh ajax is just for getting data asynchronously, using the js event loop
haven't used beautifulsoup yet, so not sure how it integrates with that
terse torrent
What SQLs databases should I be sure to learn? I learned IBMs
deft harbor
@flat quest a conditional gan
discriminator loss on real vs generated images (fake)
early epochs
 opaque stratus
Hello Everyone,
I am a soon-to-be sophomore in college with strong interests in Machine Learning/Data Science and I am currently trying to decide on a major. As of now, I am majoring in mathematics, and I believe I like it enough. But please, do you guys have any advice with this? Those of you working in some field within data science, what was your major? What are some good majors for data science in general? Thanks! Data science is so vast, I am just sure there are many strong majors to help prepare one for the field that I could perhaps like even more!
flat quest
ohh gotcha
yeah haven't worked with gan's yet,
are u using custom layers to build the gan? or the built in ones?
lunar holly
Hello! I'm having a bit of trouble, working on a school project where I'm using K-Nearest Neighbors for classification. I'm trying to figure out if/when it would be wise to omit certain columns from my data in order to improve model accuracy? Certain features of my data, after EDA seem to be pretty useless in relation to my target variable... I removed them, and from testing it seems I've actually I was able to improve my error rate
flat quest
features that have very little relevance to the output should be removed
they're generally just providing extra noise, and that can create greater variance within the model
But make sure that they aren't related, otherwise you may be taking out an important predictors from your data
lunar holly
Got it, thanks! ^^ The features are all categorical, and from what I've seen it doesn't seem like there's a signal or anything indicating some type of trend
flat quest
yeah then its probably safe to remove them, the only real determinant of the performance of a model is having a strong predictor within the data. Sometimes you can even get rid of like all of the features, and have a better performance lol
lunar holly
And it keeps getting better ^^ the more I take out
Thanks once again
lapis sequoia

Coursera
Learn Applied Data Science with Python from University of Michigan. The 5 courses in this University of Michigan specialization introduce learners to data science through the python programming language. This skills-based specialization is ...
Hey guys, is this a good course to start in data science ?
I havent any data science yet
I only know python
faint furnace
looks good i should also enroll
 cunning wadi
hello chaps
Is this the right place if you need help with like decision trees and stuff
faint furnace
Question is "Which actor - director pair is most successful (in terms of IMDB ratings)?" . So I was able to create this data set with Actor - Director pairs and their ratings in movies. But clearly I cannot judge which pair is best without taking into account the number of movies they have did together. Any recommendation on how to deal with this?
polar acorn
@cunning wadi Sure
cunning wadi
Cool
I'm new to this kind of stuff and was wondering what I'm missing here cause something is clearly wrong
polar acorn
What do you suppose is wrong there? I mean cells 6-8 apparently do nothing at all. As for the results, we don't really know your data, a 98% accuracy might be nothing out of the ordinary.
cunning wadi
Let me try and clean it up a bit
Maybe this makes more sense
My question is how do i increase the accuracy?
polar acorn
Yes that makes more sense :D. One thing you can check is how well your model predicts the training data. If your training data accuracy is very high but the test data accuracy is very low. You might suffer from overfitting, in which case you can limit the maximum depth of your decision tree. If both testing and training are bad maybe you would want a deeper tree, then again maybe thats the best you model can give you for that data. Looking into overfitting is probably where I would start at least.
flat bough
hi, I want I to get familiar with machine learning. Can you recommend the best way to start
fervent bridge
Sentdex on youtube has some good courses. @flat bough
flat bough
Thank you
fervent bridge
Building my portfolio my code is running for approximately 30 hours to gather first touched data so excited 🙂
lapis sequoia
hey guys can anyone tell that which course is best to start in data science out of these two?
https://www.coursera.org/specializations/jhu-data-science?siteID=OyHlmBp2G0c-0328ZKV34mF3.yMgOBpdWA&utm_content=2&utm_medium=partners&utm_source=linkshare&utm_campaign=OyHlmBp2G0c
Coursera
Learn Data Science from Johns Hopkins University. Ask the right questions, manipulate data sets, and create visualizations to communicate results. This Specialization covers the concepts and tools you'll need throughout the entire data science ...
Coursera
Learn Applied Data Science with Python from University of Michigan. The 5 courses in this University of Michigan specialization introduce learners to data science through the python programming language. This skills-based specialization is ...
i have learned python but dont know R language
fervent bridge
I was looking at Data from Github and I saw that R was not widely used as other languages.
deft harbor
@flat quest mix of custom convolution layers in the generator and discriminator. The gan model itself is trained using python train_on_batch loops.
flat quest
gotcha,
yeah its something i'll have to look into pretty soon
Trying to find better ways to deal with categorical data, it has to be in numbers, but ordinal data represents relationships that don't exist, same with one-hot (although its better)
@cunning wadi ya ur definitely overfitting, use the tree parameters to limit the depth / nodes of the tree
And then try using ensemble methods (xgboost is prob ur best choice here) to try to further increase accuracy.
umbral aspen
I am still struggling to find simple examples of using tensorflow to classify a lot of images at once. Should I just loop through all files and classify them one by one? I also tried the predict_on_batch method, however that only returns one result for the entire numpy array of images I send to it...
Anyone have any ideas?
flat quest
tf models take batches by default u can just use the predict method
no use batches, it has better performance
create a tf dataset or do it manually
but run a for loop and each iteration get a batch of elements. Feed those elements using model.predict
and u'll get a batch of predictions
 glad obsidian
Is this the right place to ask questions about python especially juypter notebooks ?
umbral aspen
@flat quest Thanks I will try that!
glad obsidian
I#m currently working on a knn-algorithm
Got a function which produces a list like that,
label are values like 0, 0.3232, 1 ,....
now i want to count every label based on its occurence
and save the label with the highest occurence as a new variable
I am only allowed to use numpy, itertools, pandas and maths
[([Vector1], dist, label), ([Vector2], dist, label), ([Vector3], dist, label)]
Heres an example output for 1 Vector:
([0.2711736617240513, 0.014151057562208049, 0.125], 0.0, 0)
Desired Output:
1: 30 , 0.2: 4, 0: 3
a =1
@flat quest The predict method also seems to only return one prediction even when I pass an array. Any ideas?
images = []
files = os.listdir('../img/raw/category')
for i in range(len(files)):
    img = cv2.imread(f'../img/raw/category/{files[i]}')
    img = cv2.resize(img, (224, 224),3)
    img = np.array(img).astype(np.float32)/255.0
    img = np.expand_dims(img, axis=0)
    images.append(img)

predictions = new_model.predict(images)
check the shapre of the images
and whats the input shape of the model? It should be (None, input_dims, ...)
The None is the batch_shape
umbral aspen
My input shape was input_shape=(224, 224, 3)
flat quest
hmmmm and whats the shape of the images array?
lapis sequoia
any pandas experts here?
umbral aspen
Hmm not sure how to really see that...I do know that it works if I use predict on the individual images though...
I am fairly new to ML
lapis sequoia
does anybody have any idea why pandas reads everything as columns and no rows in this situation?
umbral aspen
that looks like one string
loaded into the first cell of the dataframe
Show us the source of where you create your data frame and we can check
lapis sequoia
ait ill send link now
basically nasdaq stockholm
Historical prices
and you can download the csv file below
@umbral aspen forgot to tag u
umbral aspen
Can you add your code
lapis sequoia
umbral aspen
Your code looks fine - I also just ran the same on my side and it is creating a dataframe and intepreting the columns correctly
umbral aspen
It is the exact same as yours 🙂
lapis sequoia
even more confusing
@umbral aspen can you do me one more favour?
can u open up the csv file in a text editor so i can see how it looks like from your side?
and just screenshot
flat quest
@umbral aspen try converting ur list to an np.array and calling the .shape property on the np array
umbral aspen
this is the shape (189, 1, 224, 224, 3)
@lapis sequoia It looks like this
sep=;
Date;Highprice;Lowprice;Closingprice;Averageprice;Totalvolume;Turnover;
2020-05-06;1,537.55;1,520.71;1,521.40;;1;;
2020-05-05;1,539.40;1,515.41;1,538.18;;1;;
2020-05-04;1,531.99;1,505.21;1,505.21;;1;;
2020-04-30;1,606.80;1,577.90;1,577.92;;1;;
2020-04-29;1,602.34;1,559.63;1,600.86;;1;;
2020-04-28;1,571.31;1,538.26;1,568.50;;1;;
2020-04-27;1,543.42;1,528.14;1,539.51;;1;;
2020-04-24;1,529.19;1,511.28;1,514.13;;1;;
2020-04-23;1,547.48;1,512.68;1,541.89;;1;;
2020-04-22;1,527.69;1,503.30;1,527.63;;1;;
2020-04-21;1,525.60;1,493.45;1,493.45;;1;;
2020-04-20;1,548.68;1,518.12;1,541.17;;1;;
2020-04-17;1,536.84;1,520.72;1,534.55;;1;;
2020-04-16;1,499.91;1,469.14;1,483.79;;1;;
2020-04-15;1,534.41;1,478.82;1,480.60;;1;;
2020-04-14;1,538.91;1,516.50;1,535.84;;1;;
2020-04-09;1,526.95;1,495.79;1,498.76;;1;;
2020-04-08;1,502.88;1,485.02;1,499.51;;1;;
2020-04-07;1,514.17;1,483.19;1,510.85;;1;
no problem
delicate rune
Hi guys I'm working on a worldmap with 'folium' it works perfectly with my needs but if there is any other library in python that does the same job or a better job then 'folium' tell me!!
flat quest
yeah @umbral aspen that image shape doesn't coincide with the input_shape thats expected
the model expects an input_shape of (batch_size, 224,224, 3)
u have an extra 1 there
umbral aspen
So would batch_size be the amount of photos I want to predict the classification for
Or the batch_size I used to train?
flat quest
it can be any
it doesnt really matter, tho its preferred to use the same batch_size that u used during training
lapis sequoia
So I have one column in pandas, and I want to split it in half and put them side by side in a new excel sheet
I'm up to the point where I have them side by side, but there is a gap of empty cells, does that makes sense
How do I slide up the first two columns so they are at row 0?
without using the names of the columns, I only want to use the numbered names of the columns if that makes sense
 surreal ivy
does anybody have any idea why pandas reads everything as columns and no rows in this situation?
@lapis sequoia show us the command.
lapis sequoia
i just found a similar dataset with better formatting tbh lol.. appreciate the help tho
unreal thistle
hello guys
sorry for bothering
can someone explain to me how i can choose the learning rate epoches and batch for a machine learning process
?
lapis sequoia
@unreal thistle i know nothing about this, but have you tried asking for help in the "help" rooms?
unreal thistle
@lapis sequoia i solved it thanks anyway 🙂
 woven saffron
import tensorflow as tf

(x_train, y_train), (x_test, y_test) = tf.keras.datasetsmnist.load_data()

x_train, x_test = x_train / 255.0, x_test / 255.0

model = tf.keras.Sequential([
    tf.keras.layers.Flatten(input_shape=(28, 28)),
    tf.keras.layers.Dense(128, activation='relu'),
    tf.keras.layers.Dropout(0.2),
    tf.keras.layers.Dense(10)
])

loss_fn = tf.keras.losses.SparseCategoricalCrossentropy(from_logits=True)

model.compile(
    optimizer='adam',
    loss=loss_fn,
    metrics=['accuracy']
)

model.fit(x_train, y_train, epochs=5)

model.evaluate(x_test, y_test, verbose=2)

model.summary()
model.save('mnist.model')


probability_model = tf.keras.Sequential([
    model,
    tf.keras.layers.Softmax()
])

probability_model.save('mnist_probability.model')
I have the following code, I can properly do predictions with the probability model generated and it gives me correct output, and I can save the probability model. However, when I load the probability model I get the following error: ValueError: An empty Model cannot be used as a Layer.. Anyone know why?
If needed I can just construct this model where I load it and call it a day
This code is straight off tensorflow website
flat quest
how are u loading the model? can u show the code for the loading part?
woven saffron
# Load model
model = tf.keras.models.load_model('mnist.model')
pmodel = tf.keras.models.load_model('mnist_probability.model')
Top one works
Bottom one doesn't
It is only the probability model
Is it because probability depends on another model?
And somehow I need to save that model within it?
flat quest
i dont think so
hold on
woven saffron
Oh wait
I need to do compile=False I think
@flat quest
It is a load_model kwarg
flat quest
yea maybe, try that
woven saffron
Nvm still not working
Traceback (most recent call last):
  File ".\app.py", line 11, in <module>
    pmodel = tf.keras.models.load_model('mnist_probability.model', compile=False)
  File "C:\Users\Ryan\AppData\Local\Programs\Python\Python37\lib\site-packages\tensorflow_core\python\keras\saving\save.py", line 150, in load_model
    return saved_model_load.load(filepath, compile)
  File "C:\Users\Ryan\AppData\Local\Programs\Python\Python37\lib\site-packages\tensorflow_core\python\keras\saving\saved_model\load.py", line 86, in load
    model = tf_load.load_internal(path, loader_cls=KerasObjectLoader)
  File "C:\Users\Ryan\AppData\Local\Programs\Python\Python37\lib\site-packages\tensorflow_core\python\saved_model\load.py", line 541, in load_internal
    export_dir)
  File "C:\Users\Ryan\AppData\Local\Programs\Python\Python37\lib\site-packages\tensorflow_core\python\keras\saving\saved_model\load.py", line 103, in __init__
    self._finalize()
  File "C:\Users\Ryan\AppData\Local\Programs\Python\Python37\lib\site-packages\tensorflow_core\python\keras\saving\saved_model\load.py", line 127, in _finalize
    node.add(layer)
  File "C:\Users\Ryan\AppData\Local\Programs\Python\Python37\lib\site-packages\tensorflow_core\python\training\tracking\base.py", line 457, in _method_wrapper
    result = method(self, *args, **kwargs)
  File "C:\Users\Ryan\AppData\Local\Programs\Python\Python37\lib\site-packages\tensorflow_core\python\keras\engine\sequential.py", line 170, in add
    batch_shape, dtype = training_utils.get_input_shape_and_dtype(layer)
  File "C:\Users\Ryan\AppData\Local\Programs\Python\Python37\lib\site-packages\tensorflow_core\python\keras\engine\training_utils.py", line 1776, in get_input_shape_and_dtype
    raise ValueError('An empty Model cannot be used as a Layer.')
ValueError: An empty Model cannot be used as a Layer.
Full traceback
flat quest
hmm works for me when I run the code
flat quest
yeah
woven saffron
did yours stop working?
flat quest
nah i was wondering why u were using tf.keras.sequential
instead of tf.keras.models.sequential
but it worked for ur initial model so that shouldnt be an issue
woven saffron
Oh yeah
Idk if they just bring it up a layer
Or if its different
Lemme change it to be safe
Yeah same error for me
flat quest
does the code work if u take out the load_model for the second model?
woven saffron
Yeah
I am using tensforflow version 2.0.0 and python 3.7.7
Hbu?
Ultimately I just need the confidence values given by predict
However whenever I use a single model and change the activation of the last layer to softmax
I get incorrect outputs
flat quest
pretty much same versions im using tf 2 as well
u could always change the logits to probability directly urself, using the conversion equation e^yi / sum(e^yj)
but it should work normally
can u check if there is a folder thats created called probability_model and check the contents inside of it?
or mnist_probability.model
flat quest
hm, somehow the original model is empty
What does it say when u run model.summary() on the probability model?
woven saffron
Model: "sequential_1"
_________________________________________________________________
Layer (type)                 Output Shape              Param #
=================================================================
sequential (Sequential)      (None, 10)                101770
_________________________________________________________________
softmax (Softmax)            (None, 10)                0
=================================================================
Total params: 101,770
Trainable params: 101,770
Non-trainable params: 0
_________________________________________________________________
and u can run it as expected?
woven saffron
Correct, here is some output
[[3.80928800e-09 1.10353615e-10 1.40276351e-08 2.80762464e-02
  8.11891407e-20 9.71923769e-01 2.31030445e-13 3.15607471e-11
  2.01315395e-10 1.41472851e-08]
 [9.99963284e-01 9.15403656e-11 3.66451968e-05 3.89118000e-08
  3.50633727e-14 1.38634775e-08 2.98542346e-08 1.21814037e-09
  3.78561360e-09 6.25292316e-08]
 [2.68988494e-08 2.68716594e-05 3.06581824e-05 2.91746710e-05
  9.99746859e-01 3.31298179e-06 2.84864218e-05 8.04476658e-05
  4.74372700e-06 4.93127300e-05]
 [4.18286461e-10 9.99978781e-01 1.48045337e-05 3.34784325e-08
  5.45938263e-08 2.90107138e-08 3.23322631e-08 5.08780204e-06
  1.27303042e-06 2.15702745e-09]
 [1.18402343e-10 3.49863080e-06 2.44232268e-07 2.54041806e-05
  7.62854412e-04 2.78798484e-06 2.42455744e-09 4.18028831e-05
  1.83790416e-05 9.99145031e-01]]
I predicted the first 5 items from the training set
flat quest
gotcha
woven saffron
I might just build the model in the app where I load the non-probability model
worldly elm
How do I slide up the first two columns so they are at row 0?
@lapis sequoia iterate using the df.loc() method through each row of that column, make its value equale to the +6 row, then remove the last 5 rows.
unreal thistle
guys sorry for bothering again i just try to undertand some things so i've seen this deep learnig model and he is constructing the head of the model that will be placed of on top of the base model
what does it mean
?
woven saffron
it adds an additional layer to the model
flat quest
yeah its really weird, cause there's no problems when i run it and our package versions are the same
woven saffron
im assuming you're on windows?
flat quest
im on a mac rn
but im using colab
woven saffron
Can you explain to me what an EagerTensor is?
flat quest
eagerexecution?
flat quest
yeah basically a tensor within an eagerexecution environment
unreal thistle
@woven saffron why is the head of the layer needed in training?
woven saffron
So drag
I was doing this before
prediction = pmodel(digit_data)
confidence = prediction.tolist()[0]
However now I am getting this error
AttributeError: 'tensorflow.python.framework.ops.EagerTensor' object has no attribute 'tolist'
The output type of my prediction has changed
flat quest
it just means that instead of placeholders, the outputs are directly displayed
in tf 1.x, everything was done inside a session, so all variables were placeholders, and outputs were placeholders as well, until we actually ran the session
anything in 2.x should default to an eager exeuction environment
just convert the values to numpy using .numpy()
woven saffron
Ah I see
If I do a single prediction
Will it still give me back a 2d array?
Of length 1
flat quest
yeah
flat quest
np
woven saffron
My model has a 98% accuracy but when I sent it a 1
It predicts 3
That is pretty strange
flat quest
u sent it a 1? what do you mean
woven saffron
It is the mnist dataset of hand drawn digits
flat quest
ah
woven saffron
I think I know why it is doing that though one sec
woven saffron
I was doing np.argmax(prediction)
Instead of on the first numpy array
prediction.numpy()[0]
I think that mightve screwed it up
 prediction = pmodel(digit_data)
 confidence = prediction.numpy()[0].tolist()
 highest = np.argmax(confidence)
yeah, easier way to do it is just run it on the last axis, so it can work with any batch size
woven saffron
This is my code
I am turning it to a list because the data is being returned in an API
So it needs to be JSON safe
woven saffron
prediction = pmodel(digit_data)
highest = np.argmax(prediction, -1)
``` like this?ya
if ur using a batch size of one the result will still be a 2d array, so u can remove extra dims if u want using [0]
woven saffron
Yeah unfortunately the prediction is still wrong
Same value
{'confidence': [1.6521667149409522e-18, 2.794477973674936e-12, 0.002019522013142705, 0.9946495890617371, 0.0, 0.002819732530042529, 2.1464751850941433e-11, 0.0005111345089972019, 3.013474395628175e-32, 9.863308066247621e-36], 'prediction': 3}
Here is the image