#data-science-and-ml
1 messages · Page 221 of 1
 daring locust
 lament cargo
@daring locust can you print to pdf?
 bronze cipher
You can use a pastebin
Then just link it
Oh nvm
It's a jupyter notebook
Thought it was a datafile
 ancient quiver
do I need to get a new computer to do Data Science?
ancient quiver
No, I'm not worried about that. I'm worried about computer resources and processing power.
bronze cipher
Well your consumer laptop can do pretty much everything you need provided your not dealing with enormous data sets
An average laptop is still viable
ancient quiver
https://www.quora.com/Whats-the-best-personal-computer-for-data-science this seems like BS, I don't know
I don’t think it is required like “gaming laptop”. You can even use i3 cpu/4GB RAM laptop for your needs. Because you don’t work whole big data in your local system. It is like “controlled-experiment” which means you take some data and build your ...
bronze cipher
It depends what kind of data you're working worth
But I'm pretty sure you dont need a whole new computer for that
ancient quiver
@bronze cipher worst case scenario you're working with Big Data, shouldn't we be accessing that data via AWS or Azure instead, right?
opposed to loading it on your computer.
bronze cipher
I'm not sure
ancient quiver
I have an old i5 2nd generation with 16gb, 128SSD and 1 TB, I don't think I need a new computer
16gb of memory
bronze cipher
You're specs are more than required
bronze cipher
No problem
 vestal tiger
is anyone familiar with plotly and can tell me why my dates are causing an error?
 gentle depot
Hello
I'm new to plotly as well, does anyone know about a method to add a trendline to a boxplot?
I already searched internet but no answer found.
Also I have the idea to add a px.scatterplot to my 3 boxplot traces but unsurprisingly it doesn't work just like that
 slate yacht
Hey guys, quick question: Does anyone know of a python module that can scrape text from pdf documents?
they are strict image files, no text is able to be highlighted
gentle depot
then you probably need an ocr
slate yacht
could you elaborate please?
 worldly ruin
can you use an or inside a .loc statement?
specifically for something like if x == y and (a == b or a == c)
 dapper canopy
Hey guys (and girls also) ! I got an error downloading Anaconda. Let me explain step by step : 1) I download windows 64 bits installer (I'm on win 10) 2) I launch the exe 3) I follow the steps, don't do anything, just accept and run it 4) It says "space required : 3Gb, space disponible : 41Gb" 5) It installs Anaconda really fast 6) When I start _conda.exe, the only exe (with the uninstaller), a cmd appears, writes some lines and closes. Just that, nothing else.
My Anaconda 3 folder says "466Mb", not 3Gb at all... Coincidence ? My installer weights also 466Mb... Did it just extract the installer or something ?
Guys on other forums that have Anaconda told me I got less than half of the files. How could I download it properly ? Where is the problem located ? The computer ? The installer ? Something else ?
Thank you so much if you can help, have a nice day ! And don't hesitate to ping me, this is better, else I won't see your answer
 red hound
Have you checked if there is anaconda already installed?
also how big is the anaconda download file??
 lapis sequoia
Hello I am having EEG analysis desktop app project. Pls help me with issues. I want to count peaks of EEG selected signals per 1 second
lapis sequoia
Pls nobody helps me
dapper canopy
@red hound nah I've never touched to anaconda before, and the download file is 466mb
red hound
hmm not sure then havent had that problem
have you tried launching it from the start menu
it doesnt necessarliy have to be 3gb applications tend to increase that requirement a bit
daring locust
This might be a silly question but I am getting confused on when to use () and when to use []
Is there a easy way to remember this?
 jolly briar
@daring locust can you give an example?
(it's not a silly question)
here's an example
In [1]: [x for x in range(2)]
Out[1]: [0, 1]

In [2]: (x for x in range(2))
Out[2]: <generator object <genexpr> at 0x112875950>
here's another
In [3]: def f(x): return x + 1

In [4]: g = [1,2,3]

In [5]: f(1)
Out[5]: 2

In [6]: g[1]
Out[6]: 2
it's not clear what you're referring to though
red hound
@jolly briar what happens if you do f[2]
jolly briar
@red hound try it
red hound
[2] i think are for lists
jolly briar
@daring locust i think the answer will likely be to either give an example or to get used to it
if you're learning then it's probably best to just accept that there are some things which are done and you have to get used to them in practice, rather than trying to understand everything in depth.
daring locust
Yes I am thinking of the same
I think just practicing will make me get used to it
jolly briar
then they can be looked into in more depth later if needed, often it doesn't seem so important at that stage tho 😄
daring locust
alright 🙂
jolly briar
it can be frustrating though, things like indexing etc are confusing at first
 vital plume
I work a lot with JSON files for storing analysis data. I've often wondered (as I'm self taught mostly) if this is an incredibly naive or dumb. Should I be looking at other ways of storing data particularly for use between sessions or executions of a program?
jolly briar
@vital plume idk... json is nicer than pickle if possible, imo, as it's plain text
something like csv might be easier? idk what the output is though
vital plume
Mainly, I feel inadequate for not knowing more traditional databases so I'm wondering what people out there use
jolly briar
stuff i use is pretty naive as well i think, typically csv files, name-spaced by whether they're original data, part cleaned, or output, and then that dir is usually rsyned up to google cloud
so, there's not really anything particularly fancy...
daring locust
See,
I was just solving a problem and I wrote such a wrong code, I am getting confused
Do I just keep on practicing? @jolly briar
wrong - sal.groupby[sal["Year"]][sal["BasePay"].mean()]

right - sal.groupby('Year').mean()['BasePay']```@daring locust do you have a sample of the data? df.to_json( ) and a snipped that can be used to test with
daring locust
yes
jolly briar
here's an example groupby
In [2]: df.groupby('Sex')['Fare'].mean()
Out[2]:
Sex
female    28.460639
male      27.912998
Name: Fare, dtype: float64
One more question. When I say,sal.groupby('Year')
Why is it not sal.groupby['Year']
jolly briar
because you're calling a function
In [3]: type(pd.DataFrame.groupby)
Out[3]: function
is there a comprehensive guide on the differences between functions, methods, class objects of python
I think I lack a basic understanding of these
I read a lot but could not grasp the basic definition of those
as this is my first programming language, I am struggling with the basics
jolly briar
is there a comprehensive guide on the differences between functions, methods, class objects of python
probably... it's something that i never get confused but couldn't give a good technical explanation of , because it's just habit
as this is my first programming language, I am struggling with the basics
are you familiar with excel and stuff?
what is your background ?
jolly briar
ok, so you're familiar with data, pivots etc, that's good
daring locust
yeah
daring locust
😄
jolly briar
you call a function with (), you index a list with [ ]
daring locust
here, df.groupby('Sex')['Fare'].mean()
Why is sex in () and Fare in []
groupby is a function right?
jolly briar
groupby is a function, yes - here I'm only grouping by a single feature, we could have used multiple though
In [6]: df.groupby(['Sex', 'Cabin'])['Fare'].mean()
Out[6]:
Sex     Cabin
female  B28             80.0000
        B78            146.5208
        C103            26.5500
        C123            53.1000
        C2              66.6000
        C23 C25 C27    263.0000
        C85             71.2833
        D33             76.7292
        D47             26.2833
        E101            13.0000
        F E69           22.3583
        F33             10.5000
        G6              16.7000
male    A5              34.6542
        A6              35.5000
        B30             61.9792
        B58 B60        247.5208
        B86             79.2000
        C110            52.0000
        C123            53.1000
        C23 C25 C27    263.0000
        C52             35.5000
        C83             83.4750
        D10 D12         63.3583
        D26             77.2875
        D56             13.0000
        E31             61.1750
        E46             51.8625
        F G73            7.6500
        F2              26.0000
Name: Fare, dtype: float64
sorry that's a bit long
jolly briar
mean is a function yes
daring locust
then why is Fare in [] and not ()
jolly briar
In [7]: type(pd.Series.mean)
Out[7]: function
because there I am indexing the groupby ( re Fare )
If I don't index there then I will get .mean( ) of all variables in the grouped data, here I just wanted to demonstrate for Fare though
daring locust
I see
so that ['Fare'] is for df
am I right?
and ['Sex'] is for groupby function of df
jolly briar
yes, like if you were to do df['Fare']
daring locust
perfect, tyty 😄
jolly briar
and ['Sex'] is for groupby function of df
yes, and you can see all available using dir ( )
daring locust
last question
daring locust
what if I write:
df['Fare'].groupby(['Sex', 'Cabin']).mean()```df = pd.read_csv('https://raw.githubusercontent.com/agconti/kaggle-titanic/master/data/test.csv')
will get you this data btw
jolly briar
@daring locust you will be trying to .groupby a series
because if you index a single variable from a dataframe it will return a series
In [12]: type(df['Fare'])
Out[12]: pandas.core.series.Series
I see, I see
jolly briar
groupby is a method in there ( you can see in dir ), but you wouldn't have the Sex information there, because you'd just selected the single column
daring locust
yes cause it will turn to a series before groupby
jolly briar
I have never actually used groupby with a series 🤔 there's probably a good reason for it tho ha
yes cause it will turn to a series before groupby
yeah - so you'll be trying to group by information that's not there basically
daring locust
I am starting to understand, ty rie
jolly briar
so you'll get a KeyError
jolly briar
I am starting to understand, ty rie
np, imo you just have to bumble through, as you are... by trying examples and stuff.
rather than trying to find something too formal, then maybe later if it's still a concern try formal
probably won't care by then though 😄
daring locust
alright 😄
lapis sequoia
Pls how to count peaks of EEG signals in python?
 eternal sentinel
hey guys im trying to make an implementation of entropy and information gain. but the problem i having is a starting point
can anyone help me out please
 worn stratus
You could have a look around at the source code for various libraries that implement it - I know scipy has an entropy function, sklearn probably has it somewhere
daring locust
def cnt(x):
    count=0
    if "chief" or "chief," in x.lower():
        count=count+1
    else:
        count = count
    return count

sum(sal['JobTitle'].apply(cnt))

answer = 15000
---------------------------------
def chief_string(title):
    if 'chief' in title.lower():
        return True
    else:
        return False

sum(sal['JobTitle'].apply(lambda x: chief_string(x)))

answer = 627```can you tell the difference between this two? @jolly briar
lapis sequoia
Charlie pls help me with EEG signals to count peaks of all signals and selected signals?
daring locust
if you are free, sorry for bothering
jolly briar
@daring locust if you're counting things there's a count method as well as a size method that might be more useful
daring locust
The question said "How many people have the word Chief in their job title? "
This is the database.head()
I am confused on why did the second solution include Lambda other than just directly applying the function from the top?
the one with the lambda is correct
jolly briar
@daring locust hrm
btw there's .sum( ) you can use for method chaining rather than wrapping with sum( ) @daring locust
also you don't need to catch the , for string matching (unless you want to exclude chief)
daring locust
alright 🙂
jolly briar
@daring locust it's tricky to do an example from a picture, but you can do stuff like
df['Name'].str.contains('miss', case=False).sum()
to find out how many passengers have miss in their name (using the data linked from earlier)
if there were multiple entries of the same name you could do
df.groupby('Name')['Name'].transform(lambda x: x.str.contains('miss', case=False)).sum()
this does feel kinda messy though, I'm sure there's a nicer approach
df['Name'].drop_duplicates().str.contains('miss', case=False).sum()
that's better
@daring locust 👆
@daring locust you could also do something like
len([x for x in df['Name'] if 'miss' in x.lower()])
no worries, list comprehensions might look a bit messy atm but they're good to see and use
daring locust
I am good with list comprehensions
The only thing that bothers me is the () and [] and which function comes after which
jolly briar
note - this is using the data that i linked earlier, the titanic thing
jolly briar
all good..... for [] and () most cases are going to be covered by using ( ) for a function and [ ] for indexing
daring locust
alright 😄
jolly briar
if you're finance quantopia is meant to be good, i've not looked through tho
daring locust
yeah for now I am using the datasets from a Jose Portilla course I am doing from udemy
idk if you know about this guy but he is quite good
simultaneously I am doing the andrew ng coursera course
is quite good
jolly briar
@daring locust cool - idk those datasets but it's handy for others if they can access the data (is the data open? or just on the couse)
i've heard v good things about the ng course! never bothered though ha
daring locust
the ng course is amazing, it's a bit overwhelming for me, so I am taking it slow
and these datasets are only downloadable from udemy and cannot be accessed by everyone
I have the files through, if you need it
 pulsar bear
Hi there
I'm quite new to python I started like two months ago or so, I learnt classes from Corey Shafer and I'm getting a little bit into recursion, even though I'm still being a novice
I'm heavily intrested in data science. Should I wait some time or go for it? If you think I should start rn, what course/book do you recommend for me?
daring locust
@pulsar bear how good are you with data types and data structures?
Normal lists, tuples, arrays, dictionaries, series
I'm a beginner too btw but I might help you here
eternal sentinel
the one i seen are using library functions is there anyone that know how to do it this way def entropy(feature, dataset)
eternal sentinel
???
jolly briar
@pulsar bear if you're not sure then just have a look and see if it's ok... no one else can answer really
what course/book do you recommend for me
depends what you want to learn\
 mighty kiln
Hey I wanted to know how to make an audio dataset for a RBM
mighty kiln
So how would I do that
mighty kiln
Nvm
 agile anvil
Can anyone please figure out the number of tests per day necessary to obtain statistically significant results for the US?
 placid gate
hey guys, i'm trying to remove numbers within a specific area of a string, any clue
could not convert string to float: '-0.30038957 (2109.78 )'
that's the error i get, i'm guessing i need to remove the ( ) but i'm having trouble doing so
also, i would like to be able to do this while iterating through a data base, any tips?
placid gate
nvm, figured it out using import re functionality
 mild topaz
Hi is their anyone familiar with Image recognition model building? I want to know which layers we should use? what optimizer and loss function we should use while building a model?
red hound
i am using pyplot to graph atm and want to know if there is any other way to have an iterator on scalex or scaley
plt.plot(it, x, 'ko-')```
is there a way to make a plot without `it`so it is not needed at all it does it automatically
daring locust
is there a way to practice python data structure problems?
any websites, apps or anything
just want to be good at it
lapis sequoia
Hello all I want to count signals per 1 second of EEG. In project I am using .edf file. My count function not works
 uncut shadow
@red hound and why would you like to have it without this it?
@red hound but If I understand right, the answer is no
red hound
@uncut shadow i was just following my professor he seems to have a background in C so everything is kinda meticulously defined
like making a list with enough spaces and filling them with zeroes before hand or making an array for the pyplot
 main narwhal
@red hound You wanted to use iterator for pyplot?
red hound
@main narwhal found out you dont really need one if i only need a simple ascending set of numbers
red hound
does numerical analysis count as data science?
daring locust
when I do this, the graphs are getting plotted,
x = np.linspace(0,1,11)
y = x**2

fig,axes = plt.subplots(nrows=1,ncols=2)

for current_ax in axes:
current_ax.plot(x,y)```but when I do this,
x = np.linspace(0,1,11)
y = x**2

fig,axes = plt.subplots(nrows=2,ncols=2)

for current_ax in axes:
current_ax.plot(x,y)```I get an error saying,
'numpy.ndarray' object has no attribute 'plot'
Can someone help me with this?
lapis sequoia
Pls help me to count EEG signals peaks
jolly briar
@daring locust try printing out type(current_ax) in the loops and see if they're the same
@daring locust briefly - If you're getting an array of plots then each element will be a numpy array, not type matplotlib.axes._subplots.AxesSubplot.
To see this, within each of these for loops comment out the plotting and put print(type(current_ax)).
Also, for each of these have a look at the structure of axes, notice that on the 2x2 arrangement you have an array of arrays containing matplotlib.axes._subplots.AxesSubplot objects, whereas on the 1x2 plot you have an array containing matplotlib.axes._subplots.AxesSubplot objects.
An easy way to handle this is to use .flatten(), so replace what you have in the send instance with for current_ax in axes.flatten():.
To see what flatten does have a look at :
x = np.random.randint(0,5, (3,3))
print(x)
print(x.flatten())
 tacit vapor
Is anyone in here an ETL-focused data engineer?
vital plume
I have a bunch of inputs that operate on a file and produce some outputs. Say I want an algorithm to find the the inputs that satisfy the outputs without iterating over every possibility... what kind of problem is that? A neural network?
 kind steppe
Hi, guys. I am a Data Scientist worked in Tokyo. I am looking for an assistant.
If you 're interesting, let 's chat in PM.
 cunning osprey
Hey, does anyone here use fbprophet?
Ive been doing a covid-19 forecast project in my freetime, and idk, it just feels like prophet doesnt really capture exponential growth too well
 oblique belfry
Found a lovely paper describing good augmentations for object detection. https://arxiv.org/pdf/1906.11172.pdf
Also found a nice repo that implements these in an easy-to-use way. Since it is based on imaug, it is easy to use with TF, Pytorch, or Mxnet. The TF linked is pretty intense. Nice library that makes things easier. https://github.com/harpalsahota/bbaug

GitHub
Bounding box augmentations for Pytorch. Contribute to harpalsahota/bbaug development by creating an account on GitHub.
 shrewd trellis
hey any idea whats going on, i try few network for my image classification problem, when i use VGG-16 i get around86% accuracy, but when i use Resnet50 , my validation accuracy doesnt move at all
and i end up training with a 48% accuracy which i have no idea why since i had 14% whole training
same situation for Resnet34
shrewd trellis
alright i have something : i was using the wrong preprocess_input function in my imagegenerator
still weird i only have 48% accuracy
 idle horizon
Had a question about optimising in pandas. https://stackoverflow.com/questions/61197148/find-jaccard-similarity-of-list-strings-one-of-of-wich-is-a-pandas-data-row

Stack Overflow
I want to find the jaccard similarity of two list of strings. One of Lists is a list of sentences and other is generated by splitting the text in a pandas column.
The first list is pretty small...
 silver pulsar
Is there anyone around to help with a dbscan assigment?
oblique belfry
Has anyone used Intel's OpenVino to deploy their models? I am curious about what you think about the platform.
 trail pagoda
Is anyone here good with pytorch
I'm trying to implement an adversarial loss and I'm unsure how to do so
basic schematic is I have some encoder E that feeds into some discriminator D. I need D to independently maximize some loss function F while E minimises it
if I can write it in such a way that it's a single forward function that outputs E and D seperatly that would be greatly useful
 balmy ferry
Hi all, I am a student looking for a kafka cloud platform with PySpark. Please let me know if there are FREE clusters service where I can experiment.
 worn chasm
Had a question about optimising in pandas. https://stackoverflow.com/questions/61197148/find-jaccard-similarity-of-list-strings-one-of-of-wich-is-a-pandas-data-row
@idle horizon
Try this:
found_products = []
data = pd.read_csv("./data/flipkart_processed.csv", usecols=["product_name"])
product_words_arr = data["product_name"].str.split(" ")
for phrase in keyprase_list:
    words = phrase.split(" ")
    for y in product_words_arr:
        if jaccard_similarity(words, y) > min_similarity:
            found_products.append(phrase)
            break

return found_products
Stack Overflow
I want to find the jaccard similarity of two list of strings. One of Lists is a list of sentences and other is generated by splitting the text in a pandas column.
The first list is pretty small...
idle horizon
@worn chasm This is now regular loop isn't it? It's shorter because We don't loop over the whole thing but we lose the benefits of liat comprehension. I was thinking of the another way to vectorise both so they can be use easily. Is there an internal pandas function that can do this.
 rich reef
Greetings, I have a really simple question that I know must have an easy solution but I just cannot find the right built-in in the pandas docs.
I have a DF with two columns holding floats, A and B, and row labels. I want to create a n*n DF that has those row labels at both the rows and the columns, and each element being the sum of df[A][label1] + df[B][label2]
These sums are used in a dual annealing run so recalculating them every iteration is a time waste, lookup is quicker.
Is there a convenient built-in for this, or am I stuck with a for-loop?
This is what I want, essentially, but at a bigger scale.
mild topaz
Hi guyz I am having a model for image classification. I am using "passport images" & "driving liscence " images. When I make predictions using "cat image " it is predicting it as a "passport image" how i fix this issue? Also how to get accuracy on predicted image?
lapis sequoia
Hello I need help.I am working with desktop app in pyqt5. Have several issues - wrong function counting EEG signals per 1 sec-need count all signals and selected. Also have trouble making CRUD automatic commenting in graph and need to implement app state save like workspace, save workspace and load it later
uncut shadow
@mild topaz well, I don't know much about your problem without the code, but assuming you have 2 output neurons and using softmax you can only predict 2 different classes so network will always have to choose between driving license or passport image even if it's an elephant
mild topaz
@uncut shadow hey
uncut shadow
ummm... hello
mild topaz
hi can i share my code to u?
uncut shadow
Yeah
worn chasm
@worn chasm This is now regular loop isn't it? It's shorter because We don't loop over the whole thing but we lose the benefits of liat comprehension. I was thinking of the another way to vectorise both so they can be use easily. Is there an internal pandas function that can do this.
@idle horizon List comprehension is just like map or for-loop. Depend on the requirement, we can use it. Here are two shortcuts.
1- data["product_name"].str.split(" ") is a series (or array), you do not need redo this for every phase comparation
2-shortcut the found item is matched or not
Vectorize operations: you can use numpy (panda is built on top of numpy).
idle horizon
@worn chasm thanks, I'll look into it.
 hardy harness
Hey guys. I'm trying to implement multiclass logistic regression for text classification
and my functions seem to be working fine, but for some reason the weights of the first class don't get updated. The error of the first class will actually go up during training
I assume this is quite vague as stated, I could share my code
 hybrid tendon
hey, I need a little help with matplotlib
fig = plt.figure()
    xaxis = np.arange(0,40,4)
    prices = getprices()
    plt.axis([40,0,0,100])
    plt.ylabel('Price of stock ($)')
    plt.xlabel('Time since last update (min)')
    plt.title('Commodity price index')
    plt.style.use('dark_background')
    plt.plot(xaxis,prices["gold"])
plt.savefig('filelocation.png')```this is my code.
this is the output
everything works fine when I remove the plt.style.use... line
some help, please?
weirdly, it worked just fine until about half an hour ago. the code is unchanged, and this is how the output used to look like
please tag me if/when you respond
prices["gold"] = {"gold": [38, 0, 0, 0, 0, 0, 0, 0, 0, 0]...}``` runic juniper
hey all - i have a question about how to formulate this optimization problem with scipy. what i have is a bunch of 2D points (x, y). i also have a “scale factor” m, which is the value that i want to minimize.
now, for the constraints, i have a set of “relationships” between certain pairs of points. each one of these relationships is an inequality of the form “the distance between the first point and the second point must be less than or equal to some pre-defined constant * m” (note that this constant will vary across different pairs of points). so, you can see each constraint is a function of m as well. finally, i have an additional set of constraints that simply state that every coordinate (x or y) must be between 0 and 1. these are “boundary” conditions, in a sense.
the original author of this paper mentioned using ALM (augmented lagrange multipliers), but since i couldn’t find a readily available implementation of this in python, i thought id try scipy - in particular the SLSQP method, which seems to support both equality / inequality constraints as well as boundary conditions. however this doesn’t seem to be working. my question is basically, am i formulating this problem the right way (in which case, it might just be an error in my code somewhere)? or are there entirely different libraries + methods i should be looking into?
 worldly elm
I'm trying to train a Transformer LM made in pytorch, is it ok to use only encoder layers for language modelling tasks?
moreover, in order to reach low perplexity, with few layers and heads, the number of epochs should be quite high right?
 pulsar stag
How to Build Interactive Dashboards with Python & React
👨🏫 Introduction & How the Project is Setup:
🌎 Check Out the Current Covid-19 Dashboard ( APHA 🛠️)

Learn More on Django, Plotly & Dash on my Full Course:
Check Out This Covid-19 Dashboard:
https://covid-dash-udemy.herokuapp.com/
Full Udemy Course:
https://www.udemy.com/course/plotly-d...
Find the Finished Code:
https://github.com/cryptopotluck/Covid-19-Dash-Map
--------...

GitHub
The tutorial for how to render a map in python and graph data based off coordinates - cryptopotluck/Covid-19-Dash-Map
eternal sentinel
    ent = 0
    n = len(dataset)
    for feature in dataset.keys():
        p_x = dataset[feature] / n
        ent += - p_x * np.log(p_x, 2)
        return ent


    pass

entropy('buying', edf)
im making my own implementation of entropy but i get an error after running this code can someone help me figure this out
this is the error that I get
 patent scaffold
https://github.com/TheBabu/Abalone-and-Vote-ML-Rewrite
I just uploaded my first (TF 2) ML
If anyone wants to give some critism I'll be very happy!
Especially take a look at this: https://github.com/TheBabu/Abalone-and-Vote-ML-Rewrite/blob/master/Vote Classifier Models.ipynb

GitHub
A rewrite of some old machine learning projects using Tensorflow 2 and Keras - TheBabu/Abalone-and-Vote-ML-Rewrite
GitHub
A rewrite of some old machine learning projects using Tensorflow 2 and Keras - TheBabu/Abalone-and-Vote-ML-Rewrite
I'm going to go to sleep so ping me or DM later
 untold flare
Hi everyone, I hope you are safe and healthy during these times! My name is Zishi and I am a grad student in Miami, FL who is interested in machine learning. I just found this Python discord channel while looking for ways to learn more about Python. Recently I asked Guillaume Chevalier, the main developer of an open source hyperparameter tuning framework called Neuroaxle (https://github.com/Neuraxio/Neuraxle), if he had a template for starting a new python project. He shared with me this link (https://github.com/Neuraxio/New-Empty-Python-Project-Base) and some other helpful tips like how to keep a data science project clean (https://www.youtube.com/watch?v=K4QN27IKr0g&feature=youtu.be) and told me the best way I could help him was to let other people know about his work. Please check it out! I'm currently interested in discussing about on how to find the best hyperparameters of each type of machine learning model (xgboost, deep neural networks) and how to deal with outliers in data.
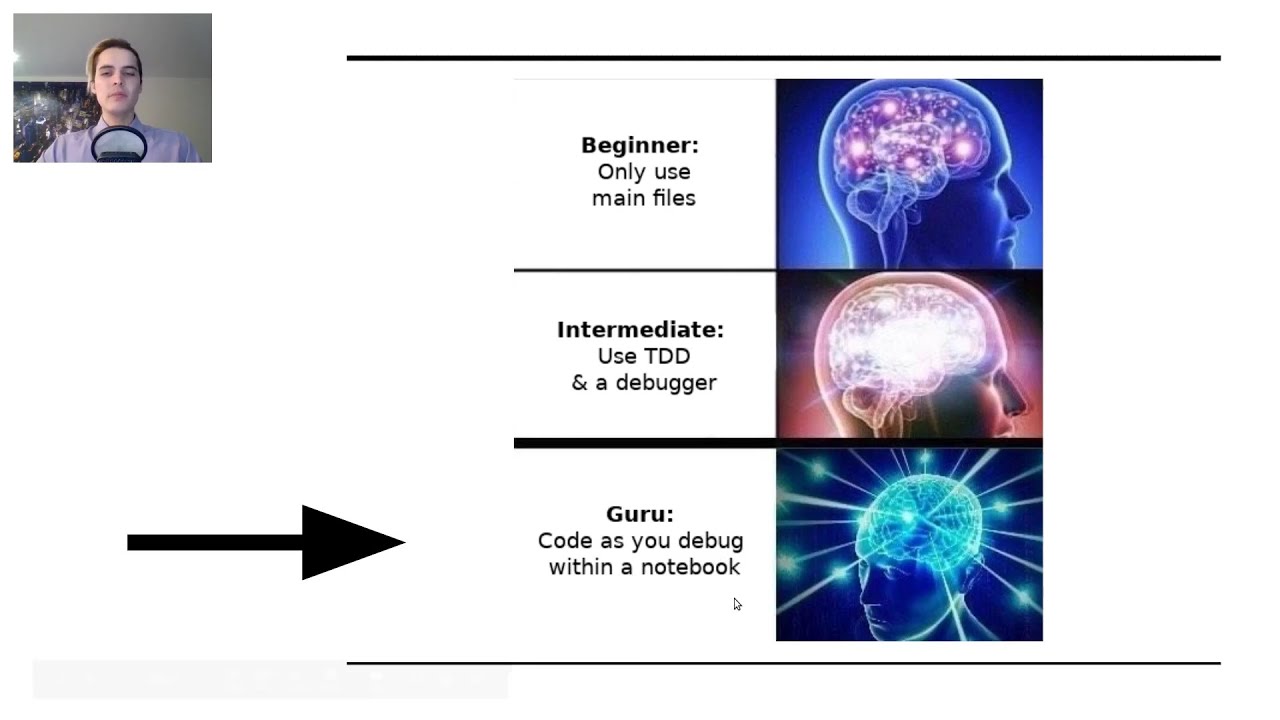
As said in the video, we have built two courses:
- The first one is on Clean Machine Learning, and
- The other one is on Deep Learning & Recurrent Neural Networks.
To access our courses, visit this page and reach out to us:
https://www.neuraxio.com/en/time-series-sol...
 willow holly
I am passing the parameters with a Soap Call to AdPoint platform. My parameters look like this:
[{'nUID': '39', 'Query': [{'MaxRecords': '40', 'OrderName': 'Forecast Placeholder - 100', 'CustomerID': '15283'}]}]
Passing the parameters below:
response = client.service.GetOrders(**params[0])
Because CustomerID is not unique, and 'Forecast Placeholder - 100' is a string. The response I get back might be Forecast Placeholder - 1005 or 1007 etc. I wonder if there is a way in Python to tell the code to only return the exact match. AdPoints API sucks so there is nothing that can help from API side, but Python is very powerful, so I am hoping there is a way...
lapis sequoia
can we install jupyter notebook on windows without downloading anaconda? I have VS Code editor and I'm a beginner in these things.
 frozen lintel
Yes
Download latest Python Version for Windows (64 bit)
Install it and don't add Python to the Path. Install it a user and not system wide.
Another possible solution is to install it from the Windows Store.
Then open a terminal (cmd)
py -3 -m pip install jupyter numpy matplotlib scipy sympy ipython
I was still typing ^^
lapis sequoia
I have Python 3.8 already
frozen lintel
Then open the terminal and execute the command
lapis sequoia
thanks that does answer my other questions too. for example numpy, matplotlib
frozen lintel
The first part py is a tool py.exe which gives the user the ability to select the right interpreter. You could have installed more then one Python version and also with different architectures.
For the latest stable version, the packages numpy, matplotlib and scipy should be precompiled. So you sound not need a compiler.
lapis sequoia
where should I stay (directory) while executing that command?
frozen lintel
If you have the problem, that you need a package, which requires a compiler, you could use unofficial binaries.
The directory is not important
The tool py.exe is system wide available. It's in the path
py.exe is just a shortcut to python.exe
The -3 means Python 3
lapis sequoia
once I execute that command and it's done? I don't need to do that for every working directories?
frozen lintel
You can if you want install virtual environments
lapis sequoia
why virtual environment and when do I need it?
frozen lintel
I use Python since 10 years I think. But not on Windows xD
So some applications do have external dependencies. Somethimes they collide with version numbers.
If you start for example a new project, you could install all the dependencies into the virtual environment.
lapis sequoia
I'm about to switch into new OS (linux) soon but I don't know what to do with these tools on windows 👀 I need to shift them all
oh
frozen lintel
Most tools are on Linux available.
OBS for streaming
Gimp for Pictures
Darktable for RAW pictures
LibreOffice
Firefox/Chrome/Chronium
Steam for Games
Lutris for Games
lapis sequoia
man what's this gigantic size of error?
OBS for streaming
Gimp for Pictures
Darktable for RAW pictures
LibreOffice
Firefox/Chrome/Chronium
Steam for Gamesthanks I was actually just testing with ubuntu as a dual booted OS. I was so confused why am I unable to watch videos
Lutris for Games
@frozen lintel
lapis sequoia
maybe. you see it was downloading on 4kbps speed 🤣
frozen lintel
Try first to install another package
for example install ftfy
py -3 -m pip install ftfy
pip install jupyter numpy matplotlib scipy sympy ipython this still works like the above right?
what does ftfy do?
frozen lintel
ftfy is a package to fix encoding errors
lapis sequoia
and why are we downloading jupyter numpy matplotlib scipy sympy ipython at once?
frozen lintel
If you use pip without py -3 -m in front of it, pip may use the wrong Python interpreter, if more than one is installed. This happens ofen on Windows systems, if the user forgets to uninstall the old versions.
Accidentally you could install a package for the wrong interpreter.
If there is only one installation and you are 100% sure about this, you can use plain pip if it works. It should not work, because it's not in the PATH.
lapis sequoia
gotcha
frozen lintel
If you install modues, they go into %localappdir%\Programs\PythonXY-[32]\lib\site-packages\
Very hidden
lapis sequoia
can I trace and delete them all?
and why are we downloading jupyter numpy matplotlib scipy sympy ipython at once?
Try first to install another package
@frozen lintel ftfy downloaded without any errors.
lapis sequoia
and how do I open my projects on jupyter after installing it?
frozen lintel
Enter jupyter-notebook into your terminal after the installation. If he do not find the program, you need to add the Path.
But try it first without adding a Path.
oblique belfry
I know there are some guidelines in terms of reproducibility and machine learning. How would this work when you are using a pretrained model from a model zoo in your application? How would that work with GDPR? It is not like you can point to the data it was trained on.
frozen lintel
I'm not in the ML stuff. I guess it's always good to provide the sample data and test data together with your project.
And for catalogues hdf5 could be interesting.
It's a format to save data like numpy arrays but very dense with less overhead. But I don't know if it's used in ML.
oblique belfry
HDF5 is really nice. But, what about it?
 zenith scarab
does anyone here use pytorch?
oblique belfry
Yeah, howcome?>
 late flax
@zenith scarab Yeah. I've been using it for the last year. I was using keras before that.
zenith scarab
I've been having trouble getting pytorch on pycharm
whenever i try to install it it just fails
should i avoid using pycharm
nd use something else?
@late flax
@oblique belfry
late flax
How does it fail? Did you set up the environment properly in PyCharm?
oblique belfry
Why are you explicitly saying pip install torch>=1.4.0?
I get an error when I run this command in the shell, so it is not Pytorch specific.
zenith scarab
when I type pip install torch I also get error
zenith scarab
      File "C:\Users\Roy\AppData\Local\Temp\pip-install-fdmki5yh\torch\setup.py", line 51, in run
        from tools.nnwrap import generate_wrappers as generate_nn_wrappers
    ModuleNotFoundError: No module named 'tools.nnwrap'

    ----------------------------------------
Command "C:\Users\Roy\PycharmProjects\simple-HRNet-master\venv\Scripts\python.exe -u -c "import setuptools, tokenize;__file__='C:\\Users\\Roy\\AppData\\Local\\Temp\\pip-install-fdmki5yh\\torch\\setup.py';f=geta
ttr(tokenize, 'open', open)(__file__);code=f.read().replace('\r\n', '\n');f.close();exec(compile(code, __file__, 'exec'))" install --record C:\Users\Roy\AppData\Local\Temp\pip-record-7hpp7c5y\install-record.txt
 --single-version-externally-managed --compile --install-headers C:\Users\Roy\PycharmProjects\simple-HRNet-master\venv\include\site\python3.7\torch" failed with error code 1 in C:\Users\Roy\AppData\Local\Temp\p
ip-install-fdmki5yh\torch\
https://stackoverflow.com/questions/56859803/modulenotfounderror-no-module-named-tools-nnwrap
@zenith scarab
Stack Overflow
I am trying to import a package "torch".
For same, I tried to install it using pip command as below, installation even started but after few seconds it got error
below is the command that I execu...
zenith scarab
hmm
oblique belfry
https://discuss.pytorch.org/t/error-installing-torch/53352/2
Seems like 32 bit python won't work.

PyTorch Forums
Either you have 32-bit Python or you have multiple Python distributions and mixed them together. For the first case, you could type in the following command to verify. python -c "import struct;print( 8 * struct.calcsize('P'))" # The output should be 64. For the second case,...
I don't know what you have.
zenith scarab
hmm how can i check
late flax
@zenith scarab May I suggest using Anaconda for installing pytorch? It's especially a pain the ass if you want the gpu capabilities.
I used to spend days trying to install tensorflow in the old days with pip.
It's a single line command with conda and it takes care of everything
zenith scarab
okk ill try with anaconda
oblique belfry
I am not a fan of anaconda when using linux since I feel it is more cumbersome than necessary. But, when it comes to installing TF or Pytorch (really any ML libraries) on Windows, Anaconda is great.
zenith scarab
alright
late flax
Miniconda makes it a bit better and in general I don't need it except for installing tensorflow and pytorch.
late flax
If you have a 64 bit machine, I would say yes.
If you take the anaconda route, that's gonna take care of the python intallation though.
zenith scarab
ok do im a bit new to conda
Im having trouble install the requirements.txt
PackagesNotFoundError: The following packages are not available from current channels:
@late flax @oblique belfry
late flax
If the list of packages is not that long you might want to install them separately. Some packages are not avaiable at the default conda repository.
zenith scarab
how do i install them separately
late flax
Is torch in the requirements?
zenith scarab
btw i opened a conda project from pycharm hope that inst a problem
late flax
Yeah, one issue I have is I haven't used PyCharm in a while. I usually do this stuff in console. But if you set up the conda in Pycharm this should not be an issue.
You're using the GUI right now, right? Do you know how to do this stuff in console?
zenith scarab
not really
late flax
The error message looks like a conda message. I don't know why PyCharm is using conda to install the requirements. Can you toggle it to use pip? Otherwise this is more of a pycharm issue.
Also, I don't know at what stage of learning Python/Data Science you are, but at some point you'll want to use the console because the GUIs on applications like Pycharm can only take you so far. I can guide you if you want to do it on console.
eternal sentinel
is there anyone that can help with my code
jolly briar
@zenith scarab conda usually uses a yml file? you can use pip with conda pip install -r requirements.txt, but i think you're better off installing with conda install if possible... I don't use conda much tho
zenith scarab
i got it covered thanks
 vital sphinx
@eternal sentinel might help if you also add the code that resulted in this error
eternal sentinel
    ent = 0
    n = int ( len(dataset) )
    for feature in dataset.keys():
        p_x = int ( dataset[feature])  / n
        ent += - p_x * np.log(p_x, 2)
        return ent


    pass
entropy('buying', edf)
@eternal sentinel if 'dataset' is a dataframe and 'feature' one of the columns, you can't turn the whole column to int. You should instead first use dataset.feature.astype(int)
vital sphinx
@eternal sentinel yeah, turn the column into int type first and then you can operate on it. what's not working is the int() command on the dataframe column.
vital sphinx
@eternal sentinel try dataset['feature'].astype(int)
vital sphinx
@eternal sentinel perhaps you can check what the dtypes of dataset and feature are?
another source of error is the line following p_x because it is treating p_x as a float, whereas it is actually a column. not sure though
eternal sentinel
they all say non null object
p_x is defined as the probabilty
i mean that what i consider it as
vital sphinx
and what happens when you try dataset['feature'].astype(int, copy=False) , does feature dtype change to int?
what p_x is doing is taking a column of numbers and dividing each of them by n and returning the results as another column of numbers. so p_x is actually a vector, as long as 'feature' is a column of numbers
vital sphinx
what is the error?
eternal sentinel
im just gonna give up i have been stuck onthis for too long
vital sphinx
ah okay! maybe try again when you're fresh. sorry it didn't work out tonight!
eternal sentinel
lets try to go thru it together
if you were to implement entropy how would you do it
vital sphinx
the value error seems to imply that you might be trying to convert a float into an integer, which is not permissible
lets try to go thru it together
@eternal sentinel I am also still learning python, if you send me your code, I can try out a bunch of things to try and see what the problem is. But I have no idea about entropy
I'm happy to keep trying though!
eternal sentinel
@vital sphinx the code above is the only code i have rn
vital sphinx
@eternal sentinel is it correct that dataset is a pandas dataframe? also, why is feature an argument of your function? you never use it in your function!
 arctic wedgeBOT
Hey @eternal sentinel!
It looks like you tried to attach file type(s) that we do not allow (.csv). We currently allow the following file types: .3gp, .3g2, .avi, .bmp, .gif, .h264, .jpg, .jpeg, .m4v, .mkv, .mov, .mp4, .mpeg, .mpg, .png, .tiff, .wmv, .svg, .psd, .ai, .aep, .xcf, .mp3, .wav, .ogg, .md.
Feel free to ask in #community-meta if you think this is a mistake.
 ancient light
@eternal sentinel what are the headers and types for each column?
 opaque stratus
Hey, could I pay someone to look over a google colab machine learning micro-project that I made today? I recently followed along to the example in a book and this was my own interpretation with a different dataset. If someone could give me some tips and critique it i'd be extremely thankful
daring locust
A very basic question. Does read_csv skip the NA lines by default?
 serene oar
It skips over blank lines rather than setting them as NaN
daring locust
I see, thank you 😄
serene oar
Can someone give quick advice on how can I webscrape this info here?
There are hundreds of of name and company pairs I'm looking to get. Each is in (body, main ofc) div 'panel' -> div 'details' -> h3 'name' and p 'company'
I'm using beautifulsoup4 and I don't manage to reach the correct data.
daring locust
Can someone tell me how to write this?
A Data frame df with columns ['A', 'B', 'C', 'D'] and rows ['r1', 'r2', 'r3'].
The easiest way to write this
jolly briar
@daring locust an empty dataframe?
daring locust
with random numbers
is this good enough?
df = pd.DataFrame({'A':[34, 78, 54], 'B':[12, 67, 43],'C':[4, 8, 34], 'D':[13, 27, 41]}, index=['r1', 'r2', 'r3'])```I just wanna know the easiest way to create one\
jolly briar
oh ok
pd.DataFrame(np.random.randint(0,5, (3,4)), columns = ['a', 'b', 'c', 'd'], index=['r1', 'r2', 'r3'])
    a  b  c  d
r1  2  0  2  0
r2  4  3  2  2
r3  3  4  1  2
(vals will change as i didn't seed - use np.random.seed(1) or something to reproduce)
eternal sentinel
@ancient light they're all non null objects
daring locust
can someone help me with this? I have this one question left, of which I cannot figure out the answer
I guess the answer will be "on"
but idk
kind steppe
Hey all. I am a Data Scientist who is looking for a assistant. Let 's discuss more detail via DM
mild topaz
hello , I am having my image recognition model. It sometimes predicts correct, but sometimes wrong. What can be the issue will be?
vital sphinx
Can someone give quick advice on how can I webscrape this info here?
There are hundreds of of name and company pairs I'm looking to get. Each is in (body, main ofc) div 'panel' -> div 'details' -> h3 'name' and p 'company'I'm using beautifulsoup4 and I don't manage to reach the correct data.
@serene oar what do you get if you dofind_all('h3', class_='name')?
 tulip sparrow
if i want to start learning python as a brand new beginner with no previous knowledge to build a site like algoexperts then whats the best course i should start with
oblique belfry
So...what is the goal of the Flax project? I can't tell what their endgame is. https://github.com/google/flax

GitHub
Flax is a neural network library for JAX that is designed for flexibility. - google/flax
 steel roost
anyone available here?
i am trying to bring mutiple dataframes to one excel file, but i want to put them in seperate sheets, not files
i have this so far:
df = pd.read_csv('/home/doomedapple7565/Desktop/Athena_Audit_output.csv')
sorter = df.sort_values('username', ascending = True)

#filters out the data based on the list of usernames provided by departments above
navigator_data = (df[df['username'].isin(navigators)])
#send it to second tab
#navigator_data.to_csv(r'home/doomedapple7565/Desktop/navigator_data.csv', index=[1])

qi_coordinators_data = (df[df['username'].isin(qi_coordinators)])
#send to third tab
#qi_coordinators_data.to_csv(r'home/doomedapple7565/Desktop/qi_coordinators_data.csv', index=[2])

case_management_data = (df[df['username'].isin(case_management)])
#sends to fourth tab
#case_management_data.to_csv(r'home/doomedapple7565/Desktop/case_management_data.csv', index=[3])

medical_records_data = (df[df['username'].isin(medical_records)])
#sends to fifth tab
#medical_records_data.to_csv(r'home/doomedapple7565/Desktop/medical_records_data.csv', index=[4])


referral_specialists_data = (df[df['username'].isin(referral_specialists)])
#referral_specialists_data.to_csv(r'home/doomedapple7565/Desktop/referral_specialists_data.csv', index=[5])

referral_specialists_data.to_excel(r'/home/doomedapple7565/Desktop/referral_specialists.xlsx')
case_management_data.to_excel(r'/home/doomedapple7565/Desktop/case_management_data.xlsx')
navigator_data.to_excel(r'/home/doomedapple7565/Desktop/navigator_data.xlsx')
qi_coordinators_data.to_excel(r'/home/doomedapple7565/Desktop/qi_coordinators_data.xlsx')

print('[+] Successfully exported data')
but it is currently breaking them into completely seperate files
 coral yoke
@steel roost you can utilize an ExcelWriter to do just that
example from docs:
with ExcelWriter('path_to_file.xlsx') as writer:
    df1.to_excel(writer, sheet_name='Sheet1')
    df2.to_excel(writer, sheet_name='Sheet2')
I have a question regarding some basic NLP if anyone can help though. I've been going through the Tensorflow in Practice specialization as prep for the Tensorflow certification. I've done NLP before in various ways from raw NLTK/Python to just using Gensim.
One of the exercises in the NLP course wants us to remove stopwords. Okay, easy enough, row[1] is what references the text in the provided csv so for me it was as simple as doing ' '.join(word for word in row[1].split() if word not in stopwords). Well, I get all "expected outputs" in the notebook except two, the padded sequences shape and the word index being 1-4 words off for some reason.
On to the question, what alternative is there in Python, no imports, to removing stopwords other than split()? I ask this because in the course discussion board an individual stated "avoid using split() as it caused this issue for me."
steel roost
@coral yoke if the sheet doesn’t exist yet, will it make one?
coral yoke
.pretty sure, yes
steel roost
I’m not home right now to test
But I remember when I tried it, it acted as though if the sheet didn’t exist it couldn’t write to it
oblique belfry
Roman Ring
Have you ever wondered how will the machine learning frameworks of the '20s look like?
In this essay, I examine the directions AI research might take and the requirements they impose
on the tools at our disposal, concluding with an overview of what I believe to be the
two stro...
 cunning grail
 mossy crow
Hey, can anybody help me with a design question? I'm using pandas atm but willing to use anything
Its not specific, just a library / logic to use
eternal sentinel
whats your question
mossy crow
Well, I need to automate updating between 300-2000 records.
eternal sentinel
question: is gini index defined as 1 - entropy
mossy crow
I'm trying to figure out the most elegant way to do that.
With the most speed.
The way I was doing it before is I was building the updates in chunks and doing them 100 at a time I think.
Been a while since I looked at it, I'm refactoring
Updates come through a CSV which I read into a dataframe, then built update queries 100 at a time and ran them.
eternal sentinel
can you show some code?
so i can understand better what you're trying to achieve
mossy crow
yeah np let me get to that branch
Any place thats good to stick this?
this function is about 39 lines
@eternal sentinel
eternal sentinel
humm do you have a lingk to a github
mossy crow
I don't, its for work so private repo.
@eternal sentinel https://www.codepile.net/pile/rpo4A2Nm
{{ description }}
eternal sentinel
ok lemme se
mossy crow
Yep.
eternal sentinel
so i really dont understand what you trying to do. i rather be honest. maybe someone else will be able to
mossy crow
Basically I get a CSV that I read into a dataframe and call that function
I build the update statements and send them in chunks rather than iterating through the data frame one at a time
I just was trying to figure out if there was a more elegant way to do it.
Thanks for trying @eternal sentinel
oblique belfry

Krisp
Building noise cancelling extension for a browser wasn’t possible until recently. Find out how we shrunk our DNN 30x to run inside Chrome.
eternal sentinel
wow this is very awesome
 rigid summit
Hello! Does anyone know of, or have, a kind of bucket list set of programs to build, related to datascience, for someone like me who is learning? Similar to the general Python bucket list available somewhere on this discord...
 ruby forum
hey guys anyone know of a tool i can use to mass remove a watermark? its for a project for school, so not planning on using these photos illegally
ive got a few thousand photos that need the watermark removed, they are all the same watermark
or would you guys say the cnn model im building would ignore the watermark or phase it out due to its duplicity
mild topaz
Hi i am having the cnn model for image recognition . When i use this model for testing the images , Sometimes it predicts correctly but sometimes perdicts wrong. What can the issue will be?
lapis sequoia
Has anyone worked with text classification? I need some help.
I wanna make a ML model that can tag text messages.
The training data would be from my discord server. I can prepare 100k labeled texts in a CSV file. Would that be enough or do I need more data? I don't want to use a public dataset.
Which text classification algorithm should i use?
 echo kelp
I don't, its for work so private repo.
@mossy crow Are you still working on this? I think I get what you're trying to do, but it seems like you need to focus on using more of a split, apply, combine type approach, which fortunately, pandas makes pretty easy. https://pandas.pydata.org/pandas-docs/stable/user_guide/groupby.html
@mossy crow generally as a rule of thumb of pandas, you should try to never iterate through your dataframe one row at a time
 grave mango
i am unable to install scrapy using command
pip install scrapy
error: command errored out with exit status 1
lapis sequoia
Use
python -m pip install scrapy
coral yoke
@mild topaz i would need to know what your network looks like and how much data you have to help you. there's many factors and no straight forward answer i'm afraid.
@lapis sequoia yes, i have. best bet is giving it a try and seeing if the performance of the model is something you're comfortable with. 100k certainly sounds like a decent amount.
edit: there are quite a few linear algorithms you can go about trying out. for a project some coworkers and I did a while back we used a few linear algorithms in a stack ensemble but you could use a neural network as well.
 fading depot
Hi everyone, Would someone be able to guide me in how to create a data model predicition on python. A machine learning program to predict outcomes... I want to do estimates on how fast the virus spreads in my community
Or where I can find code examples to build my own?
shrewd trellis
Do you have data ? @fading depot what’s your input data and what output data you expect ?
fading depot
Yes it’s from the number of infected people, the amount recovered and forecasted predictions
It’s from the cdc or ldh websites
@shrewd trellis
coral yoke
do you know anything about machine learning yet?
 zenith salmon
@fading depot How much data do you have collected on your community? If you are using the cdc's data as the training set, which features are you using? Is it a time series?
grave mango
@lapis sequoia that also didn't work
grave mango
i searched and it said this might be a vc redistributable problem
but i installed vc it still didn't work
my pip is updated
actually i reinstalled my OS
so all the visual c++ version are gone
same error
maybe i still don't have the required vc version but idk which one to download
lapis sequoia
Yes. You need to install ms visual ++ latest version
grave mango
can you give me the link please?
shrewd trellis
Well maybe something like Lstm ? I’m not familiar with regression much :/ sorry @fading depot
mossy crow
@echo kelp Yeah I am working on it. The splitting them into different dataframes is way more elegant for that half. Thanks for that. Do you know of any elegant way to update all of those rows other than iterating through the dataframe to generate SQL update strings and executing them?
 sullen wing
@steel roost Please don't advertise your channel in a different channel, as it does not contribute to the channel / can interrupt the current conversation. Be patient, when someone is available, they will help you.
echo kelp
@echo kelp Yeah I am working on it. The splitting them into different dataframes is way more elegant for that half. Thanks for that. Do you know of any elegant way to update all of those rows other than iterating through the dataframe to generate SQL update strings and executing them?
@mossy crow are you trying to update the sql table as you go? You could instead duplicate the table as a pandas df and then use .to_sql() as opposed to trying to intersperse communications between the two
mossy crow
@echo kelp I get the update CSVs every day, and they update 300-1000 rows of a 5 million row table.
echo kelp
@mossy crow gotcha, I didn't really understand the application tbh. Hmm. I'm not a pandas power user, I've only been writing in it for a month or so myself.
mossy crow
@echo kelp The way I was doing it was iterating through it into a list, then making a bunch of raw sql commands with the variables from that list and executing them in chunks
@echo kelp you helped streamline the first part for sure though, that should speed things up considerably and make it more readable. Thank you.
echo kelp
@mossy crow any time, glad I could help with as little experience as I have. I'll definitely think about that though and ask a friend of mine who might have a better solution.
 woeful narwhal
Hi guys, does anyone know what time complexity of this function? http://scipy.github.io/devdocs/generated/scipy.stats.special_ortho_group.html if anyone know, please help me guys. thank you..
 winged zodiac
Hey so im trying to plot 2 lines using matplotlib
is it possible to adjust the scale
so that they both go from around bottom right to top right
as in both lines have different scales
uncut shadow
wdym?
lapis sequoia
in python i can duplicate string characters like, val = "word" * 2 would result in "wordword"
how can i do the same with ascii codes ?
 onyx cove
hey, could someone help me a sec
I need to find a way to split out the data in a GPDF
I have a column called latlon
a sample entry is like this: -28,-58 | -25,55 | etc
basically I need to split it at the | symbol, and then at the , to get a list of latitude/longitude vars
sat_df["latlon"]= sat_df["latlon"].str.split("|", expand=False)
this command splits it up so a column entry looks like this [40.04780852043756,-18.095882305186635, 34.54826278185939,-19.98557952284439, 28.973066054493685,-21.70880825625703, 23.438943926016133,-23.283262538220715, 17.83832429080423,-24.77903739499682, 12.286790801102807,-26.19496282413472, 6.675441052216501,-27.58304857250051, 1.1195082748785319,-28.9352424692241, -4.4903238996772314,-30.29711120634383, -10.095034651785744,-31.673001877169753, -15.635786561017037,-33.06773668392852, -21.221530741382974, ]
how do I split that data into two lists and make sure they are paired correctly? 😦
hardy harness
you mean save as image?
onyx cove
in matplotlib? its savefig
 vast shale
Hey guys, quick datascience question.
I wanted to know how do you guys tackle a initial table with alot of variables (features) before modelling
coral yoke
@vast shale it depends entirely on what the data is and what you want to do with it
 limpid lichen
Hi there. I'm wondering if anyone is able to assist with generating a subplot. Right now I'm iterating through each row of my data and generating an individual plot. I'd like to take all of the individual plots and place them in a subplot for easier viewing but I have no idea where to start (very new to python).
def main():
for index, row in getData().iterrows():
getPlot(row)
plt.show()
main()
subplot dimensions will be the same every time: 4 rows, 7 cols
coral yoke
this should be exactly what you need @limpid lichen https://matplotlib.org/3.2.1/api/_as_gen/matplotlib.pyplot.subplots.html
limpid lichen
I just have no idea how to implement it into my code. Is it possible to populate the subplot in my main() for loop?
coral yoke
yes, pretty sure
 fleet heath
Hi guys
I'm new to this community
Can anyone please suggest me some reliable sources for reading research papers and articles about data science?
fleet heath
thank you @coral yoke
coral yoke
Yw
 tardy pasture
Hi when I use gp_minise it gives me 'ValueError: Not all points are within the bounds of the space.' I have tried to increased the boundaries but it didn't help and i cant print statement the values to see where went wrong
My code is in silicon
tardy pasture
ignore me
agile anvil
VOLUNTEER OPPORTUNITY: If you are bored and good with data science please have a look around https://rt.live It's the best covid science site I've seen in weeks to stare at while nervously hitting refresh, created by an Instagram cofounder and former CEO, who's responsive on Twitter and running on Python: https://github.com/k-sys/covid-19/blob/master/Realtime R0.ipynb -- it seems they're absorbing various levels of volunteer effort, so please have a look if you've got stats and pandas or matplotlib skills.

GitHub
A collection of work related to COVID-19. Contribute to k-sys/covid-19 development by creating an account on GitHub.

Up-to-date values for Rt — the number to watch to measure COVID spread
 slender latch
How can i get first result by search google image url
lapis sequoia
I've built a demonstrative model being able to assess football players. You can watch the whole process here:
https://www.youtube.com/watch?v=GFmyNLh7gLE
I hope it's not against this channel rules. Let me know if you like it in the comments!

It's a general overview of one of the best Machine Learning algorithms out there. Many Data Science competitions have been won using this algorithm. I used data of 18.000 soccer players to build a model able to give them a ranking between 0-100. Feel free to use my code in a p...
hybrid tendon
@lapis sequoia hey, would you mind taking a look at the question I asked up there?
Thanks for your post
lapis sequoia
@hybrid tendon sure. unfortunately I can't really help you with plt as I don't use it very often. maybe this link will be helpful: https://jakevdp.github.io/PythonDataScienceHandbook/04.06-customizing-legends.html
hybrid tendon
alright, thank you!
 wide knot
heya. im working audio files and FFT.
does sound volume/loudness affect the output of FFT?
im thinking it still distills it into the same frequencies so there's no difference. wanted to hear from actual experts. hahah
lapis sequoia
https://pycaret.org/
pretty useful
 coral yoke
@lapis sequoia good video though I'd like to say, please don't lead people on to believing xgboost is a universal answer in a way. for as many things that it does well it can be outdone
lapis sequoia
@coral yoke I'm glad you like it! yeah, it can be outdone for sure. what I wanted to mention is fact, that you can solve many problems with only this sole algorithm. it doesn't mean it's the only path for most problems. I do appreciate your feedback
zenith scarab
How can I create a pytorch dataset with a numpy matrix and then split it into train/val/test
coral yoke
@zenith scarab from a quick google search, you just convert the array to a tensor and then load it into the dataset...
zenith scarab
yeah, i got it
ok another question i wasn't able to find on google
There is a COCO dataset however I cannot download it since it is too large but I want to know the format of the data
where can i learn this?
http://cocodataset.org/#download
coral yoke
 rustic igloo
Hello all, has anyone implemented successfully an unsupervised entity typing model? If so, what are some context and features commonly applied?
I referenced off of the following code/paper on github, something close to what I want to do, but it doesn't mention much about the features and context details:
https://github.com/thunlp/LME.
FYI - i am less than a year learning data science so bear with me if my questions sounds rudimentary. Thanks!
 timber niche
Hey There, i'm intested in making matrix factorization algorithim
to output a probability
from 0 - 1
this is the algorithm
import numpy as np
def matrix_factorization(R, P, Q, K, steps=5000, alpha=0.0002, beta=0.02):
    Q = Q.T
    for step in range(steps):
        for i in range(len(R)):
            for j in range(len(R[i])):
                if R[i][j] > 0:
                    eij = R[i][j] - np.dot(P[i,:],Q[:,j])
                    for k in range(K):
                        P[i][k] = P[i][k] + alpha * (2 * eij * Q[k][j] - beta * P[i][k])
                        Q[k][j] = Q[k][j] + alpha * (2 * eij * P[i][k] - beta * Q[k][j])
        eR = np.dot(P,Q)
        e = 0
        for i in range(len(R)):
            for j in range(len(R[i])):
                if R[i][j] > 0:
                    e = e + pow(R[i][j] - np.dot(P[i,:],Q[:,j]), 2)
                    for k in range(K):
                        e = e + (beta/2) * (pow(P[i][k],2) + pow(Q[k][j],2))
        if e < 0.001:
            break
    return P, Q.T
R = np.array(R)

N = len(R)
M = len(R[0])
K = 2

P = np.random.rand(N,K)
Q = np.random.rand(M,K)

nP, nQ = matrix_factorization(R, P, Q, K)
nR = np.dot(nP, nQ.T)
do i just normalize the vector nR?
The rating matrix R(would have 1 if user clicked on a link, 0 if not)
but i want to output a probability
 frail horizon
how do I extract the value of a column within a dataframe? I want to create a Fail statement if my pandas columns have any zeros
jolly briar
@frail horizon df['<column-name>'].isin([0]).any()
frail horizon
thanks @jolly briar, how do I make the print statement
frail horizon
sorry new to python. I need a print statement that's an if else, If there are any 0s print fail, else print success
jolly briar
if zeros in column
    print fail
else
    print success
like this?
that won't run ofc it's just pseudo
frail horizon
yup
jolly briar
@frail horizon do you have previous experience working with data?
or are you new to everything, pandas / python / data etc
frail horizon
i'm new to pandas,
coral yoke
You could also just do 0 in df.column.values
jolly briar
yes soul that would work
coral yoke
I know
jolly briar
so do i
coral yoke
Then why did you tell me?
jolly briar
this is fun
coral yoke
?
jolly briar
@frail horizon you're asking about if's and stuff though which are pretty intro python - only reason i ask is that it might be a lot to take on at once?
coral yoke
@frail horizon using 0 in df.column.values will give you a quicker result as well, less operations to go through
jolly briar
learning pandas without a basic layer of core python etc
frail horizon
I know how to make if and else, just not how to call the column value
jolly briar
i mean - i gave you a solution that worked for that, so idk why you couldn't piece that together
coral yoke
^
frail horizon
just making sure, so I don't have to do more digging. It's a last line of code I need for tommorow, anyways thank you
jolly briar
@frail horizon i mean - this really shouldn't be remotely close to digging if you've gone through even the most basic of python, that was my point i guess
good luck tho 👍
(the if statement part that is - doing things in pandas is separate here)
 covert storm
Hi all how is it going ?, I am new here,
 drifting umbra
cool
no i work on investment strategy
do some time series stuff at work
trying to move more in data science direction career wise
but still finance
 wet frost
I want help
I have a school project due to lockdown
Built a Cloud Security with face recognition
Can you please help me out with some suggestions?
 chrome rampart
idk if this is the right channel, I'm having a problem resizing an image using cv2.resize(), here is my code
    category_dirs = os.listdir(data_dir)
    # Loop over each category directory.
    for category in category_dirs:
        # Image names for each image in category directory.
        images = os.listdir(f"gtsrb\\{category}")
        for img in images:
            # Read image (default numpy.ndarray)
            img = cv2.imread(f"gtsrb\\{category}\\{img}")
            # Resize image to width IMG_WIDTH, heigh IMG_HEIGHT.
            img = cv2.resize(img, dsize=(IMG_WIDTH, IMG_HEIGHT))```
and here is the error
```cv2.error: OpenCV(4.2.0) C:\projects\opencv-python\opencv\modules\imgproc\src\resize.cpp:4045: error: (-215:Assertion failed) !ssize.empty() in function 'cv::resize'```
images in ``.ppm`` formaton which line u are getting this error? @chrome rampart
chrome rampart
The line where I call the resize method
mild topaz
img = cv2.resize(img, dsize=(IMG_WIDTH, IMG_HEIGHT)) this line?
hav u defined IMG_WIDTH, IMG_HEIGHT ?
agile anvil
my periodic USA best guess, now adjusted to accommodate insurrection against self-isolation orders and the effects of the testing bottleneck:
testing bottleneck discussion remains at https://bit.ly/pycovid -- gdocs comments open
mild topaz
Hi i am having many classes for image classification approx(7 to 10 classes say). How i make condition for predicting the model?
like when i have 2 classes i have condition like python if result [0][0] >= 0.5: prediction = "Passport" else: prediction = "driving liscence"
how i make condition for multiple classes?
 lone tartan
Hi, I am trying to reshape my training and test sets. I am trying to calculate my rmse and mae. But both dataset do not match in shape with each other.
def rmse(y_true, y_pred):
    ### BEGIN SOLUTION
    RMSE = np.sqrt(np.mean((y_true-y_pred)**2))
    print(RMSE)
    ### END SOLUTION
    return RMSE
rmse(Y_train, Y_test)```

Gives me the following error
```ValueError: operands could not be broadcast together with shapes (664,1) (285,1)```
Happens on the line
```RMSE = np.sqrt(np.mean((y_true-y_pred)**2))```What’s your y_true and Ypred ?
It’s your prediction and your label ? Look like you compare your train prediction with test label @lone tartan
lone tartan
@shrewd trellis I think I made a mistake judging by your words
What would I compare it too?
shrewd trellis
I think you mixed train prediction with test label
You should do prediction on your test set and compare it with test label if you want to measure error
 signal fox
hello, can anyone here who's done pytorch help me out real quick
coral yoke
!ask
arctic wedgeBOT
Asking good questions will yield a much higher chance of a quick response:
• Don't ask to ask your question, just go ahead and tell us your problem.
• Don't ask if anyone is knowledgeable in some area, filtering serves no purpose.
• Try to solve the problem on your own first, we're not going to write code for you.
• Show us the code you've tried and any errors or unexpected results it's giving.
• Be patient while we're helping you.
You can find a much more detailed explanation on our website.
signal fox
hmm I am dumb, but I'm getting an error even though other aspects of the code are working
module 'torch' has no attribute '_version_'
that is the error, however torch imports fine, It displays that I can use cuda, that seems to be the only aspect that is not working
signal fox
ohh okay, thank you
 slate stump
trying to come up with some numpy code that will take an ndarray like [1, 2, 3, 4] and give me [(1 + 2) / 2, (3 + 4) / 2]
essentially take consecutive pairs and average them
any ideas?
only thing I've come up with is
a = numpy.array([1, 2, 3, 4])
b = (a[::2] + a[1::2]) / 2
but I feel like there's a much smarter way of going about this
 silent swan
well theres
a.reshape(-1, 2).mean(1)
but that's not much better
jolly briar
@silent swan that looks much better, imo at least, why not?
i was just going to shift a series in pandas 🤦♂️
 wide rose
can anyone check my code for a forward chaining system for poker hands
i have to use transitive properities to check if a hand beats another hand
``pyth
class Hand(object):
def __init__(self,name,beats_hand):
self.name = name #name of hand
self.beats_hand = beats_hand #the cloest hand it beats
def does_it_beat(self,target):
goal = target
if self.beats_hand == target:
print('yes it does',target.name)
elif self.beats_hand is None:
print('not it doesnt')
else:
self.beats_hand.does_it_beat(goal)
poker_data = ( 'two-pair beats pair',
'three-of-a-kind beats two-pair',
'straight beats three-of-a-kind',
'flush beats straight',
'full-house beats flush',
'straight-flush beats full-house' )
one_pair = Hand('one_pair', None)
two_pair = Hand('two_pair', one_pair)
three_of_a_kind = Hand('three_of_a_kind',two_pair)
straight = Hand('straight',three_of_a_kind)
flush = Hand('straight',straight)
full_house = Hand('full_house',flush)
straight_flush = Hand('straight_flush',full_house)``` zealous hinge
is this Project Euler? :-}
wide rose
me no
i am doing some of that tho
im on 13 i think i know how to solve have just been lazy with it
frail horizon
question, I need write an exit code if there is a pass or fail near the end, I can't use system exist because its multiple exit statements
i have > If df[''column"].isin(isin([''fail"']).any: sys.exist("0")
 exotic reef
What do you mean you can't use system exist because it has multiple exit statements?
@frail horizon
mild topaz
In my case i have 3 categories like "state_1_DL","state_2_DL","state_3_DL"
how i can modify my code to predictmy image between these 3 categories?```Traceback (most recent call last):
File "E:\udemy\code2.py", line 63, in <module>
steps_per_epoch = 34//10)
File "C:\Users\Admin\anaconda3\lib\site-packages\keras\legacy\interfaces.py", line 91, in wrapper
return func(*args, **kwargs)
File "C:\Users\Admin\anaconda3\lib\site-packages\keras\engine\training.py", line 1732, in fit_generator
initial_epoch=initial_epoch)
File "C:\Users\Admin\anaconda3\lib\site-packages\keras\engine\training_generator.py", line 220, in fit_generator
reset_metrics=False)
File "C:\Users\Admin\anaconda3\lib\site-packages\keras\engine\training.py", line 1508, in train_on_batch
class_weight=class_weight)
File "C:\Users\Admin\anaconda3\lib\site-packages\keras\engine\training.py", line 621, in _standardize_user_data
exception_prefix='target')
File "C:\Users\Admin\anaconda3\lib\site-packages\keras\engine\training_utils.py", line 145, in standardize_input_data
str(data_shape))
ValueError: Error when checking target: expected dense_126 to have shape (3,) but got array with shape (1,)```my code is as followspython model.fit_generator( training_set, validation_data = test_set, samples_per_epoch = 34, epochs = 20, validation_steps = 7//10, steps_per_epoch = 34//10)
mild topaz
solves this issue myself only😀
coral yoke
@mild topaz change your output activation and loss. i highly suggest learning the concepts of ML before jumping into trying something you don't understand. it'll help a lot more in the long run
slender latch
How can i scrap раттата this from above code?
vital sphinx
How can i scrap раттата this from above code?
@slender latch
assuming you're using BeautifulSoup from bs4
page_text = bs4.BeautifulSoup.find('span', _class = 'Button2-Text').contents.strip()
uncut shadow
Hello! Do you know any good courses/anything about linea algebra for CS, Data Science, ML etc?
those which are for CS, DS and ML
cuz those for physics/maths might have different things
which won't come in handy in ML and stuff
coral yoke
@vital sphinx i believe it's class_ instead of _class unless they both work
slate stump
anyone got any idea for numpy code that takes a 2d array and returns a 1d array containing the values of each array with the largest absolute magnitude? with the sign preserved
i.e. [[-7, 2], [11, -4]] -> [-7, 11]
 feral elm
Hi, any tutorial or something to take a look about machine learning for AI in 2d map?
To move point x to y and check invalid and valid positions
 sterile zenith
tell us more about the problem, and why it needs to be learned versus enforced
if there's a fixed set of rules with specific outcomes for specific inputs, you don't need ML/AI
feral elm
I have a map 10000x10000, i want the ai to learn what position have any block and what position are free.
These ai move around all positions to check is possible move
And with these information, have a path algorith to move from X to Y point
sterile zenith
ok so this is a pretty heavily researched area, and doesn't have to do with AI
you want to make something like this (in memory only) https://qiao.github.io/PathFinding.js/visual/ ?
feral elm
Yeah
Thanks, my next problem is about the block positon can change during the time
So maybe the valid positions change
We want to divide in two states
1 - explore: find all valid position and what positions are invalid
2 - when the map are explore, move from x to y. And maybe some invalid or valid position are change with another thread
sterile zenith
this should help https://brilliant.org/wiki/dijkstras-short-path-finder/

One algorithm for finding the shortest path from a starting node to a target node in a weighted graph is Dijkstra’s algorithm. The algorithm creates a tree of shortest paths from the starting vertex, the source, to all other points in the graph. Dijkstra’s algorithm, published...
that's basically what you're doing
feral elm
Thanks!
 tribal granite
Don't know if this is the place to ask, but does anyone know if Facebook shows the format of the data they store on you? I'm trying to find all the fields for the json fields in their messenger conversations
 edgy shoal
Hey
What is the best university program to study Ai and machine learning
I am fresh graduated and looking to take another degree but in the Ai and machine learning program
Please anyone could help dm me
 analog burrow
@edgy shoal DMed.
 autumn flax
Hey, does anyone have advice for picking a data science masters grad school? I'm thinking of Columbia vs. USF
tribal granite
carnagie is the gold standard
vital sphinx
@vital sphinx i believe it's
class_instead of_classunless they both work
@coral yoke You're right! Thanks for the correction!
jolly briar
@timber niche tikZ , typically used with LaTeX
gentle depot
Hello, Does anyone here know about design of experiments?
I have a design with 2 factors, say SPD [75 100] and TMP [40 50 60], with 3 replicates
this sums 18 runs, but on top of that each run have triplicate of samples
I am using minitab to try to analyze the design but can't figure how to let minitab know about the triplicate samples. I could do a new experiment design with 9 replicates but statistically it's not the same
timber niche
@jolly briar thanks mr!
gentle depot
thoughts or tips?
lapis sequoia
Can anyone here whos a data scientist help me with a short little project please? It involves analyzing some finance stuff.
 faint musk
Don't know if this is the place to ask, but does anyone know if Facebook shows the format of the data they store on you? I'm trying to find all the fields for the json fields in their messenger conversations
@tribal granite There are many different data formats which Facebook makes available. Some are available through a public API, some are not
Can anyone here whos a data scientist help me with a short little project please? It involves analyzing some finance stuff.
@lapis sequoia Can you provide some detail?
 lucid trout
https://zhafranramadhan12.wixsite.com/zhafranr/post/covid-19-quick-analysys-20-april-2020?lang=id
Hello guys,can you guys give some feedback from the link above,i made it by myself,and i just started to learn Data Science, and trying to applied my skill into that simple analysis,iam still learning,and i need some feedback from you guys,ohh and by the way i just started learning Data Science for around 2 to 3 month 😁 so im really sorry if there is a lot of mistake or the analysys isn't to complex

Zhafran R
COVID-19 or Corona Virus Disease 2019 is a Pandemic that has been spread around our world right now, but how dangerous is COVID-19 ??? and how far COVID-19 has been infected our world ??? in this article i would like to show you more about this pandemic COVID-19 When did COVID...
eternal sentinel
hey guys im trying to use the KNN imputer but I am having an error can i get help
KNN = KNeighborsClassifier()
#Split the data into thirds before filling in missing values
x, y, z = np.array_split(df, 3)

#Used knn imputation on each split of the data
# from fancyimpute import KNN
KNN = KNNImputer(missing_values='-', n_neighbors=2)
KNN.fit_transform(x)
here is my code
here is the error i get
eternal sentinel
please any help will be appreciated
and at the bottom it is showing the following ValueError: could not convert string to float: '2A'
 raven knoll
Hey guys, I am in my first year of college and I need to interview someone next month. The interview should be with someone who works in the pattern recognition/AI sector. If anyone is interested send me a PM.
 spiral bay
Hi. I'm not sure, but is it ok to ask a question about MARS which is not directly related to Python?
Or to make it Python related: I have Cross Sectional Time Series Data. Think about it like clicks per page per day.
Let's say I want to run MARS on it and I'm interested in Inference not just mere prediction.
Since MARS is similar to OLS I would assume that if I run it under cross sectional assumptions my estimator is biased and my standard error wrong, correct?
Do you know if statsmodels can handle this someway? I've also looked a bit for a paper on the issue, but everything I found that looked promissing was looked behind a paywall.
 astral jasper
hi guys, i have a question, does anyone know how i can plot this sort of graph in jupyter notebook using python
worldly elm
seaborn dense plot will plot the distributions, matplotlib allows you to add text to the figure @astral jasper
oblique belfry

An open source deep learning platform that provides a seamless path from research prototyping to production deployment.
 lapis ice
Good day, is there anyone I could direct a question regarding 'GAN'?
coral yoke
!ask
arctic wedgeBOT
Asking good questions will yield a much higher chance of a quick response:
• Don't ask to ask your question, just go ahead and tell us your problem.
• Don't ask if anyone is knowledgeable in some area, filtering serves no purpose.
• Try to solve the problem on your own first, we're not going to write code for you.
• Show us the code you've tried and any errors or unexpected results it's giving.
• Be patient while we're helping you.
You can find a much more detailed explanation on our website.
lapis ice
Well, it's a question that I am not sure if I can define correctly, but I'll try.
I am looking to generate 'trash' images (bottles, smashed cans, etc). I want to know, what type of 'data' would be useful for this. I assume I would have to define each 'trash' as an itemized list. So like, a bottle would be ONE target to train, can a 2nd target to train, etc.
But what about the data itself, like, the images. How should i proceed with acquiring such data (images) that would be valid for the training part. How hard is it to work with colored compared to only black & white images.
coral yoke
not hard at all of a difference
lapis ice
I see. What about the data though, how would one proceed with acquiring data I mentioned above?
coral yoke
datasets or yourself?
lapis ice
the datasets
As far as I know, there are not a lot of high resulation/same type images of, for example, crushed can.
coral yoke
yeah so you make your own
lapis ice
Doesn't GAN require like, a lot of data for it to be trained?
coral yoke
most things ML do, yes
lapis ice
So I cannot really take a camera and take some photos of different cans..
coral yoke
¯_(ツ)_/¯
lapis ice
Not do-able in such scale
coral yoke
welcome to ML
lapis ice
Hmm, so basically that's not really do-able project unless I get the data somewhere
coral yoke
yes
any ML project needs data. if the data doesn't exist you need to make it. if you can't make it the project doesn't start
uncut shadow
Hello! Do you know any good courses/anything about linea algebra for CS, Data Science, ML etc?
those which are for CS, DS and ML
cuz those for physics/maths might have different things
which won't come in handy in ML and stuff
chrome rampart
3blue1brown's "Essence of linear algebra" is a good series
 tough otter
hey guys, can someone please push me in the right directions: line fitting including CI bands but for non-linear regression.
astral jasper
@worldly elm thank you mannnnn
worldly elm
hey guys, can someone please push me in the right directions: line fitting including CI bands but for non-linear regression.
@tough otter what function from seaborn are you using?
i think you can use the argument order for polynomials
 lone quartz
Hey,
I would like to be able to identify an opinion (positive, neutral, negative) according to subjects / themes from tweets in an unsupervised way. The goal is to build a base that will be refined by users to serve, in a second step, a supervised model.
I've thought about an architecture (attached; sorry for the handwritten side, the digital version is coming). I'd like to have your opinion: does it look interesting? How could I improve it? Will the result suck?
I find it hard to consider other applications than in the political field but I'm open to other ideas.
coral yoke
@lone quartz i guess i'm having a hard time following, are you not just wanting sentiment analysis?
lone quartz
I want to combine topic identification and sentiment analysis.
Example : "@politicalleader the new housing tax is unfair" will returns "housing/negative" (with polarity and subjectivity score).
I think using a thesaurus to identify topics will gives a pretty good result (in France, we have Rameau which is pretty complete) but I doubt about the performance of sentiment analysis on more complex tweet
coral yoke
just have a sentiment model with a topic model and use each's output?
the solutions exist
timber niche
soul
coral yoke
?
timber niche
i have engagements time stamps (unix format)
but i want to output stastics
to better understand the data
but the problem is with formating
any ideas?
coral yoke
example? what's the problem with formatting?
timber niche
i'm developing a twitter engagement prediction model
given a user and a tweet id what is the probability the user will engage with the tweet
timber niche
Honestly, I'm not sure how to go about it, I want for example to know the number of likes vs if there's a media
media (photo, gif, vid)
wait i'll show you something
As you can see the last 4, describes the engaging user "engagements timestamps"
if there's one so the user has seen the tweet and decided to engage with it
if the cell is empty it indictes the user has seen the tweet but didn't engage with it
coral yoke
@lone quartz if you need a shove in a direction, LDA model for topic modeling with gensim would be my first go-to. decent DNN with embeddings and bidirectional GRU/LSTM will do the sentiment analysis just fine
@timber niche that's a very interesting dataset btw, nice
timber niche
yea it's kind of a big project, but it's my first recommender system problem in this field, spent over 4 months investigating different methodologies to got about it.
But i understand the modeling theory, but not that much how to go about the dataset and preprocssing and stuff.
Also tried to build a baseline but failed to do so.
#_#
But i'll try my best, but my hope for now is to understand data better
 terse torrent
Is SQL key sensitive for commands like Insert, Create Table?
coral yoke
@terse torrent example?
cunning osprey
Hey guys,
Hopefully someone understands this. But I used fbprophet to model Covid19 cases, the model is pretty decent at forecasting worldwide cases given all the data we now have. But is there a way I can transform that to forecast peaks?
I'm assuming I can just take the predicted output and subtract it from the the previous day's output
frail horizon
what is the best way to calculate the percentage difference between two dataframes
tribal granite
anyone have experience with web crawlers?
coral yoke
@tribal granite yes, but just ask your question
@frail horizon are they the exact same dataframes?
tribal granite
any good resources on the dos and donts? Ive been looking at robots.txt for websites im interested in but theyre not particularly specific
Im building a crawler to scrape jobs and apply for em automatically
coral yoke
Lol honestly might not want to do that...
tribal granite
linkedin is off limits so ive been lookin at others
coral yoke
Also the general rule of thumb for nice people is, if the robots.txt didn't say it's allowed or denied just avoid it. The grey area is what says if it's not denied it's fair game
tribal granite
yeah thats kinda where im operating atm
like are there guidelines for how much scraping is too much?
is that dependent on the site?
any standards for that kinda thing or crawlers in general?
my instinct is that as long as it operates at human speed it should be fine
but dunno
coral yoke
Want my honest opinion? If it's not rate limited to my IP and they don't block it, I scrape away
If I have to use proxies or if I have to make a work around to scrape a lot I tend to stay away
Web scraping can easily fall into grey areas. It's really up to you how far you're willing to push to get what you want
terse torrent
@coral yoke sorry, for creating tables and inserting new data for INSERT statements and what not
frail horizon
@coral yoke what do you mean by exact dataframes, they're two different columns with the same data type
coral yoke
I was wondering if they're literally same columns with different data
Like two different reports or something
coral yoke
I'd imagine you could just apply some type of function to them
frail horizon
i'm not able to divide
coral yoke
What do you mean?
My approach would just be to put them into numpy arrays and do stats on them that way
frail horizon
df["p2]-df["p1]/df["p2"] gives me a fail
coral yoke
Try that but with the numpy versions of them
frail horizon
would that work if i'm reading the values from a csv
frail horizon
i'm sorry just confused i guess this will take a bit of googling
coral yoke
So just like
p1, p2 = df.p1.numpy(), df.p2.to_numpy()
And then do (p2 - p1) / p2
Right?
frail horizon
where would I put that line near, where i call the df files
coral yoke
After you make the df yeah
 lusty pagoda
start_date = datetime(2020,1,1)
end_date = datetime(2021,12,1)
matplotlib.rcParams['figure.figsize'] = [12,4]
Data_epal.plot(grid = True)
Data_epal[(start_date <= Data_epal.index) & (Data_epal.index <= end_date )].plot(grid = True)
'>=' not supported between instances of 'str' and 'datetime.datetime'
Error:'>=' not supported between instances of 'str' and 'datetime.datetime'
Any idea whats wrong in this code
 polar acorn
Well as the stack trace says you can't compare a 'str' and a 'datetime.datetime' and ask which is bigger. It appears Data_epal.index is not a datetime object and you would have to convert it before comparing.
agile anvil
I've been putting my statistics to work during the crisis to do forecasts. Python programmers may be interested in the code for this, which doesn't even begin to address the vast gulf between swab/PCR and serological tests, but I've returned to comfort with the fatality projection. I'm giving an online lightning talk on those topics this evening.... if you can't make it, the slides are at https://bit.ly/pycovid
 iron ginkgo
Hey guys
I've got this school assignment, we have a testing data for voices and faces (sound recordings and images)
Right now I am starting with the sound part module, I need to do a speaker recognition system
What algorithm/sources or methods would be the simplest with decent results?
 gritty solstice
Scenario:
There is a bustling town of n people. Unfortunately there isn't much to do other than talk to each other.
I want to be able to visualize directional interactions each person has with each other as well as frequency of the interaction over a supplied timeframe of x.
I found something close via networkx however I would like to be able to have an individual directional line for each direction the initiation occured. IE: person a initiates conversation with person b 12 times. Person b initiates conversation with person a 5 times. I'd like two distinguishable lines showing direction of initiation, as well as frequency. (Like a thicker line, color, or even text would work at minimum)
I'm really just looking for guidance on any particular tool kit, or chart type that can achieve this, as I'm trying to avoid writing my own system :(
Any suggestions greatly appreciated
And if this is the wrong channel I apologize
This is very similar to what I'm looking for, but I'm unsure if networkx is capable of producing this type of graph?
lusty pagoda
matplotlib.rcParams['figure.figsize'] = [12,4]
Data_Nepal.plot(grid = True)
start_date = datetime(2020,1,1)
end_date = datetime(2021,12,1)
Data_Nepal[(start_date <= datetime(Data_Nepal.index)) & ( datetime(Data_Nepal.index) <= end_date )].plot(grid = True)
TypeError: an integer is required (got type Index)
Anyone knows how to fix this code
??
gritty solstice
Guessing Data_Nepal.index references the index to a dataframe?
if so, try using pandas to_datetime method instead to convert it
@lusty pagoda
gritty solstice
whats the head of your index?
and datatype?
I think you may need to convert it to a DatetimeIndex instead
Data_Nepal.index = pd.DatetimeIndex(index)
I think
lusty pagoda
Date Confirmed
16928 2020-01-22 0.0
16929 2020-01-23 0.0
16930 2020-01-24 0.0
16931 2020-01-25 1.0
16932 2020-01-26 1.0
At first the data looked like this
then later i converted the date as index
You are correct @gritty solstice
Thanks for the help
now its working
🙂
So i saw that the Date was of generic object type
i converted it to datetime format
to do this i used the to_datetime() helper function
gritty solstice
Heck yea! Glad you got it working
 pastel slate
Hey guys, so I don't understand why both of the following pieces of code do the same thing and which one would be considered the "proper" way to write it:
df.groupby('key').agg(['min', np.median, 'max'])
&
df.groupby('key').agg([min, np.median, max])
for context, the dataframe is pretty simple
df = pd.DataFrame({'key': ['A', 'B', 'C', 'A', 'B', 'C'], 'data1': range(6), 'data2': rng.randint(0, 10, 6)}, columns = ['key', 'data1', 'data2'])
 bronze grove
Hey, i've got this code
        data = read("./data/growth.json")
        plt.close()
        bio = io.BytesIO()
        for n, v in data.items():
            try:
                dt = datetime.strptime(n, "%d/%m/%y")
            except Exception as e:
                await ctx.send(f"Unable to convert {n} to datetime. `{e}`")
                dt = datetime.now()
            plt.plot_date(dt, v)
        plt.xlabel("Date")
        plt.ylabel("Total servers")
        plt.savefig(bio, format="png")
However, running it raises
Traceback (most recent call last):
  File "/home/eek/.local/lib/python3.8/site-packages/discord/ext/commands/core.py", line 85, in wrapped
    ret = await coro(*args, **kwargs)
  File "/home/eek/bumprv2/cogs/outils.py", line 620, in graphdblgrowth
    plt.plot_date(datetime.strptime(n, "%d/%m/%y"), v)
  File "/usr/local/lib/python3.8/_strptime.py", line 568, in _strptime_datetime
    tt, fraction, gmtoff_fraction = _strptime(data_string, format)
  File "/usr/local/lib/python3.8/_strptime.py", line 352, in _strptime
    raise ValueError("unconverted data remains: %s" %
ValueError: unconverted data remains: 20
The data it is loading is
{
  "19/04/2020": 65,
  "20/04/2020": 64,
  "21/04/2020": 65,
  "22/04/2020": 67
}
Any explanation?
 silk acorn
Did you mean to do %Y @bronze grove
bronze grove
ah
 scarlet harness
hello guys
I have a plot with insane amount of data points
is there a way to show a trend instead of all the points?
because right now
- it's very slow
- it's not that informative due to the sheer amount of points
coral yoke
@scarlet harness what are you using to plot them? i'd highly suggest a different graph that isn't that as a start
coral yoke
👌
lapis sequoia
I have made a pytorch program to tune a pre trained resnet18 model with corona virus lung x-ray dataset. Please be free to comment about my notebook. https://www.kaggle.com/frozenwolf/coronahack-finetuning-resnet18-pytorch/notebook?scriptVersionId=32586751

Explore and run machine learning code with Kaggle Notebooks | Using data from multiple data sources
 dull turtle
i am making api(flask). i hav my model. i want to pass an image to model through api
dull turtle
solved this issue
 harsh pecan
can i ask doubt in here brother ?
i am having problem while getting api data into pandas table
dull turtle
what problem?
harsh pecan
import json
import pandas as pd
z = 'https://api.covid19api.com/summary'
data = pd.read_json(z, lines='true')
n = pd. json_normalize(data['Global'])
c = n. head(3)
print(c)
works_data = pd. json_normalize (data = 'Global' [0],
record_path = 'Countries',
meta = ['Country'])
t = works_data.head(3)
print(t)
TypeError: string indices must be integers
i am getting this error
anyone ?
dull turtle
on which line getting error?
harsh pecan
i willl post trackback just wait
Traceback (most recent call last):
  File "C:\Users\user\Documents\covid19.py", line 73, in <module>
    works_data = pd. json_normalize (data = 'Global' [0],
  File "C:\Users\user\AppData\Local\Programs\Python\Python38-32\lib\site-packages\pandas\io\json\_normalize.py", line 341, in _json_normalize
    _recursive_extract(data, record_path, {}, level=0)
  File "C:\Users\user\AppData\Local\Programs\Python\Python38-32\lib\site-packages\pandas\io\json\_normalize.py", line 313, in _recursive_extract
    recs = _pull_records(obj, path[0])
  File "C:\Users\user\AppData\Local\Programs\Python\Python38-32\lib\site-packages\pandas\io\json\_normalize.py", line 252, in _pull_records
    result = _pull_field(js, spec)
  File "C:\Users\user\AppData\Local\Programs\Python\Python38-32\lib\site-packages\pandas\io\json\_normalize.py", line 243, in _pull_field
    result = result[spec]
TypeError: string indices must be integers
what it contains z = 'https://api.covid19api.com/summary' ?
harsh pecan
it has world wide corona stats
we are trying to get that json data and make table using pandas
dull turtle
do this print(data)
harsh pecan
yah we did
but we only getting
0  {'NewConfirmed': 85357, 'TotalConfirmed': 2707...  ... 2020-04-24 13:54:19+00:00

[1 rows x 3 columns]
global status only and that too not in table format
dull turtle
Stack Overflow
I'm playing with both learning python and trying to get github issues into a readable form. Using the advice on How can I convert JSON to CSV? I came up with this:
import json
import csv
f=open('...
try this
lapis sequoia
Anyone know a library that can produce an image of a set of cells in an xlsx?
i.e. B1:D4
Using pandas rn but don't see it in the docs
 sand girder
You'll be able to do that with subsetting/slicing
Can use loc or iloc for subsetting specific rows
sand girder
Sorry no that was meant for @lapis sequoia
lapis sequoia
Sorry to be specific, like it takes what's effectively a screenshot of those cells
@sand girder
something like this
harsh pecan
anyone can help me with above issue?
lapis sequoia
Hi guys!
Many people ask me how I got into Machine Learning, so they can relate it to their life. I've recorded a video about it:
https://www.youtube.com/watch?v=aqDCcuzDcNM
I'll be really grateful, if you tell me whether you like it or such a format simply sucks 😉

JOIN our "We Help Each Other" FB Machine Learning group:
🔥 https://www.facebook.com/groups/572682106935067/ 🔥
❗️ Winners for the contest from the previous video will be announced in a week from now. Stay tuned! If you haven't watched it yet, check this out and join in the c...
 tacit spruce
can someone tell me why is there null values
df_new = df[df['alk_phosphate'].notnull()]
df_new = df[df['sgot'].notnull()]
df_new = df[df['albumin'].notnull()]
df_new = df[df['protime'].notnull()]
print('df after: (df_new)\n', df_new.isnull().sum())```if I do it one by one and print them each I get zero
but then I do them at once null values are slipping through
harsh pecan
Traceback (most recent call last):
  File "C:\Users\user\Documents\covid19.py", line 73, in <module>
    works_data = pd. json_normalize (data = 'Global' [0],
  File "C:\Users\user\AppData\Local\Programs\Python\Python38-32\lib\site-packages\pandas\io\json\_normalize.py", line 341, in _json_normalize
    _recursive_extract(data, record_path, {}, level=0)
  File "C:\Users\user\AppData\Local\Programs\Python\Python38-32\lib\site-packages\pandas\io\json\_normalize.py", line 313, in _recursive_extract
    recs = _pull_records(obj, path[0])
  File "C:\Users\user\AppData\Local\Programs\Python\Python38-32\lib\site-packages\pandas\io\json\_normalize.py", line 252, in _pull_records
    result = _pull_field(js, spec)
  File "C:\Users\user\AppData\Local\Programs\Python\Python38-32\lib\site-packages\pandas\io\json\_normalize.py", line 243, in _pull_field
    result = result[spec]
TypeError: string indices must be integers
@harsh pecan anyone ?
 oak furnace
Id say the issue is "string indices must be integers"
harsh pecan
how to solve it ?
i have program above
import json
import pandas as pd
z = 'https://api.covid19api.com/summary'
data = pd.read_json(z, lines='true')
n = pd. json_normalize(data['Global'])
c = n. head(3)
print(c)
works_data = pd. json_normalize (data = 'Global' [0],
record_path = 'Countries',
meta = ['Country'])
t = works_data.head(3)
print(t)
@oak furnace
vital sphinx
can someone tell me why is there null values
df_new = df[df['alk_phosphate'].notnull()]
df_new = df[df['sgot'].notnull()]
df_new = df[df['albumin'].notnull()]
df_new = df[df['protime'].notnull()]
print('df after: (df_new)\n', df_new.isnull().sum())```
@tacit spruce It might be because you're redefining df_new each time, so only the last assignment sticks
coral yoke
@tacit spruce yeah, just use dropna()?
 crisp totem
Hey ! I would like to recover the image in the image tag but it doesn't work... I've tried with this line of code but nothing appears... Can someone help me plz
test = parser.body.find(id="main").find(class_="container").find(class_="meteo-body").find(id="rightColumn")
coral yoke
what library are you using
also, just find the single element. no need to constantly perform find over and over
crisp totem
I use BeautifulSoup
lapis ice
Alright! I think I got tensorflow working on my virtual env
Now.. I have to figure what to do next 😄
 narrow olive
I've played around with bokeh with the notebook integration and was quite pleased with it. Coming from the pain of matplotlib it's a refreshing clear syntax
 hallow orbit
I've been making a "Markov Network" ai-ish thing to play a turn-based strategy game with pomegranate and the documentation said it had the option to use algorithms besides the Chow-Liu tree-building algorithm, such as "greedy" and "exact", but when I pass those in as an algorithm, it says it's an invalid choice. When I looked into the code on the github, it looked like the only code there was for the Chow-Liu tree, and the code for all the other algorithms was missing. Does anyone have experience here with pomegranate that can remember a version number with non-Chow_liu tree-building algorithms for a Markov Network?
 woeful hare
Does anyone use alteryx?
 wanton elk
yw
 modern canyon
Hello there folks, I was recently shortlisted for an internship and was given an assignment where I have to crawl news and information websites and predict the likelihood of virality of its articles. How do I go about executing this project? I have prior experience in Selenium, BeautifulSoup, Pandas, scikit-learn, etc., if that helps.
rustic igloo
Can someone tell me why i am getting all None values?
from tensorflow.keras.preprocessing.text import Tokenizer
token_num = 10000
oov_token = '<OOV>'
tokenizer = Tokenizer(num_words=token_num, filters='!"#$%&()*+,-./:;<=>?@[\]^_`{|}~\t\n', lower=True, split=' ', char_level=False, oov_token=oov_token)
print(tokenizer.get_config())
tokens = tokenizer.texts_to_sequences('Mary has a little lamb.')
print(tokens)
This is what I am getting
[[None], [None], [None], [None], [], [None], [None], [None], [], [None], [], [None], [None], [None], [None], [None], [None], [], [None], [None], [None], [None], []]
rustic igloo
i solved my own problem. Need to have fit_on_text first.
vast shale
guys i got 3 class that im trying to predict (multi class classification)
below is my output of my classification report
does that mean that my model is not predicting 1s at all?
 exotic pike
@vast shale Yup. You obviously have 185 instances of 1 in your test set. Do you have them in your training set ?
vast shale
@exotic pike thanks. indeed i have it
exotic pike
Alright, this looks like scikit-learn. What model are you using ?
exotic pike
Try running your model over your train dataset and see what you get
If you still dont get your model predicting 1s you know something is wrong with the training itself
vast shale
yep you are right, thanks for pointing me
exotic pike
👍
 trail hound
Hello all
I am writing my BA thesis on machine learning. Initially, the idea was to conduct an analysis of failed companies based on financial indicators.
As you know, you need to do some research in your BA thesis. Analysis of this data would guarantee just such an analysis.
Unfortunately, I cannot use the same data that has already been used in another study.
As I'm a beginner in the subject, I wanted to find some research that I can do using simple, ready-made algorithms using python 3 and the scikit-learn library. I am still working on a chapter on theory, although I have a month to go and I need to find an idea where I could apply these algorithms to pass my research in my BA thesis.
I know that databases are available on pages like kaggle. If you have any idea where I could use simple classifiers in the form of an examination certain event, I would be very grateful.
I am talking about classifiers such as: Logistic Regression, Support Vector Machine, Naive Bayes classifier, Decision Tree classifier, Random Forest Classification.
For all your help THANK YOU!.
 slim elm
any sqlite3 users?
rigid summit
@here can I pull one of you guys into the #help-carrot channel? I've got a XML to DataFrame question!
 echo tendon
does anyone know how I can output more lines from this frame or all the lines?
or what would be even better, all products with different names. because in the data set the products appear more often.
 sacred badge
Here is my roadmap for machine learning:
machine learning and data basics
machine learning algorithms
practice
deep learning with tenserflow, keras, pytorch etc
NLP
advanced neural networks
reinforcement learning
recommender system
computer vision
hard practice, projects and kaggle and more!!
This is a very long syllabus which I created to self study ml
does it cover all the topics that I need to learn enough for getting a junior ml job? I'm a beginner currently learning the required math for ml.
narrow olive
@echo tendon printing a dataframe in the notebook is just for a quick visual check. There is no point in displaying all 40k rows. Save it into a different format of your liking.
There is if course the option to change the truncation of the display
jolly briar
@echo tendon sample can be useful df.sample(5, random_state = 1) for example, if the top/tail of the dataframe aren't very representative